Policy Makers’ Perspectives on the Expansion of Renewable Energy Sources in Chile’s Electricity Auctions


1
Facultad de Ingeniería y Ciencias, Universidad Adolfo Ibañez, Avenida Diagonal Las Torres 2640, Peñalolén, Santiago 7941169, Chile
2
School of Government, Universidad Adolfo Ibañez, Avenida Diagonal Las Torres 2640, Peñalolén, Santiago 7941169, Chile
*
Author to whom correspondence should be addressed.
Energies 2019, 12(21), 4149; https://doi.org/10.3390/en12214149
Submission received: 8 October 2019
/
Revised: 24 October 2019
/
Accepted: 28 October 2019
/
Published: 30 October 2019
(This article belongs to the Special Issue Energy Demand and Prices)
Abstract
:Chile has become one of the first few countries where renewable sources compete directly with conventional generation in price-based auctions. Moreover, the results of energy auctions during the last few years show a remarkable transition from conventional fossil fuels to renewable energies. In fact, the energy auction in 2017, to provide energy to customers from distribution companies, achieved a massive expansion in renewable technology at one of the lowest prices in the world. These positive results prompted the question if such results were permanent or temporal due to factors with limited effects. In this regard, this paper studies the key factors that drove the significant rise of renewable technologies in Chilean energy auctions, obtaining valuable lessons for regulators, not only in Chile, but also in the region and the world. For this purpose, we considered a well-proven method based on a hybrid multicriteria decision-making model to examine and prioritize the main drivers of the expansion of renewables in auctions. The results showed that some specific characteristics of the auction design, particularly the hourly supply blocks, the lead time for project construction, and contract duration, were the most significant drivers for the expansion of renewables in energy auctions. Moreover, the results showed that, provided that the auction design accommodates for such drivers, solar energy ends up as the most attractive technology in the Chilean auctions. The research also shows the main findings are robust by the application of a probabilistic sensitivity analysis.
1. Introduction
As in many other countries, the short-term spot market in Chile does not provide stable cash flow for investment-intensive technologies such as solar and wind renewable energy projects. This is not only because some renewable energies have a high rate of intermittency and variability in the generation of electricity, but also because short-term markets tend to fluctuate significantly from season to season, from month to month, and even from hour to hour. Furthermore, other factors such as a growing inverse ratio of renewable energy dispatch to wholesale energy prices have begun to place stress on renewable energy investments. The energy market in Chile, like many other markets, has a design based on a spot price, where marginal price or market price is determined by the generator being dispatched with the highest marginal cost to meet demand [1]. Given that renewables have a very low or even zero marginal cost, when they reach a high penetration in the power system, the clearing price decreases significantly. This can be observed globally or locally, when conditions such as transmission congestion do not allow for the full dispatch of renewable energy sources, and the price drops in the congested area and rises in the rest. This effect may be exacerbated during a specific time of the day, for example, prices may go down during the day in areas with a high penetration of solar energy, and they may go up during the night when solar energy is not present [2]. In this example, solar generators do not benefit from these high prices, as they do not generate during nonsolar hours. For this reason, long-term power purchase agreements (PPAs) are considered a good counterpart to spot markets. PPAs help reduce the risks of investing in renewable generators while simultaneously fostering long-term generation in the system. In addition, PPAs play a crucial role in project financing, as many renewable energy projects in Chile without PPAs face major barriers in obtaining financing from commercial banks [3]. PPAs can be obtained through bilateral negotiations with nonregulated consumers and are based on free conditions that are mutually defined by the parties. Since 2005, Chile implemented energy auctions to achieve PPAs for distribution companies that serve regulated consumers. This was a significant change given that regulated customers accounted for the majority of consumers in 2016, representing 55% of the total electricity demand in Chile [4].
Over the last few years, renewable energies sources (RES) for electricity in Chile have achieved a significant expansion through energy auctions. The last auction was held in 2017 and resulted in RES being awarded the entire capacity auctioned off in contracts at an average price of $32.5 per MWh [5]. In comparison to all previous energy auctions, held between 2006 and 2016, this marked the lowest average price ever. In contrast, the highest average price was recorded in 2012 at $140 per MWh. This sharp drop in auction prices was driven by the massive entry of renewable technologies, demonstrating their competitiveness in Chile, and competing directly with conventional technologies in the auctions despite the fact they have not received any subsidies.
There is an ongoing public debate, including the regulator, about the role played by different drivers in the successful expansion of renewables in Chile over the last few years. For the regulator, interventions in the auction design have been the most critical factors, but for others, the expansion of renewables is due to technological advancements and market conditions. Thus, the main objective of this paper is to identify the most relevant drivers, from the policy-making perspective, that explains the growth of RES in Chilean auctions. The analysis offered herein helps to better understand the main elements that have enabled renewable technologies to gain ground in the auctions and provides policy guidance to other countries based on the case of Chile.
In many countries, energy auctions have become an effective procurement method for the expansion of RES. In fact, the number of countries using auctions to contract the RES capacity increased from five in 2005 to more than 67 in 2017, with a total capacity of 137 GW [6] with a relevant participation of developing countries [7]. In particular, many countries in South America have considerable experience designing and implementing energy auctions. As a result, the adoption of renewable energies in Chile, Brazil, Argentina, Uruguay, and Peru has been driven primarily by the implementation of energy auctions [6].
The attractiveness of renewable energy auctions mainly is due to its effectiveness for obtaining a targeted amount of renewable energy in a well-planned, transparent, and cost-efficient manner [7]. These positive aspects include design flexibility to meet specific objectives, transparency, ability to transmit effective price signals in the market, and to ensure greater certainty in procuring a targeted quantity. The different types and designs of the renewable energy auction schemes implemented across countries vary based on national energy objectives as well as the size and maturity of local renewable energy markets. The most common types include sealed-bid auctions, multiround descending-clock auctions, and hybrid models. Designing an auction scheme is always linked with the policy goals, and the most common one is to guarantee a competitive allocation of energy capacity. Besides, there are usually other policy goals, such as the local socioeconomic impact, regional distribution, and actor diversity, that are considered in practice.
Among the limited academic literature focused on auctions for RES support in South America, Azuela et al. [8] discussed the Brazilian experience with energy auctions in comparison to China and India, Moreno et al. [9] examined the lessons learned from Chilean and Brazilian auctions, Mastropietro et al. [10] reviewed the RES auction mechanisms applied in South America, and Rodilla et al. [11] modeled generation expansion using long-term energy auctions as appropriate economic incentives in the case of Colombia. In another study, Del Rio [12] examined several auction designs, including renewable auctions in Argentina, Chile, Uruguay, and Peru, analyzing the advantages and drawbacks of different design elements based different criteria for evaluation. When analyzing the academic literature, it may be concluded that most studies have focused on describing the auction processes providing some insight on specific design elements, usually by analyzing the auction implementation process, looking at specific factors such as auction capacity, institutional setting, support mechanisms, and coordination with other policies [13,14,15]. The present work goes beyond what previous authors have done by analyzing the relative importance of various drivers in the auction process, looking to assess all major components of the RES auction design from the policymakers’ perspective. This approach allows to better understand the key country-specific factors that have helped renewable technologies gain important ground in the auctions. This paper fills that gap by providing important lessons learned and policy guidance based on the Chilean case.
The paper uses a well-known and well-proven methodology based on a hybrid multicriteria decision-making model to examine and prioritize the main drivers of the expansion of RES in auctions. The drivers include various specific characteristics of the auction design, such as hourly supply blocks and contract duration, but also other drives such as technological advancements, attractive business conditions, and high renewable resource potential. The discussion of auctions as the main incentives for RES deployment is certainly an important issue given the fact that most nations now want to achieve higher shares of RES generation. Even though the decision criteria used in the study might be quite situation-specific to Chile, we believe that analyzing the relationship between energy auctions and policy elements used to generate an integrated energy policy is a valuable contribution to the literature and other emerging economies trying to implement auctions.
The remainder of this paper is organized as follows: Section 2 provides a brief discussion on the latest changes in the design and implementation of auctions and other complementary mechanisms in Chile. Section 3 outlines the research methodology, while Section 4 presents the results. Section 5 describes the sensitivity analysis, and finally, Section 6 offers conclusions.
2. Energy Auctions in Chile: Overview of the Latest Changes
The regulatory framework for the power sector in Chile was enacted in 1982. (General Law of Electric Services (Decreto con Fuerza de Ley 4)). It was one of the first deregulatory processes in the world to introduce an unbundled and privately owned electricity sector (Biblioteca del Congreso Nacional de Chile, 1982) [16]. The Chilean case thus became a standard reference for many countries involved in deregulation processes in electricity markets. The power sector functions under separate segments: generation, transmission, and distribution, and all investment decisions are private. After deregulation, a few changes have been introduced, including the introduction in 2005 of a competitive, nondiscriminatory auction mechanism with the goal of providing transparent market prices, reduce uncertainty for investors, and foster competition among new entrants and existing providers [17]. In terms of the mains actors involved, the Ministry of Energy, the National Energy Commission (CNE), and the distribution companies work closely together to implement the energy auctions. The Ministry of Energy is responsible for establishing the auction rules and the country’s energy policy. Auctions are carried out by the regulator (CNE), and the contacts are signed between the winning generators and the distribution companies as off-takers. The initial design of the energy auctions was aimed at providing supply security in the regulated distribution market, giving a higher level of autonomy to distribution companies. For this reason, distribution companies were responsible for forecasting their demand and organizing auctions to manage their energy contract portfolio [18]. The key features and stakeholders of the Chilean energy auctions are presented in detail in Table A1.
The results of the early auctions were deemed unsuccessful in terms of competition. The three main incumbent generation companies (Endesa, Colbún, and AES Gener) obtained over 90% of the energy awarded during this period, and prices increased significantly. Although the auctions did not discriminate against renewable source generators, these were forced out by some requirements of the bidding process. For example, all firms had to bid in all demand blocks, implying that would have to provide energy for 24 h a day. As a result, between 2005 and 2014, renewable energies accounted for only 4% of the energy awarded. The 2012 auctions are a good example of the outcomes during this period, where non-conventional renewable energies constituted only 2% of all contracts awarded, and the average price reached nearly $140/MWh, the highest ever recorded in Chile. The specific results of the Chilean auction process since its beginning are provided in Table A2.
As of 2014, the situation changed significantly as renewable energies were able to successfully participate in the auctions. There are mainly two reasons for this turnaround. On the one hand, the cost of some of these technologies decreased significantly, and this is especially true for solar and wind. On the other, the new auction design no longer required companies to bid on all of the hourly blocks. As a consequence, the number of participants in the auctions increased considerably. As can be seen in Figure 1, while only two generators participated in 2013, this number reached 18 in 2014, then rose to 38 in 2015, and finally jumped to 84 in 2016. In 2016, wind and solar photovoltaic (PV) projects accounted for a massive 52% of the energy awarded. As a result of more competition in the auctions, prices declined by 75% from the average price of $130/MWh in 2012 to $35/MWh in 2017. Additionally, solar PV technology set a record-low bid at $21.48/MWh, proving that it can compete directly with traditional technologies and without any subsidies.
Given the positive results obtained in the latest auctions, many stakeholders claim that the increase in competition and low prices are the result of the changes implemented in the auction design. However, during that same timeframe, many other variables also changed or improved in the market, which sheds some doubt upon these claims. For this reason, the following subsections review the main changes in the auction design and other support mechanisms in the market.
2.1. The Main Changes in the Auction Design
Between 2014 and 2015, the Chilean government implemented several changes to the auction design with the objective of allowing RES to be more competitive in the auctions [4,19] (Law 20805, enacted in 2015). The main reforms in the auction design after 2014 are presented in Table 1.
One of the important changes to the auction design was to extend contract duration from 15 to 20 years. The lead time for auction contracts awarded was also extended from 3 to 5 years. A contract lead time refers to the period granted for construction and administrative procedures and is measured between the date the auction winners are announced and the corresponding deadlines to start operations. Under the new scheme, the entire auction design, organization, and management process was transferred from the distribution companies (DisCos) to a centralized governmental entity: The National Energy Commission (CNE). The CNE then organizes a single tender process for contracting energy demand for all distribution companies across the country, which is normally scheduled at least five years before the start of the supply contract (prior to 2015, this lead time was three years).
As mentioned above, the 2014 auction established, for the first time ever, specific time blocks of energy in the auction volume. As a result, both continuous (base load generation) and hourly supply blocks (generation only at certain times of the day) may be considered to meet the total demand. There are also two other important changes in the design of recent auctions: a new indexation factor that considers the adjustment of contracts to the US Consumer Price Index (CPI), and a price revision mechanism where the price may be modified in the event of significant and unexpected legal, regulatory, or fiscal changes.
2.2. Other Support Mechanisms
Apart from changes in the auction design, there are many relevant complementary factors in the market that may promote RES in the Chilean auctions. The relevant factors considered are technological advances, attractive business conditions, attractive renewable resource potentials, new transmission laws, high energy prices, expectations on cross-border energy trade, simplification of public land use procedures for renewable projects, and the Renewable Portfolio Standard (RPS) law.
2.2.1. Technological Advances
Technological advances have been crucial in the deployment of renewable energy sources in a number of countries. Over a relatively short period of time, utility-scale solar PV and wind technologies have become cost-competitive with conventional generation technologies because of significant cost reductions [20].
2.2.2. Attractive Business Conditions
Economic stability in Chile is recognized as a key factor for large-scale investments in renewable energy. Chile is considered one of the most successful countries in South America because of its market-oriented policies, political and institutional stability, a stable and well-developed financial sector, success in attracting foreign direct investment (FDI) over the last few decades, robust legal framework, and private property rights. It is the only The Organization for Economic Co-operation and Development (OECD) member country from South America, and it has the highest GDP per capita in the region. International financial institutions have given Chile a high credit rating of A+ (stable) by Standard and Poor, A1 (stable) by Moody, and A (stable) by Fitch [21].
2.2.3. Attractive Renewable Resource Potential
The country’s abundant solar and wind energy sources play a crucial role in the auction bidding process. Chile has a long coastline with suitable conditions for wind-powered energy, and it is home to the driest desert in the world, the Atacama Desert [22].
2.2.4. Renewable Portfolio Standard (RPS)
For a number of reasons and objectives, the Chilean government has introduced different policies to promote non-conventional renewable energy technologies (excluding large hydro sources). The first important reform launched in 2008 with the passing of a renewable energy law (Law No. 20,257), which introduced a quota-based renewable portfolio standard. This law was modified in 2013 (Law 20,698, better known as “Law 20/25”), setting more ambitious targets [22]. In particular, an increasing percentage of the electricity sold by generators with an installed capacity of over 200 MW must come from Non-Conventional Renewable Energies (NCRE) sources. This percentage is scheduled to reach 20% by the year 2025.
2.2.5. New Transmission Law
With the objective of improving the electricity transmission system and addressing key transmission-related limitations, the enactment of a new transmission law (Law 20,936) was another important reform to promote renewables in the energy matrix [16]. The law is aimed at the unification of the Central Interconnected System (SIC) and the Northern Interconnected System (SING), in order to address the growing energy needs in central and northern Chile. Given that the large solar potential is based in the northern part of the country, integration of the two systems will allow solar energy to reach the central and southern parts of the country. Another important improvement introduced by this law is a change in toll payments, establishing single-access charges and the allocation of transmission system costs to end users.
2.2.6. High Energy Prices
Chile experienced a steady increase in electricity prices between 2007 and 2013 driven primarily by the variable international price of oil and the cost of importing LNG (liquified natural gas) sources from abroad. In 2008, generation prices in the spot market reached record levels at $300/MWh, contributing to optimistic revenue expectations for renewable investors in the market [4]. However, more recently, the massive entrance of renewable energies with zero variable cost, the limited growth in electricity demand, and the stabilization of global oil prices pushed energy prices down. In northern Chile, where solar energy is highly concentrated, spot prices reach zero most of the year. While that may be good for consumers, this is not the case for existing plants and developers trying to finance new plants. As spot prices become less attractive, generator willingness to participate in energy auctions increases.
2.2.7. Expectations on Cross-Border Energy Trade
The Chilean government recently launched an initiative to connect to the power grids of its neighboring countries, Peru and Argentina, to allow for cross-border energy trade [23]. Although the three countries have diverse and complementary energy resource endowments, today, Chile is only interconnected to Argentina, and current operations are very limited. Constructing cross-border transmission lines and establishing trade mechanisms could help to develop the high potential for renewable energy sources and yield several benefits such as reduction in prices, promotion of investment, greater reliability, and diversification of supply.
2.2.8. Simplification of Public Land Use Procedures for Renewable Projects
One of the barriers to the expansion of renewables has been obtaining rights of use for state-owned lands. Major obstacles include the lack of land registration and a geo-referenced map indicating current land ownerships and status [3]. In 2014, the Ministry of National Assets together with the Ministry of Energy established clear and transparent procedures for land registration and obtaining public land concessions to facilitate the growth of RES. A few years later, in 2017, new rules were adopted to reduce barriers over the use of public land for renewable energy projects, extending the maximum term of use from 30 to 35 years and the timeframe for building power plants to a maximum of 10 years. As of 2016, 70% of installed solar capacity in the country was located on public lands [24].
3. Methodology
The most common approaches applied for designing and evaluating energy policies are based on classic optimization models, guided mostly by technical and economic criteria, while the multifaceted nature of the problem has been usually ignored. For this reason, not only the direct costs but also the nonmonetary aspects need to be considered in the decision-making process for the purpose of developing energy polices. In order to address the difficulty of assessing the monetary value of non-monetary dimensions, multicriteria decision methods offer a better fit to deal with problems where the common assumptions of classical optimization models do not apply [25,26]. It provides decision makers the possibility of exploring different energy options according to their importance within a trade-off. Multicriteria decision-making methods is a branch of operations research models that is appropriate for addressing complex, multiobjective problems involving high uncertainty, conflicting objectives, different forms of data and information, and multiple interests and perspectives. According to Tsoutos et al. [27], the inclusion of different interests and objectives of multiple actors in the form of criteria and weighting factors is one key reason that justifies the use of multicriteria decision-making methods. In general, the solution of a multicriteria decision-making (MCDM) problem requires managerial and engineering-level knowledge, where the managerial level defines the goals and selects the final optimal alternative, and the engineering level performs the optimization procedure.
The selection of an appropriate multicriteria decision analysis (MCDA) tool is a challenging task, which mostly depends on the nature of the problem and the objectives established by the decision makers. Method suitability, validity, and user friendliness are considered the most important factors in the method selection. The most common MCDA tools in the literature are the following [27,28,29,30,31,32,33,34,35,36,37,38,39]: (i) the analytical hierarchy process (AHP), which uses pairwise comparisons to assess the decision-makers’ preferences; (ii) outranking methodologies such as the preference ranking organization method for enrichment evaluations (PROMETHEE); (iii) social multicriteria evaluation techniques, such as the novel approach for imprecise assessment and decision evaluations (NAIADE); (iv) solving multicriteria decision-making problems in an intuitionistic fuzzy environment such as Fuzzy; (v) solving decision problems with conflicting and incommensurable (different units) criteria such as VlseKriterijuska Optimizacija I Komoromisno Resenje (VIKOR) VIKOR; and (v) solving multicriteria group decision problems with uncertain, imprecise, or partially missing information such as the stochastic multicriteria acceptability analysis (SMAA) (see Table 2).
In order to evaluate and prioritize the key country-specific factors that have driven the expansion of renewable technologies in the Chilean energy auctions, we used a hybrid MCDM, based on the analytic hierarchy process (AHP) and the technique for order performance by similarity to ideal solution (TOPSIS) methods. The methodology was carried out using R programing language. The hybrid AHP-TOPSIS method is essentially a mix of the AHP and the TOPSIS methods. This is an integrated approach in which AHP was used during the first stage, and TOPSIS was implemented in the second stage. The AHP method is an effective tool to more reliably weight the value of each criterion by capturing both subjective and objective aspects of a decision [40]. Likewise, the TOPSIS method is a more sophisticated way to rank and prioritize alternatives based on their geometric distance from the positive-ideal and negative-ideal solutions [41]. An optimal candidate is the one closest to the positive ideal and farthest from the negative ideal. Both models are widely used in energy policy matters because of their simplicity, ease of computation, and flexibility. However, several authors have criticized the AHP because of potential ranking irregularities that can occur during its application [40]. For this reason, further analysis is always recommended to verify results. In this regard, the TOPSIS method is proposed as a complement to the AHP, since TOPSIS can offer a solid ranking of alternatives and provide consistent and reliable results.
3.1. AHP Method
The analytic hierarchy process (AHP) was first developed by Thomas Saaty [42] and later applied and adapted by many other authors. The AHP measures a preference weighting of each alternative decision by using pairwise comparisons. In this sense, it allows decision makers to define priorities and make the best decision. The AHP is modeled over the following three steps that describe the main hierarchy structure and its application in this research.
The first step is to construct the complex decision model that represents the hierarchy of objective, criteria, subcriteria, and the decision alternatives. The hierarchy tree has been described in Table 3. The decision objective in this research is placed at the top, which assess the main country-specific factors that led to the expansion of renewable energy technologies in Chile’s electricity auctions. The criteria and subcriteria come at the middle level, and alternatives have been placed at the bottom of the hierarchy [4,41,43]. The energy alternatives included in the model are solar, wind, biomass, geothermal, small hydro, and other RES technologies (wave, etc.). The assessment of renewable energy auctions in a single country depends on many factors, many of which are country-specific [44]. Based on what has been mentioned in the public discussion as the most important country-specific factors, this study considered two main criteria: the auction design and other support mechanisms. A total of 16 subcriteria were then selected, as described in Table 3, based on the literature review discussed in Section 2. To select the subcriteria, a preliminary list of country factors was tested in a small pilot study with experts in the field to establish the extent to which the factors found in the literature had an important impact on the growth of RES in Chilean energy auctions.
In the second step, a pairwise comparison is applied to determine the relative importance of the criteria, subcriteria, and alternatives to prioritize and rank them for decision-making purposes [43,45]. These comparisons are based on estimates given by experts [4]. The group of experts selected for the study consisted of the highest-ranking public figures in the Chilean Ministry of Energy, independent consultants with in-depth expertise on the Chilean energy sector, and scientists from energy research centers. A questionnaire was developed in order to conduct a survey of experts’ opinions regarding the importance of alternatives for each criterion. For this purpose, a pairwise comparison was applied to determine the relative importance of the criteria and subcriteria and then to prioritize and rank them for decision making. The function of the pairwise comparisons was rated on a nine-point scale and according to the eigenvector approach proposed by Saaty [22]. This measurement indicates the level of relative importance, from equal, moderate, strong, very strong, to extreme, by assigning scores of 1, 3, 5, 7, and 9, respectively. The intermediate values between two adjacent arguments were assigned a score of 2, 4, 6, and 8.
Given that the required input data are qualitative, the main drawback of AHP is that it arbitrarily depends upon the experts to provide the inputs with rational and reasonable weighting factors in the decision trees. For this reason, we worked very carefully on the input data, in particular by involving experts with enough knowledge to provide inputs that will be highly relevant to policymaking in Chile. In order to address this issue, the selection of the group of experts was filtered for those with a graduate degree and a minimum of 8 years of experience in Chilean energy policymaking.
As a part of the last step in the AHP model, the judgments for different levels of hierarchy are synthesized carefully to define the best alternate for a particular objective [36]. Besides, a consistency check is applied to guarantee that the criteria pairs created are statistically consistent [46]. If the consistency index (CI) is less than or equal to 10%, then the matrix is considered to have acceptable consistency. On the contrary, if the CI is greater than 10%, it is necessary to examine the possible cause [42].
3.2. TOPSIS Method
TOPSIS was introduced by Hwang and Yoon [47], and it generates the positive ideal solution when an optimal point is at the closest distance to the best proposition, and the negative ideal solution is at the farthest distance from the worst proposition. Given that TOPSIS requires data on the relative weighting of the different criteria, this method is frequently combined with other MCDM methods. In this case, the weights were first computed using the AHP. Then, the TOPSIS was implemented in the 5 main steps [41,48]. This includes constructing the normalized decision matrix, weighting the normalized matrix, finding the fictitious points for the positive ideal and the negative ideal, calculating the distance to the positive ideal and negative ideal, and finally making an optimal decision.
4. Results and Policy Discussion
The empirical results represent important evidence of the relative significance of each of the 16 driving factors (subcriteria) in the two categories (criteria) considered in the assessment of the expansion of renewable energies in the Chilean auctions. The main categories include the importance of the auction design scheme and other complementary and relevant support mechanisms. Thus, the results may provide useful guidelines regarding priorities in the policies considered by governments to promote renewable energy sources through auctions.
The weight and ranking of each criterion for the purpose of decision-making are presented in Table 4. The results showed that in the promotion of renewable energies through auctions, the specific auction design had the utmost importance. The relative weight of the auction design was 0.70 versus 0.30 for the other support mechanisms. The overall consistency in the pairwise comparison for the criteria was computed at around 0.05, which is below the critical value of 0.10. In addition, Table 4 shows the final weight of the main subcriteria based on their relative importance. The most significant factors were all related to changes/reforms to the auction design. The top three factors were “supply time blocks”, with the highest final weight of 0.18, followed by “longer contract duration” (0.13), and “longer lead time for project construction” (0.08). “Technological advances” was the highest weighted factor in the other support mechanisms category, with a final weight of 0.06 and coming in 5th in the overall ranking.
Besides, the empirical results also provided useful evidence of the most attractive renewable energy technologies in the auctions, as well as the strategic factors (subcriteria) that have played a key role in promoting these technologies in the auctions (Table 5 and Table 6). Among the five main renewable energy alternatives, solar and wind energies were the most attractive options, with the highest closeness coefficient (CC) values of 0.93 and 0.89, respectively (Table 6). The top three strategic factors (subcriteria) for solar technologies were “technological advances”, “supply time blocks”, and “attractive renewable resource potential”.
4.1. Supply Time Blocks
Establishing different supply blocks allows renewable project developers to supply at certain times of the day, which reduces production risks in the event of deviations from the contracted amount. All the energy contracted in the auctions is financial, and any variations from the contract must be settled in the electricity spot market. Given that renewable technologies, particularly solar power plants, have a variable generation profile, a continuous supply block (24 h supply) forces them to use the variable spot market during nighttime hours to fill shortages in their contractual obligations. The previous obligation to provide continuous energy supply implicitly penalized renewable technologies, exposing them to market risks. On the contrary, the new hourly supply blocks in the new auction structure has favored renewable technologies, particularly solar and wind technologies, since they may now bid on the specific hours when they are generating energy.
4.2. Longer Contract/PPA Duration
Contract duration is one of the key elements of auctions, as it provides some degree of certainty over the project’s stream of revenue, which further helps to obtain financing. This is especially important in countries where access to financing is limited for project developers, as they are obviously more affected by short-term contracts [45]. In general, a shorter contract duration is less restrictive for conventional plants, as they have a shorter payback period. The same is true for existing renewable energy plants since their fixed costs were already financed. Longer contract periods then level up the playing field for new entrants using renewable technologies. However, it is also important to consider that very long periods should also be avoided since they would lead to a higher consumer burden over time.
Given the wide variety of auction designs, the contract duration varies from country to country and, in many cases, even across technology. In Chile, the previous auction design established a contract duration of 15 years at a fixed price. Experience showed that this time span was usually shorter than the useful life of many renewable energy plants, thus increasing the risks associated with the cost of financing the project. Extending the length of contracts from 15 to 20 years in the current auction design helped reduce these concerns. In some countries, the contract duration is conditioned by the new projects’ bankability. For instance, in South America, Brazil and Peru apply the rule that the timeframe for access to financing should be considered in the contract duration [49]. In Uruguay, all project developers are granted long-term PPAs (20 year PPA) with the purpose of accommodating business risks and increasing the projects’ bankability. In other countries, macroeconomic risks such as inflation also affect contract duration. The Indian state of Uttar Pradesh established relatively shorter contract durations in order to overcome inflation risks.
4.3. Longer Lead Time for Project Construction
Lead time is another relevant element of the auction design. A technology-specific construction time and all administrative procedures must be carefully considered when defining the lead time for the construction of the project in order to ensure that the power plants are ready to operate before the contract begins. Even though the construction period for each type of renewable technology is fairly well-known, in practice, substantial administrative requirements depending on local regulations must be considered when defining the lead time. If the lead time is shorter than necessary, the risk of not meeting the contract deadlines obviously increases, which may result in penalties or even termination of the contract. On the other hand, granting long lead times might encourage speculative bidders—for example, those who are interested in the wait-and-see policy—to delay the beginning of construction in hopes of future cost reductions in the technology.
4.4. Solar—The Most Attractive Technology in the Chilean Energy Auctions
Over the last decade, the share held by solar technologies, mainly solar PV, in power systems has increased significantly as the main alternative to solve energy problems in many countries. A cumulative total installed capacity of solar PV rose at an extraordinary rate, reaching a capacity of nearly 402 GW in 2017. This is more than ten times the 40 GW installed globally in 2007. Within this context, auctions have become the main policy tool allowing solar technologies to expand around the world. In fact, the renewable energy capacity contracted through auctions accounted for 57.7 GW alone in 2017, with solar and wind technologies holding the largest share. The findings of this study showed that, in the case of Chile, the attractiveness of solar technologies in the auctions mainly was due to technological advances, changes in the auction design, particularly the introduction of new supply time blocks, and the attractive renewable resource potential in Chile.
The significant role played by technological advances is not surprising. In the case of solar technologies, this includes an unprecedented drop in the cost of equipment over the last decade, along with forecasted future cost reductions and better manufacturing efficiency. The technological advances drew solar panel prices down significantly from $4.15/W in 1996 to $0.37/W in 2017 [50]. The annual levelized cost of solar energy technologies, particularly utility-scale solar PV, has reduced significantly down to $40–46/MWh. At this cost level, solar PV is competitive with fossil fuels such as gas and coal in many locations.
Another important factor that greatly affected bidder decisions was the new auction design, namely the introduction of several time blocks matching the generation profile for solar technology. Considering that solar power plants can produce around 8 h a day, a specific supply block adjusted to its generation profile reduces its market risks.
The findings of the study also showed that bids using solar technologies in Chile have become progressively competitive because of low operating costs resulting from the high capacity factor in locations with some of the best solar resources in the world (the capacity factor is defined as the resource availability both in terms of quantity and quality over a period of time of application). Given that solar plant revenue is highly proportional to its generation (capacity factor), the capacity factor is one of the key features when determining bidding prices in an auction (International Renewable Energy Agency (IRENA)). Estimates by IRENA [44] illustrate that having a double capacity factor allows investors to lower the price per MWh significantly in the auction bids. Therefore, this factor gives Chile a highly advantageous position in this regard, considering that it has an average capacity factor of 29%, as opposed to Germany, for example, with a capacity factor of just 11%.
5. Sensitivity Analysis
A sensitivity analysis is applied to show the impact of changes in the model criteria on the output. The goal is to describe how sensitive the current ranking of alternatives is to variations in the current weights of the decision criteria. Given that the results depend on decision makers’ subjective perceptions in the integrated AHP-TOPSIS process, a sensitivity analysis can help construct proposed scenarios that generate more information for decision makers, allowing them to see how different conditions affect their decision-making without forcing them to change their original considerations.
In the literature, there are many studies on energy policy issues that apply sensitivity analyses. One recent study is by Masuda [51], who assessed the effect of variations in entire vectors of the decision matrix on the ranking of the alternatives. In another study, Armacost and Hosseini [52] recommended a procedure for defining the most critical criterion for a single-level hierarchy AHP problem. This study employed a probabilistic sensitivity analysis technique in order to determine the level of confidence in the output obtained, in connection with the variability of input parameters (criteria values). More specifically, the simulation was conducted under the assumption that variability is normally distributed with a known standard deviation and mean.
In order to perform this sensitivity analysis, the distribution of probabilities was first adjusted to each criterion and subcriterion used in the survey. Then, z-values were derived, and the new criteria values and different probabilities associated with each position were calculated. (Z values are a measure of how many standard deviations below or above the population mean a raw score is. They are a way to compare results from a test to a “normal” population). This analysis allows researchers to check how sensitive the initial results obtained from the TOPSIS method are to probabilistic variations in the parameters.
Table 7 and Table 8 shows the results of the sensitivity analysis for different α cutting levels, ranging from 0.1% to 50%. (α is an arbitrary value to do a sensitivity analysis of the criteria weights. For each α level, the model is run to determine the minimum and maximum possible values of the output). As seen below, solar energy held the first position in 85% of the cases and the second position in 15%. It was followed by wind power, which took first place in 15% of the cases and second place in 84.9%.
6. Conclusions
Electricity markets around the world are rapidly changing with the massive entrance of intermittent renewable energies. However, most of the current market designs have serious shortcomings in terms of providing long-term investment for the development of these energies. Within this context, auctions have become one of the most efficient policy instruments for allocating risks while at the same time encouraging competitive prices. In fact, the number of countries using auctions for contracting renewable energy capacity increased significantly over the last few years, to over 67 in 2017, with a total capacity of 137 GW.
Chile was one of the first few countries where renewable energies competed directly with conventional sources in price-based auctions. The latest auctions resulted in record-low prices and represented a significant expansion of renewable energies. This paper analyzed the main country-specific factors influencing the expansion of renewable technologies in Chilean auctions from the perspective of policy makers in the energy market. For this purpose, a hybrid MCDM based on an integrated AHP-TOPSIS method was used. A total of two criteria and 16 subcriteria thought to have potential influence on the outcomes were included in the decision model. The empirical results showed that the most significant factors with an important role in the expansion of renewable technologies were all related to changes/reforms in the auction design. The top three factors were “supply time blocks”, followed by “longer contract duration” and “longer lead time for project construction”. “Technological advances” was the highest weighted factor in the other support mechanisms category, taking fifth place in the general ranking. A sensitivity analysis supported the robustness of these results.
Analyzing the role of auctions as the main driver in the successful expansion of renewables in Chile is important given that many countries now strive to achieve higher shares of RES generation. There has been an extensive international debate about the role played by energy auctions in the context of various countries. Identifying and analyzing the relative importance of various drivers that have enabled renewable technologies to gain ground in the Chilean auctions provides important lessons and policy guidance to other countries.
Future research may extend the scope of this model by modifying the existing AHP-TOPSIS framework to incorporate the fuzzy set theory and address uncertainty in the decision makers’ judgments in cases of subjective and incomplete information. In addition, the scope of research can be further enhanced by including expert opinions not only from policy makers but also from diverse actors such as consultants, technical experts, and academics in the field of energy and the environment.
Author Contributions
S.N. and E.C. designed and performed the research and wrote the paper with results checking. They were responsible for analyzing and interpreting the data. C.A.A. and C.S. actively participated in the investigation, gave review suggestions, reviewed the literature, and reviewed entire paper. All authors read and approved the final manuscript.
Funding
This research was funded by CONICYT/FONDAP/15110019 (SERC-CHILE) and CONICYT/FONDECYT/ 11170424.
Conflicts of Interest
The authors declare no conflict of interest.
Acronyms
| MCDM | Multicriteria Decision Making |
| PPA | Power Purchase Agreement |
| RES | Renewable Energy Sources |
| CNE | Comisión Nacional de Energía |
| SIC | Interconnected Central System |
| SING | Northern Interconnected System |
| MCDA | Multicriteria decision analysis |
| AHP | Analytical Hierarchy Process |
| PROMETHEE | Preference Ranking Organization Method for Enrichment Evaluations |
| NAIADE | Novel Approach for Imprecise Assessment and Decision Evaluations |
| SMAA | Stochastic Multicriteria Acceptability Analysis |
| TOPSIS | Technique for Order Performance by Similarity to Ideal Solution |
| CC | Closeness Coefficient |
| IRENA | International Renewable Energy Agency |
Appendix A

Table A1.
Auction Design and Implementation in Chile.
| Design | Year of Implementation | 2006 |
| Single- or multiple-item auctions | Multiple-item auctions | |
| Auction procedure | Static | |
| Pricing rules | Pay-as-bid | |
| Price ceiling | Disclosed after the bidders’ submissions, but before the final publication of the winners | |
| Penalties | Contract termination, confiscation of bid bonds. (A bond around $12,000/GWh) | |
| Monitor | CNE | |
| Contract transferability | Yes | |
| Auction frequency | No specific schedule established | |
| Auction volume | Continuous and hourly supply blocks: Auction 2016: Total capacity—12,430 GWh, divided into 5 supply blocks: - Supply Block N1. Volume: 3080 GWh. Single continuous 24 h block - Supply Block N2-A. Volume: 680 GWh. Energy consumption only for 00:00–07:59 and 23:00–23:59. - Supply Block N2-B. Volume: 1000 GWh. Energy consumption only from 08:00 to 17:59. - Supply Block N2-C. Volume: 520 GWh. Energy consumption only from 18:00 to 22:59. - Supply Block N3. Volume: 7150 GWh. Single continuous 24 h block | |
| PPA duration | 20 years | |
| Lead time for project construction | 5 years | |
| Currency | USD, indexed | |
| Technology specification | Non-discriminatory | |
| Main qualification criteria | Reasonable credit rating Minimum risk rating of BB+ Insurance for damages of up to $3 million | |
| Implementation | Policy and auction guidelines | Ministry of Energy |
| Regulatory authority | CNE | |
| Procurer | CNE | |
| Off-takers | Distribution companies |
Table A2.
Auction Results in Chile.
| Auctions | Average Price ($/MWh) | Price Ceiling ($/MWh) | Auctioned Energy (GWh) | Awarded Energy (GWh) | Awarded Percentage |
|---|---|---|---|---|---|
| 2006/01 | 52.91 | 62.69 | 13,568 | 12,076 | 89% |
| 2006/01-2 | 54.55 | 62.69 | 1130 | 1130 | 100% |
| 2006/02 | 59.77 | 61.68 | 14,615 | 5700 | 39% |
| 2006/02-2 | 65.8 | 71.06 | 9000 | 1800 | 20% |
| 2008/01 | 104.31 | 125.16 | 8788 | 7821 | 89% |
| 2008/01-2 | 99.49 | 125.16 | 935 | 935 | 100% |
| 2010/01 | 90.3 | 92.04 | 2696 | 2200 | 82% |
| 2012/01 | 129.45 | 129.5 | 924 | 924 | 100% |
| 2012/01-2 | 138.9 | 140 | 1650 | 248 | 15% |
| 2013/01 | 128.93 | 129 | 5000 | 3900 | 78% |
| 2016/01 | 47.5 | - | 84,859 | 12,430 | 14% |
| 2017/01 | 32.5 | - | 20,700 | 2200 | 11% |
Source: Own elaboration based on data provided by the CNE [4].
References
- Munoz, D.F.; Wogrin, S.; Oren, S.S. Economic Inefficiencies of Cost-based Electricity Market Designs. Energy J. 2018, 39, 51–68. [Google Scholar] [CrossRef]
- Osorio, H.; Nasirov, S.; Agostini, C.A.; Silva, C. Assessing the economic viability of energy storage systems in the Chilean electricity system: An empirical analysis from arbitrage revenue perspectives. J. Renew. Sustain. Energy 2019, 11, 015901. [Google Scholar] [CrossRef]
- Nasirov, S.; Silva, C.; Agostini, C.A. Assessment of barriers; opportunities for renewable energy development in Chile. Energy Sources Part B Econ. Plan. Policy 2016, 11, 150–156. [Google Scholar] [CrossRef]
- National Energy Commission of Chile (CNE). Energy Statistical Yearbook Chile; CNE: Santiago, Chile, 2017.
- McCrone, A.; Moslener, U.; D′Estais, F.; Grünig, C. Global Trends in Renewable Energy Investment 2018; Frankfurt School-UNEP Centre/BNEF: Frankfurt, Germany, 2018. [Google Scholar]
- National Energy Commission (CNE). Valor de la Energía Más Bajo en la Historia de las Licitaciones en Chile. 2017. Available online: https://www.cne.cl/prensa/prensa-2017/11-noviembre-2017/valor-de-la-energia-mas-bajo-en-la-historia-de-las-licitaciones-en-chile/ (accessed on 10 March 2018).
- Kruger, W.; Eberhard, A.; Swartz, K. Renewable Energy Auctions: A Global Overview. In Management Programme in Infrastructure Reform; Regulation (MIR): Cape Town, South Africa, 2018. [Google Scholar]
- Elizondo Azuela, G.; Barroso, L.; Khanna, A.; Wang, X.; Wu, Y.; Cunha, G. Performance of Renewable Energy Auctions: Experience in Brazil, China, India (English); Policy Research Working Paper, No. WPS 7062; World Bank Group: Washington, DC, USA, 2014. [Google Scholar]
- Moreno, R.; Bezerra, B.; Barroso, L.; Mocarquer, S.; Rudnick, H. Auctioning Adequacy in South America through Long-Term Contracts and Options: From Classic Pay-as-Bid to Multi-Item Dynamic Auctions. In Proceedings of the IEEE Power Engineering Society 2009 General Meeting, Calgary, AB, Canada, 26–30 July 2009. [Google Scholar]
- Mastropietro, P.; Batlle, C.; Barroso, L.A.; Rodilla, P. Electricity auctions in South America: Towards convergence of system Adequacy; RES-E support. Renew. Sustain. Energy Rev. 2014, 40, 375–385. [Google Scholar] [CrossRef]
- Rodilla, P.; Batlle, C.; Salazar, J.; Sánchez, J.J. Modeling generation expansion in the context of a security of supply mechanism based on long-term auctions. Application to the Colombian Case. Energy Policy 2011, 39, 176–186. [Google Scholar] [CrossRef]
- Del Río, P. Designing auctions for renewable electricity support. Best practices from around the world. Energy Sustain. Dev. 2017, 41, 1–13. [Google Scholar] [CrossRef]
- Gephart, M.; Klessmann, C.; Wigand, F. Renewable energy auctions—When are they (cost)effective? Energy Environ. 2017, 28, 145–165. [Google Scholar]
- Scaling Solar: Making the Sun Work for Africa. Available online: http://www.energynet.co.uk/webfm_send/1260 (accessed on 25 October 2019).
- Lucas, H.; Del Rio, P.; Sokona, M.Y. Design; Assessment of Renewable Electricity Auctions in Sub-Saharan Africa. IDS Bull. 2017, 48, 79–100. [Google Scholar] [CrossRef]
- Biblioteca del Congreso Nacional de Chile: Santiago, Chile. Available online: https://www.bcn.cl (accessed on 25 October 2019).
- Nasirov, S.; Agostini, C.A.; Silva, C. Renewable energy transition: A market-driven solution for the energy; environmental concerns in Chile. Clean Technol. Environ. Policy 2018, 20, 3–12. [Google Scholar] [CrossRef]
- Moreno, R.; Barroso, L.A.; Rudnick, H.; Mocarquer, S.; Bezerra, B. Auction approaches of long-term contracts to ensure generation investment in electricity markets: Lessons from the Brazilian; Chilean experiences. Energy Policy 2010, 38, 5758–5769. [Google Scholar] [CrossRef]
- Del Río, P. Auctions for Renewable Energy in Chile: Instruments. In Lessons Learnt; Aures, Technical University of Denmark: Copenhagen, Denmark, 2017. [Google Scholar]
- Lazard’s Levelized Cost of Energy Analysis: Version 12.0. Available online: https://www.lazard.com/media/450784/lazards-levelized-cost-of-energy-version-120-vfinal.pdf (accessed on 25 October 2019).
- OECD. OECD Economic Surveys: Chile; OECD: Paris, France, 2018. [Google Scholar]
- Nasirov, S.; Silva, C. Diversification of Chilean energy matrix: Recent developments; challenges. IAEE Forum 2014, 4, 27–31. [Google Scholar]
- Agostini, C.A.; Guzmán, A.; Nasirov, S.; Silva., C. A surplus based framework for cross-border electricity trade in South America. Energy Policy 2019, 128, 673–684. [Google Scholar] [CrossRef]
- IEA. Energy Policies Beyond IEA Countries: Chile 2018; IEA: Paris, France, 2019. [Google Scholar]
- Nasirov, S.; Silva, C.; Agostini, C.A. Investors′ perspectives on barriers to the deployment of renewable energy sources in Chile. Energies 2015, 8, 3794–3814. [Google Scholar] [CrossRef]
- Biblioteca del Congreso Nacional de Chile. Available online: http://www.leychile.cl/Navegar?idNorma=1092695 (accessed on 25 October 2019).
- Maxim, A. Sustainability assessment of electricity generation technologies using weighted multi-criteria decision analysis. Energy Policy 2013, 65, 284–297. [Google Scholar] [CrossRef]
- Scott, J.A.; Ho, W.; Dey, P.K. A review of multi-criteria decision-making methods for bioenergy systems. Energy 2012, 42, 146–156. [Google Scholar] [CrossRef] [Green Version]
- Wu, Y.; Geng, S. Multi-criteria decision making on selection of solar-wind hybrid power station location: A case of China. Energy Convers. Manag. 2014, 81, 527–533. [Google Scholar]
- Chinese, D.; Nardin, G.; Saro, O. Multi-criteria analysis for the selection of space heating systems in an industrial building. Energy 2011, 36, 556–565. [Google Scholar] [CrossRef]
- Peterseim, J.H.; White, S.; Tadros, A.; Hellwig, U. Concentrated solar power hybrid plants, which technologies are best suited for hybridisation? Renew. Energy 2013, 57, 520–532. [Google Scholar] [CrossRef]
- Vučijak, B.; Kupusović, T.; Midžić-Kurtagić, S.; Ćerić, A. Applicability of multicriteria decision aid to sustainable hydropower. Appl. Energy 2013, 101, 261–267. [Google Scholar] [CrossRef]
- Klein, S.J.W.; Whalley, S. Comparing the sustainability of U.S. electricity options through multi-criteria decision analysis. Energy Policy 2015, 79, 127–149. [Google Scholar] [CrossRef]
- Brand, B.; Missaoui, R. Multi-criteria analysis of electricity generation mix scenarios in Tunisia. Renew. Sustain. Energy Rev. 2014, 39, 251–261. [Google Scholar] [CrossRef] [Green Version]
- Shmelev, S.; Bergh, J. Optimal diversity of renewable energy alternatives under multiple criteria: An application to the UK. Renew. Sustain. Energy Rev. 2016, 60, 679–691. [Google Scholar] [CrossRef]
- Ribeiro, F.; Ferreira, P.; Araújo, M. Evaluating future scenarios for the power generation sector using a Multi-Criteria Decision Analysis (MCDA) tool: The Portuguese case. Energy 2013, 52, 126–136. [Google Scholar] [CrossRef] [Green Version]
- Rahman, M.; Paatero, J.V.; Lahdelma, R.; Wahid, M.A. Multicriteria-based decision aiding technique for assessing energy policy elements-demonstration to a case in Bangladesh. Appl. Energy 2016, 164, 237–244. [Google Scholar] [CrossRef]
- Streimikienea, D.; Balezentis, T. Multi-objective ranking of climate change mitigation policies; measures in Lithuania. Renew. Sustain. Energy Rev. 2013, 18, 144–153. [Google Scholar] [CrossRef]
- San Cristóbal, J.R. Multi-criteria decision-making in the selection of a renewable energy project in spain: The Vikor method. Renew Energy 2011, 36, 498–502. [Google Scholar] [CrossRef]
- Nasirov, S.; Agostini, C.A.; Carlos, S. An assessment of the implementation of renewable energy sources in the light of concerns over Chilean policy objectives. Energy Sources Part B Econ. Plan. Policy 2016, 12, 715–721. [Google Scholar] [CrossRef]
- Sengül, U.; Eren, M.; Shiraz, S.; Volkan, G.; Sengül, A. Fuzzy TOPSIS method for ranking renewable energy supply systems in Turkey. Renew. Energy 2015, 75, 617–625. [Google Scholar] [CrossRef]
- Saaty, T.L. The Analytic Hierarchy Process; McGraw-Hill: New York, NY, USA, 1980. [Google Scholar]
- Kafait, U.; Salman, H.; Mirza, F.M.; Usman, S. Prioritizing the gaseous alternatives for the road transport sector of Pakistan: A multi criteria decision making analysis. Energy 2018, 165, 1072–1084. [Google Scholar]
- IRENA. Renewable Energy Auctions Analysing; International Renewable Energy Agency: Abu Dhabi, UAE, 2018. [Google Scholar]
- Del Rio, P.; Linares, P. Back to the future? Rethinking auctions for renewable electricity support. Renew. Sustain. Energy Rev. 2014, 35, 42–56. [Google Scholar] [CrossRef] [Green Version]
- Talib, F.; Rahman, Z.; Qureshi, M.N. Pareto analysis of total quality management factors critical to success for service industries. Int. J. Qual. Res. 2010, 4, 155–168. [Google Scholar]
- Hwang, C.L.; Yoon, K. Multiple Attribute Decision Making: Methods Applications; Springer: New York, NY, USA, 1981. [Google Scholar]
- Sindhu, S.; Nehra, V.; Luthra, S. Investigation of feasibility study of solar farms deployment using hybrid AHP-TOPSIS analysis: Case study of India. Renew. Sustain. Energy Rev. 2017, 73, 496–511. [Google Scholar] [CrossRef]
- Del Río, P.; Haufe, M.; Wigan, F.; Steinhilber, S. Overview of Design Elements for RES-E Auctions; Report D2; Aures, Technical University of Denmark: Copenhagen, Denmark, 2015; Volume 2. [Google Scholar]
- Renewable Energy Policy Network for the 21st Century. Available online: https://www.greengrowthknowledge.org/resource/renewables-2018-global-status-report (accessed on 25 October 2019).
- Masuda, T. Hierarchical sensitivity analysis of the priorities used in Analytic Hierarchy Process. Syst. Sci. 1990, 21, 415–427. [Google Scholar] [CrossRef]
- Armacost, R.L.; Hosseini, J.C. Identification of determinant attributes using the analytic hierarchy process. J. Acad. Mark. Sci. 1994, 22, 383–392. [Google Scholar] [CrossRef]
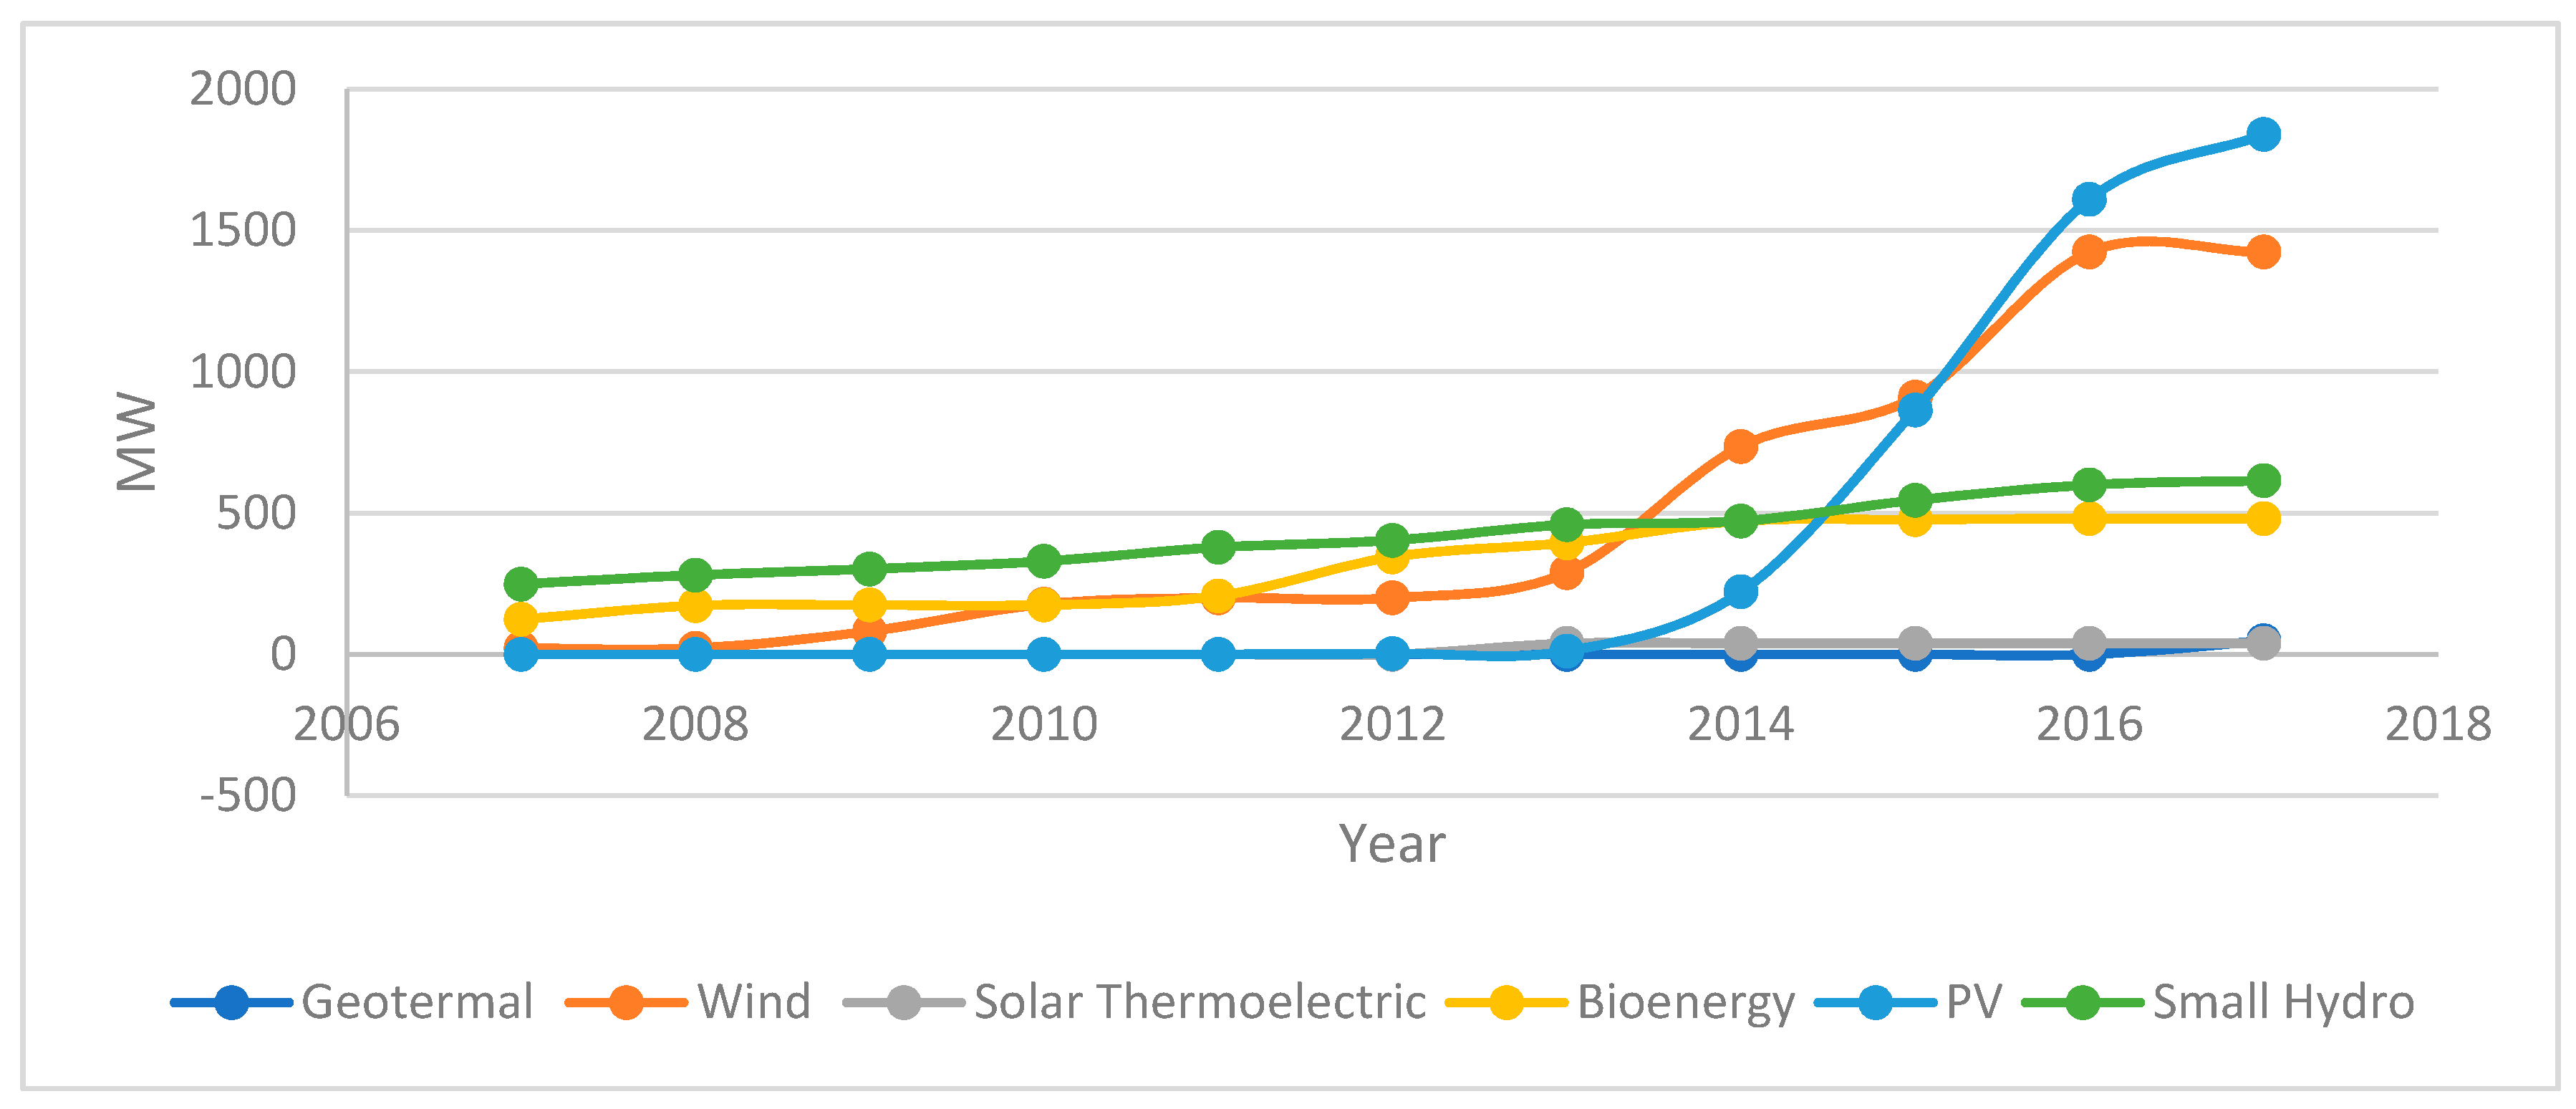
Figure 1.
Share of renewable energies in auctions. Source: Own elaboration based on data provided by the National Energy Commission (CNE) [4].
Figure 1.
Share of renewable energies in auctions. Source: Own elaboration based on data provided by the National Energy Commission (CNE) [4].

Table 1.
Main Changes to the Auction Design in Chile.
| Design Elements | Previous | Current |
|---|---|---|
| Longer Contract Duration (DC) | 15 years | 20 years |
| Lead Time for Project Construction (LT) | 3 years | 5 years |
| Price Revision Mechanism (PR) | No | Yes |
| Auction Management (MA) | Distribution Companies | National Energy Commission (CNE) |
| Possibility to Postpone/Abandon and Transfer the Contract (PT) | No | Yes |
| Supply Time Blocks (TB) | Single 24 h block | Several block and subblock schedules |
| Price Ceiling (CP) | Public | Secret |
| Contract Indexation (IF) | No | Contracts are in USD and indexed to inflation |
Table 2.
Examples of Multi-Criteria Analysis Methods.
| Reference | Multicriteria Decision Analysis (MCDA) Method | Assessment Technologies | Case Study |
|---|---|---|---|
| Lee et al. [29] | Analytical hierarchy process (AHP) | Wind technology | China |
| Cutz et al. [30] | Fuzzy sets | Biomass technology | Central America |
| Kaya and Kahraman [31] | VlseKriterijuska Optimizacija I Komoromisno Resenje (VIKOR)/AHP | Wind technology | Turkey |
| Rahman et al. [32] | Stochastic multicriteria acceptability analysis (SMAA) | Renewables and fossil fuel technologies | Bangladesh |
| Chatzimouratidis and Pilavachi [33] | AHP | Renewable energy power plants | General application |
| Amer and Daim, [34] | AHP | Wind energy, solar photovoltaic, solar thermal, and biomass technologies | Pakistan |
| Mourmouris and Potolias [35] | Preference ranking organization method for enrichment evaluations (PROMETHEE) | Wind, solar, biomass, geothermal, and small hydro technologies | Greece |
| Brownea et al. [36] | Novel approach for imprecise assessment and decision evaluations (NAIADE) | Energy policy measures or scenarios | Ireland |
| Ahmad and Tahar [37] | AHP | Hydropower, solar, wind, biomass | Malaysia |
| Ribeiro et al. [38] | MCDA | Different scenarios | Portugal |
| Klein and Whalley [39] | MCDA | Renewable and nonrenewable options | USA |
Table 3.
Structure of the Decision Model. Sources: Own elaborations.
| Objective | Assessment of the Key Country-Specific Factors Driving the Expansion of Renewable Technologies in the Chilean Energy Auctions | |||
|---|---|---|---|---|
| - | Criteria | Code | Criteria | Code |
| - | The Auction Design | - | Other Key Support Mechanism | - |
| Subcriteria: | - | Subcriteria: | - | |
| 1. Longer Contract Duration | DC | 9. Technological Advances | TA | |
| 2. More Lead Time for Project Construction | LT | 10. Attractive Business Conditions | BC | |
| 3. Price Revision Mechanism | PR | 11. Attractive Renewable Resource Potential | RP | |
| 4. Auction Management | MA | 12. Renewable Portfolio Standard | SP | |
| 5. Possibility to Postpone/Abandon and Transfer the Contract | PT | 13. New Transmission Law | TL | |
| 6. Supply Time Blocks | TB | 14. High Energy Prices | EP | |
| 7. More Flexible and Secret Price Ceiling | CP | 15. Expectations on Cross-Border Energy Trade | ET | |
| 8. New Indexation Factor | IF | 16. Simplification of Public Land Use Procedures for Renewable Projects | PL | |
| Alternatives | Solar; Wind; Small Hydro; Biomass; Geothermal; Other RES | |||
Table 4.
Weighting and ranking of the main drivers (Source: Own elaboration).
| Main Criteria | Criteria Weight | Subcriteria | Ratio Weight | Final Weight | Rank |
|---|---|---|---|---|---|
| The auction design | 0.70 | Longer Contract Duration | 0.1853945 | 0.12977617 | 2 |
| Longer Lead Time for Project Construction | 0.1245885 | 0.08721201 | 3 | ||
| Price Revision Mechanism | 0.0624172 | 0.04369204 | 9 | ||
| Auction Management | 0.0827399 | 0.05791793 | 6 | ||
| Possibility to Postpone/Transfer the Contract | 0.0827399 | 0.05791793 | 4 | ||
| Supply Time Blocks | 0.2609922 | 0.18269459 | 1 | ||
| More Flexible and Secret Price Ceiling | 0.0544995 | 0.03814967 | 11 | ||
| New Indexation Factor | 0.0510702 | 0.03574916 | 12 | ||
| Other key support mechanisms | 0.30 | Technological Advances | 0.2053501 | 0.06160505 | 5 |
| Attractive Business Conditions | 0.1359328 | 0.04077985 | 10 | ||
| Attractive Renewable Resource Potential | 0.1917980 | 0.05753941 | 7 | ||
| Renewable Standard Portfolio | 0.0977002 | 0.02931008 | 14 | ||
| New Transmission Law | 0.1670083 | 0.05010251 | 8 | ||
| High Energy Prices | 0.1111565 | 0.03334696 | 13 | ||
| Simplification of Public Land Use Procedures for Renewable Projects | 0.0544740 | 0.01634223 | 15 | ||
| Expectations on Cross-Border Energy Trade | 0.0365797 | 0.01097391 | 16 |
Table 5.
The ranking of the most attractive technologies in the Chilean auctions (Source: own elaboration).
Table 5.
The ranking of the most attractive technologies in the Chilean auctions (Source: own elaboration).
| Technology | Distance to Positive Ideal | Distance to the Negative Ideal | Optimal Decision | Rank |
|---|---|---|---|---|
| Solar | 0.00481484 | 0.06561958 | 0.93164082 | 1 |
| Wind | 0.00759228 | 0.06081565 | 0.88901463 | 2 |
| Mini hydro | 0.04861624 | 0.02504172 | 0.33997301 | 3 |
| Biomass | 0.06004601 | 0.00990277 | 0.14157166 | 5 |
| Geothermal | 0.06132694 | 0.02305928 | 0.27325884 | 4 |
| Other renewable energy sources (RESs) | 0.06399829 | 0.00359921 | 0.05324466 | 6 |
Table 6.
Ranking of Strategic Factors for each technology (Source: Own elaboration).
| Technology | 1st | 2nd | 3rd |
|---|---|---|---|
| Solar | Technological Advances | Supply Time Blocks | Attractive Renewable Resource Potential |
| Wind | Supply Time Blocks | Technological Advances | Attractive Business Conditions |
| Mini hydro | Renewable Portfolio Standard | High Energy Prices | Auction Management |
| Biomass | Longer Lead Time for Project Construction | Expectations on Cross-Border Energy Trade | Attractive Business Conditions |
| Geothermal | Longer Lead Time for Project Construction | Longer Contract Duration | Expectations on Cross-Border Energy Trade |
| Other RES | Price Revision Mechanism | Attractive Business Conditions | Possibility to Postpone and Transfer the Contract |
Table 7.
The results of the sensitivity analysis (Source: Own elaboration).
| α | Probability | Z Value | 1 | 2 | 3 | 4 | 5 | 6 |
|---|---|---|---|---|---|---|---|---|
| 50% | 50% | 0 | SOLAR | WIND | MINI HYDRO | GEOTHERMAL | BIOMASS | OTHER RES |
| 45% | 55% | 0.125661 | SOLAR | WIND | MINI HYDRO | GEOTHERMAL | BIOMASS | OTHER RES |
| 40% | 60% | 0.253347 | SOLAR | WIND | MINI HYDRO | GEOTHERMAL | BIOMASS | OTHER RES |
| 35% | 65% | 0.385320 | SOLAR | WIND | MINI HYDRO | GEOTHERMAL | BIOMASS | OTHER RES |
| 30% | 70% | 0.524400 | SOLAR | WIND | MINI HYDRO | GEOTHERMAL | BIOMASS | OTHER RES |
| 25% | 75% | 0.674489 | SOLAR | WIND | GEOTHERMAL | MINI HYDRO | BIOMASS | OTHER RES |
| 20% | 80% | 0.841621 | SOLAR | WIND | GEOTHERMAL | MINI HYDRO | OTHER RES | BIOMASS |
| 15% | 85% | 1.036433 | WIND | SOLAR | GEOTHERMAL | MINI HYDRO | OTHER RES | BIOMASS |
| 10% | 90% | 1.281552 | WIND | SOLAR | GEOTHERMAL | MINI HYDRO | OTHER RES | BIOMASS |
| 5% | 95% | 1.644854 | WIND | SOLAR | GEOTHERMAL | OTHER RES | MINI HYDRO | BIOMASS |
| 4% | 96% | 1.750686 | WIND | SOLAR | GEOTHERMAL | OTHER RES | MINI HYDRO | BIOMASS |
| 3% | 97% | 1.880794 | WIND | SOLAR | GEOTHERMAL | OTHER RES | BIOMASS | MINI HYDRO |
| 2% | 98% | 2.053749 | WIND | SOLAR | GEOTHERMAL | OTHER RES | BIOMASS | MINI HYDRO |
| 1% | 99% | 2.326348 | WIND | SOLAR | GEOTHERMAL | OTHER RES | BIOMASS | MINI HYDRO |
| 0.1% | 99.90% | 3.090232 | WIND | SOLAR | OTHER RES | GEOTHERMAL | BIOMASS | MINI HYDRO |
Table 8.
The results of the sensitivity analysis (Source: Own elaboration).
| α | Probability | Z value | 1 | 2 | 3 | 4 | 5 | 6 |
|---|---|---|---|---|---|---|---|---|
| 50% | 50% | 0 | SOLAR | WIND | MINI HYDRO | GEOTHERMAL | BIOMASS | OTHER RES |
| 45% | 45% | −0.125661 | SOLAR | WIND | MINI HYDRO | GEOTHERMAL | BIOMASS | OTHER RES |
| 40% | 40% | −0.253347 | SOLAR | WIND | MINI HYDRO | GEOTHERMAL | BIOMASS | OTHER RES |
| 35% | 35% | −0.385320 | SOLAR | WIND | MINI HYDRO | GEOTHERMAL | BIOMASS | OTHER RES |
| 30% | 30% | −0.524400 | SOLAR | WIND | MINI HYDRO | GEOTHERMAL | BIOMASS | OTHER RES |
| 25% | 25% | −0.674489 | SOLAR | WIND | MINI HYDRO | GEOTHERMAL | BIOMASS | OTHER RES |
| 20% | 20% | −0.841621 | SOLAR | WIND | MINI HYDRO | GEOTHERMAL | BIOMASS | OTHER RES |
| 15% | 15% | −1.036433 | SOLAR | WIND | MINI HYDRO | GEOTHERMAL | BIOMASS | OTHER RES |
| 10% | 10% | −1.281552 | SOLAR | WIND | MINI HYDRO | GEOTHERMAL | - | - |
| 5% | 5% | −1.644854 | SOLAR | WIND | MINI HYDRO | - | - | - |
| 4% | 4% | −1.750686 | SOLAR | WIND | MINI HYDRO | - | - | - |
| 3% | 3% | −1.880794 | SOLAR | WIND | MINI HYDRO | - | - | - |
| 2% | 2% | −2.053749 | SOLAR | WIND | MINI HYDRO | - | - | - |
| 1% | 1% | −2.326348 | SOLAR | WIND | MINI HYDRO | - | - | - |
| 0.1% | 0.1% | −3.090232 | SOLAR | MINI HYDRO | WIND | - | - | - |
© 2019 by the authors. Licensee MDPI, Basel, Switzerland. This article is an open access article distributed under the terms and conditions of the Creative Commons Attribution (CC BY) license (http://creativecommons.org/licenses/by/4.0/).
Share and Cite
MDPI and ACS Style
Nasirov, S.; Cruz, E.; Agostini, C.A.; Silva, C. Policy Makers’ Perspectives on the Expansion of Renewable Energy Sources in Chile’s Electricity Auctions. Energies 2019, 12, 4149. https://doi.org/10.3390/en12214149
AMA Style
Nasirov S, Cruz E, Agostini CA, Silva C. Policy Makers’ Perspectives on the Expansion of Renewable Energy Sources in Chile’s Electricity Auctions. Energies. 2019; 12(21):4149. https://doi.org/10.3390/en12214149
Chicago/Turabian StyleNasirov, Shahriyar, Eugenio Cruz, Claudio A. Agostini, and Carlos Silva. 2019. "Policy Makers’ Perspectives on the Expansion of Renewable Energy Sources in Chile’s Electricity Auctions" Energies 12, no. 21: 4149. https://doi.org/10.3390/en12214149
Note that from the first issue of 2016, this journal uses article numbers instead of page numbers. See further details here.