1. Introduction
Chile has experienced sustainable economic growth for more than 20 years, and it has become one of the most stable and prosperous nations of South America. The Global Competitiveness Report for 2012–2013 ranks Chile among the most competitive countries in the world and the first in South America, with a global ranking of 33rd place, well above Brazil (48th), Colombia (69th) and Argentina (96th) [
1]. The expansion of the economy and the significant improvement in the quality of life of Chile’s population have almost tripled electricity demand. This places Chile as the country with the highest consumption per capita in Latin America at 3568 kWh, well ahead of larger countries like Argentina (2967 kWh), Brazil (2438 kWh) and Colombia (1123 kWh) [
2]. Consequently, the installed electricity capacity in Chile has increased almost fourfold, reaching 18,500 MW in 2013 from the capacity of 4400 MW in 1990. As the economy continues to grow, it is expected that the electricity demand will increase. To sustain this growth, the country will have to add over 8000 MW of new generation capacity by 2020 in order to meet the expected demand [
3].
Chile relies mainly on conventional energy sources to produce electricity: 94% of the electricity generated in Chile is derived from fossil fuels and large hydro schemes with shares of 60% and 34%, respectively. The remaining 6% is obtained from renewable sources [
3]. However, a growing economy with an increasing demand for energy aggravates this dependence from external sources to supply the primary energy needs. In fact, the country had a level of energy self-sufficiency of over 65% in 1990, mostly using hydroelectricity, which is a local, abundant and clean resource in southern Chile [
4]. The rest was accounted mainly by coal and oil. Regrettably, as of today, Chile’s self-sufficiency has deteriorated to between 30% and 35% [
5]. Accordingly, residential electricity tariffs increased significantly from 0.041 USD/(kWh) in 1990, to 0.16 USD/(kWh) in 2013 [
2].
Transmission constraints are further hampering the ability to provide sufficient quantities of electricity for demand expansion in Chile. The Chilean transmission system is one of the longest and most complex in the world. Due to its particular geographic situation, the power supply consists primarily of two separate electricity grids, SING and SIC. The northern grid, SING, has a thermal-based generation and provides primary electricity demands for mining and mineral industries in northern Chile. The central grid, SIC, has hydro-thermal generation and covers the central and southern regions of the country, mainly Metropolitan Santiago. Transmission problems can be solved either by building more transmission lines or by siting more generation in areas with transmission constraints. Both options attempt to match electricity supply with demand. The generation of electricity is a capital and energy-intensive process that needs to be carefully planned and executed over time.
Electricity generation in Chile is, however, also the primary source of air pollution and greenhouse gas emissions. Although Chile is a minor contributor to global CO
2 emissions (0.2%), its upward trend (a 110% increase between 1990 and 2011) presents huge concerns [
2]. Alternatives to fossil fuels should be examined at the same time as potential greenhouse gas emissions targets are addressed. Due to the growing energy demand, increasing dependence on imported energy sources, environmental concerns, and rising costs of fossil fuel, the Chilean government considers it of strategic interest to implement energy diversification. To advance in this matter, however, the government has to decide which energy sources and technologies need to be prioritized to provide energy security and environmentally sustainability at a competitive cost.
Among the energy diversification options, the development of PV solar energy in Chile is particularly attractive as the country is endowed with one of the most consistently high solar potentials in the world [
6,
7]. The Atacama Desert, in northern Chile, offers the best conditions for generating PV solar energy with the highest solar radiation in the world, low humidity and almost 356 days of clear skies [
8]. The Chilean government recognizes local opportunities for solar development considering benefits of residential PV solar systems addressing energy concerns in the country. Historically, electricity laws in Chile failed to address the prospect of residential level generation. However, the approval of Law 20,571 in 2013 was the first step in designing a new policy in the residential sector, aimed at enabling small-scale distributed generation in the country, especially PV, micro-hydro and micro-CHP [
9]. The law came into force the first week of October 2014, allowing households and businesses that install a PV system up to 100 kW for self-consumption to sell the system’s excess output to the national grid at a fixed tariff.
This paper focuses on residential solar PV, which has recently begun to generate electricity in the Chilean market. Residential PV can reduce transmission losses and seasonal electricity supply shortages. Additionally, there is a complementary nature of PV and hydro generation (sunshine vs. rain) that can encourage users to avoid peak hours in Chile. In this study, we examine the economic effectiveness of residential PV investment per kWh produced by a standard house vs. the price of the electricity tariffs in the most densely populated region of Chile: Metropolitan Santiago. Due to a high level of dust concentration typically associated with PM10, we also analyze the dust deposition on PV panels’ surfaces to determine how it affects the panel performance. Our assessment provides an important contribution for residential level PV energy planners in the market.
The paper is organized as follows.
Section 2 highlights key energy challenges and solar potentials in Santiago.
Section 3 illustrates global trends in residential PV development including key economic drivers and incentives.
Section 4 presents the methodology of LCOE calculations to assess economic attractiveness of a residential PV generation project before
Section 5 describes the results. Finally, concluding remarks are provided in
Section 6.
2. Santiago Metropolitan Area of Chile
Metropolitan Santiago has more than 6.7 million inhabitants, presenting the most densely populated region of Chile. From the energy perspective, Santiago is closely interlinked with the national electricity system, representing the largest share of electricity demand and receiving energy supply mainly from outside of the region. Santiago’s high level of dependency on fossil fuel imports and hydro sources exposes it to serious risks in terms of energy security during the drought periods and due to external fuel-price volatilities. In addition, growing environmental restrictions and long distance from the hydro power source to Santiago are considerably increasing the costs of new hydropower projects.
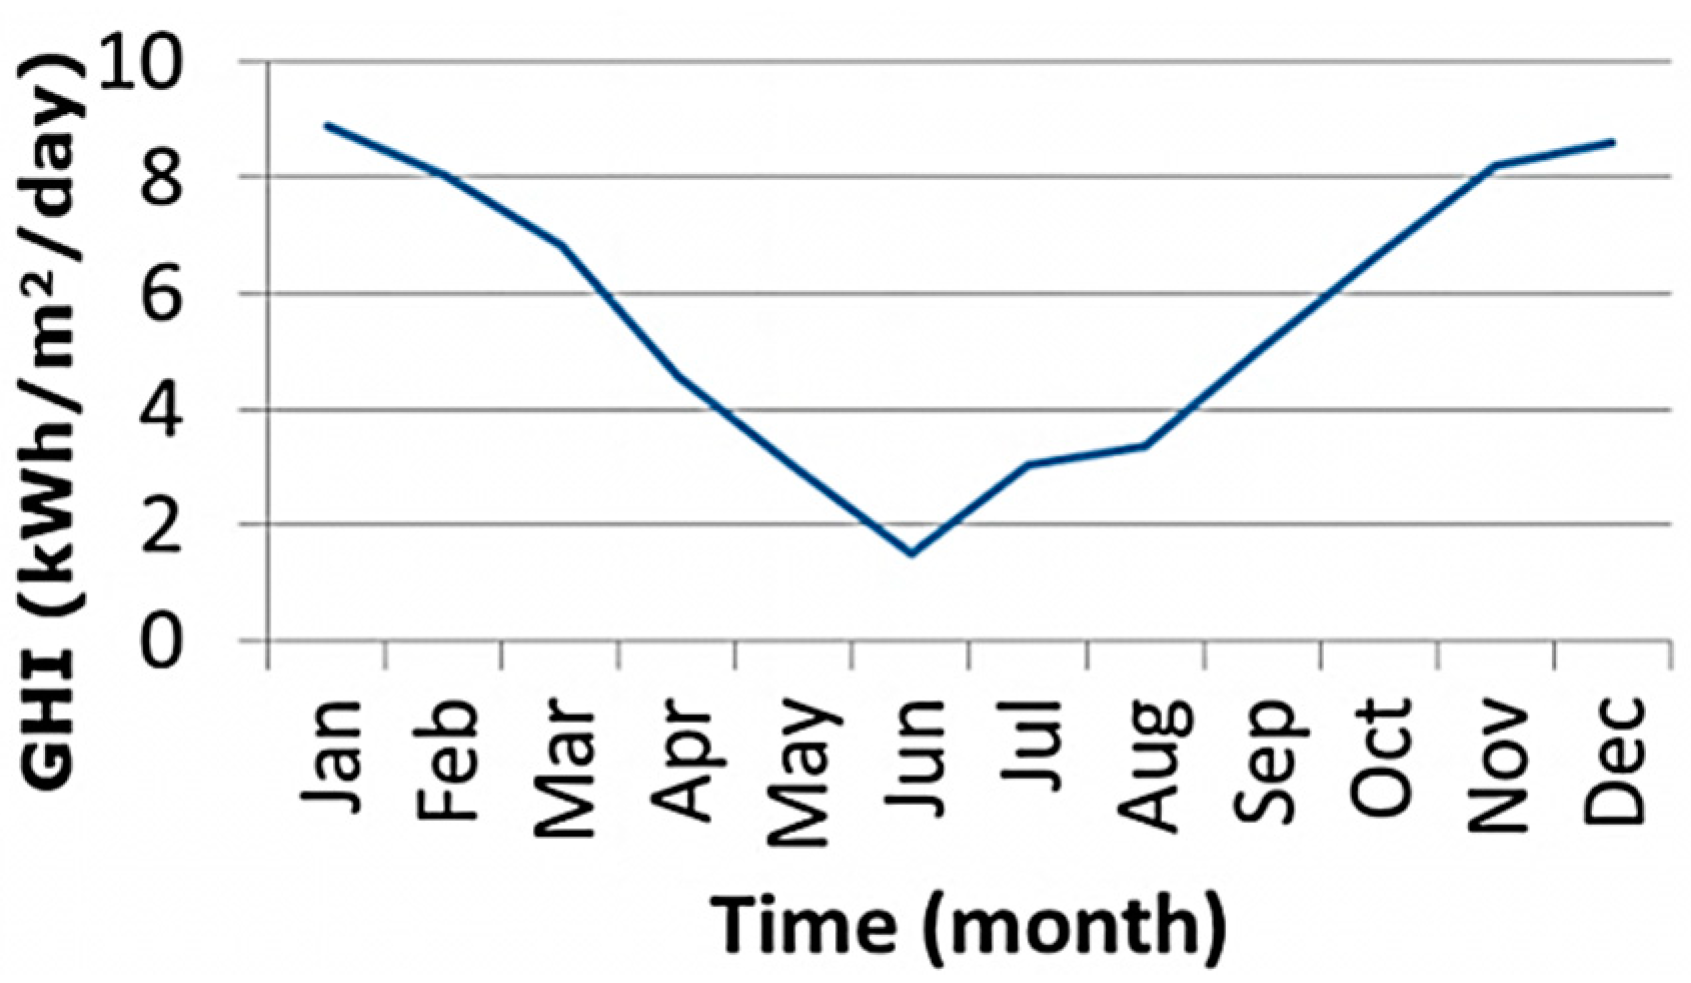
In order to cope with the potential challenges in Santiago, residential solar PV systems are expected to become one of the few ideal choices. Compared with other available renewable energy sources, residential solar PV systems are almost maintenance-free and do not require large amounts of land since they are mostly installed on the roofs of buildings. The location of Santiago, in the central region of Chile, is endowed with a warm and dry climate, with high solar radiation and temperature during most of the year from October to March (See
Figure 1). As shown in the
Figure 1, there is almost no rain, with high levels of solar radiation and high temperatures. During January (the hottest month), global horizontal radiation (GHI) reaches 9–10 kWh/m
2/day.
Figure 1.
Global horizontal radiation (GHI) in Santiago, Chile (The data adopted from Solar Energy Research Center, SERC-Chile [
10]).
Figure 1.
Global horizontal radiation (GHI) in Santiago, Chile (The data adopted from Solar Energy Research Center, SERC-Chile [
10]).
3. Global Trends in Residential PV Development
Since 2000, the global solar PV market has experienced a significant growth at an average of more than 40% each year [
11,
12]. As seen in
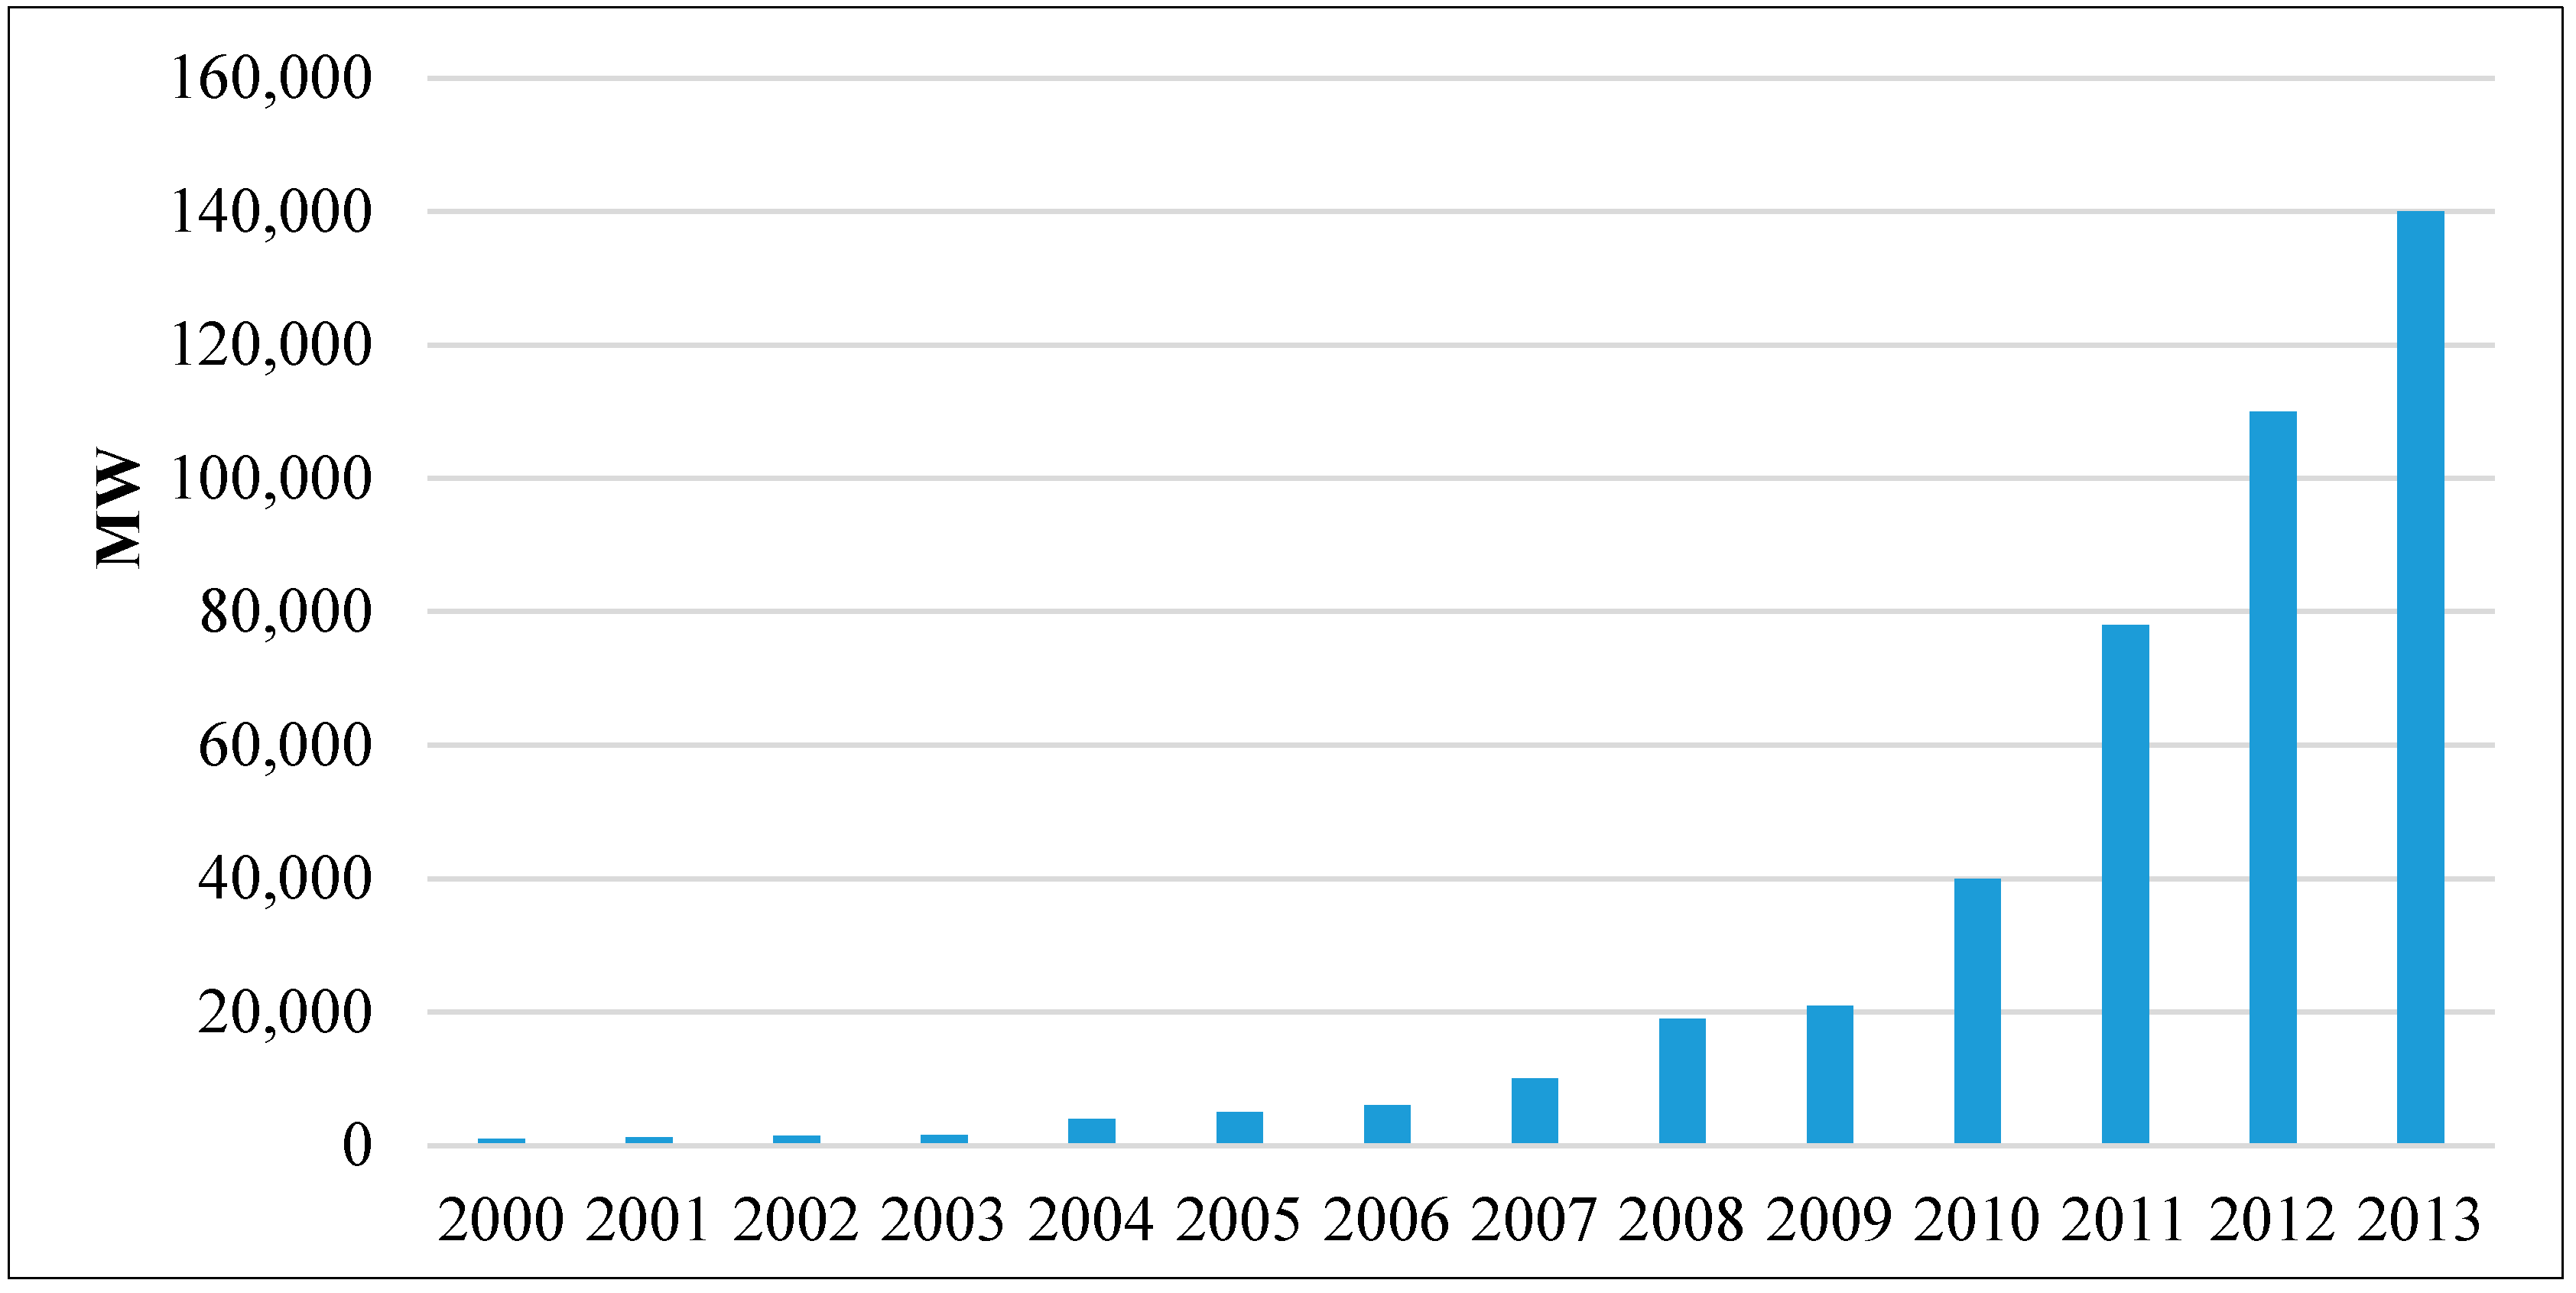
Figure 2, the cumulative amount of total PV capacity has increased by more than 39 GW in 2012, reaching 139 GW by the end of 2013 [
13]. The growth in the PV industry consistently surpassed predictions developed by IEA’s 2006 projection [
14] (see
Figure 2). As shown in
Figure 2, overall, it is estimated that between 25% and 35% of the global PV capacity is installed at the residential level. In 2013, the total PV market was over 41%, with the residential sector over 60%, non-residential sector over 37%, and utility sector over 58% [
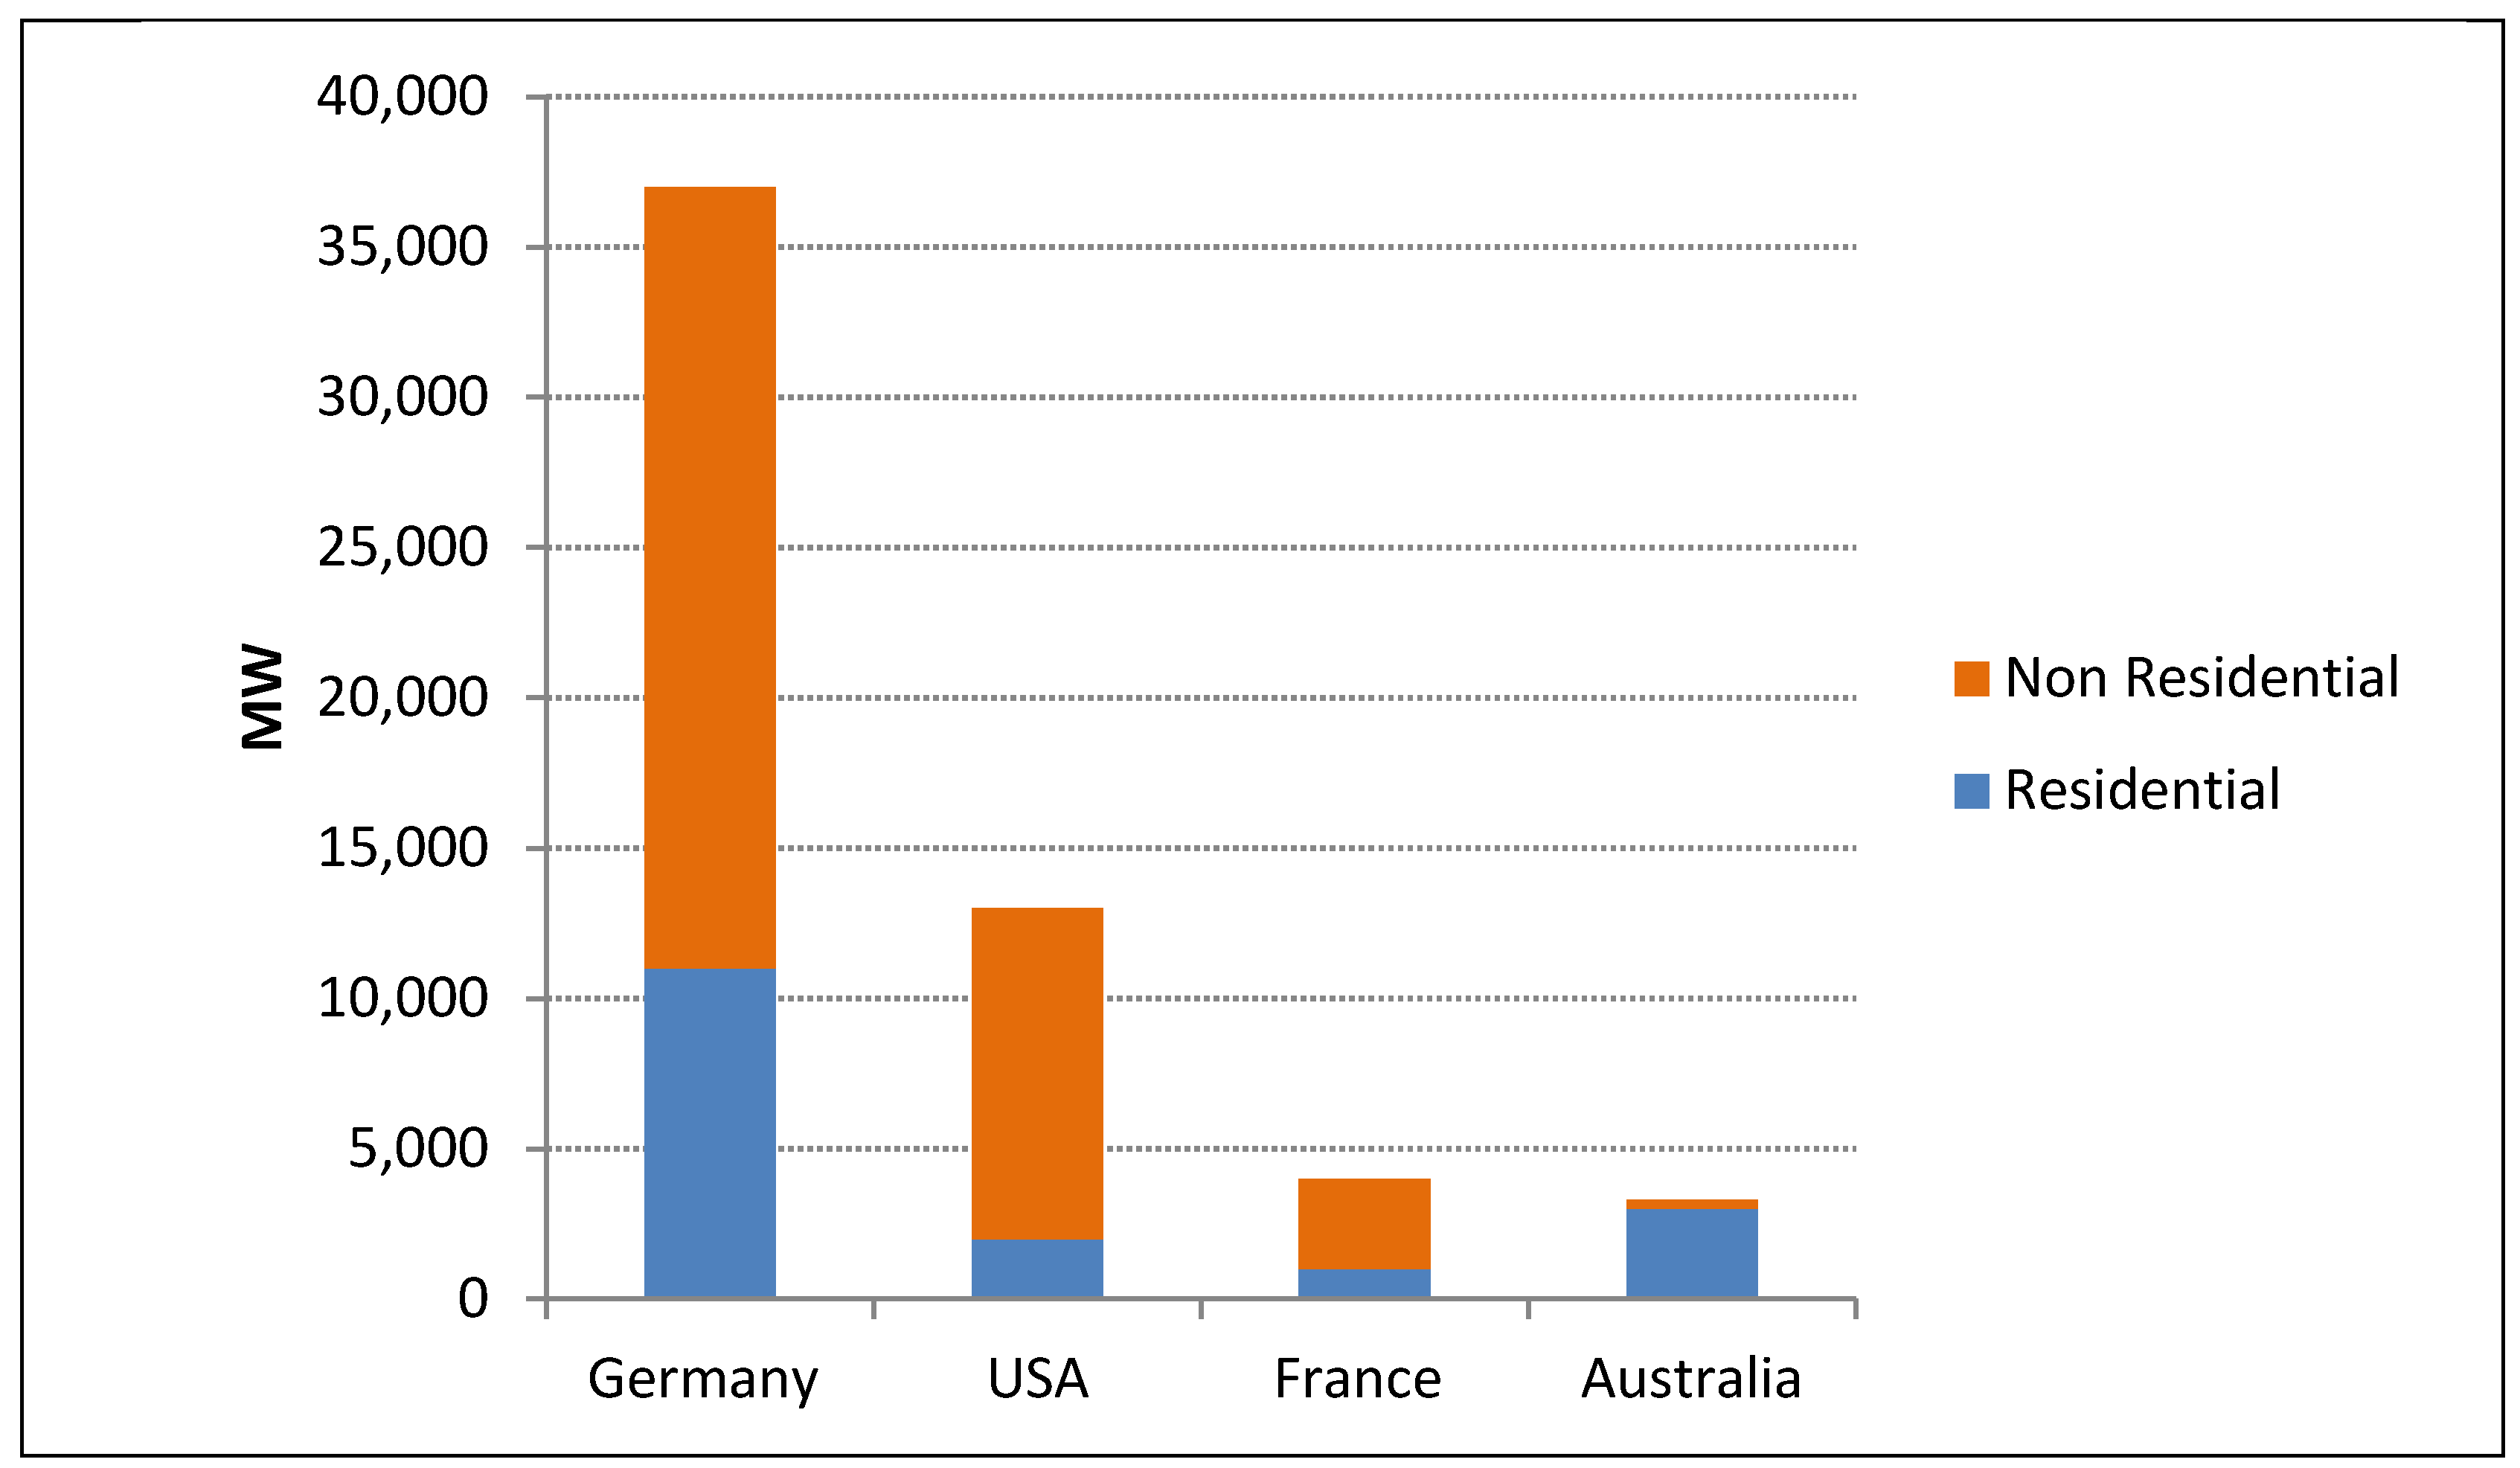
15]. As of today, a large percentage of the world’s PV capacity consists of distributed, roof-mounted systems with the large ground-mounted projects representing more than 80% in residential PV. Over the last few years, residential PV development in the world was mostly driven by Germany, the US, Japan and Australia. In Germany and the US, approximately 20% of the total PV capacity was made by residential systems (see
Figure 3). In 2013, California installed 2621 MW of the total 4751 MW and became the first major US residential market [
16]. The PV sector experienced sudden growth in Japan, adding 6.9 GW in 2013 for a total of 13.6 GW. The rooftop installations and homebuilders accounted for 89% of the Japanese market by capacity [
17].
Figure 2.
Cumulative PV capacity, 2000–2014; global residential share estimated for 2013 (The date adopted from IEA-RETD, [
18]).
Figure 2.
Cumulative PV capacity, 2000–2014; global residential share estimated for 2013 (The date adopted from IEA-RETD, [
18]).
As a result of these trends, there is ongoing discussion among both policy makers and the industry suggesting that solar development is becoming even popular, a trend fueled by self-interested energy users [
19,
20]. This revolutionary shift places the energy users in the center of changes. In addition, the authors propose that it could bring an end to existing utility business models that have served for over several decades and give way to new business operating paradigms [
20]. Energy users are expected to evolve from being “passive” recipients of energy services into “active” participants in the energy market. Besides, from a political perspective, the development of millions of residential generators has already formed a new class of “solar voters.”
Figure 3.
MW of residential and non-residential PV installed in major global markets in 2013 (The date adopted from IEA-RETD, [
18]).
Figure 3.
MW of residential and non-residential PV installed in major global markets in 2013 (The date adopted from IEA-RETD, [
18]).
Key Policy and Economic Drivers
The growth of the residential PV sector was driven by a number of factors. According to Bratford [
19], four important factors—PV incentives policies, PV system cost, insolation, and retail electricity rates—determined the likelihood of market growth and profitability of residential PV in different locations of the world.
- Incentive policies for promoting residential PV systems
Prior studies on PV adoption assume that different policy support mechanisms have been key accelerating factors in residential PV expansion. The policies are mainly related to the economic incentives to support PV installations in houses [
21]. A large number of studies describe in-depth analyses of various policy instruments designed to promote residential PV systems [
22,
23,
24]. The PV policies in Germany, Spain and Greece were examined by Luthi [
25]. Celik
et al. [
26] studied the energy statistics of 15 European Union countries and concluded that subsidies and incentives are vital in promoting PV systems. Campoccia
et al. [
27] made a comparison of existing incentives adopted by France, Germany, Italy and Spain. Dusonchet and Telaretti [
28,
29] extended the comparison to 17 Western and 10 Eastern European Union countries. Sivaraman and Horne [
30] studied the Australian policy to increase small-scale grid-connected PV deployment. Palmer [
31] examines the broader impacts of a high penetration of residential PV in Melbourne and Victoria. He concludes that in a coal and gas-based grid, PV provides a significant source of emission abatement with declining costs.
Feed-in tariffs (FIT) have been prevalent and successful at stimulating PV systems in many countries, especially in Europe. FIT is an electricity rate paid for generation that typically offers a guarantee of: (1) payments to project owners for total kWh of renewable electricity produced; (2) access to the grid; and (3) stable, long-term contracts (15–20 years) [
32]. In the 1990s, Germany pioneered the use of feed-in tariffs for PV by offering long-term premium contracts to municipal utilities [
33]. Under this model, residential energy users were entitled to purchase 100% of their electricity needs from the grid while selling 100% of their output under the FIT contract. Since then, this model has been expanded to many countries of Europe (and beyond) for the next thirty years. From 2009 to 2012, the German FIT system had an incentive for self-consumption, allowing owners of solar PV projects up to 30 kW to consume the electricity they generate and receive a reduced feed-in tariff. The revised 2012 FIT law created an even more attractive incentive for self-consumption, permitting 90% of PV output to be sold to the grid and the remainder to be consumed onsite [
18].
Net metering is another electricity policy incentive for residential PV, which allows the consumer to own, operate and profit from a PV system offsetting some or all their electricity consumption. Typically integrated PV systems have a specified meter that is able to spin the flow of electricity in both directions displaying the net consumption or the net excess during the billing period, which is finally valued at retail rate [
33]. The US was the first country that introduced net metering policies to encourage onsite consumption in the states of Minnesota and Massachusetts in 1980s [
34]. Net metering policies are now in 43 of 50 states. However, the rapid expansion of the support incentives in the past several years has raised questions in major solar markets as to whether these are the optimal policies for supporting PV at higher penetrations. Yamamoto [
35] studied applications of FIT and net metering programs extending their identified advantages and disadvantages in terms of social welfare impact. The author concludes that social welfare is different depending on the amount of reduction in electricity consumption achievable under net metering. If the reduction is relatively small, FIT is likely to produce more social welfare than net metering; if the reduction is large, the opposite is the case. In other studies, Haas
et al. [
36], Klessmann
et al. [
37] and Mendonca [
38] made comparisons among the existing supporting measures. They argue that market growth and rapidly falling prices also may have been facilitated by the regularly adjusted FIT, which has provided a simpler, more certain and more lasting value proposition to the final customer compared to net-metering policies. In contrast, Frondel
et al. [
39] criticize FIT schemes, particularly the case of Germany, arguing that the scheme failed to accomplish its promises on emissions reductions, employment, energy security, or technological innovation while resulting in massive expenditures.
In addition, the adoption of PV and its subsequent effect on electricity rates are highly dependent on the tariff structure. However, the treatment of tariff structure of solar PV and residential tariffs in many existing applications is too simplistic and does not capture the dynamics or difficulties that different policy support mechanisms such as feed-in tariffs and net metering are contributing. In the example of the Southeast Queensland region in Australia, initiated policy subsidies involving generous premium feed in tariffs has resulted in vast wealth transfers amongst electricity consumers through “hidden subsidies” [
40]. The quantitative analysis by Simshauser [
40] found the Demand Tariff to be superior increasing the efficiency and fairness of the price signal.
- Declining cost trends
In the recent past, despite regular changes and amendments made the incentive policy schemes of many countries, new solar PV installations have continued at a high pace and grown much faster than predicted by national action plans. The main ongoing boom is associated with dramatic cost improvements in PV competitiveness. PV residential installation costs have dropped dramatically globally and have decreased by more than 50% in the past five years [
20]. There is still large regional variation due to various factors; for example, installation costs for residential PV systems in the US were 2.70 USD/watt higher than in Germany [
41]. This is averaging 14,000 USD for a 5 kW system in 2012. Installation costs for PV systems consist of modules, inverters and “soft” costs such as labor, permits, financing and customer acquisition. PV module costs have declined from ~1.90 USD/watt in 2009 to 0.70 USD/watt (0.50 USD/watt in China) [
42] and inverter costs from 0.60 to 1.00 USD/watt in 2005 to under 0.20 USD/watt in 2013 [
43,
44]. However, due to differences in labor costs, permitting processes, market size and administrative processes, soft costs vary widely by region. For the residential sector, soft costs amounted to 1.05 USD/watt in Japan and 2.22 USD/watt in the US in 2013 [
45]. These trends confirm that even if solar support mechanisms disappear, there is now a business case for solar systems.
PV LCOE has already decreased below the retail electricity prices in many countries, and further decline is still expected.
- Electricity rates
A high retail electricity rate is considered to be an important economic driver for the expansion of residential PV. Higher rates result in more economic incentives for consumers to adopt PV [
21]. The retail price of electricity is driven by many elements including generation costs, transmission and distribution system costs, ancillary services costs and a profit margin. There may also be additional surcharges and taxes imposed by the government. Since retail electricity rates vary widely from country to country, the expected return on PV investment varies accordingly. For instance, rates may vary from 0.01 USD/kWh in the Gulf States to 0.30 USD/kWh–1.00 USD/kWh or greater in island nations and remote areas that depend on diesel fuel [
18].
- Solar insolation
Solar insolation is a prime criterion in determining the suitability of a location for PV applications, which ultimately determines electrical output. Insolation refers to the average amount of energy contained in sunlight striking a square meter of surface area in a day. Insolation plays a key role in the economic performance of the PV system. The initial investment is lower in countries with high insolation, as fewer PV panels are required to produce the same amount of electricity. For example, a 1 kW PV system in northern Chile can have an annual average Direct Normal Irradiation (DNI) of 9–10 kWh/m
2 in a day and produce more than 2300 kWh per year, whereas a 1 kW PV system located in northern Norway would have a DNI of 1–2 kWh/m
2 and produce less than 900 kWh per year [
46].
4. Methodology
In analyzing the development of residential PV solar electricity in the metropolitan area of Santiago, Chile, this paper draws on the requirements for profitability of investments in residential level PV systems. In broad terms, to determine the economic attractiveness of an investment, it is essential to measure the benefits and costs associated with it. Levelized cost of electricity (LCOE) is a convenient and widespread approach to assess economic attractiveness of PV-generation projects [
47,
48,
49]. LCOE is based on the lifetime-generated energy and costs in order to give a price estimation per unit energy generated. However, there are also strict limitations using this method of LCOE calculation [
50]. The major criticism of the misuse of the LCOE is that ordinarily, LCOE is a static measure of prices per generated PV energy whilst true market prices are dynamic. LCOE lacks clear reporting assumptions, justifications and a degree of completeness, which generates widely varying results. In addition, LCOE fails to value important details in an energy project. These details mainly include integration and transmission costs, relative environmental impacts and the contribution of a technology to meeting specific energy services, for example, peak electricity demands [
51]. Taking these limitations into account, there seems to be a clear understanding that LCOE could lead to the wrong outcomes and policy initiatives.
In line with much of the literature, this paper uses an analysis of the LCOE of residential PV solar energy technologies in metropolitan Santiago, Chile. We examine the economic attractiveness of domestic PV investment per kWh realized by a standard house vs. the price of electricity tariffs in Santiago. In addition, given the many factors that determine the profitability of PV solar systems, we include a new variable of PM10 factor to examine the impact of dust deposition on PV panels’ surfaces on the economic performance of a PV system.
In this study, two different scenarios are analyzed: grid-tied PV systems and zero feed-in PV systems. The major components of both grid-tied and zero feed-in PV systems are described in
Table 1.
In the first scenario, the PV system operates as a small generator which is interconnected with the electric energy network. It is used to provide energy for local loads and for the exchange electric energy with utility grids. Depending on the local load patterns and the solar resource variation during the day, consumers are entitled either to sell energy generated by solar PV or buy electricity from the local electric utility. This operation mode requires an inverter to convert the DC current generated by the solar PV modules to AC current for the utility grid.
In the second scenario, PV systems are isolated from the electric distribution grid and used only to meet domestic needs. The system described in
Table 1 is one of the most complex and requires an energy storage system for the energy generated because the energy generated is not always consumed at the same time as it is generated. In other words, solar energy is available during the day, so generated energy during the day must be stored for use in the night. A controller is a device that interrupts the homeward supply to charge the batteries and, when they are fully charged, redirects the energy into the house.
It also works for the opposite case when the batteries are already fully discharged. The most basic function of a controller is to prolong the battery life of the PV system through preventing battery overcharging. If batteries are allowed to routinely overcharge, their life expectancy will be significantly reduced.
Table 1.
Scenarios analyzed in this study.
Table 1.
Scenarios analyzed in this study.
| I Scenario: Grid-Tied PV Systems | II Scenario: Zero Feed-in PV Systems |
|---|
![Sustainability 07 00422 i001]() | ![Sustainability 07 00422 i002]() |
| Key Components | Key Components |
- -
Solar PV Modules - -
Inverter (DC/AC) - -
Main disconnect/isolator Switch - -
Utility Grid
| - -
Solar PV Modules - -
Charge Controllers - -
Battery or Battery Bank - -
Inverter (DC/AC)
|
Levelized Cost of Electricity Model
The LCOE method considers the lifetime generation and costs to estimate a price per unit energy produced. Since the LCOE methodology is very sensitive to the input assumptions, it is common to conduct a sensitivity analysis [
52]. Equation (1) is used for calculating the LCOE of PV technologies is:
whereby:
LCOE = the average lifetime levelized cost of electricity generation;
It = investment expenditures in the year t;
Mt = operations and maintenance expenditures in the year t;
Ft = fuel expenditures in the year t, which is zero for PV generation;
Et = electricity generation in the year t;
r = discount rate; and
n = economic life of the system.
A survey of published literature reveals that results from LCOE can vary based on location, capacity for generation, complexity, efficiency, operation, plant lifetime and other factors [
12,
53,
54,
55]. The major factors that determine the profitability of PV solar systems at a particular location include the cost to generate solar electricity—a function of the intensity of sunlight, the efficiency of the solar array, efficient performance of solar panels and its installed cost—and the available incentives and local rates for conventional electricity. The main parameters and values used in our model are listed in
Table 2.
Table 2.
Main input parameters and values for a residential solar PV system (The data adopted from Zhang,
et al. [
12]).
Table 2.
Main input parameters and values for a residential solar PV system (The data adopted from Zhang, et al. [12]).
| Input Parameter | Value | Unit |
|---|
| Polycrystalline panel cost | 130 | USD |
| System Output (30 panels with 250 W) | 7500 | W |
| Invertor cost | 600 | USD |
| Invertor Capacity | 8000 | Watt |
| Charge controller cost | 117 | USD |
| Battery bank cost | 1200 | USD |
| Investment cost | 4616.36 | USD |
| Maintenance cost | 69.25 | USD |
| Energy cost | 2521.24 | USD |
| Discount rate | 5.0 | % |
| Efficiency | 15.35 | % |
| Plant factor | 25.0 | % |
| Solar irradiation | 3000–3200 | kWh/m2·day |
| Plant life time | 20 | Years |
| Degradation factor | 5 | % |
| Location | Santiago | |
- Key design elements used in the model
The main input factors are derived from [
56] and suppliers. To calculate the LCOE values under both scenarios, we have considered a relevant PV system in the model. A PV system is normally composed of an arrangement of several components: PV modules, charge controller systems, batteries, inverters and the grid connection.
Solar PV modules are made up of solar cells, most commonly manufactured from silicon but other materials are available [
56]. The number of solar cells used in the PV modules depends on the desired voltage that has to be achieved. Selecting the correct components is of fundamental importance to a PV panel, keeping in mind the numerous internationally accepted standards. The assumed components of the PV panel are summarized in
Table 3.
- Air pollutant parameters, PM10 (dust accumulation on the PV panels’ surface)
Although solar radiation is the most important parameter affecting the output of the PV panel, there are other parameters that affect energy production [
56,
57,
58,
59,
60]. Some of the major parameters include cell temperature (≤10%), angle of incidence (≤10%), spectral distribution (≤3%), uncertainty in the manufacturer’s ratings (≤5% or more), ageing (≤5% over lifetime), mismatch losses (≤2%), losses due to blocking of diodes and wiring (≤3%) [
56,
57,
58], and dust deposition on the solar panels (≤5%) [
59]. However, this latter parameter depends heavily on the location of the PV systems [
61]. An experimental study conducted by John
et al. [
62] in the Portland metropolitan area demonstrated that dust deposition on the surfaces of PV panels can significantly reduce power output. Using a 17-day dry spell in mid-summer, the average rate of deposition during the dry summer months was estimated to be 0.045 g/m
2 day. This level of deposition over 17 days reduced PV output by about 4%. In line with much of the literature, this paper will continue with an analysis of the LCOE adding an environmental variable to examine the impact of dust deposition on PV panels’ surfaces on panel performance in Santiago.
Table 3.
Assumed components of the PV panel.
Table 3.
Assumed components of the PV panel.
| Solar PV Panel Specifications |
|---|
| Specifications |
| Peak total power (W) | 250 |
| Optimum power voltage (V) | 31.02 |
| Optimum operating current (A) | 8.06 |
| Cell efficiency (%) | 17.5 |
| Module Efficiency (%) | 15.4 |
| Open Circuit Voltage (V) | 36.99 |
| Short Circuit Current (A) | 8.62 |
| Inverter Specifications |
| Type | DC/AC inverter |
| Output power (KW) | 1–200 |
| Output voltage (V) | 230 |
| Output current (A) | 36 |
| Efficiency (%) | 85–95 |
| Battery Specifications |
| Type | Lead-Acid |
| Capacity (kWh) | 18.6 |
| Nominal voltage (V) | 12 |
| Charge/Discharge cutoff (V) | 14/10 |
| Depth-of-discharge (%) | 25 |
| Lower/Upper current limits (A) | 150/250 |
| Controller Specifications |
| Auto-rated voltage (V) | 12/24/36/48 selectable |
| Operating temperature (°C) | −10 to 50 |
| Maximum Current (A) | 45 |
| System Current (A) | 45 |
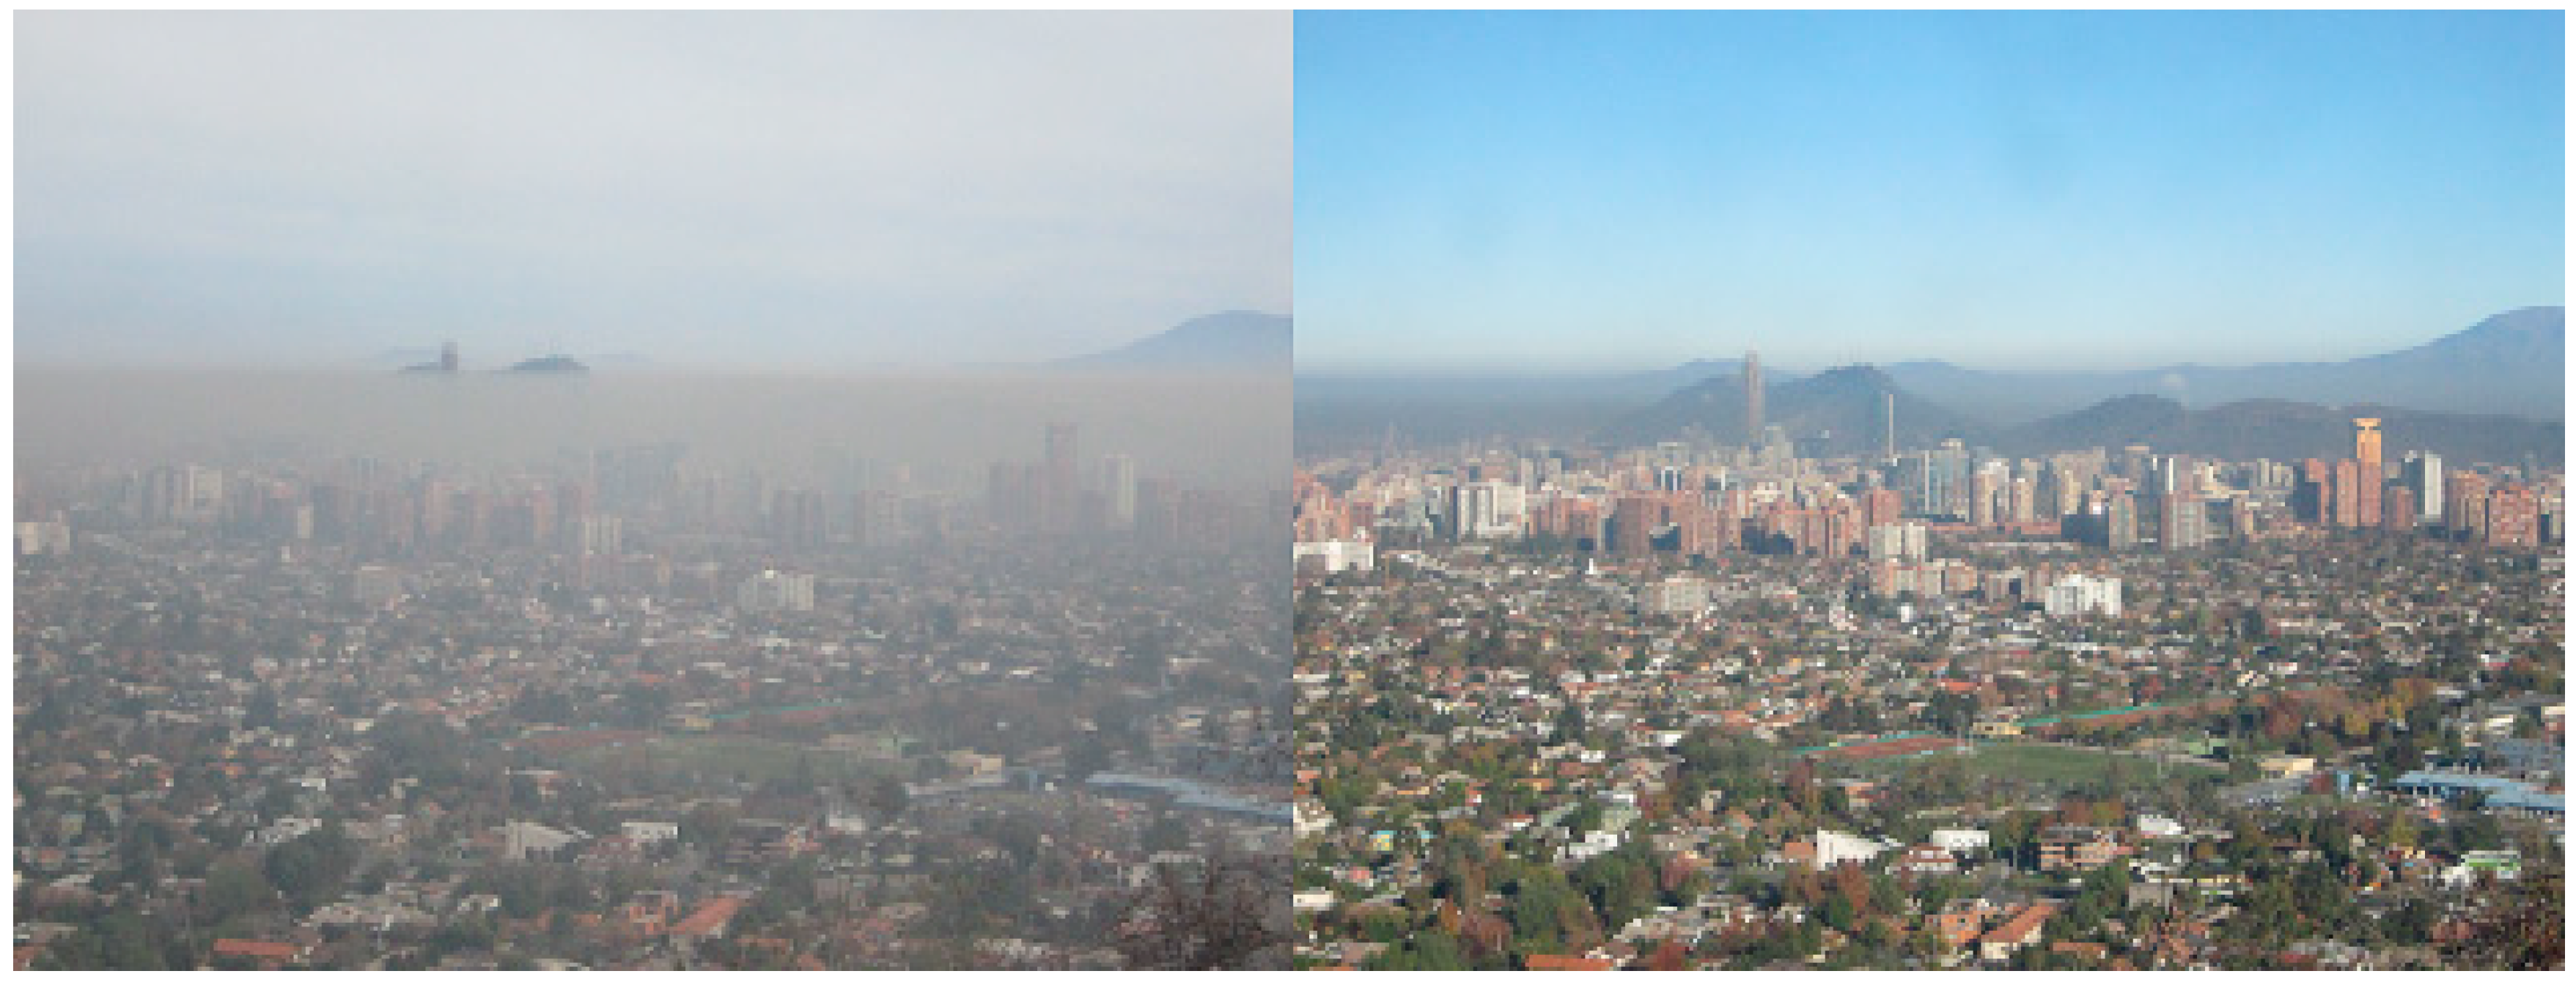
Santiago is one of the most polluted cities in South America [
63] (see
Figure 4). Among the principal air pollutants, the PM10 factor is important and exceeds 50 mg/m
3, which is well above the WHO guideline of 20 mg/m
3 [
64]. The level of PM10 pollution intensifies throughout most of the year and becomes more serious in autumn and winter due to temperature inversion. In our study, data on the potential effects associated with elevated levels of PM10 were collected between 2013 and 2014 from the Las Condes station (Latitude 33.38°S, Longitude 70.52°W, Elevation 795 meters). The area of Las Condes is primarily residential, with some retail stores located around the main streets. The major pollution source of PM10 comes from buildings, roads, wind erosion and finally mobile sources. PM10 reaches its peak level during the afternoon, which is most likely due to vehicles.
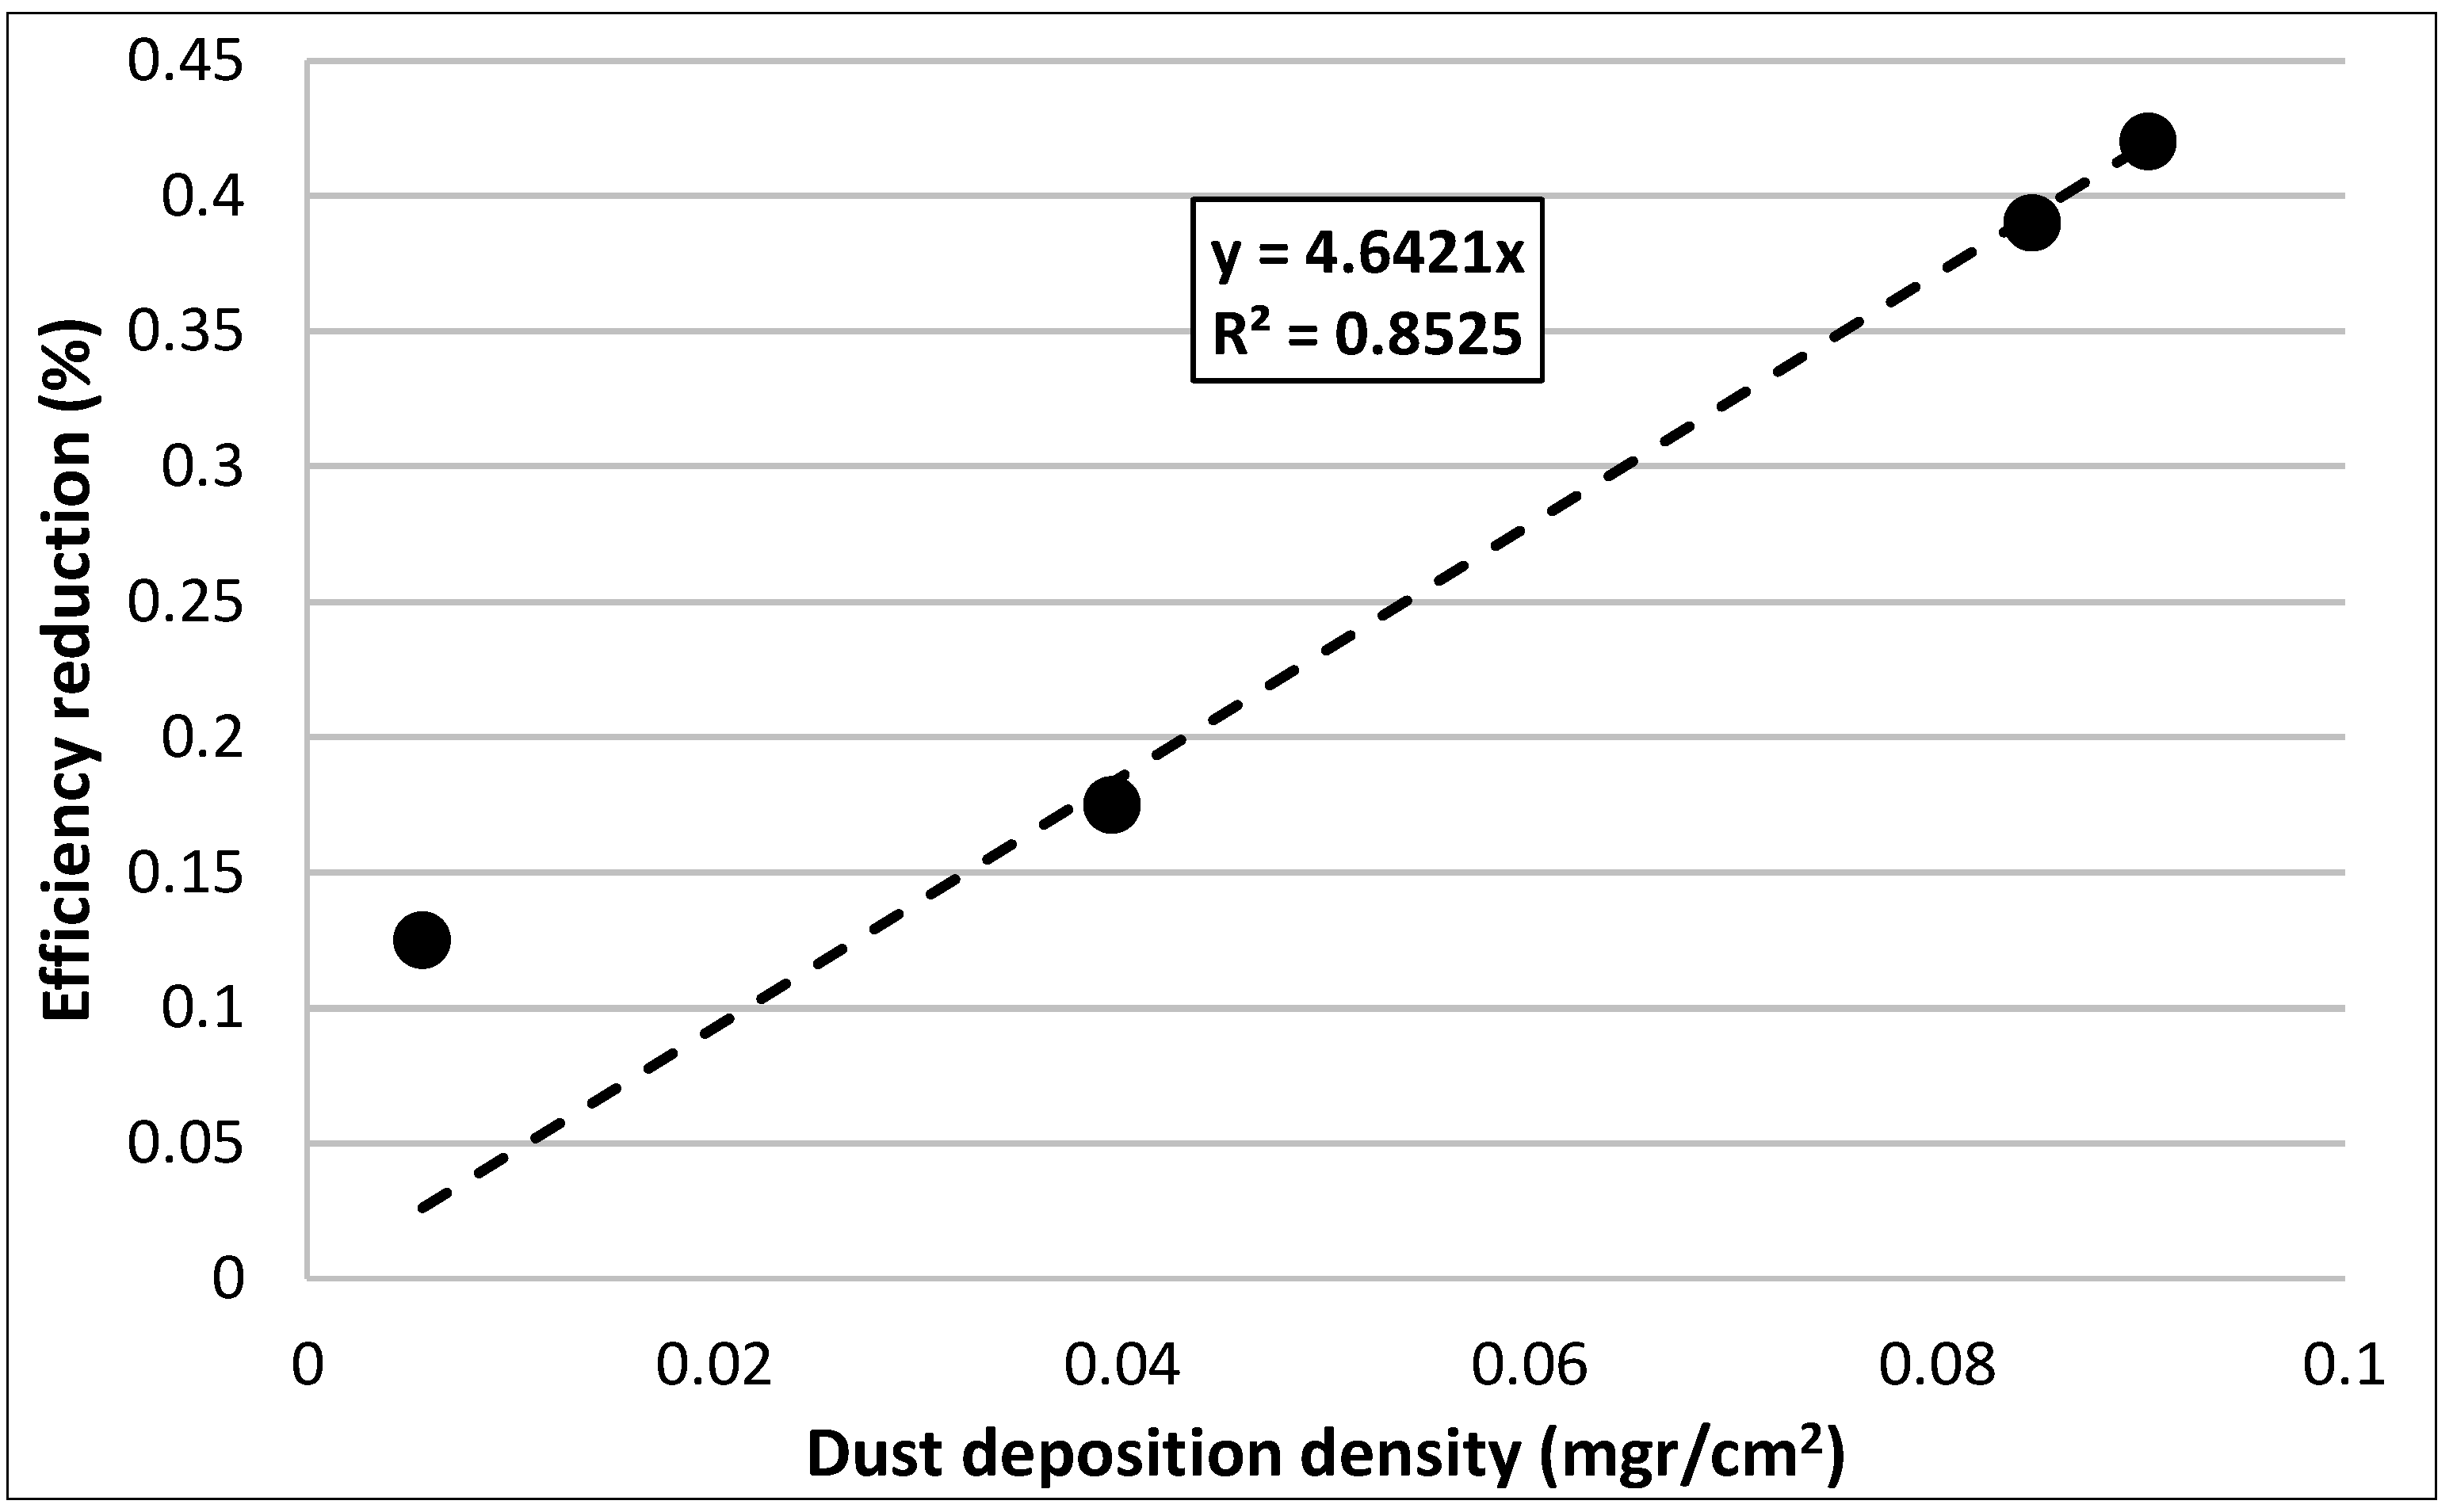
To estimate the loss of efficiency caused by particulate matter (PM10) in Santiago, we compared the average PM10 in the Las Condes station with the average PM10 measured in the Athens LYK monitoring station. The LYK station was chosen because it is geographically similar, surrounded by mountains like the Las Condes station. The annual average PM10 at LYK station in Athens is 58.7 mg/m
3 [
59]. These data are comparable with the annual average PM10 in Las Condes, which is 58.02 mg/m
3. The considerable dust deposition results in a 5% power output reduction due to a 0.4% efficiency decline. Using this information, the efficiency loss and its effects on LCOE values considering
R2 of 0.85 (see
Figure 5) can be calculated.
Figure 4.
Smog observations in Santiago, Chile. (Left-hand side: 11June 2012 and right-hand side: 14 May 2014).
Figure 4.
Smog observations in Santiago, Chile. (Left-hand side: 11June 2012 and right-hand side: 14 May 2014).
Figure 5.
Efficiency reduction due to PM10.
Figure 5.
Efficiency reduction due to PM10.
5. Simulation Results
The results of the LCOE sensitivity analysis for the plant factor and PM10 factor are presented separately in
Figure 6 and
Figure 7.
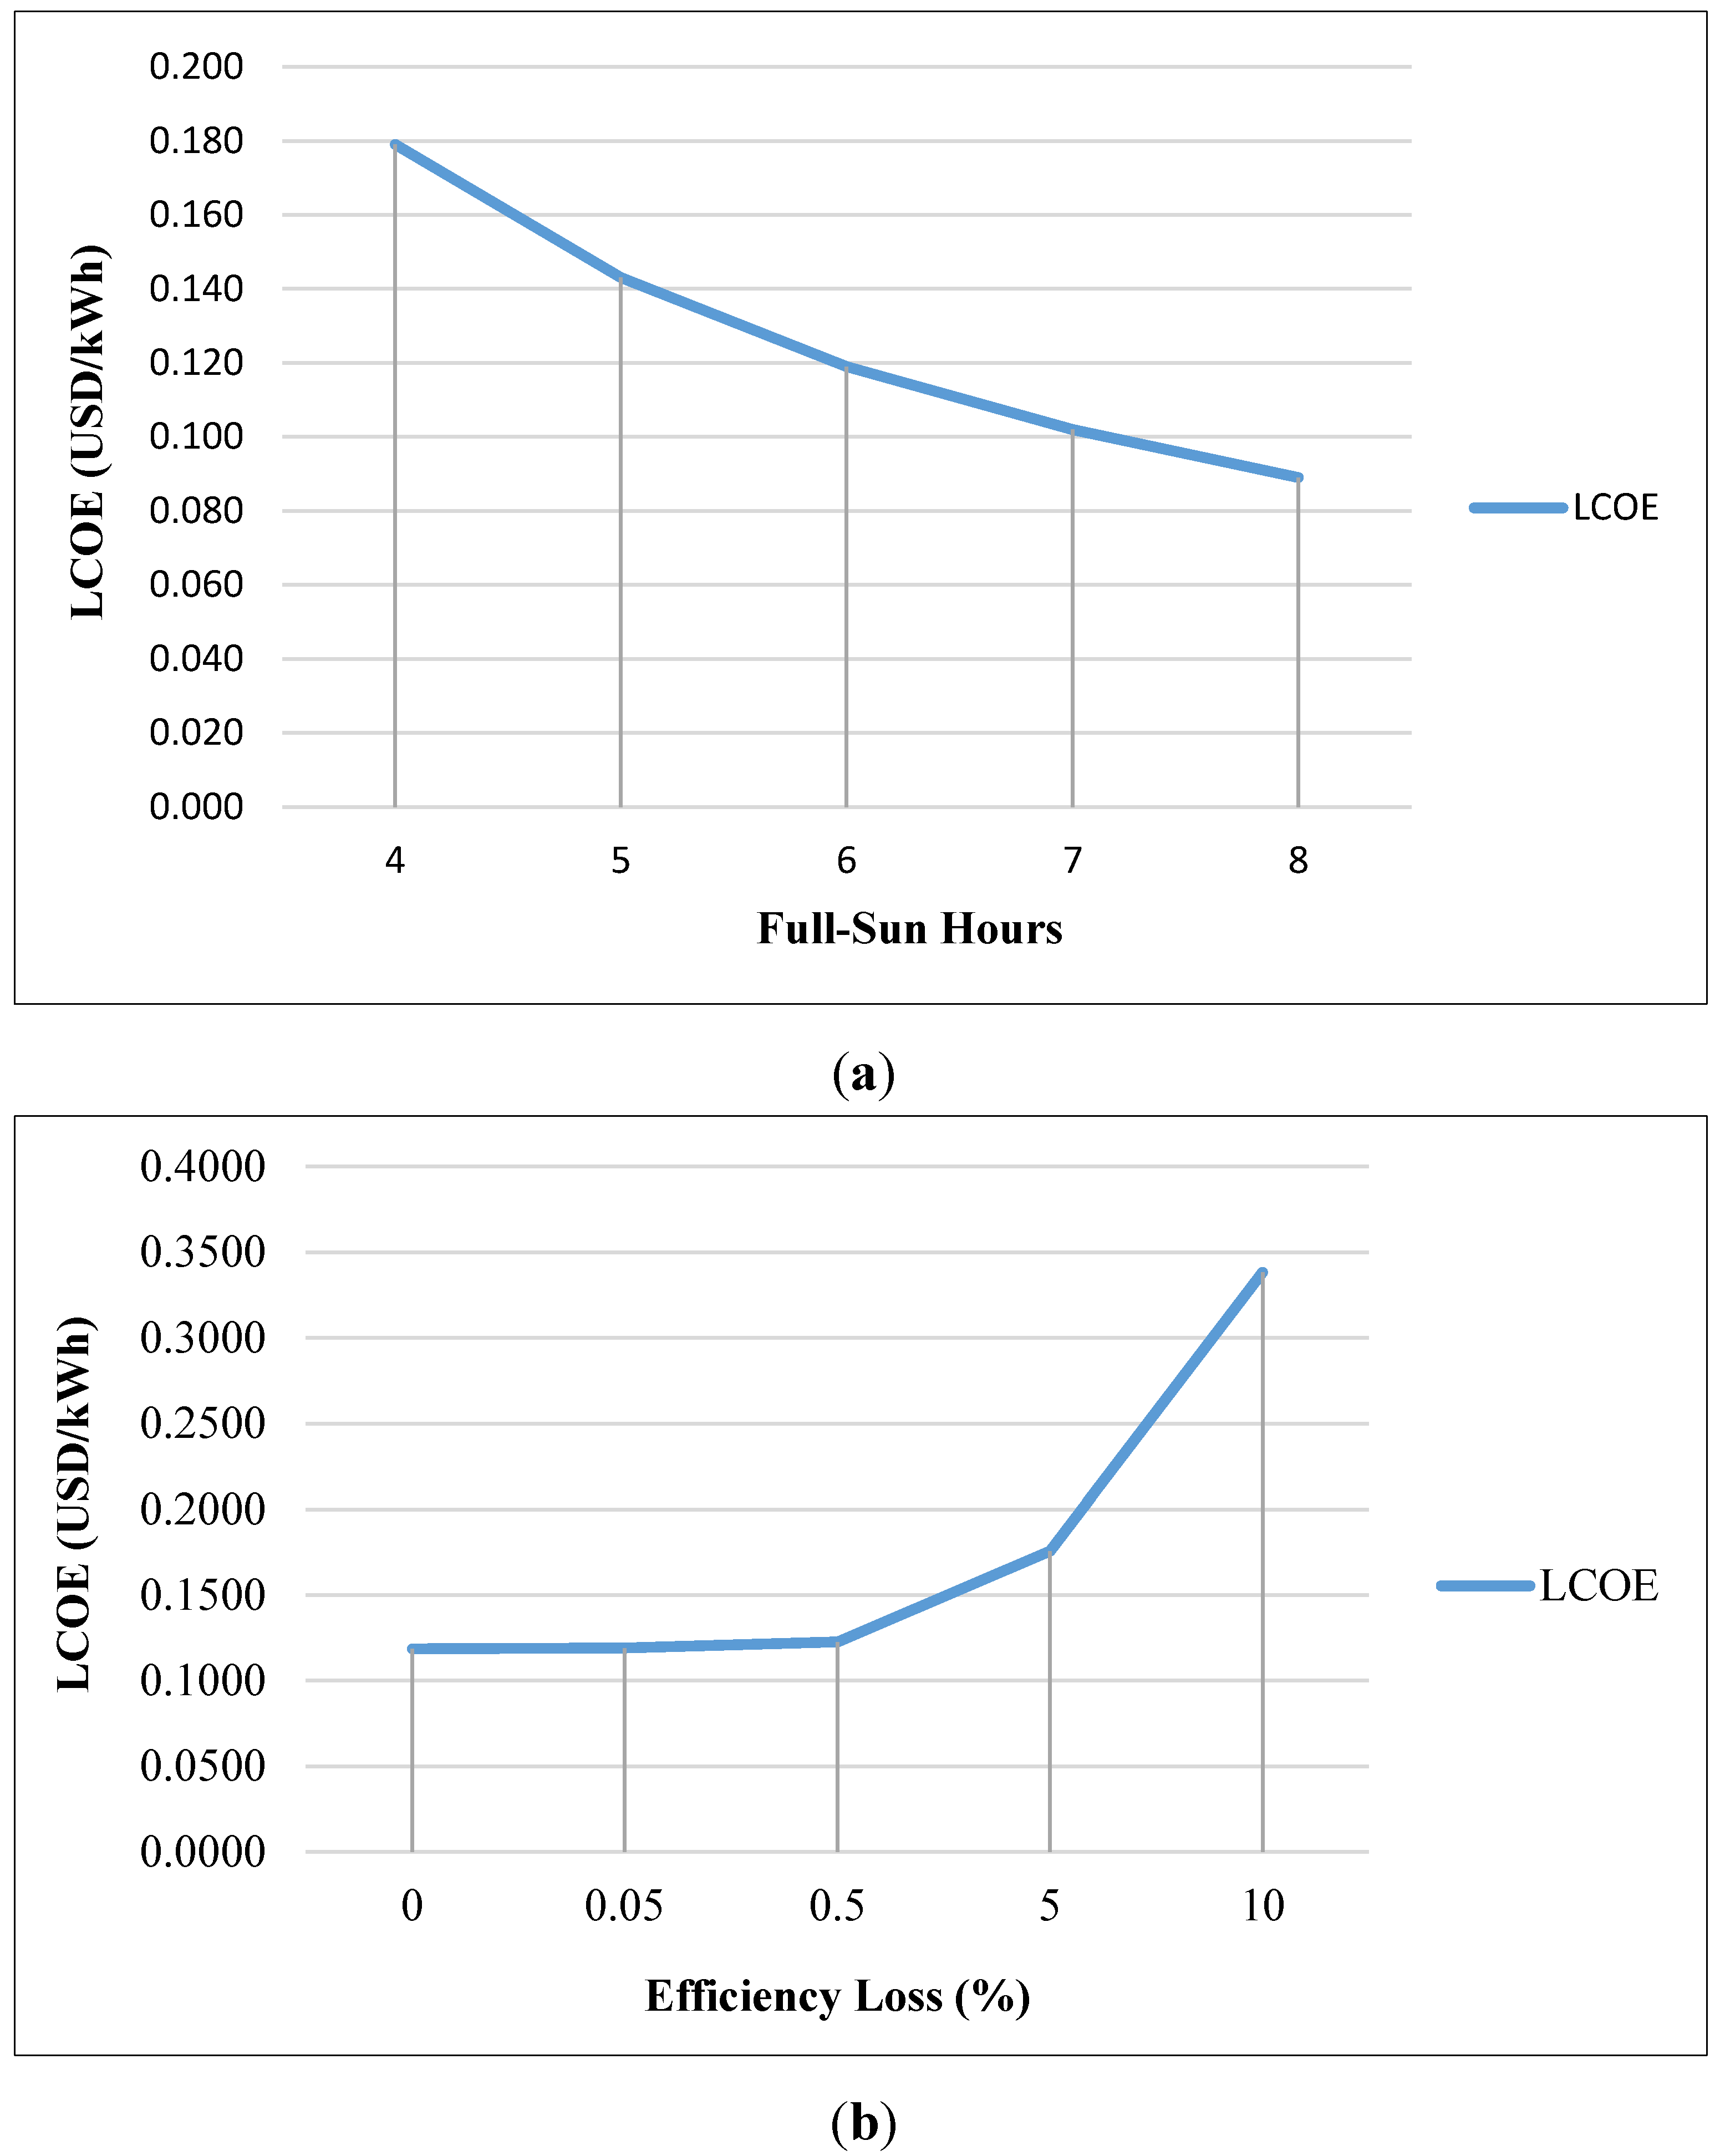
Figure 6 presents LCOE sensitivity analysis for each plant factor and PM10 value, taking into account scenario 1 for a grid-tied residential PV system. The analysis for plant factor has shown that LCOE value ranges between 0.09 and 0.18 USD/kWh, which is very close or even significantly lower than the actual electricity retail price of around 0.16 USD/kWh. Several factors, such as declining PV modules costs, the discount rate, the project lifetime and high local solar irradiation level have a major impact on the economic evaluation results. Accordingly,
Figure 7 shows a considerably higher LCOE when the efficiency reduction increases from 0% to 10% due to the presence of dust on the PV panels.
Figure 6.
LCOE sensitivity analysis for the first scenario: grid-tied residential PV systems. (a) Plant factor; (b) Environmental condition (smog factor in Santiago).
Figure 6.
LCOE sensitivity analysis for the first scenario: grid-tied residential PV systems. (a) Plant factor; (b) Environmental condition (smog factor in Santiago).
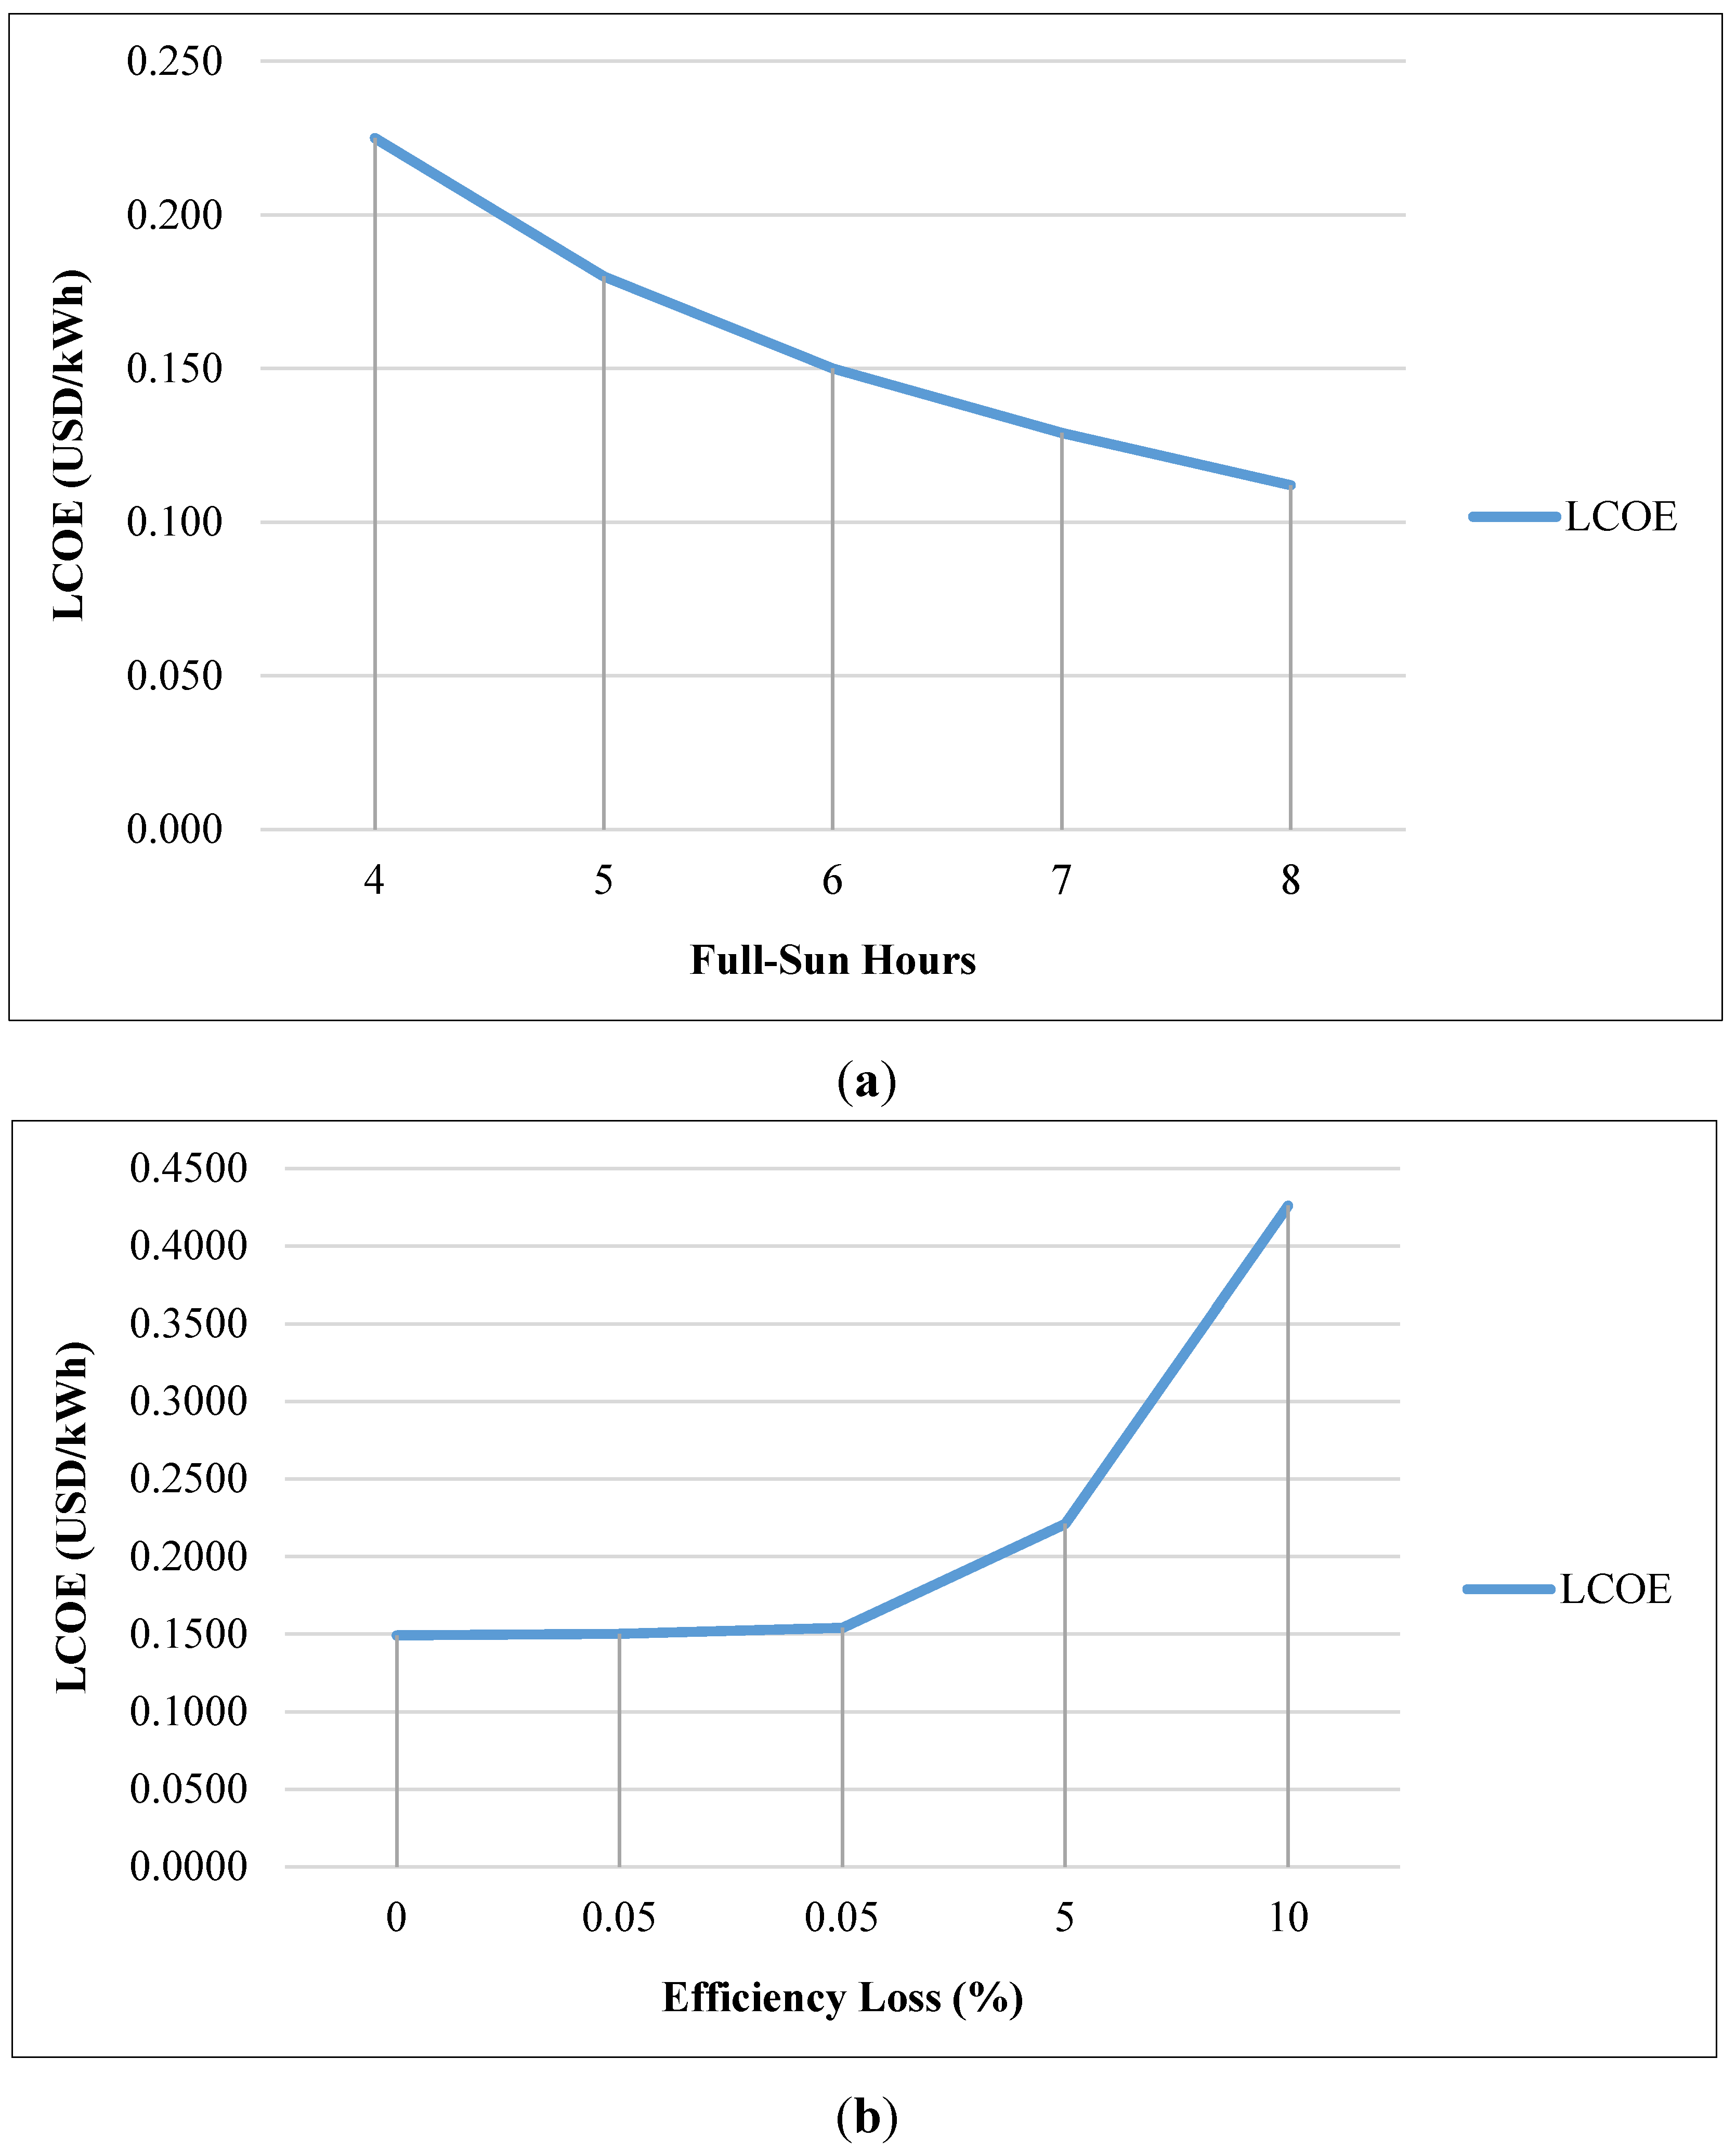
Figure 7 describes the results of LCOE sensitivity analysis for the second scenario: zero feed-in PV systems. The analyses show that the investment in this scenario compared to the first scenario seems to be less profitable as the LCOE values are relatively higher than the existing residential tariff. LCOE ranges from 0.11 to 0.23 USD/kWh. This result could possibly be explained by the fact that since this scenario does not allow selling energy back into the market, households need a battery bank to store excess energy. When storage is included, the LCOE range of residential PV systems is estimated to rise.
Figure 7.
LCOE sensitivity analysis for the second scenario: zero feed-in PV systems. (a) Plant factor; (b) Environmental condition (smog factor in Santiago).
Figure 7.
LCOE sensitivity analysis for the second scenario: zero feed-in PV systems. (a) Plant factor; (b) Environmental condition (smog factor in Santiago).


