Dominant Modes of Upper Ocean Heat Content in the North Indian Ocean
by
 , ,
, ,
Meer Mohammed Ali
1,2,* ,
,
Neetu Singh
3, 
Manchikanti Suresh Kumar
4,
Yangxing Zheng
1 ,
,
Mark Bourassa
1,5, 
Chandra Mohan Kishtawal
6 and
Chandu Venkateswara Rao
4 1
Center for Ocean-Atmospheric Prediction Studies, Florida State University, Tallahassee, FL 32310, USA
2
Indian Institute of Tropical Meteorology, Pune 411008, India
3
CSIR-National Institute of Oceanography, Goa403004, India
4
National Remote Sensing Center, Hyderabad 500037, India
5
Department of Earth, Ocean and Atmospheric Science, Florida State University, Tallahassee, FL 32310, USA
6
Space Applications Center, Ahmedabad 380015, India
*
Author to whom correspondence should be addressed.
Climate 2018, 6(3), 71; https://doi.org/10.3390/cli6030071
Submission received: 3 August 2018
/
Revised: 24 August 2018
/
Accepted: 28 August 2018
/
Published: 3 September 2018
(This article belongs to the Special Issue Ocean's Role in Continental and Coastal Climate Variability and Change)
Abstract
:The thermal energy needed for the development of hurricanes and monsoons as well as any prolonged marine weather event comes from layers in the upper oceans, not just from the thin layer represented by sea surface temperature alone. Ocean layers have different modes of thermal energy variability because of the different time scales of ocean–atmosphere interaction. Although many previous studies have focused on the influence of upper ocean heat content (OHC) on tropical cyclones and monsoons, no study thus far—particularly in the North Indian Ocean (NIO)—has specifically concluded the types of dominant modes in different layers of the ocean. In this study, we examined the dominant modes of variability of OHC of seven layers in the NIO during 1998–2014. We conclude that the thermal variability in the top 50 m of the ocean had statistically significant semiannual and annual modes of variability, while the deeper layers had the annual mode alone. Time series of OHC for the top four layers were analyzed separately for the NIO, Arabian Sea, and Bay of Bengal. For the surface to 50 m layer, the lowest and the highest values of OHC were present in January and May every year, respectively, which was mainly caused by the solar radiation cycle.
1. Introduction
The influence of upper ocean heat content (OHC) on the development and intensity of a tropical cyclone has been broadly studied for several decades. For example, Leipper et al. [1] brought the concept of tropical cyclone heat potential (TCHP). Shay et al. [2] showed the importance of TCHP in cyclone studies. Mie et al. [3] studied and described an anomalously strong upper ocean warming in the low-latitude northwestern Pacific believed to favor high typhoon intensity over the northwestern Pacific during the recent global warming hiatus period by modulating the amplitude of the sea surface temperature (SST) from the subsurface water. Furthermore, daily OHC analyses generated at the National Hurricane Center (NHC) were used qualitatively for the official NHC intensity forecast of category five hurricanes by Mainelli et al. [4]. In fact, the importance of upper OHC on the development and intensification of tropical cyclones has been widely realized, so much so that TCHP—defined as the OHC in a column where the ocean temperature is above 26 °C [1]—was proposed by Ali et al. [5] for cyclone studies. This parameter has now been used in numerous studies [2,4,6,7,8,9,10]. Several studies have suggested that OHC would be a better parameter than SST for cyclone studies [7,11,12]. It has also been suggested that the average temperature of an upper ocean layer derived from TCHP [13] may play a key role in monsoon performance by providing thermal energy to the system. In the North Indian Ocean (NIO), this upper ocean layer varies from 10m to 90m [14]. Nagamani et al. [14] reported that during 1998–2010, the TCHP of the Arabian Sea mini warm pool showed an overall warming of 14.5 kJ/cm2, 17 kJ/cm2, and 20.5 kJ/cm2 in the in situ observations, satellite estimations, and model simulations, respectively. The authors speculated that this increase in the TCHP might be responsible for the overall decrease in Indian summer monsoon rainfall.
The above studies and the references cited therein recognized the importance of OHC in the development of tropical cyclone and monsoon activities. Although it is obvious that variability in the depth-averaged upper OHC decreases with depth as the major coupling with the atmosphere occurs at the surface, the dominant modes of the top ocean layers are worth studying. This short paper is intended to report the dominant modes of the top seven layers in the NIO, i.e., surface to 50 m, 100 m, 150 m, 200 m, 300 m, 500 m, and 700 m depth. Here, we present the time scales of the dominant modes of heat content of different layers without explicitly testing their relationship with the monsoon and cyclone phenomena. Secondly, the ocean mixing processes within these depths may vary regionally, indicating that these results apply only to the NIO. We have assumed that vertical mixing dominates horizontal transport related to outcropping, therefore the layers we examined extended from the surface down to specific depths.
2. Data and Methodology
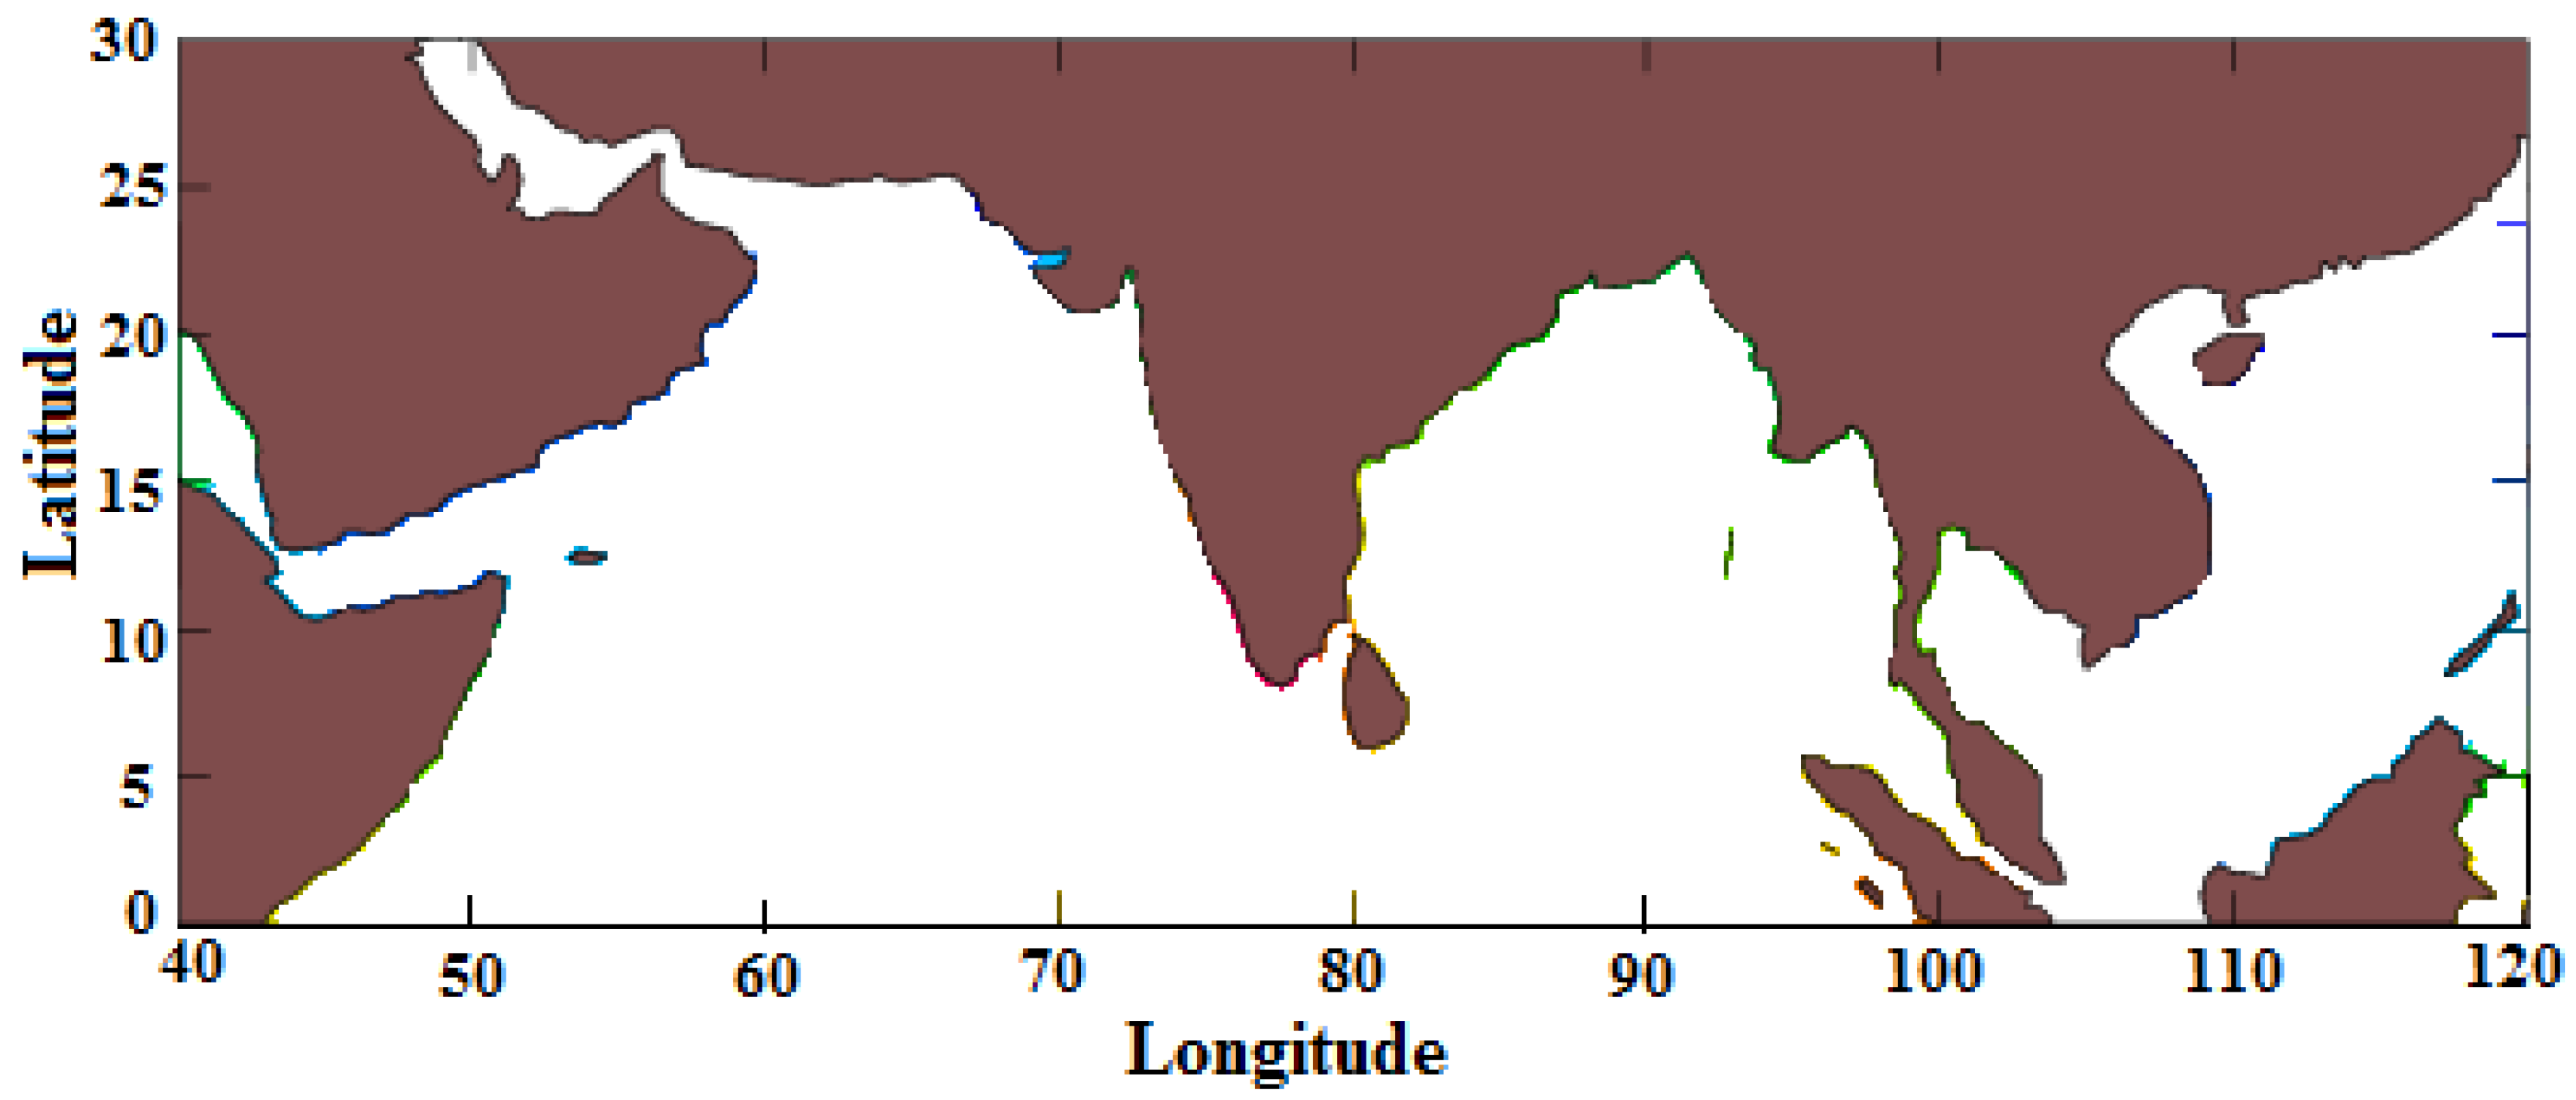
To study the dominant modes of ocean energy variability, we performed a spectral analysis of the OHC in the NIO (Figure 1, 0°–30° N; 40°–120° E) as one unit. The National Remote Sensing Centre (NRSC) computed the OHC and ocean mean temperature from surface to 50 m, 100 m, 150 m, 200 m, 300 m, 500 m, 700 m and up to 26 °C isotherm depth (i.e., TCHP) following Jagadeesh et al. [15]; the data isavailable on the NRSC website, Bhuvan (http://bhuvan.nrsc.gov.in). They used the artificial neural network (ANN) technique to estimate the above parameters from SST, sea surface height anomaly, and climatological OHC values at the respective depths. These products were at a spatial resolution of 0.25°× 0.25° spanning 0°–30° N and 40°–120° E on a daily basis for the period 1998–2014. Their ANN-based estimations compared well with the estimations computed using independent in situ temperature and salinity profiles from Argo profiling floats and the World Ocean Data Centre, with a scatter index of less than 0.025 and with a Pearson’s correlation coefficient of 0.93, which is significant at 99% confidence level.
Daily basin-wide averages were computed from these products for each layer (see Table 1 for the layer definitions). Spectral analysis was performed for each layer of these daily values during the study period. The statistical significance of each mode of variability was determined, and only those that were significant were examined indetail.
3. Results
The 17-year average OHC in the NIO, as a whole, for the seven ocean layers used in this analysis, the standard deviations (SDs) of OHC for each layer, and the coefficient of variations (CV) (defined as SD divided by the respective averages) are shown in Table 1. As expected, the OHC increased with depth, as this is the value integrated from surface to a specific depth. The OHC (SD) values increased from 570.3 (13.7) kJ/cm2 in the upper 50 m layer to 4057 (47.0) kJ/cm2 in the upper 700 m layer. Since the OHC increased with depth, its value and SD were greater for the deeper layers. Hence, we computed the relative magnitude of the SD to the average OHC as the CV, which decreased with depth. The surface to 700 m layer had 50% less CVthan that of the top layer. This indicates that the OHC per unit depth of near-surface waters was significantly more variable than that of deep waters. This happened because the upper layers of the ocean have maximum interaction with the atmosphere through wind, radiation, and turbulent heat fluxes, which have larger diurnal and seasonal variations. Large-scale upwelling and motion of the thermocline that have seasonal signals contributed to these changes.
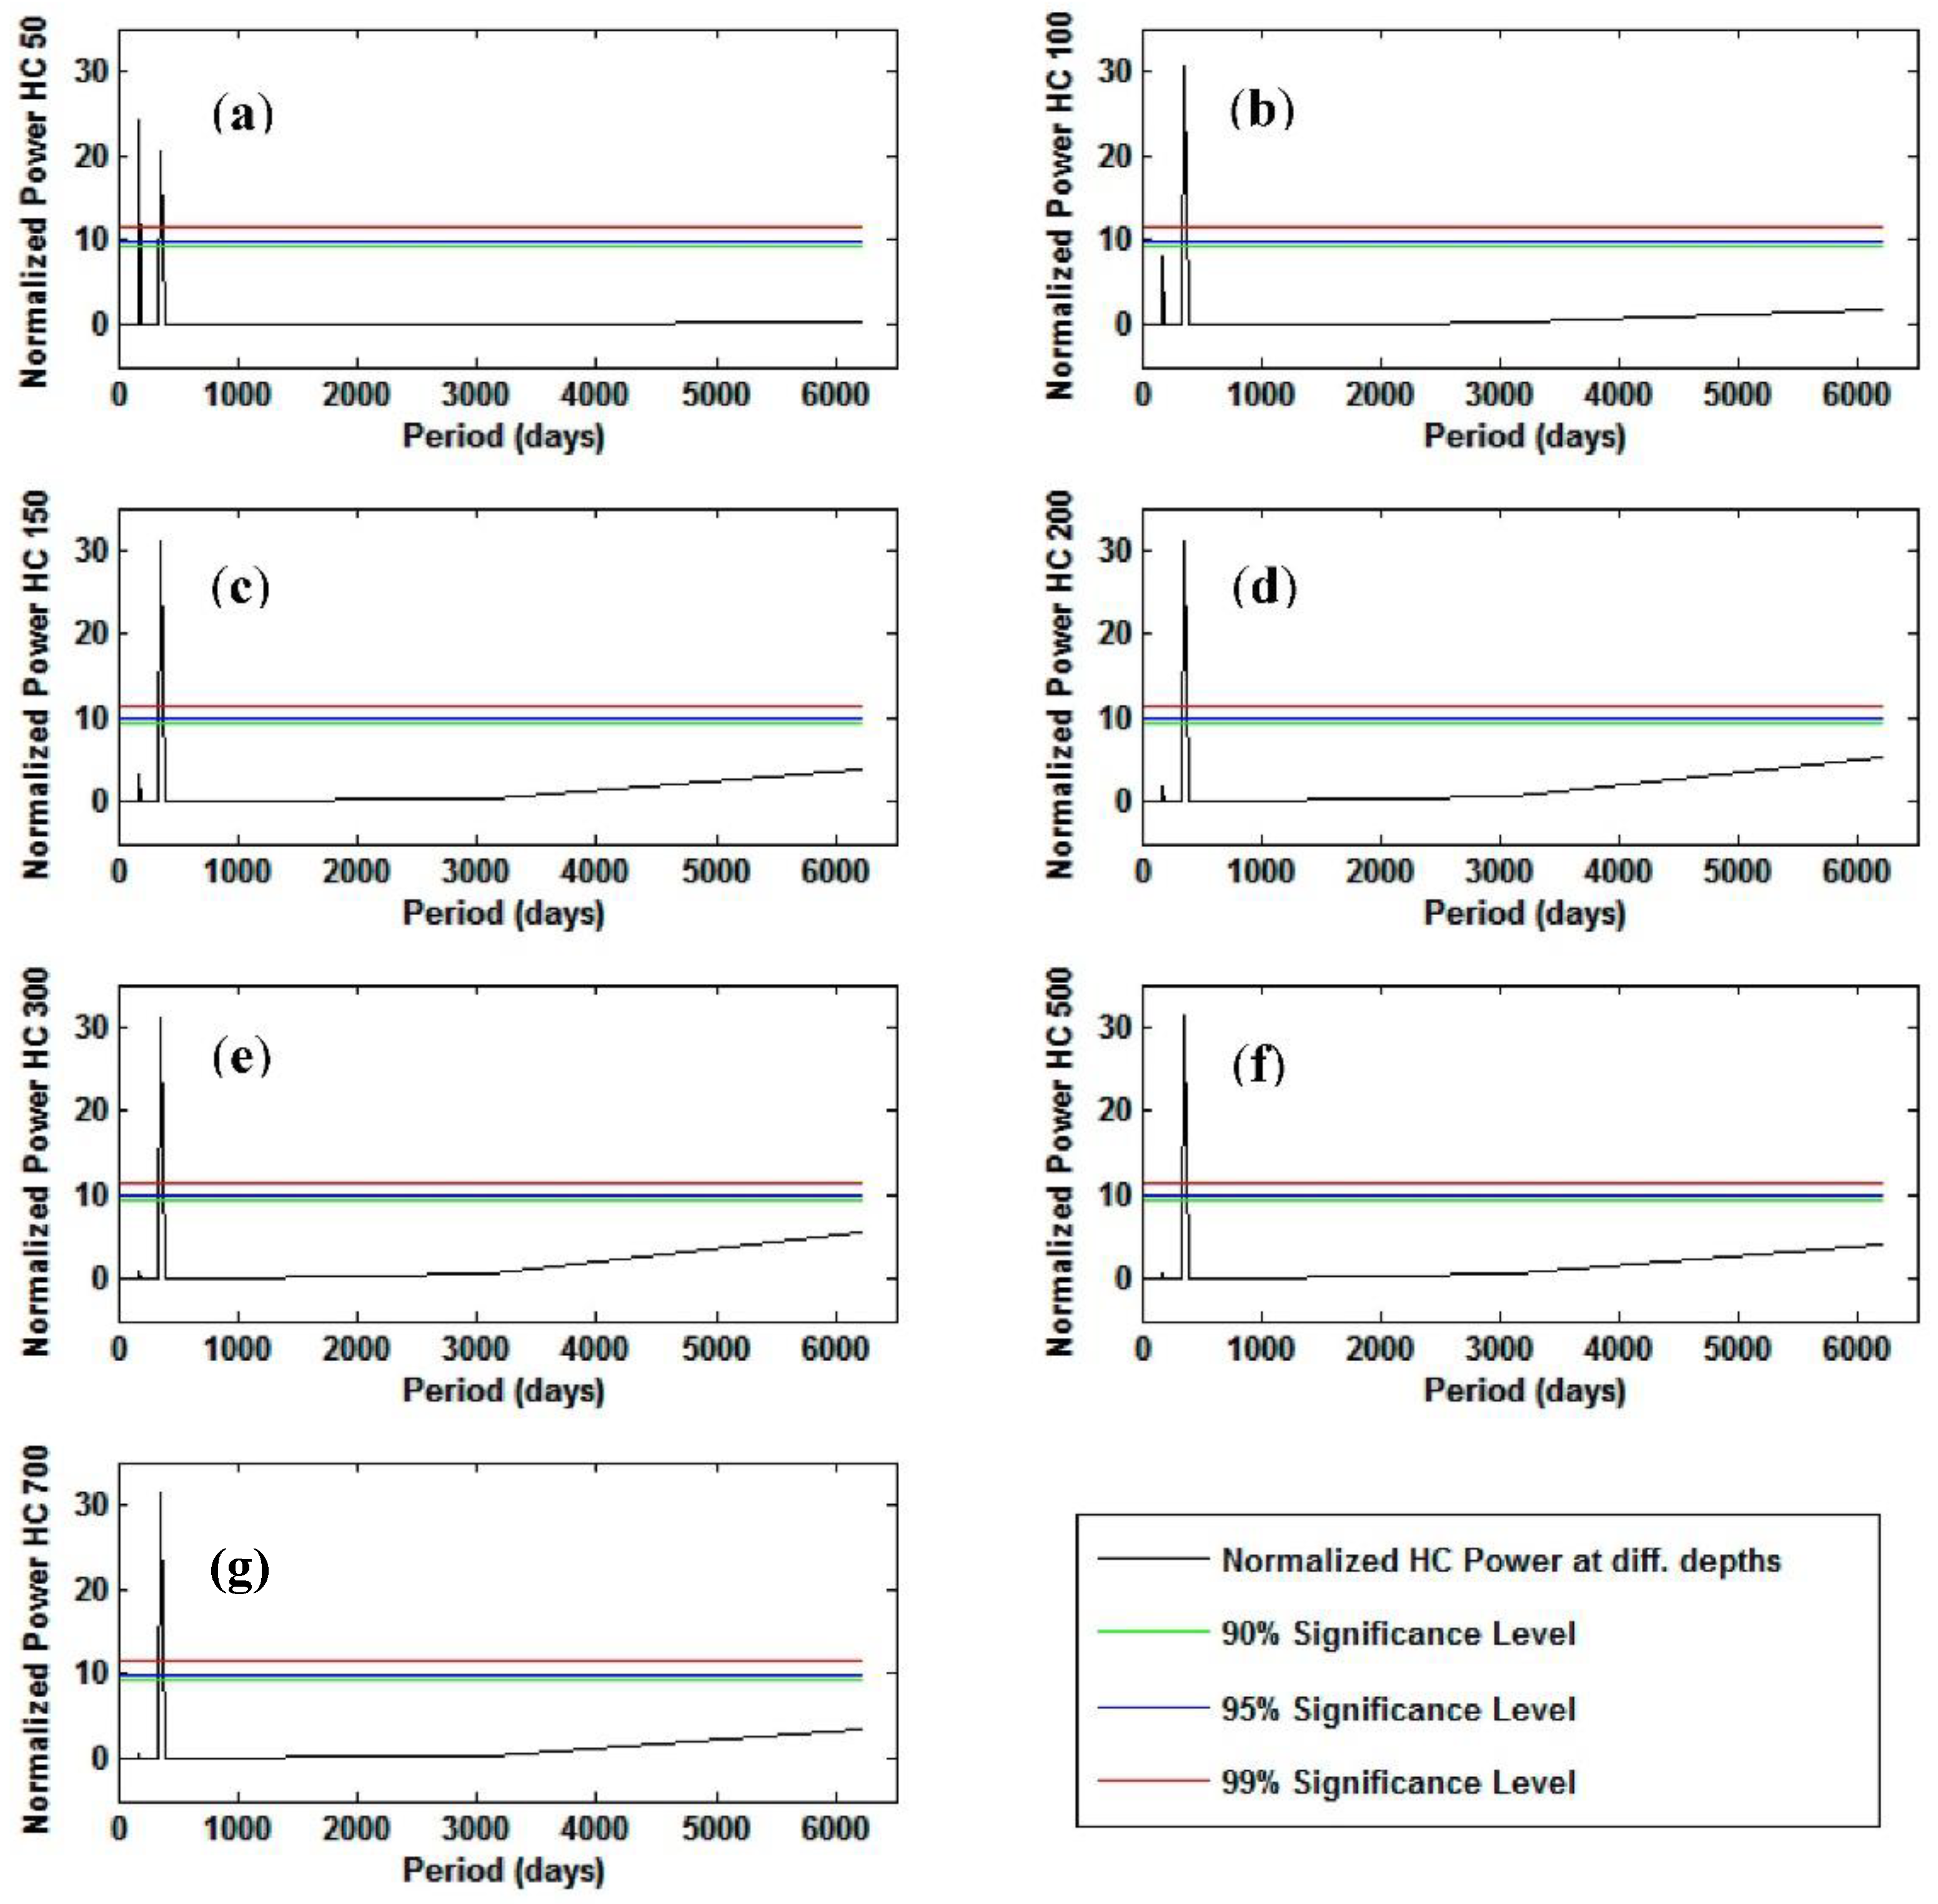
Spectral analyses were performed to identify the dominantmodes of OHC for each layer (Figure 2). Since OHC from the surface to different depths increasedwithdepth, the spectral powers were scaled by subtracting their mean and dividing by their SD. This scaling enabled a comparison between the seven different depths that we analyzed. The first three modes derived from the spectral analysis of basin-wide daily OHC average values; their normalized amplitudes are given in Table 2. The data had two primary modes of 182.5 and 365.0 days. The modes significant at more than 90% confidence are marked with an asterisk (*) in the table. The top 50 m layer alone had two significant dominantmodes of 182.5 (semiannual) and 365.0 (annual) days, both of which were significant at a 90% confidence level. The first layer’s semiannual mode had a normalized amplitude of 24.08 that dominated over the annual mode, which had a normalized amplitude of 20.41. Although the normalized amplitudes of the first two modes were similar with a difference of 3.67 in the amplitude for the 50 m layer, the difference increased with depth. The difference was as high as 28.01 at the upper 700 m layer. With the exception of the 50 m layer, all other layers had only one significant dominantmode of 365 days. The dominance of semiannual mode (with a period of 182.5 days) in the upper ocean layer may be attributed to a combination of radiative, dynamic, and convective processes. The NIO gets heated up by annual solar heating between the months of January and May. The ocean starts losing the heat with the onset of the Asian summer monsoon (ASM) in June. The atmospheric circulation associated with the ASM is one of the most dominant components of global circulation and the hydrological cycle. Some of the important characteristics of the ASM includea strong low-level Somali Jet at the east coast of Africa and the large-scale convective activity with associated precipitation in the Bay of Bengal and the Indian subcontinent during the monsoon season (June to September). The western part of the Arabian Sea experiences strong upwelling and cooling due to Somali Jet during the monsoon season. Strong surface-level monsoon winds over the ocean surface also result in the evaporative cooling ofthe Arabian Sea. By contrast, a large part of the Bay of Bengal experiences convective activity during the monsoon season, which results in the cooling of the ocean surface, first, due to the blocking of solar radiation by clouds and second, due to large-scale precipitation. Thus, a number of different physical processes work together during the monsoon season to cool the ocean surface in the NIO in the monsoon season. While the wintertime cooling of the upper ocean can be primarily attributedto the annual solar cycle, the summertime cooling is mainly driven by the atmosphere–ocean dynamics and convective processes. This phenomenon may be the main causative factor for the observed semiannual mode in the OHC time series of upper oceanic layers. After the end of the monsoon season in October, when the atmospheric flow has weakened and the convective activity has reduced, the solar radiative energy is again available for the ocean to heat up. However, this second radiative heating phase is short-lived due to the southward migration of the sun and the onset of winter season after October. Our analysis indicated that the effect of seasonal interactions with the atmosphere was mostly limited to the upper ocean layers where the OHC displayed the variability on the semiannual time scale. In the deeper layers, the contribution of the semiannual mode to total OHC variability became less and less significant with the increasing depth, suggesting lesser control of the atmospheric processes on the deeper oceanic energy structure. However, a detailed analysis is required to understand the interaction between the OHC and the atmospheric phenomena.
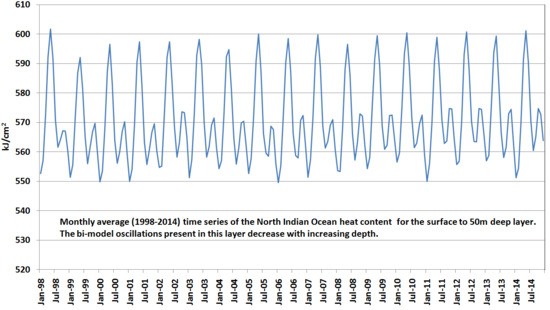
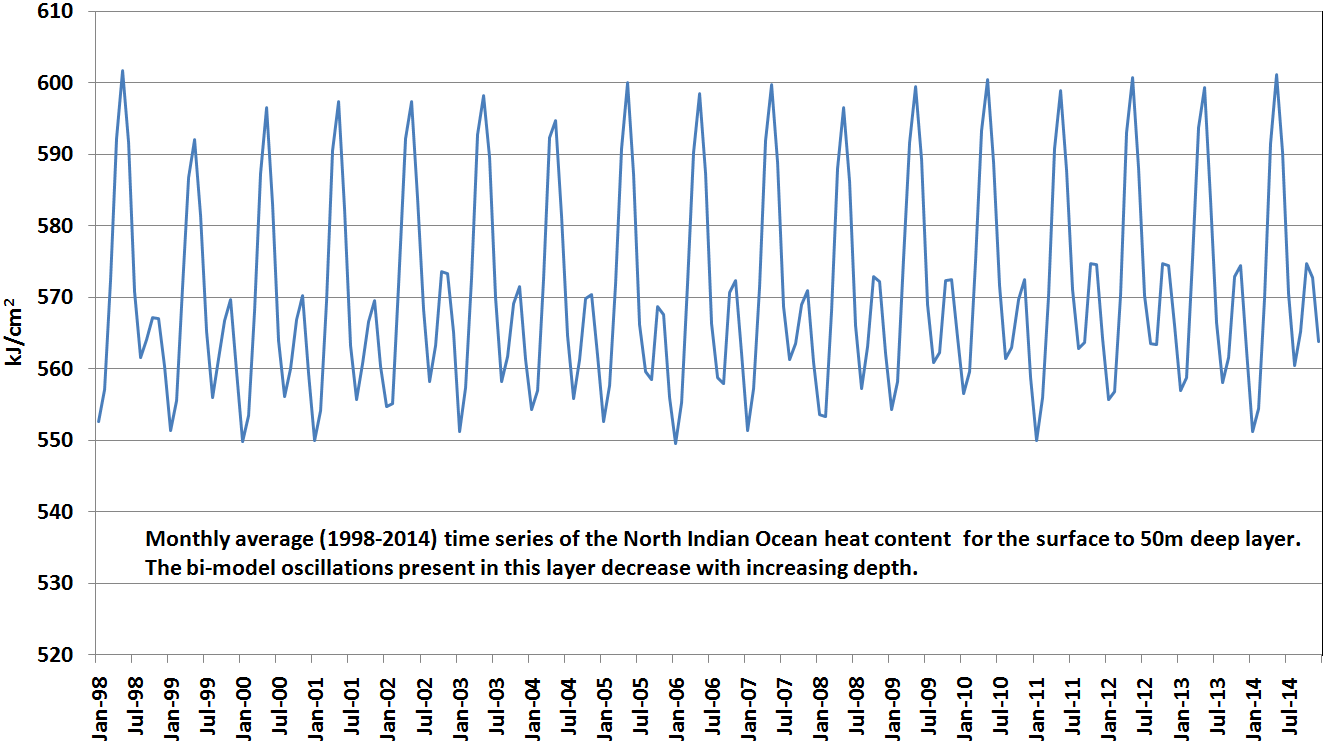
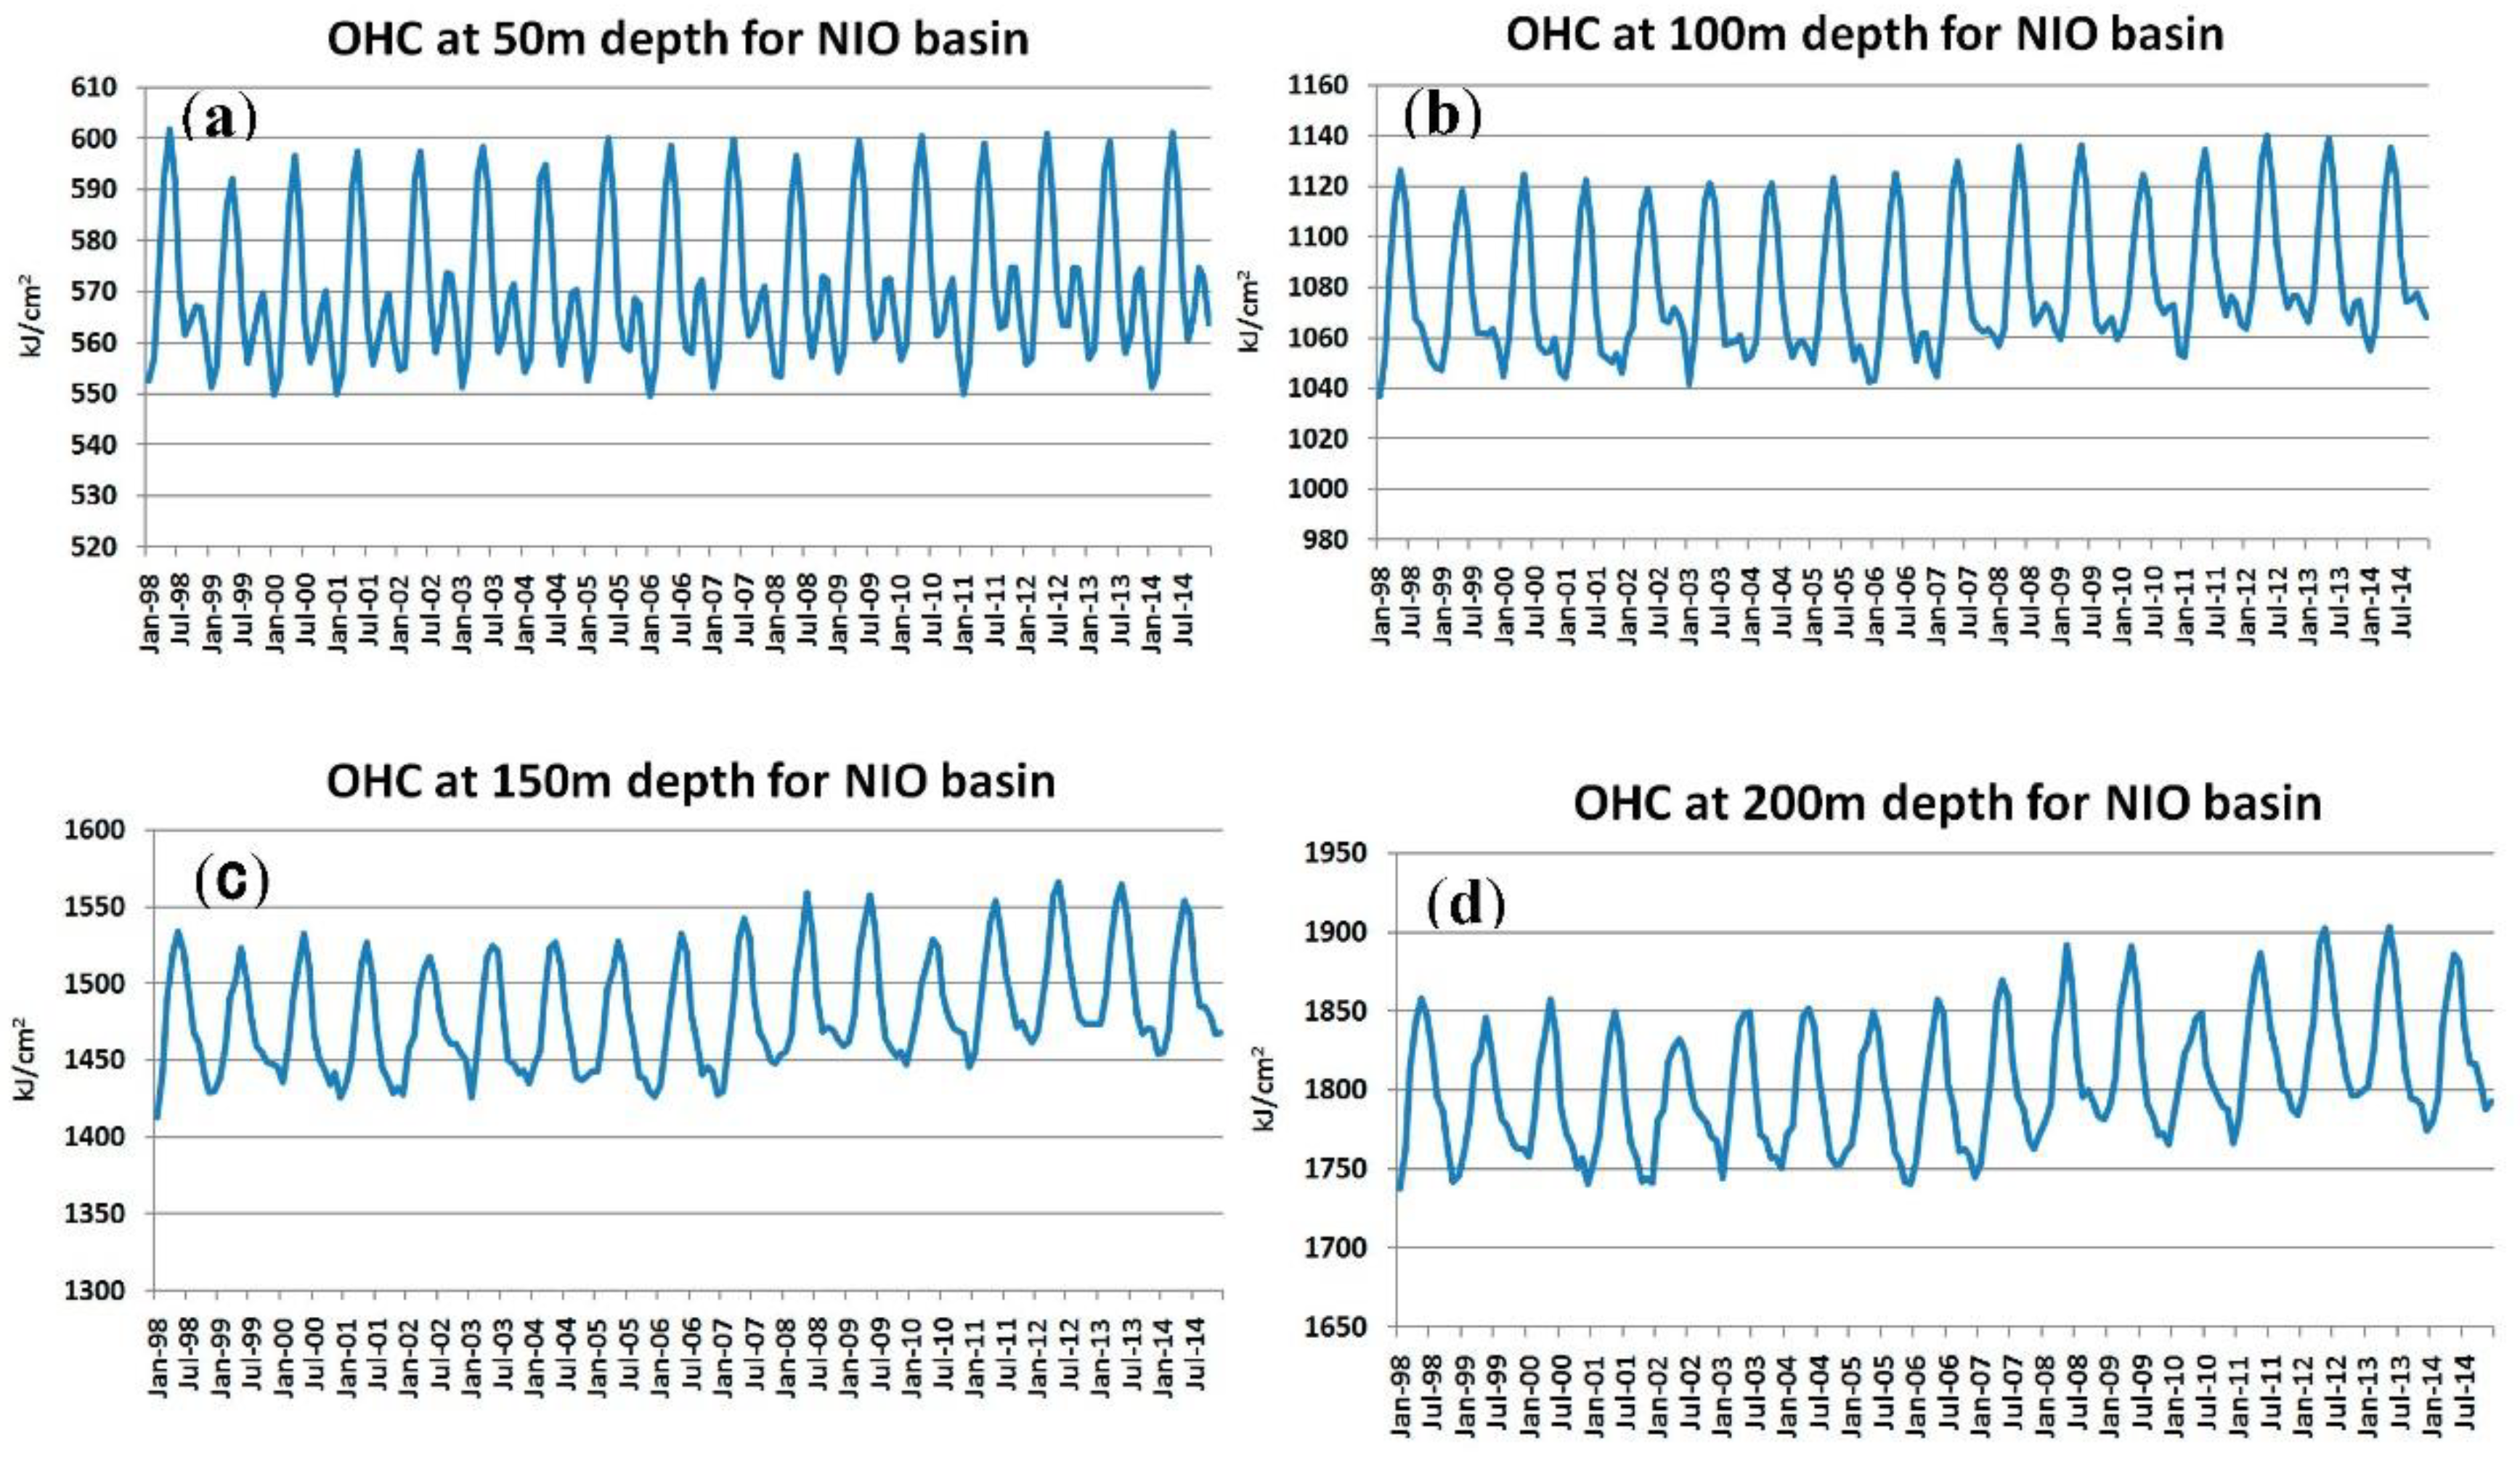
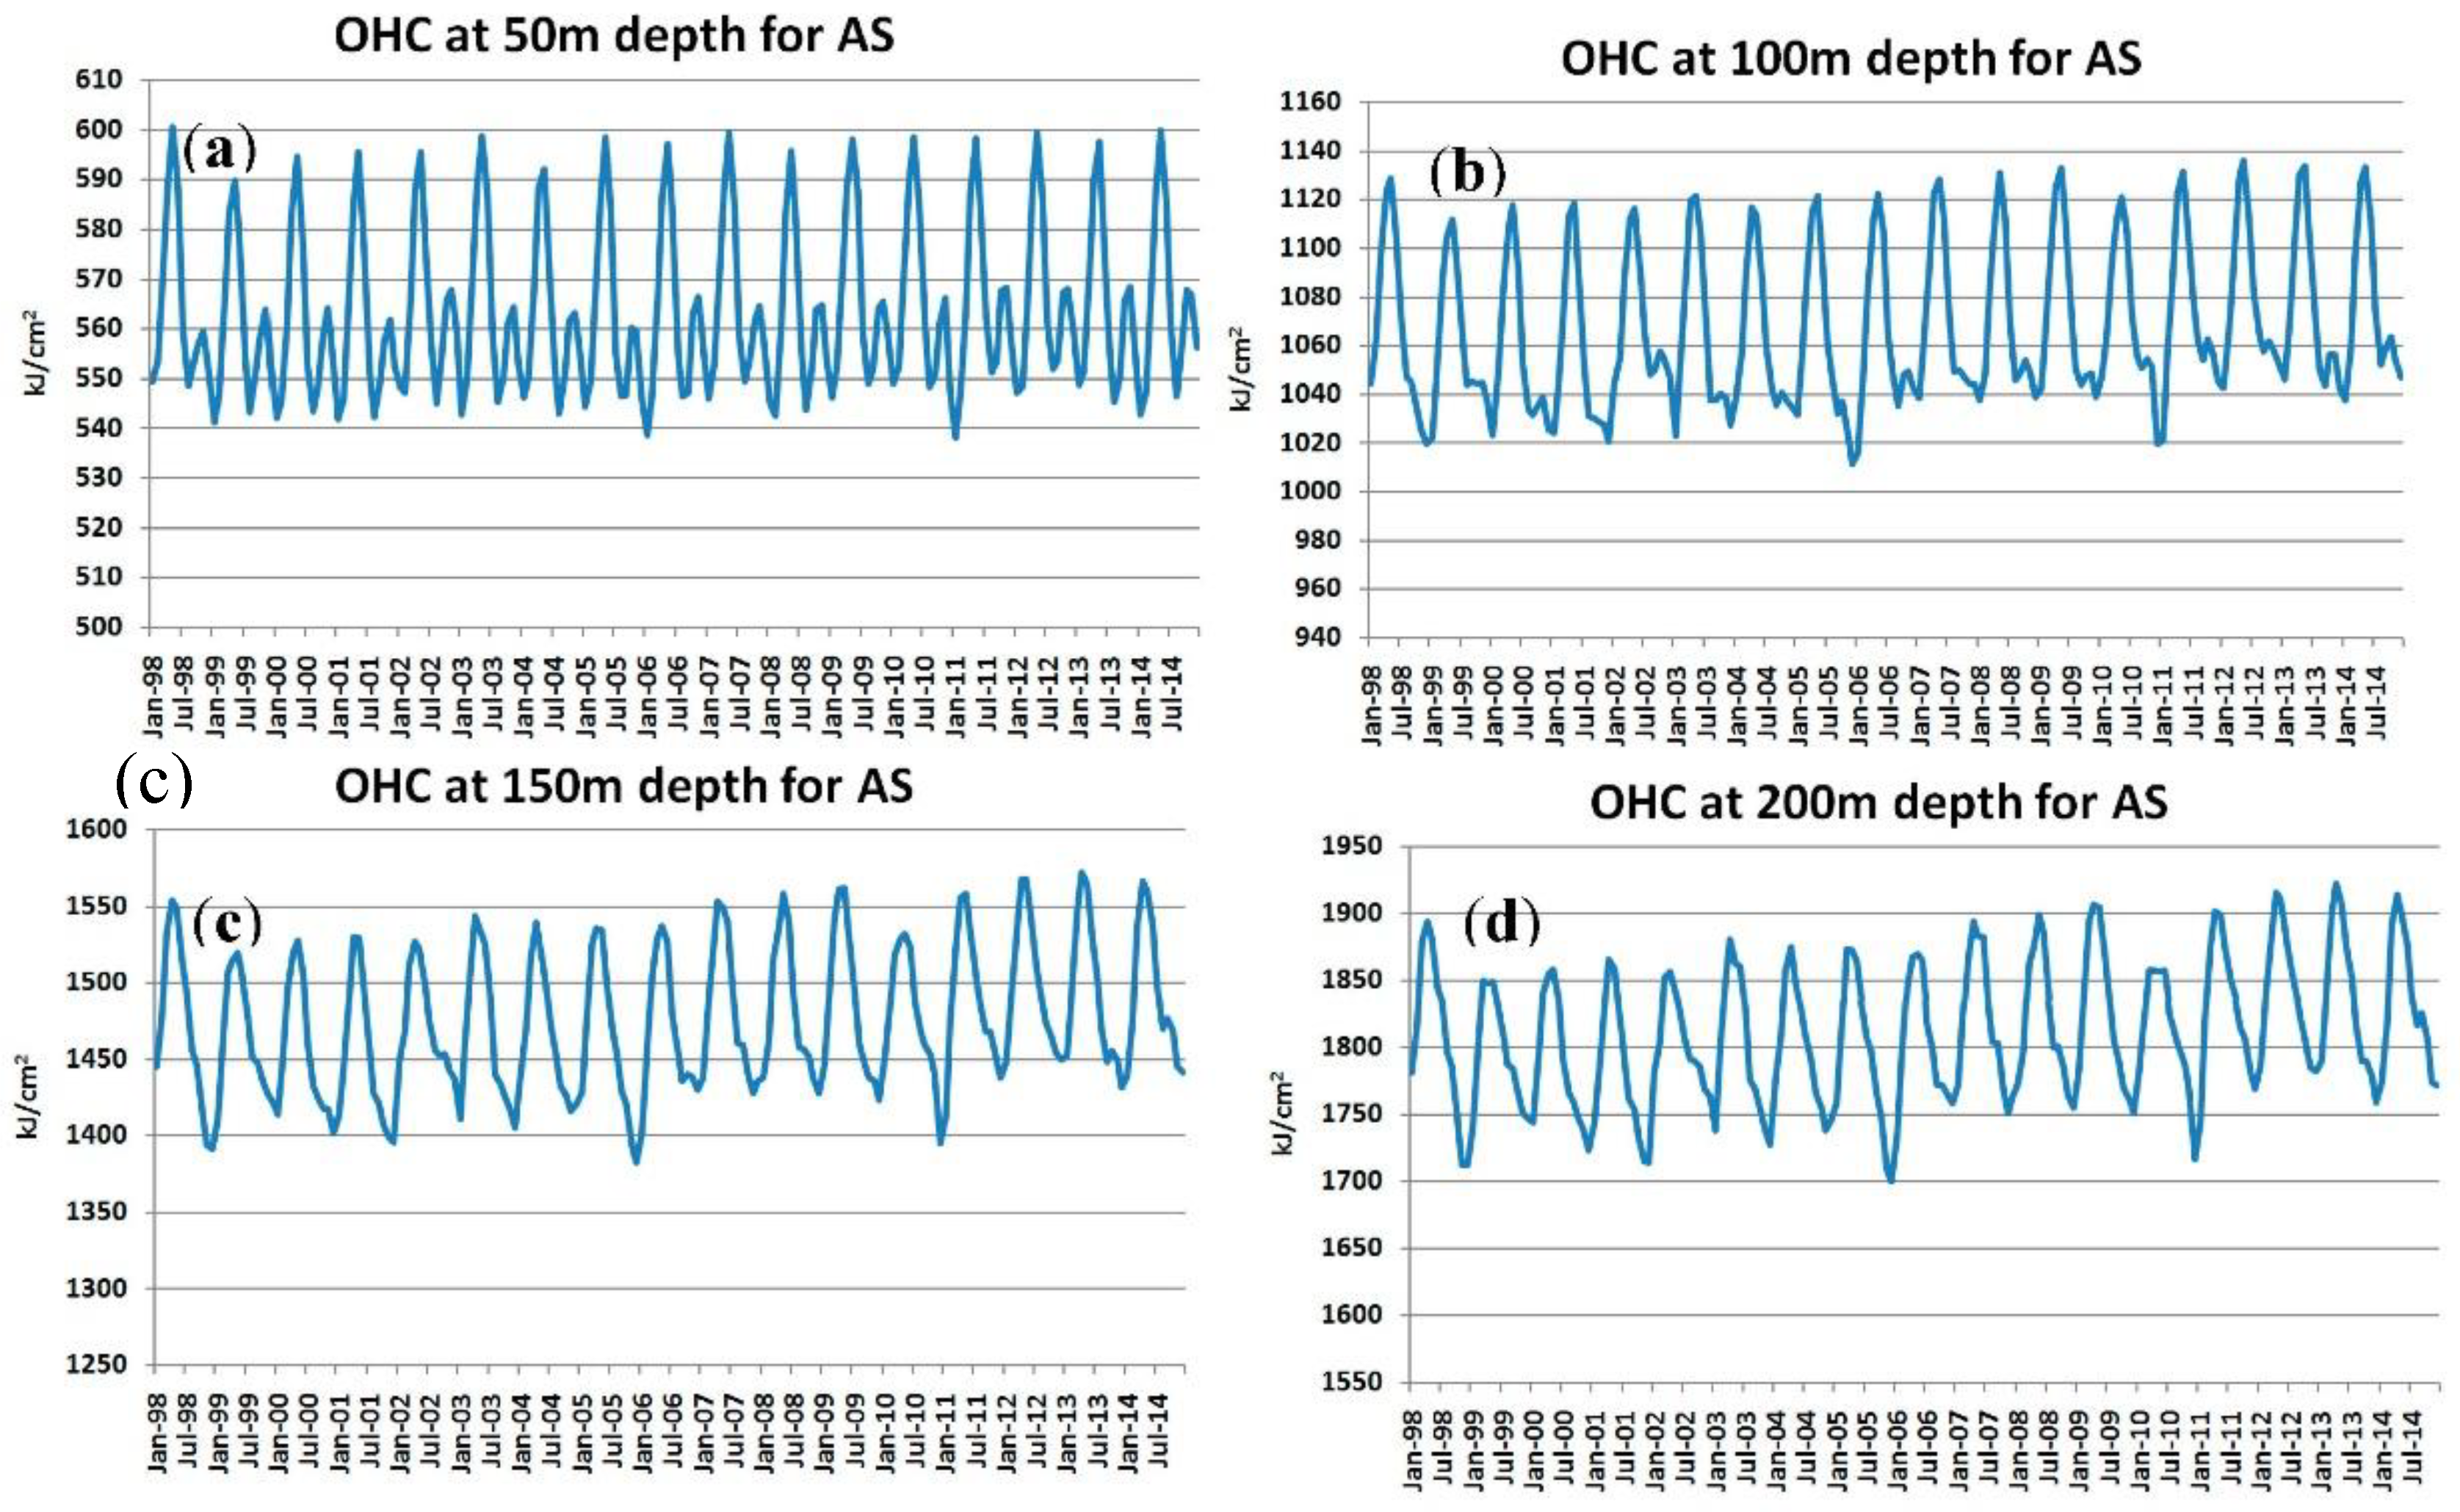
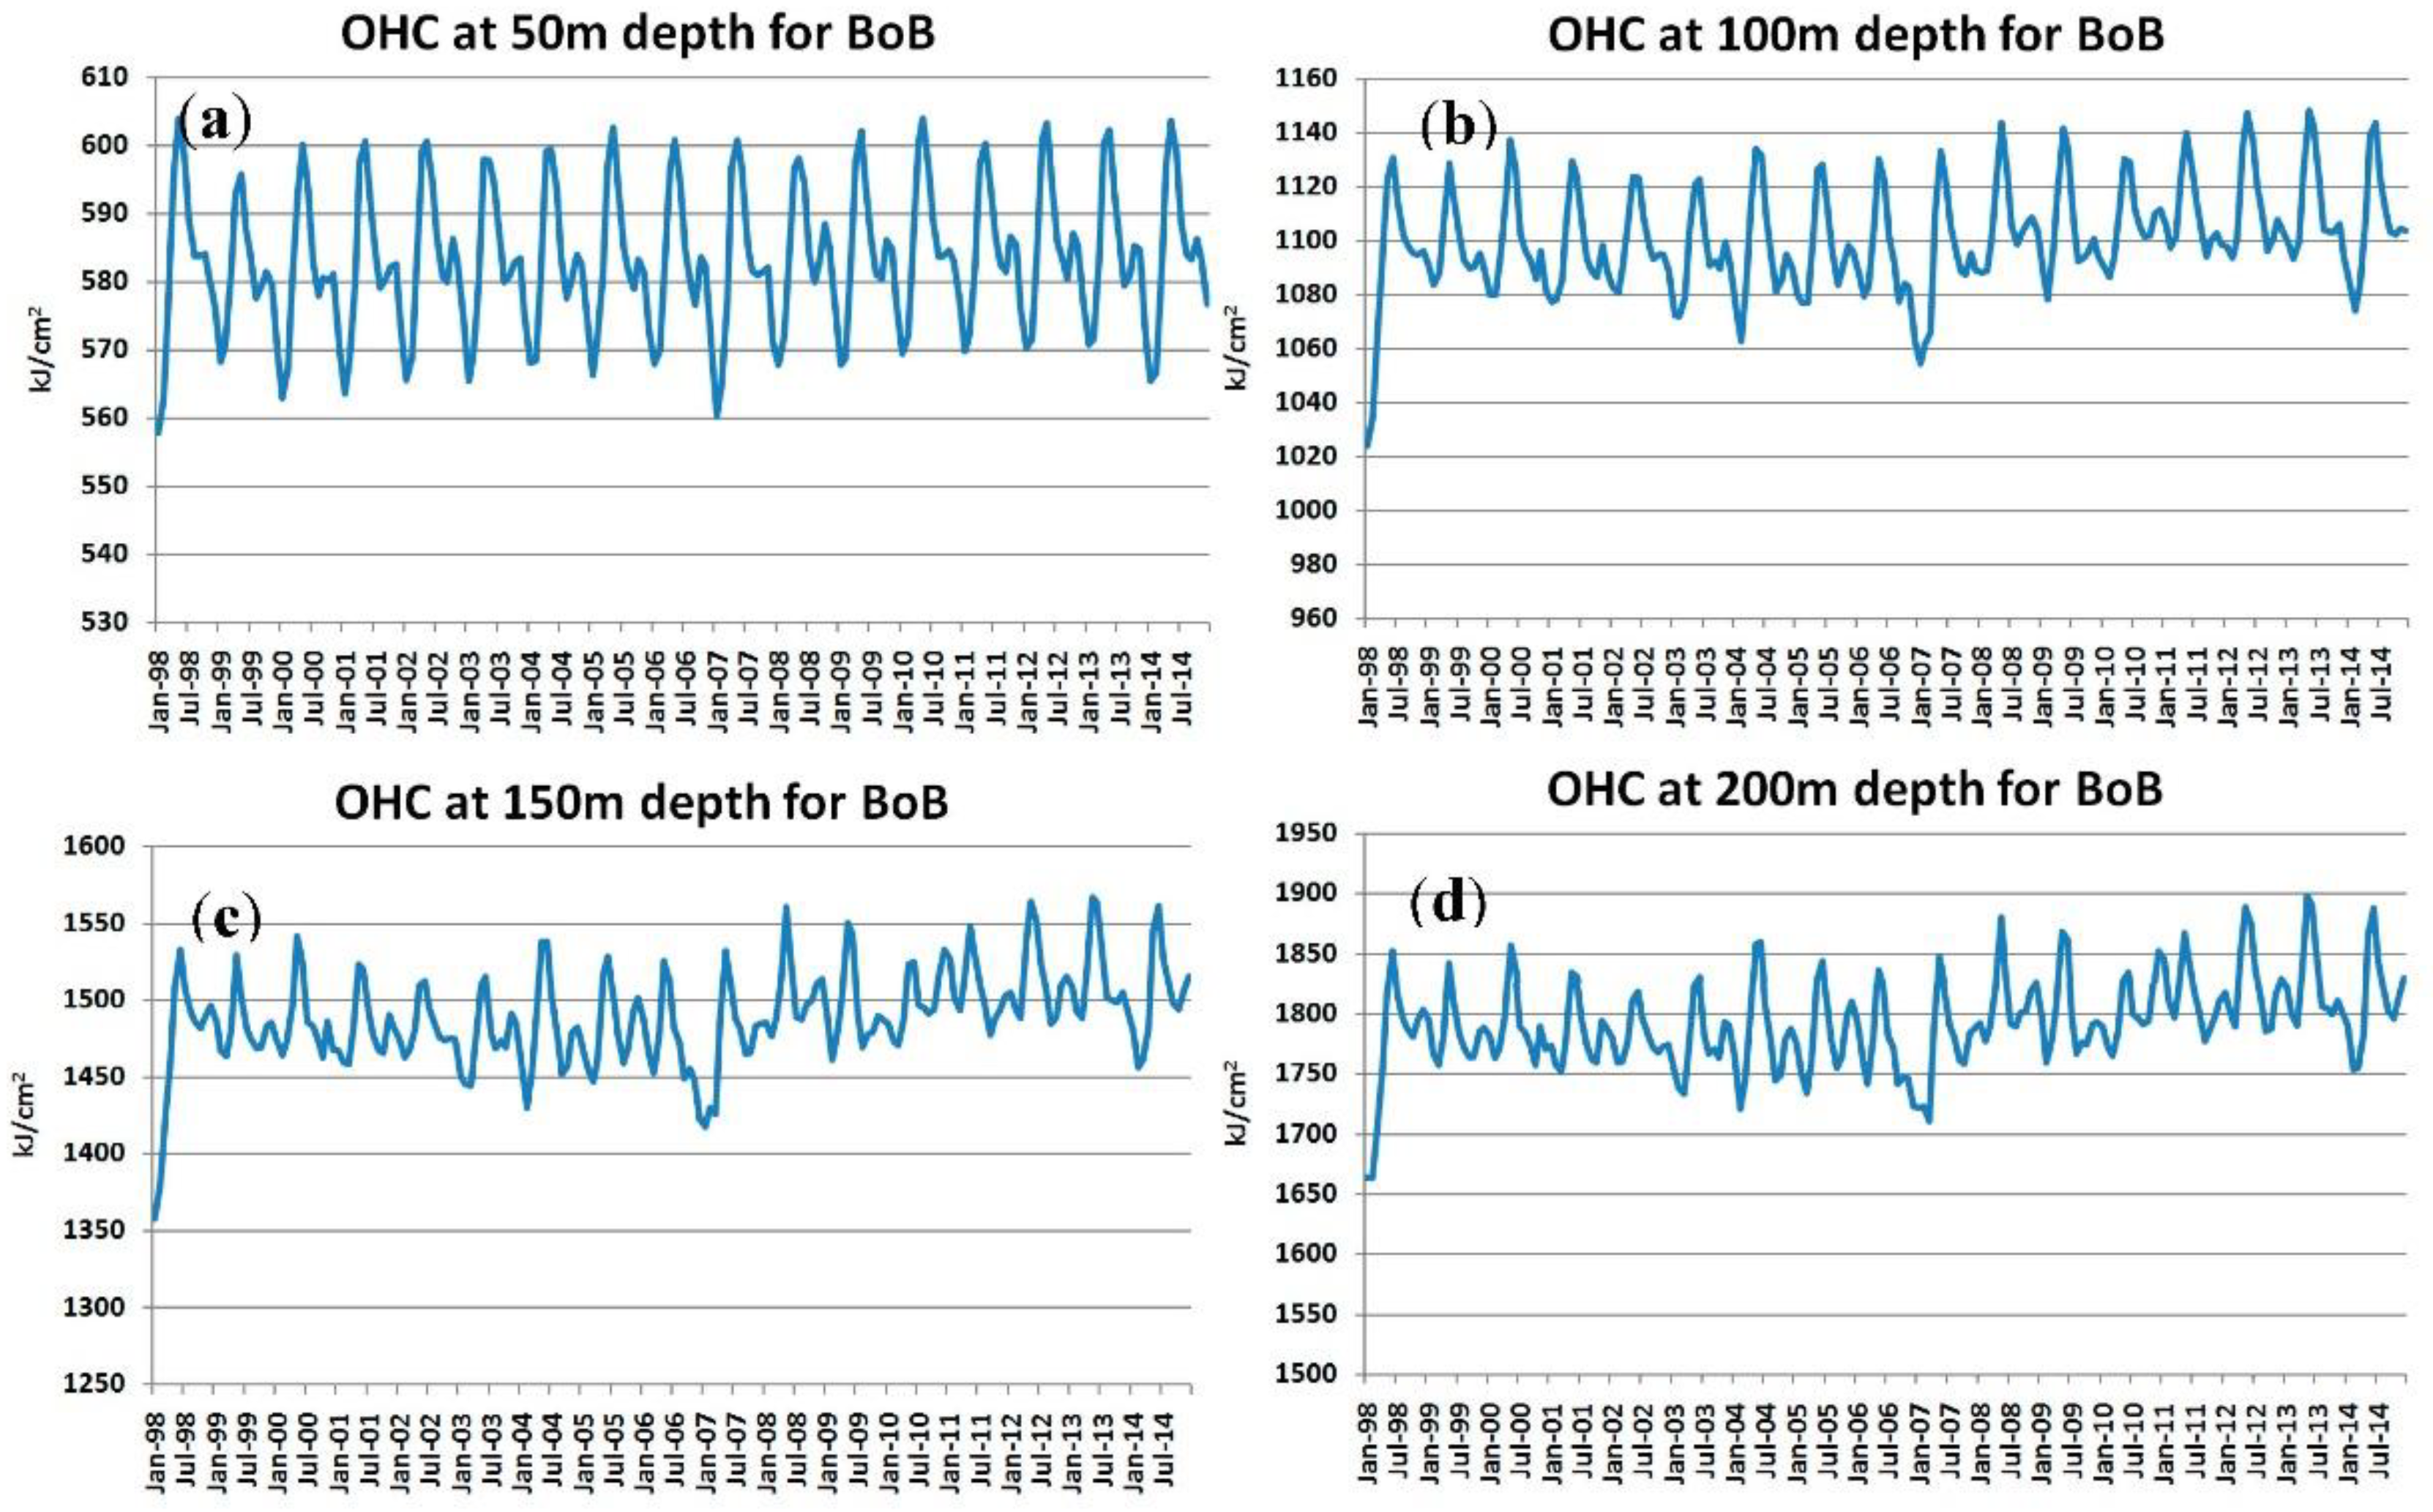
To further study the periodicity, time series of OHC from the surface to 50 m, 100 m, 150 m, and 200 m were analyzed separately for the NIO, Arabian Sea (AS), and Bay of Bengal (BoB) (Figure 3, Figure 4 and Figure 5). For the surface to 50 m layer in NIO (Figure 3), the lowest and highest values of OHC were in January and Mayevery year, respectively, which was mainly caused by minimum and maximum solar radiation during winter and summer, respectively. Monsoon started in June and, as a result, the irradiation reaching the surface decreased due to increased cloudiness. The second minimum was inAugust and the second maximum was in October/November. The OHC reduced by January and the cycle then continued. The peak to peak variation varied from 43 kJ/cm2 to 50 kJ/cm2. The first mode of 182.5 days was due to this variation in the OHC. As the layer depth increased, the rise in OHC after August reduced and hence the 365-day cycle was significant for the deeper layers. Time series for the AS (Figure 4) and BoB (Figure 5) were almost similar to those of NIO. However, the drop in OHC of the upper 50 m layer in August in BoB was not as prominent as in the AS, which was due to less cloudiness in this region.
4. Discussions and Conclusions
The dominant modes of the OHC in different upper layers of the NIO—from the surface to a depth of 50 m, 100 m, 150 m, 200 m, 300 m, 500 m, and 700 m—were analyzed. Unlike the equatorial Pacific Ocean, there are no dominant trade winds over the tropical Indian Ocean. The variation of upper OHC in the NIO was remarkably affected by the strong annual cycle of meridional heat transport by Ekman currents in the Ekman layer (which is deeper than 50 m). The meridional Ekman heat transport was primarily caused by the dominant monsoon cycle (i.e., southwest winds during summer monsoons and northeast winds during winter monsoons). Hence, the strong annual cycle of NIO OHC in the entire upper layer (the entire Ekman layer, including the upper 50 m layer) wasseen in the observed variability of the OHC. In addition to the strong annual cycle, the semiannual cycle was dominant in the upper 50 m layer. The OHC of the upper 50 m layer can be greatly influenced by surface heat fluxes from at least two major sources: (1) solar radiation (the sun crossing the NIO twice a year) and (2) latent heat and/or sensible heat flux(es) (cold northeast winds from the continent during boreal winter cooling the upper layer efficiently, and southwest winds that are relatively warmer during boreal summer cooling the NIO less efficiently). Another cause for the variations in the OHC of the top 50 m layer isthe cyclone activity requiring energy from the ocean, leading to variations of OHC in the upper 50 m layer on the interannual time scales [16]. However, to get this signature, daily values have to be analyzed. These contributions to semiannual variability were likely intrinsically linked rather than independent. Therest of the layers had only one significant dominant mode of 365 days with a normalized amplitude of less than 32. Therefore, if we assume that most of the thermal energy for the atmospheric phenomenon, particularly monsoons, comes from the ocean (including the ocean variability due to absorbing solar radiation) and dominates the air/sea coupling, then it is the top 50 m layer that matters the most. Thus, we deduce that this layer is most important in providing the thermal energy for both cyclones and monsoon as this layer has both significant annual and semiannual modes of OHC variability. However, the influence of OHC on cyclones should be of a much smaller scale than a month. Besides, the conclusion of Lin et al. [17] that the top 80m layer influences the development of tropical cyclones in the northern Pacific Ocean is worth exploring in the Indian Ocean. Since the present resolution of the data was 50 m, we could not carry out this analysis. Similarly, we could not carry out other modeling and observational-based studies reported earlier [18,19,20]. These studies require detail analysis.
In this article, while we presented the dominant modes of OHC of different ocean layers, we did not carry out detailed analysis to conclude the layers and the time scales of the upper ocean heat content that influence the tropical cyclones and monsoons. This would require very complex modeling efforts, which is beyond the scope of the present study.
Author Contributions
M.M.A. conceived the concept of the study and wrotethe draft document. N.S. carried out the spectral analysis and contributed to the draft. M.S.K. carried out all the computations and prepared the tables and figures. Y.Z. contributed in finalizing of the draft. M.B. gave overall guidance and assisted in editing and finalizing of the paper. C.M.K. contributed in atmospheric interpretation. C.V.R. carried out computations.
Acknowledgments
We dedicate this manuscript to John C. Puzzello, formerly from Georgetown University, with whom we started the work on this paper and whose contributions to our work have been significant. Unfortunately, he passed away prior to submission. The OHC data were obtained from the National Remote Sensing Centre Bhuvan Website (nrsc.gov.in/bhuvan). The authors acknowledge the financial support from NASA/JPL under the Ocean Vector Winds Science Team project (Contact #1419699). The authors also acknowledge the support of the Ocean Observing and Monitoring Division, Climate Program Office, National Oceanic and Atmospheric Administration, U.S. Department of Commerce, which is administrated by the Northern Gulf Institute. We also acknowledge partial support from NASA PO and NASA NEWS. The authors thank the two anonymous referees for their constructive and useful comments due to which the quality of the paper improved.
Conflicts of Interest
The authors have no conflict of interests.
References
- Leipper, D.F.; Volgenau, D. Hurricane heat potential of the Gulf of Mexico. J. Phys. Oceanogr. 1972, 2, 218–224. [Google Scholar] [CrossRef]
- Shay, L.K.; Goni, G.J.; Black, P.G. Effects of a warm oceanic feature on Hurricane Opal. Mon. Weather Rev. 2000, 128, 1366–1383. [Google Scholar] [CrossRef]
- Mei, W.; Xie, S.P.; Primeau, F.; McWilliams, J.C.; Pasquero, C. Northwestern Pacific typhoon intensity controlled by changes in ocean temperatures. Sci. Adv. 2015, 1, e1500014. [Google Scholar] [CrossRef] [PubMed] [Green Version]
- Mainelli, M.; DeMaria, M.; Shay, L.K.; Goni, G. Application of oceanic heat content estimation to operational forecasting of recent Atlantic category 5 hurricanes. Weather Forecast. 2008, 23, 3–16. [Google Scholar] [CrossRef]
- Gray, W.M. Hurricanes: Their formation, structure and likely role in the tropical circulation. Meteorol. Trop. Oceans 1979, 77, 155–218. [Google Scholar]
- Ali, M.M.; Jagadeesh, P.S.V.; Jain, S. Effect of eddies on Bay of Bengal cyclone intensity. EOS Trans. AGU 2007, 88. [Google Scholar] [CrossRef]
- Wada, A.; Usui, N. Importance of tropical cyclone heat potential for tropical cyclone intensity and intensification in the western North Pacific. J. Oceanogr. 2007, 63, 427–447. [Google Scholar] [CrossRef]
- Lin, I.I.; Wu, C.C.; Pun, I.F.; Ko, D.S. Upper-ocean thermal structure and the western North Pacific category 5 typhoons. Part I: Ocean features and the category 5 typhoons’ intensification. Mon. Weather Rev. 2008, 136, 3288–3306. [Google Scholar] [CrossRef]
- Pun, I.F.; Lin, I.I.; Lo, M.H. Recent increase in high tropical cyclone heat potential area in the Western North Pacific Ocean. Geophys. Res. Lett. 2013, 40, 4680–4684. [Google Scholar] [CrossRef] [Green Version]
- Goni, G.J.; Knaff, J.A.; Lin, I.I. Tropical cyclones: Tropical cyclone heat potential. Special Supplement to the Bulletin of the American Meteorological Society; In State of the Climate in 2014; Blunden, J., Arndt, D.S., Eds.; National Oceanic and Atmospheric Administration: Silver Spring, MD, USA, 2015; Volume 96, pp. S121–S122. [Google Scholar]
- Ali, M.M.; Kashyap, T.; Nagamani, P.V. Use of sea surface temperature for cyclone intensity prediction needs a relook. EOS Trans. Am. Geophys. Union 2013, 94, 177. [Google Scholar] [CrossRef]
- Sharma, N.; Ali, M.M. Importance of Ocean Heat Content for Cyclone Studies. Oceanogr. Open Access 2014, 2, 124. [Google Scholar] [CrossRef]
- Ali, M.M.; Nagamani, P.V.; Sharma, N.; VenuGopal, R.T.; Rajeevan, M.; Goni, G.J.; Bourassa, M.A. Relationship between ocean mean temperatures and Indian summer monsoon rainfall. Atmos. Sci. Lett. 2015, 16, 408–413. [Google Scholar] [CrossRef] [Green Version]
- Nagamani, P.V.; Ali, M.M.; Goni, G.J.; UdayaBhaskar, T.V.S.; McCreary, J.P.; Weller, R.A.; Pezzullo, J.C. Heat content of the Arabian Sea Mini Warm Pool is increasing. Atmos. Sci. Lett. 2016, 17, 39–42. [Google Scholar] [CrossRef]
- Jagadeesh, P.S.V.; Kumar, M.S.; Ali, M.M. Estimation of Heat Content and Mean Temperature of Different Ocean Layers. IEEE J. Sel. Top. Appl. Earth Obs. Remote Sens. 2015, 8, 1251–1255. [Google Scholar] [CrossRef]
- Yanase, W.; Satoh, M.; Taniguchi, H.; Fujinami, H. Seasonal and intra seasonal modulation of tropical cyclo genesis environment over the Bay of Bengal during the extended summer monsoon. J. Clim. 2012, 25, 2914–2930. [Google Scholar] [CrossRef]
- Lin, I.I.; Black, P.; Price, J.F.; Yang, C.Y.; Chen, S.S.; Lien, C.C.; Harr, P.; Chi, N.H.; Wu, C.C.; D’Asaro, E.A. An ocean coupling potential intensity index for tropical cyclones. Geophys. Res. Lett. 2013, 40, 1878–1882. [Google Scholar] [CrossRef] [Green Version]
- Balaguru, K.; Chang, P.; Saravanan, R.; Leung, L.R.; Xu, Z.; Li, M.; Hsieh, J.S. Ocean barrier layers’ effect on tropical cyclone intensification. Proc. Natl. Acad. Sci. USA 2012, 109, 14343–14347. [Google Scholar] [CrossRef] [PubMed]
- Wang, J.W.; Han, W.; Sriver, R.L. Impact of tropical cyclones on the ocean heat budget in the Bay of Bengal during 1999: 1. model configuration and evaluation. J. Geophys. Res. 2012. [Google Scholar] [CrossRef]
- Wang, J.W.; Han, W.; Sriver, R.L. Impact of tropical cyclones on the ocean heat budget in the Bay of Bengal during 1999: 2. Processes and interpretations. J. Geophys. Res. 2012. [Google Scholar] [CrossRef]
Figure 1.
Map showing the study region.

Figure 2.
Normalized heat content values (in black) at surface to (a) 50 m, (b) 100 m, (c) 150 m, (d) 200 m, (e) 300 m, (f) 500 m and (g) 700 m depths. Significance levels at 90%, 95%, and 99% are marked in green, blue, and red, respectively.
Figure 2.
Normalized heat content values (in black) at surface to (a) 50 m, (b) 100 m, (c) 150 m, (d) 200 m, (e) 300 m, (f) 500 m and (g) 700 m depths. Significance levels at 90%, 95%, and 99% are marked in green, blue, and red, respectively.

Figure 3.
Time series of the North Indian Ocean (NIO) ocean heat content(OHC) from 1998 to 2014 for surface to (a) 50 m, (b) 100 m, (c) 150 m, and (d) 200 m depth.
Figure 3.
Time series of the North Indian Ocean (NIO) ocean heat content(OHC) from 1998 to 2014 for surface to (a) 50 m, (b) 100 m, (c) 150 m, and (d) 200 m depth.

Figure 4.
Time series of the Arabian Sea (AS) OHC from 1998 to 2014 for surface to (a) 50 m, (b) 100 m, (c) 150 m, and (d) 200 m depth.
Figure 4.
Time series of the Arabian Sea (AS) OHC from 1998 to 2014 for surface to (a) 50 m, (b) 100 m, (c) 150 m, and (d) 200 m depth.

Figure 5.
Time series of the Bay of Bengal OHC from 1998 to 2014 for surface to (a) 50 m, (b) 100 m, (c) 150 m, and (d) 200 m depth.
Figure 5.
Time series of the Bay of Bengal OHC from 1998 to 2014 for surface to (a) 50 m, (b) 100 m, (c) 150 m, and (d) 200 m depth.


Table 1.
Average, standard deviation (SD), and coefficient of variation (CV) of the ocean heat content (OHC) integrated from the surface to 50 m, 100 m,150 m, 200 m, 300 m, 500 m, and 700 m depths.
Table 1.
Average, standard deviation (SD), and coefficient of variation (CV) of the ocean heat content (OHC) integrated from the surface to 50 m, 100 m,150 m, 200 m, 300 m, 500 m, and 700 m depths.
| Depth (m) | Average OHC (kJ/cm2) | SD | CV (%) |
|---|---|---|---|
| 50 | 570.3 | 13.7 | 2.4 |
| 100 | 1077.5 | 22.6 | 2.1 |
| 150 | 1478.5 | 29.7 | 2.0 |
| 200 | 1801.5 | 33.3 | 1.9 |
| 300 | 2346.9 | 37.5 | 1.6 |
| 500 | 3264.6 | 42.4 | 1.3 |
| 700 | 4057.7 | 47.0 | 1.2 |
Table 2.
First three modes (days) of the spectral analysis and their normalized amplitudes of the OHC of the surface to 50 m, 100 m, 150 m, 200 m, 300 m, 500 m, and 700 m depths. Values marked with an asterisk (*) are significant at a 99% confidence level.
Table 2.
First three modes (days) of the spectral analysis and their normalized amplitudes of the OHC of the surface to 50 m, 100 m, 150 m, 200 m, 300 m, 500 m, and 700 m depths. Values marked with an asterisk (*) are significant at a 99% confidence level.
| Depth (m) | First Mode (days), Norm. amp | Second Mode (days), Norm. amp | Third Mode (days), Norm. amp |
|---|---|---|---|
| 50 | 182.5 *, 24.08 | 365*, 20.41 | 6205, 0.22 |
| 100 | 365 *, 30.48 | 182.5, 8.05 | 6205, 1.72 |
| 150 | 365 *, 31.16 | 6205, 3.83 | 182.5, 3.30 |
| 200 | 365 *, 31.08 | 6205, 5.19 | 182.5, 1.84 |
| 300 | 365 *, 31.05 | 6205, 5.56 | 182.5, 1.03 |
| 500 | 365 *, 31.29 | 6205, 4.15 | 182.5, 0.59 |
| 700 | 365 *, 31.39 | 6205, 3.38 | 182.5, 0.51 |
© 2018 by the authors. Licensee MDPI, Basel, Switzerland. This article is an open access article distributed under the terms and conditions of the Creative Commons Attribution (CC BY) license (http://creativecommons.org/licenses/by/4.0/).
Share and Cite
MDPI and ACS Style
Ali, M.M.; Singh, N.; Kumar, M.S.; Zheng, Y.; Bourassa, M.; Kishtawal, C.M.; Rao, C.V. Dominant Modes of Upper Ocean Heat Content in the North Indian Ocean. Climate 2018, 6, 71. https://doi.org/10.3390/cli6030071
AMA Style
Ali MM, Singh N, Kumar MS, Zheng Y, Bourassa M, Kishtawal CM, Rao CV. Dominant Modes of Upper Ocean Heat Content in the North Indian Ocean. Climate. 2018; 6(3):71. https://doi.org/10.3390/cli6030071
Chicago/Turabian StyleAli, Meer Mohammed, Neetu Singh, Manchikanti Suresh Kumar, Yangxing Zheng, Mark Bourassa, Chandra Mohan Kishtawal, and Chandu Venkateswara Rao. 2018. "Dominant Modes of Upper Ocean Heat Content in the North Indian Ocean" Climate 6, no. 3: 71. https://doi.org/10.3390/cli6030071
Note that from the first issue of 2016, this journal uses article numbers instead of page numbers. See further details here.