Monitoring the Indian Summer Monsoon Evolution at the Granularity of the Indian Meteorological Sub-divisions using Remotely Sensed Rainfall Products


1
Center for Ocean-Atmospheric Prediction Studies, Florida State University, Tallahassee, FL 32306, USA
2
Florida Climate Institute, Florida State University, Tallahassee, FL 32306, USA
3
Department of Earth, Ocean and Atmospheric Science, Florida State University, Tallahassee, FL 32306, USA
*
Author to whom correspondence should be addressed.
Remote Sens. 2019, 11(9), 1080; https://doi.org/10.3390/rs11091080
Submission received: 5 April 2019
/
Revised: 30 April 2019
/
Accepted: 6 May 2019
/
Published: 7 May 2019
(This article belongs to the Special Issue Remote Sensing of Rainfall and Snowfall - Recent Advances)
Abstract
:We make use of satellite-based rainfall products from the Tropical Rainfall Measuring Mission (TRMM) Multi-satellite Precipitation Analysis (TMPA) to objectively define local onset and demise of the Indian Summer Monsoon (ISM) at the spatial resolution of the meteorological subdivisions defined by the Indian Meteorological Department (IMD). These meteorological sub-divisions are the operational spatial scales for official forecasts issued by the IMD. Therefore, there is a direct practical utility to target these spatial scales for monitoring the evolution of the ISM. We find that the diagnosis of the climatological onset and demise dates and its variations from the TMPA product is quite similar to the rain gauge based analysis of the IMD, despite the differences in the duration of the two datasets. This study shows that the onset date variations of the ISM have a significant impact on the variations of the seasonal length and seasonal rainfall anomalies in many of the meteorological sub-divisions: for example, the early or later onset of the ISM is associated with longer and wetter or shorter and drier ISM seasons, respectively. It is shown that TMPA dataset (and therefore its follow up Global Precipitation Measurement (GPM) Integrated Multi-satellite Retrievals for GPM (IMERG)) could be usefully adopted for monitoring the onset of the ISM and therefore extend its use to anticipate the potential anomalies of the seasonal length and seasonal rainfall anomalies of the ISM in many of the Indian meteorological sub-divisions.
1. Introduction
The seasonal evolution of the Indian Summer Monsoon (ISM) is a well-known feature of general circulation. The seasonal shift in the lower tropospheric winds from south westerlies in the boreal summer to north easterlies in association with the corresponding reversal in the thermal gradients between the Indian subcontinent and the surrounding oceans is one of the most robust displays of the seasonal cycle in the tropics [1,2,3].
The ISM has significant variations in the length of its season that is dictated by variations in its onset and demise date of the season [3,4,5,6]. As a result of the variations in the seasonal length, it also affects the seasonal accumulation of the rainfall [6]. The authors of [3,6] show that the large-scale variations of El Niño and the Southern Oscillation (ENSO) and the Indian Ocean Dipole (IOD) have some influence on the seasonal length variations of the ISM. However, the transition from one phase to another of these asymmetric oscillations result in complex non-linear influences on the ISM variations [6].
The accompanying changes of the ISM rainfall is of critical importance for agriculture [7,8]. The authors of [9] claim that 60% of the cropped area in India still solely depends on monsoon rainfall, although this is rapidly changing with increasing investments in irrigation infrastructure [10]. The highest concentration of rain-fed agriculture occurs in western and southern parts of the Indian subcontinent [9]. In the recent decades, there has been a significant expansion of the arable area under irrigation, especially in Gujarat, Madhya Pradesh, and Rajasthan. It is noteworthy, however, that the interannual variations of the ISM rainfall has a strong influence on the productivity of the summer season food grain production [11,12,13].
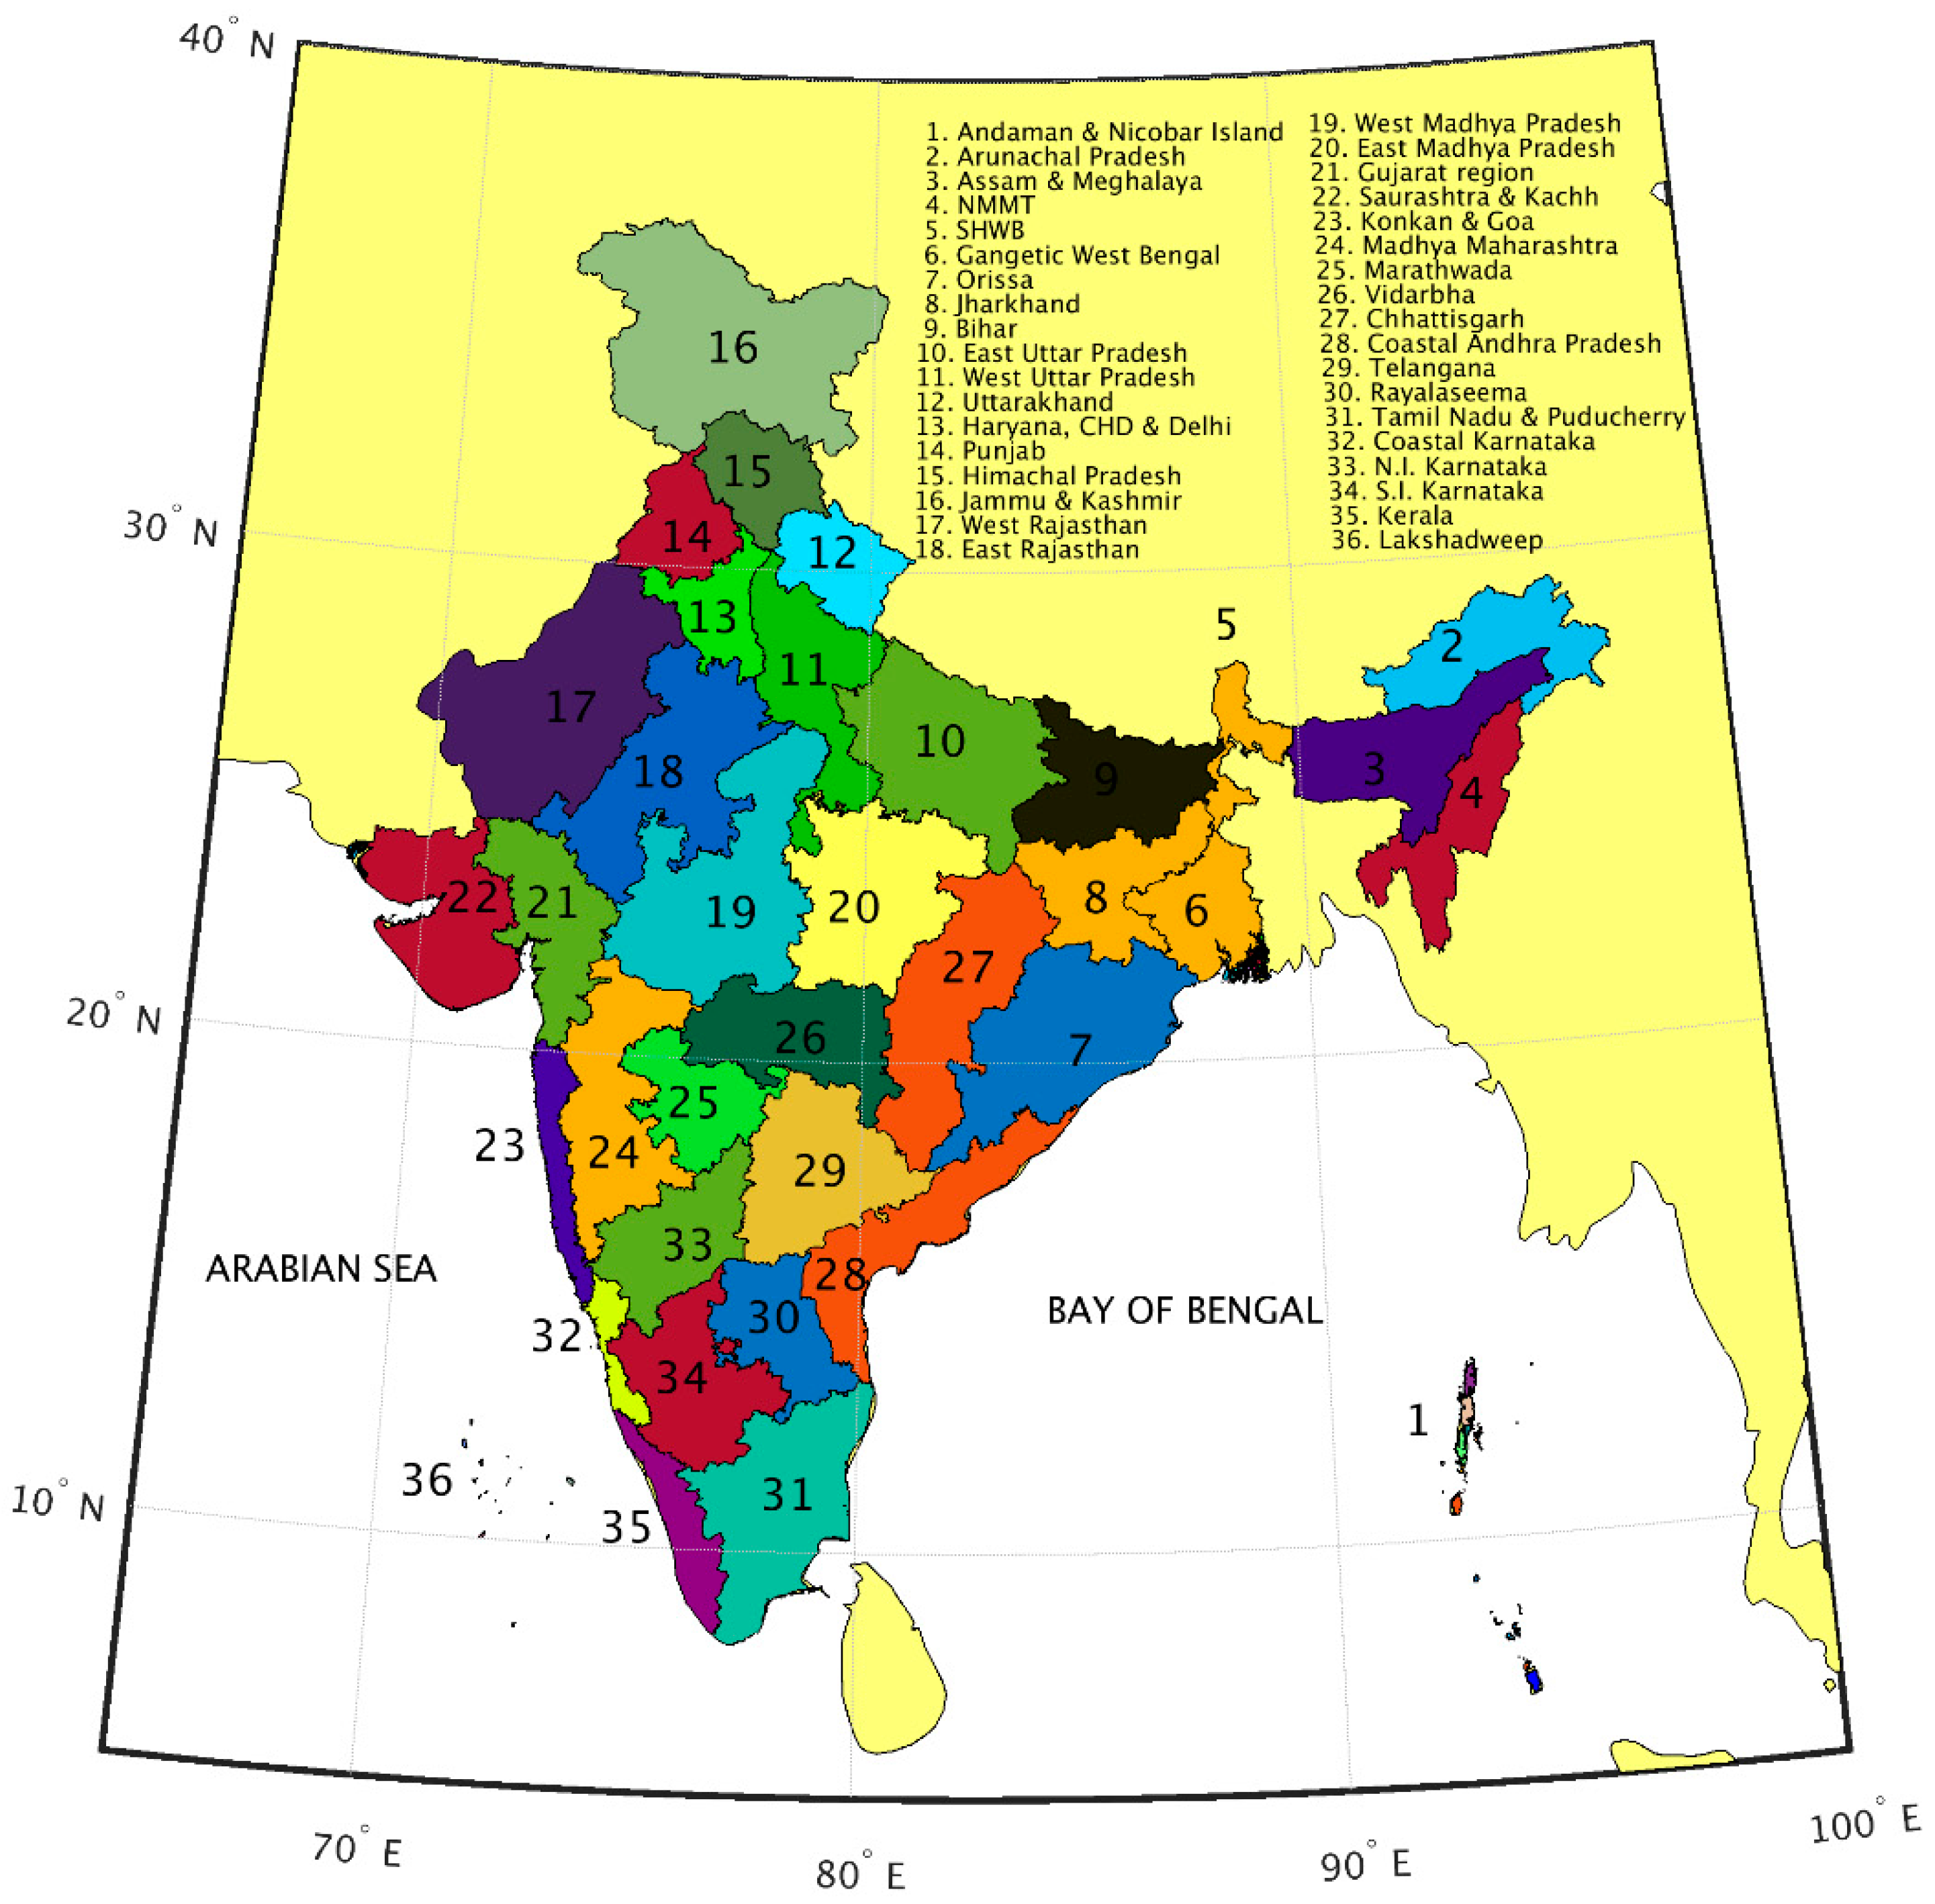
Although adopted methodology to diagnose the onset and demise of the ISM has been introduced by the authors of [2], the novelty of this paper is that we are attempting for the first time to define the onset and demise of the ISM at the granularity of the Indian meteorological sub-divisions (Figure 1). These meteorological sub-divisions are the operational spatial scales for the official forecasts issued by the Indian Meteorological Department (IMD). Therefore, there is a direct practical utility to target these spatial scales for monitoring the evolution of the ISM.
There are 36 meteorological sub-divisions that may be regarded as the spatial scales of the operational forecasts issued by the IMD. In this study we conducted analyses in 34 of the 36 sub-divisions, which exclude Lakshadweep and Andaman and Nicobar Islands. This is because the rainfall dataset used in this study is coarse in spatial resolution and is unable to resolve these two islands’ meteorological sub-divisions.
2. Datasets and Methodology
The rain gauge observations of the IMD are available for 104 years (1902–2005) [14,15]. Similarly, the satellite-based TRMM Multi-satellite Precipitation Analysis (TMPA) is available for a 17-year period (1998–2015) [16,17]. Both of these rainfall products are utilized to compute the onset and demise of the ISM at 0.25° × 0.25° grid interval.
The onset and demise of the All India averaged Rainfall (AIR) is defined as the first day after the minimum and maximum in the daily cumulative anomaly curve of AIR is reached in the year [2]. The daily cumulative anomaly of AIR for day i of year m is computed as:
where,
is the daily AIR for day n of year m, and is the climatology of the annual mean of AIR over N (= 365 or 366) days for M years.
Before proceeding further, it is important to mention that we average the gridded rainfall analysis to obtain the corresponding time series of the daily rainfall for each of the meteorological sub-divisions. We proceed to define the local onset and demise at each of the meteorological sub-divisions by first computing the climatological local onset ( and demise ( from the daily cumulative anomaly () of the daily climatology of rain at a given meteorological sub-division in the same way as for the AIR:
where, is the climatological rain at a given meteorological sub-division x for day n and is the corresponding annual mean climatology of rain:
Similarly, we define the climatological onset ( and demise ( dates from the daily cumulative anomaly of the daily climatological AIR. We then compute the difference () between the climatological local ( and climatological AIR onset ( dates as:
and similarly, the difference () between the climatological local ( and AIR demise ( dates as:
The climatological departures of local with AIR-based onset/demise dates gives a robust estimate of the phase lag (in days) with the transients being averaged out. We then define local onset () and demise () dates for a given year m and meteorological sub-division x from the daily cumulative rainfall anomaly for the year m by finding conservatively (the nearest) minimum and maximum near the immediate vicinity of and where, and . , are the standard deviations of bx and dx, q and r are fractions that are incrementally increased from zero [3].
3. Results
3.1. Climatology
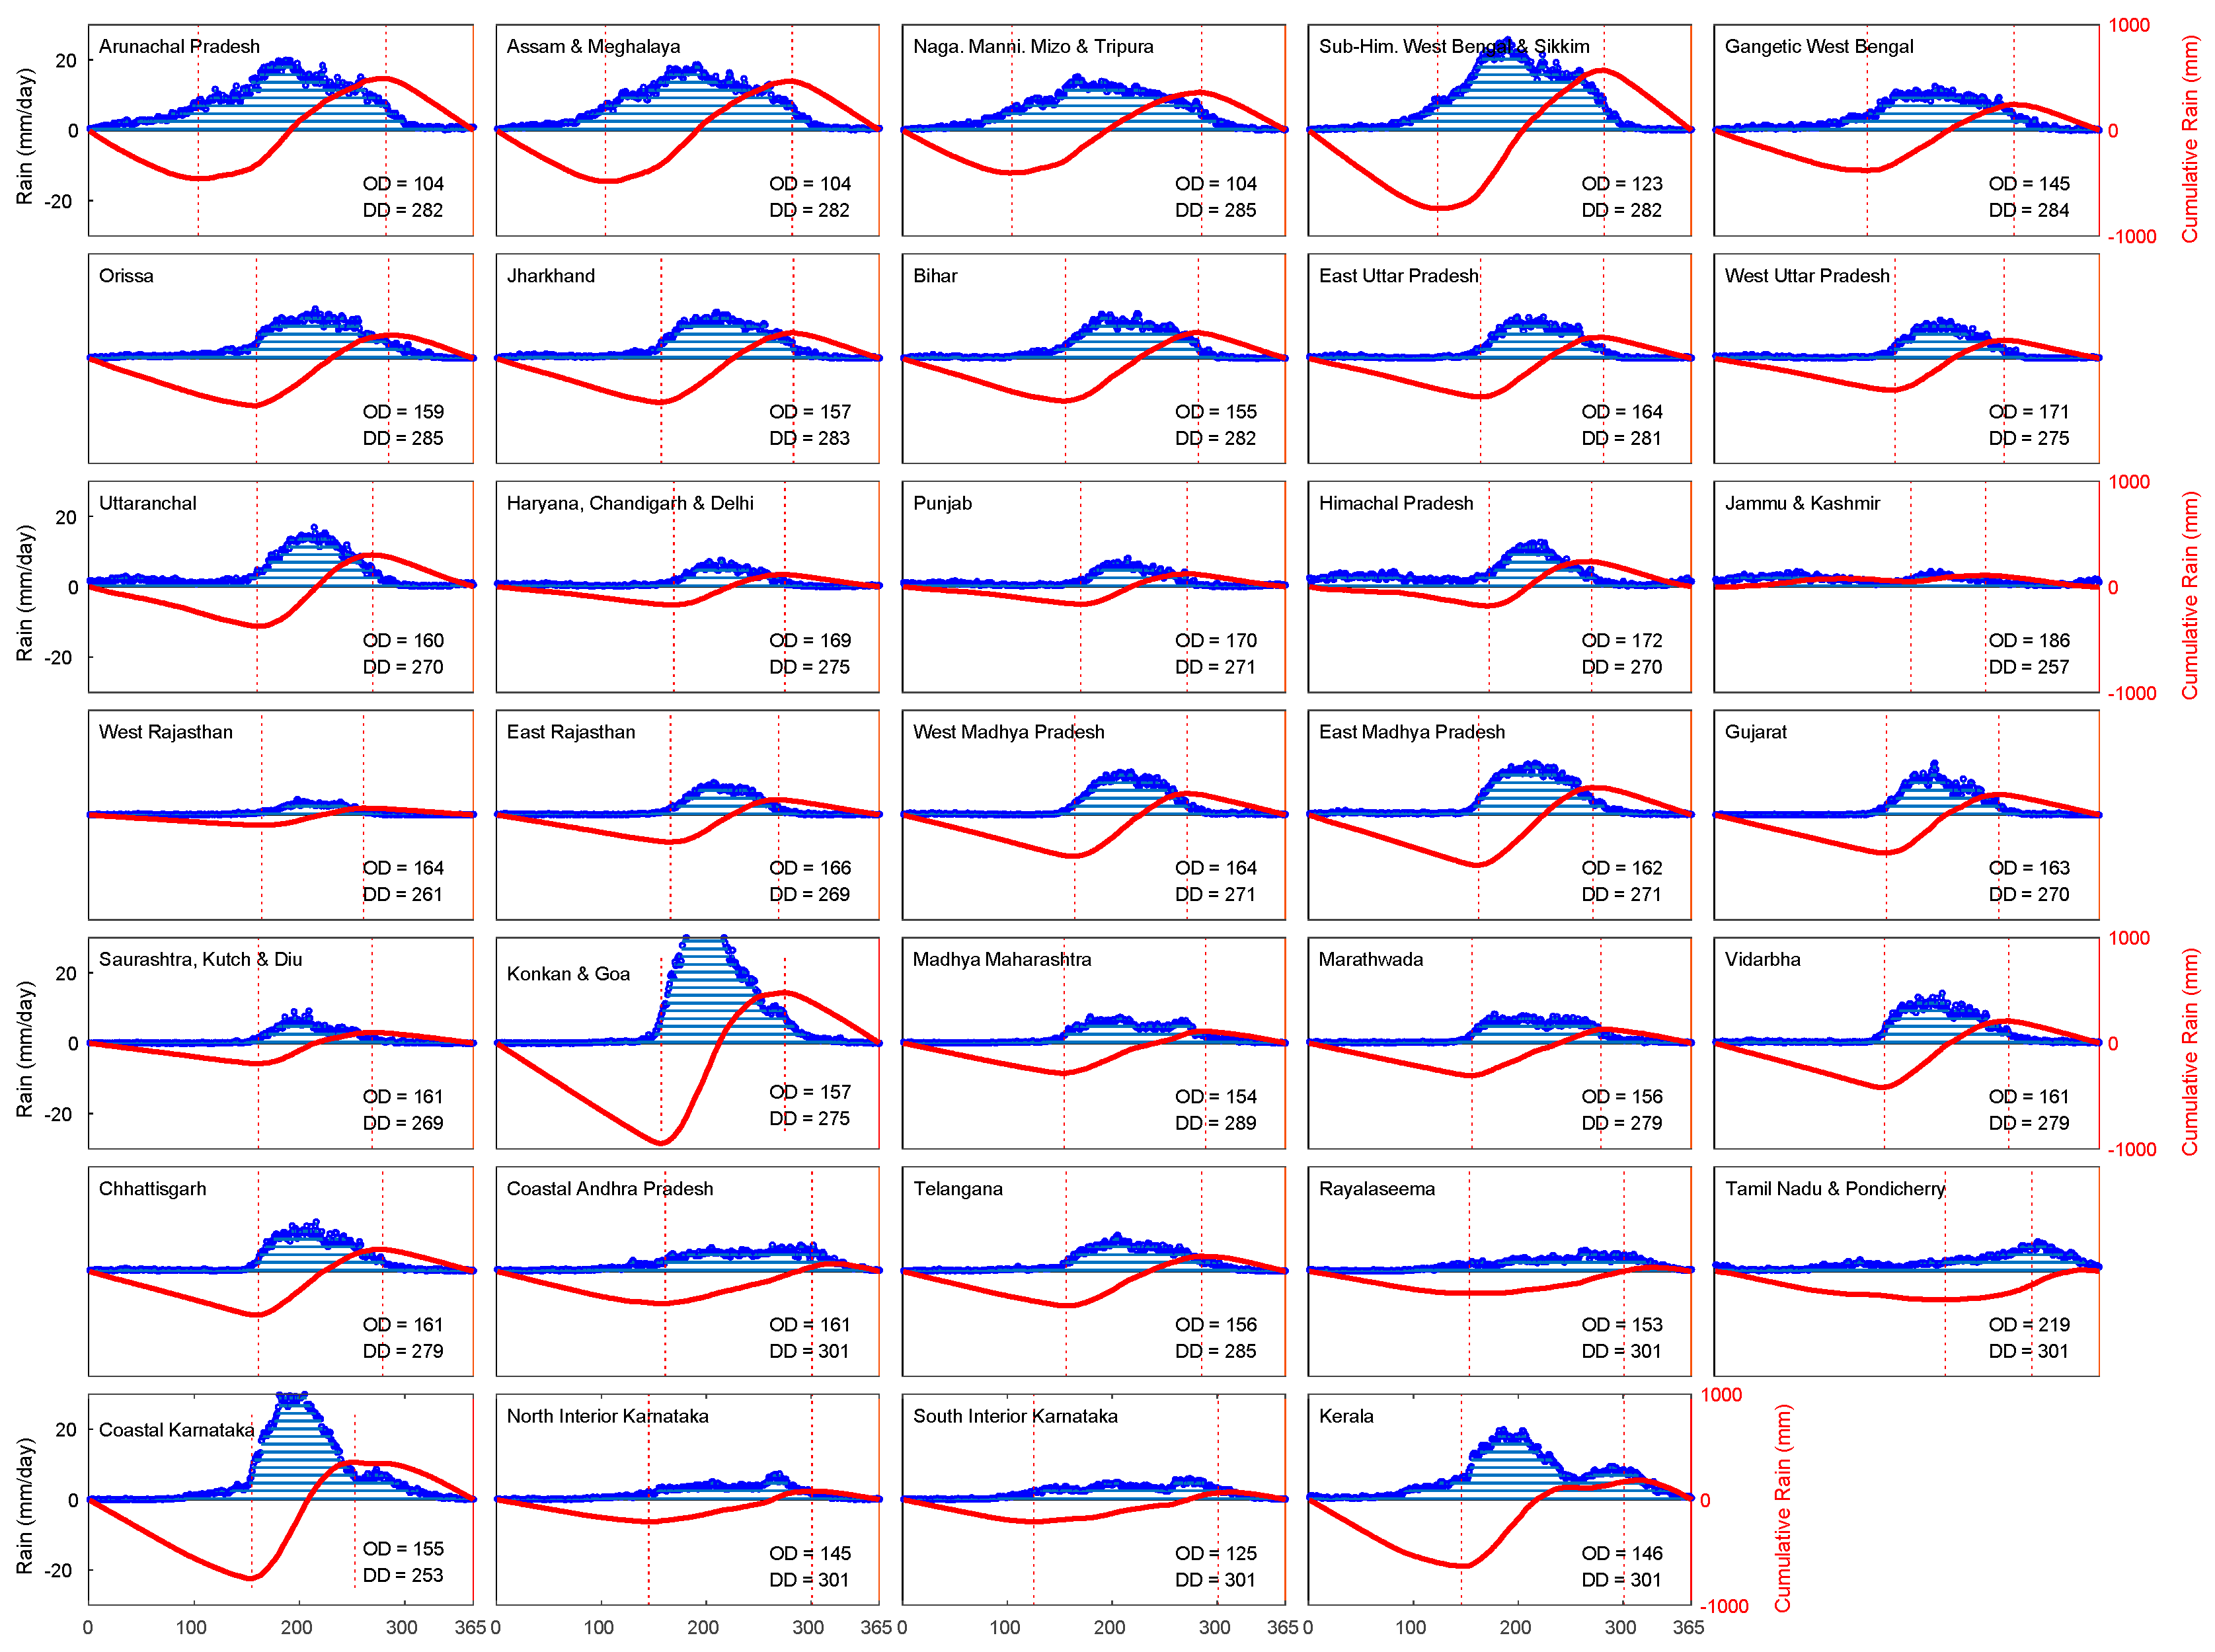
As an illustration of the methodology, we show in Figure 2 the diagnosis of the onset and demise of the ISM from the daily rainfall climatology for each of the 34 sub-divisions from the IMD dataset.
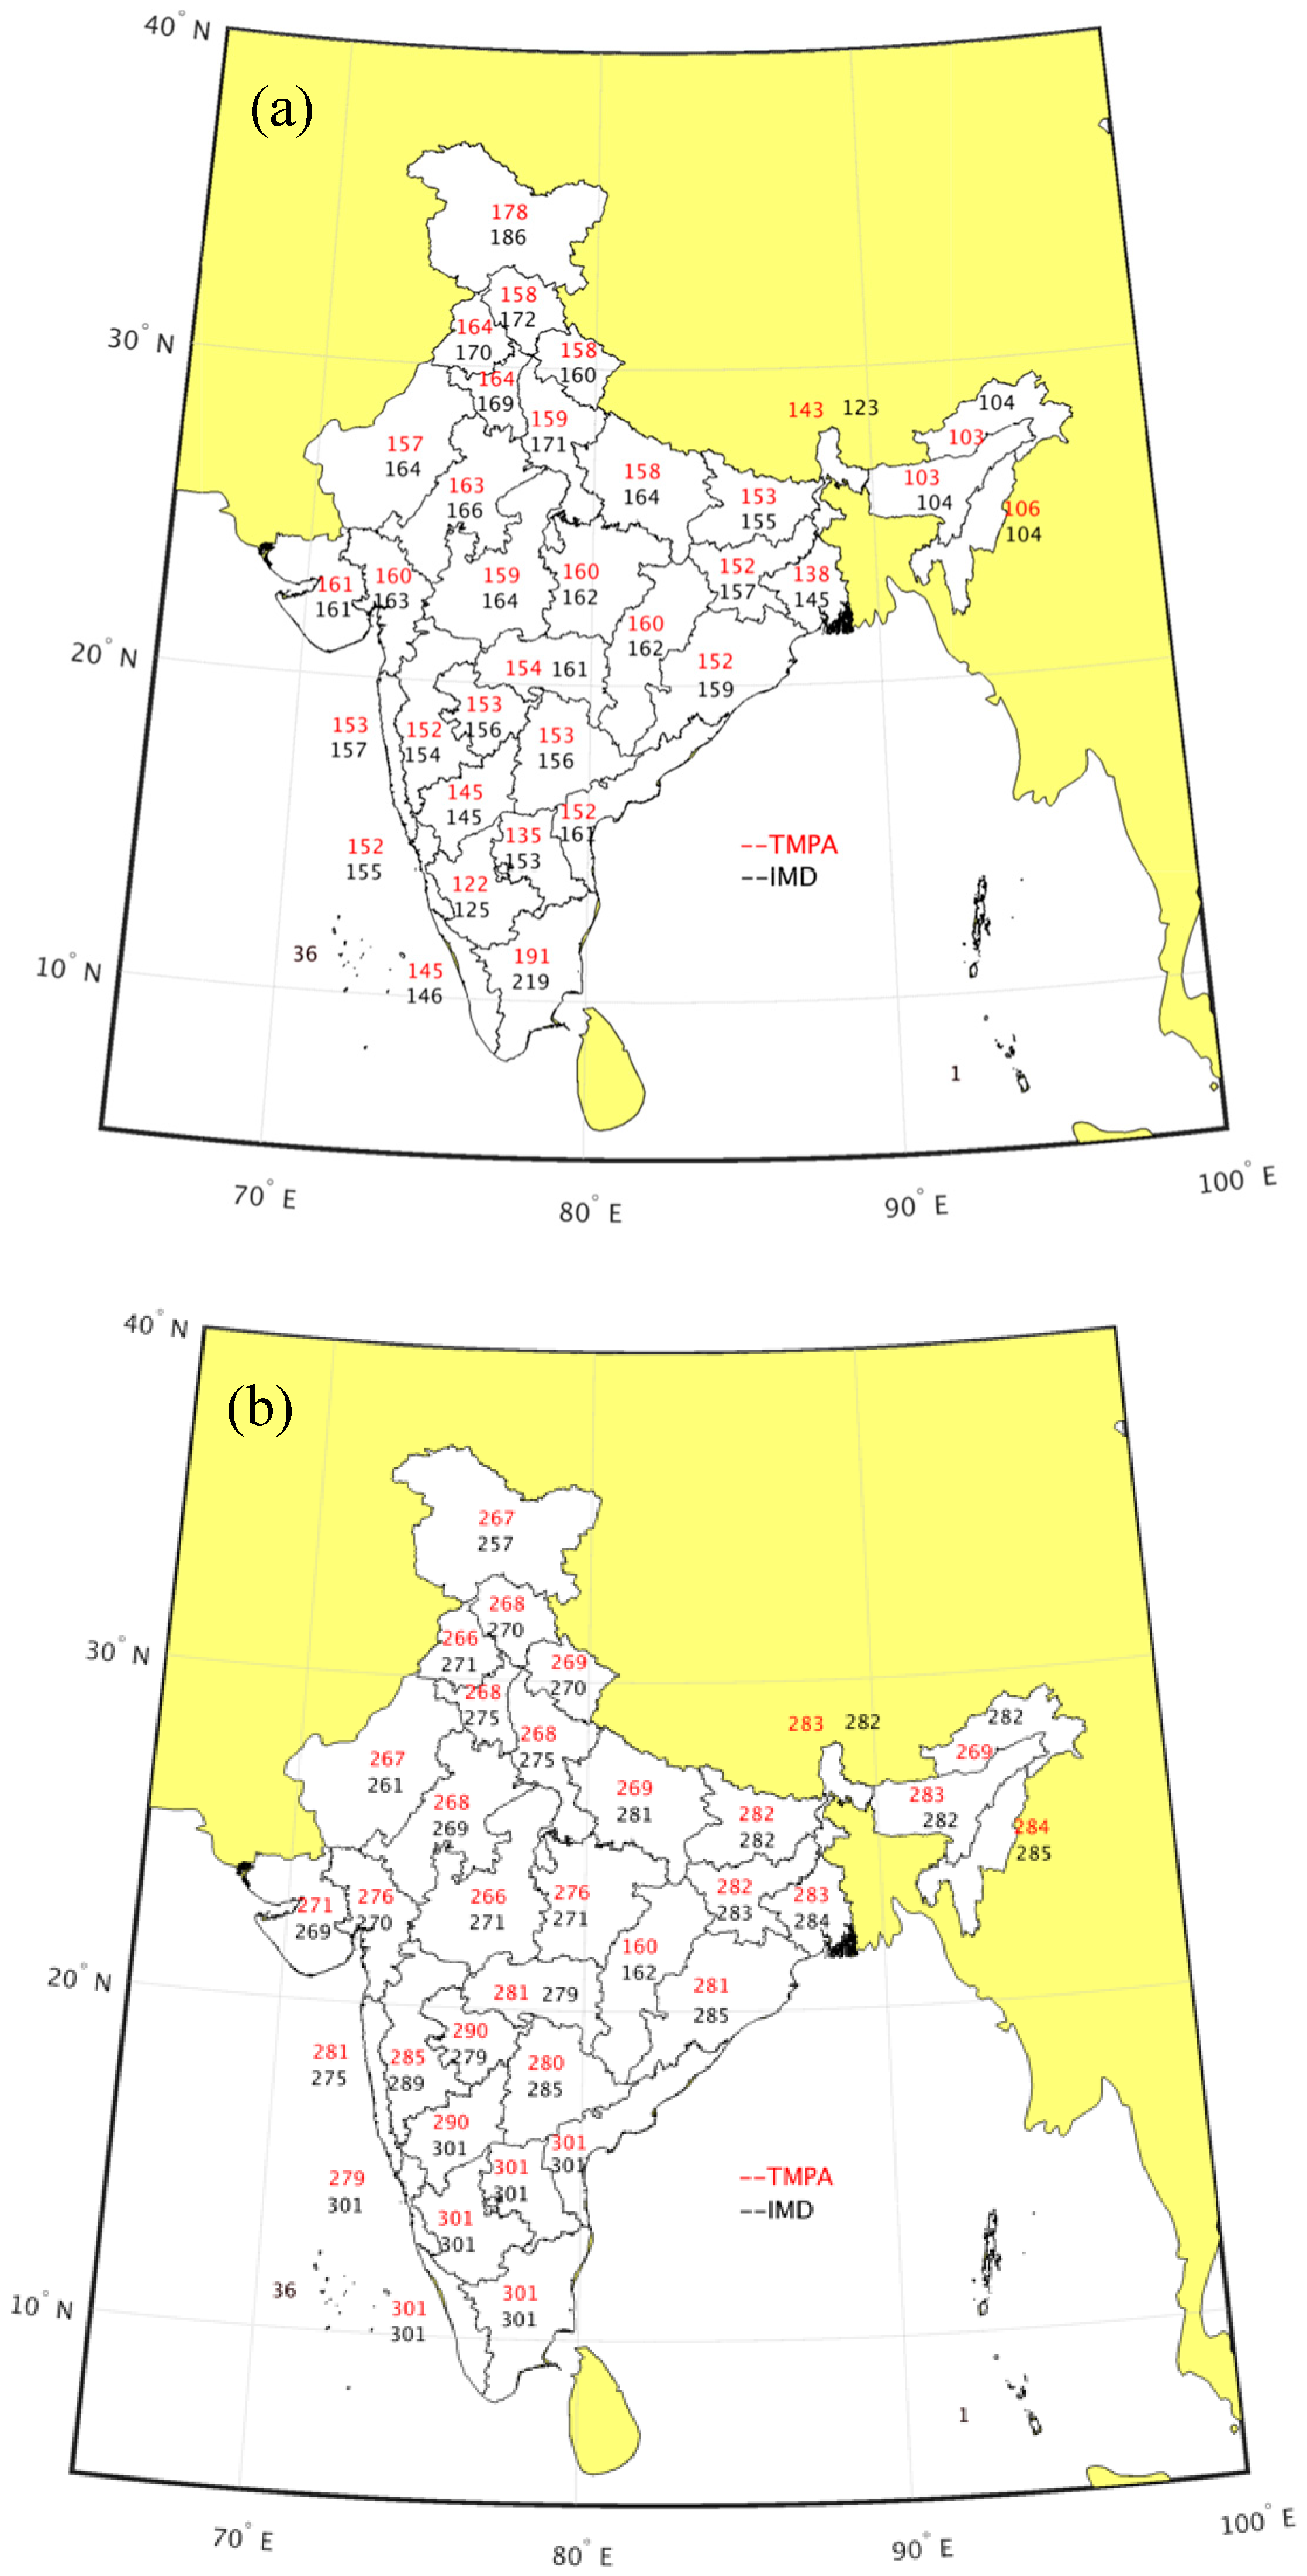
These figures clearly demonstrate the objectivity of the method with the inflection points in the cumulative anomaly curve for each of the meteorological sub-divisions being distinct. These diagnosed climatological onset and demise dates from the IMD datasets are so robust that their diagnosis is qualitatively and quantitatively similar when they are diagnosed from the TMPA datasets that are available over a much shorter time period (Figure 3a,b).
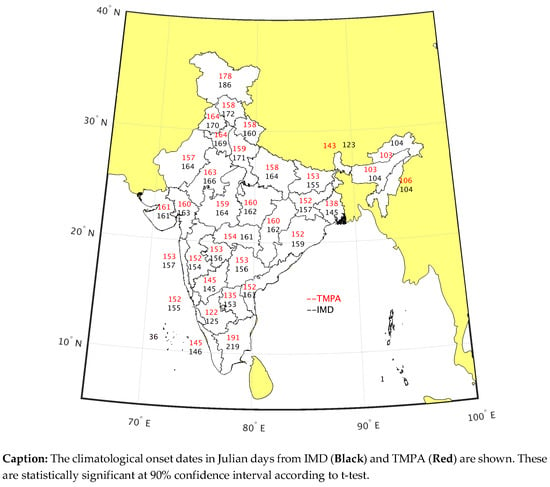
The following notable features can be made from Figure 3a,b:
- The meteorological sub-divisions in the northeast have the earliest onset date of the ISM followed by southern Karnataka. This is also regarded as pre-monsoon rainfall, as they tend to occur in early April.
- The most delayed onset of the ISM occurs in Tamil Nadu and Puducherry in southeast India followed by Jammu and Kashmir.
- The earliest withdrawal of the ISM happens in northwestern parts of India in Rajasthan, Punjab, Haryana, Himachal Pradesh.
- Likewise, the demise of the ISM is uniformly very delayed across the meteorological sub-divisions of southeastern India (e.g., Tamil Nadu, Rayalaseema, Andhra Pradesh, Karnataka).
- The climatology of the onset and demise dates from both TMPA and IMD datasets are similar over most meteorological sub-divisions. However, there are exceptions like the onset dates in southeastern India (e.g., Rayalaseema, Tamil Nadu) and northern India (e.g., Uttar Pradesh) that have differences in the onset dates of over 10 days between the two datasets. The demise dates are, however, comparatively more similar between the two datasets in these regions.
3.2. Interannual Variability
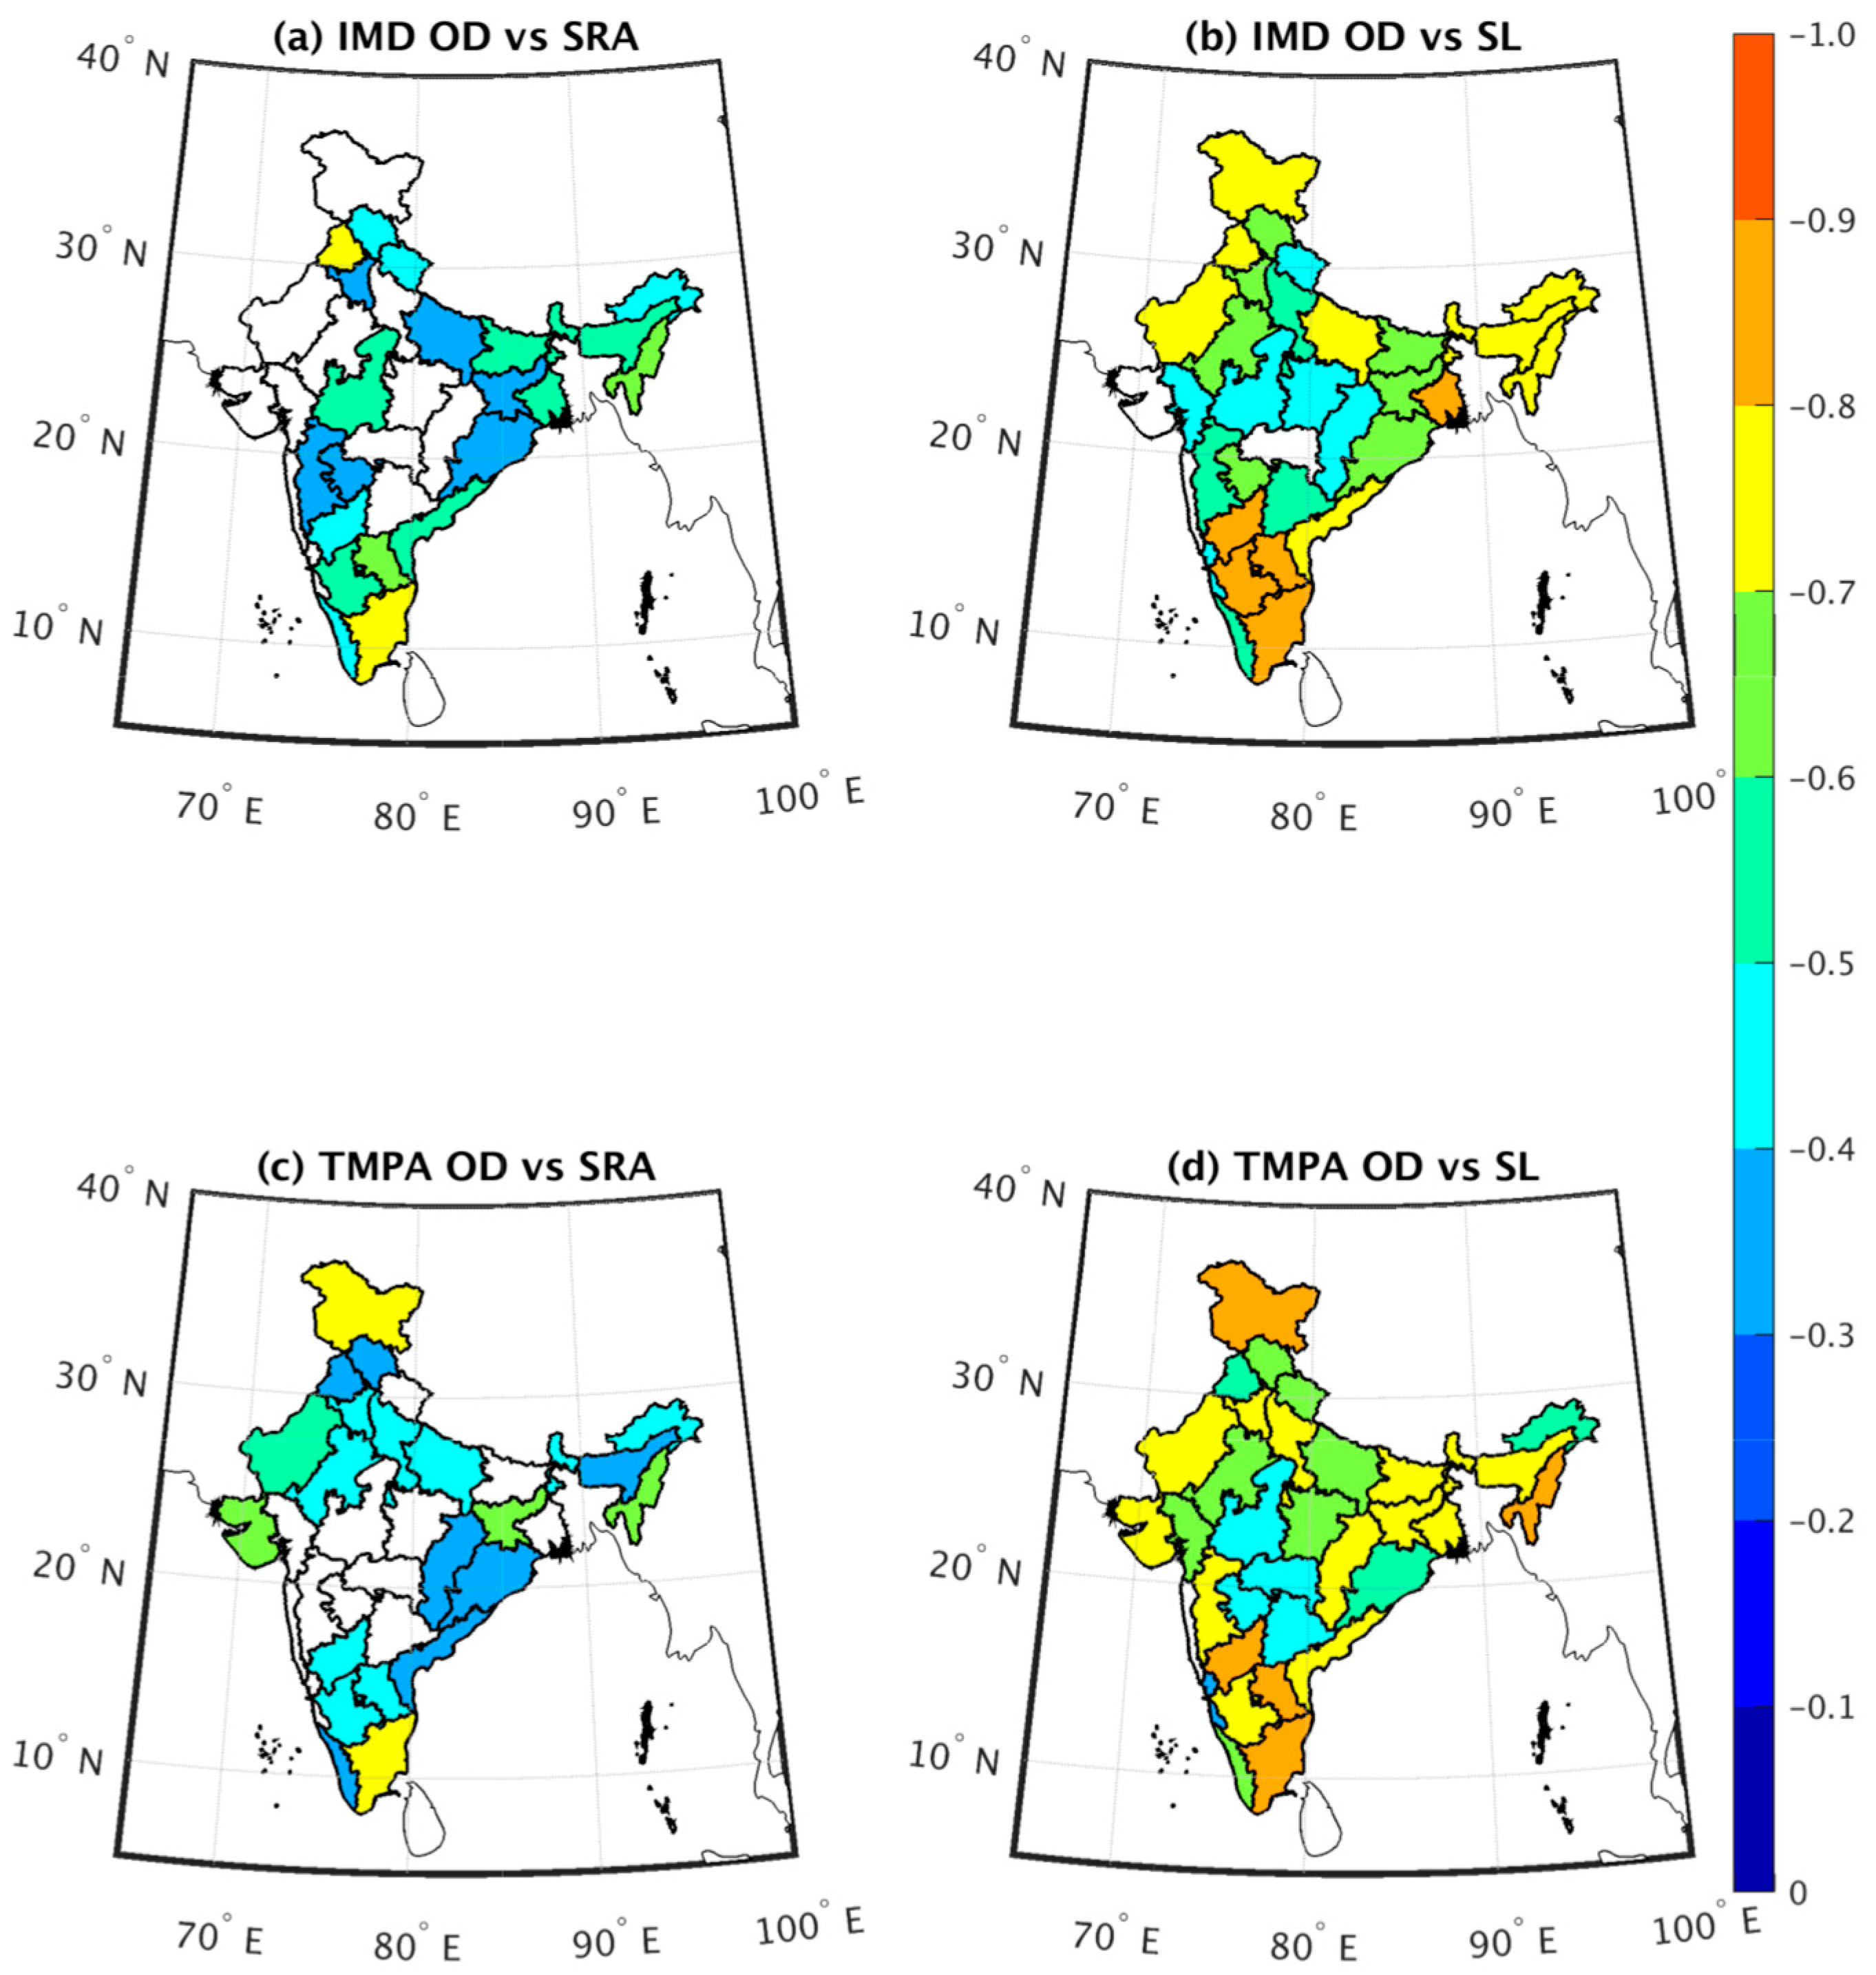
One of the strong motivations to monitor the onset and demise of the ISM is because of its year-to-year variations [2,3]. Given these interannual variations, the monitoring of the evolution of the ISM becomes important since for example, the cultivation cycle of the summer (Kharif) crops are dependent on the arrival of the ISM rains. Additionally, the influence of the variations of the onset date of the ISM on seasonal rainfall anomaly (Figure 4a) and the seasonal length of the ISM (Figure 4b) are other persuasions to monitor the onset of the ISM.
Figure 4a shows that in many of the meteorological sub-divisions of India, the onset date variations are linearly correlated with the corresponding seasonal rainfall anomalies. These negative correlations suggest that early or later onset of the ISM in the sub-division is associated with corresponding excess or deficit seasonal rainfall anomaly of the ISM, respectively. Similarly, the negative correlations between the onset date variations and seasonal length anomalies in Figure 4b suggest that early or later onset of the ISM is associated with longer or shorter seasonal length of the ISM, respectively. These relationships are maintained when the correlations are computed with the TMPA instead of the IMD rainfall datasets (Figure 4c,d). It is interesting to note that the onset date variations have a strong bearing on the seasonal rainfall anomalies of the ISM in the southern peninsular, eastern, northeastern parts of India with a conspicuous absence of influence in some sub-divisions over central parts of India (Figure 4a,c). In contrast, the influence of the onset date variations on the seasonal length of the ISM is stronger than its influence on seasonal rainfall anomalies and more uniform across India (Figure 4b,d).
4. Conclusions
In this paper, we have demonstrated the use of remotely sensed rainfall datasets to diagnose and monitor the evolution of the Indian Summer Monsoon (ISM) in each of the meteorological sub-divisions. The resolution adaptability of the proposed methodology to diagnose the onset and demise dates of the ISM is put to use in this study to adapt to the scales of the meteorological sub-divisions, which is the operational spatial resolution for the forecasts issued by the Indian Meteorological Department. The proposed methodology for the diagnosis of the onset and demise of the ISM is simple as it relies on a single variable, namely, daily rainfall and makes it an appropriate choice for using the remotely sensed TRMM multi-satellite Precipitation Analysis (TMPA) dataset.
The proposed methodology for the diagnosis of onset and demise of the ISM is objective as it seeks the minima and maxima in the daily cumulative anomaly curve of the aggregated rainfall in the meteorological sub-division. All of the sub-divisions display sharp inflection points in the daily cumulative anomaly curve to provide with unambiguous onset and demise dates of the ISM.
We find that in a majority of the meteorological sub-divisions, the onset date of the ISM is associated with corresponding anomalies of seasonal length and seasonal rainfall anomalies. This association links early or later onset of the ISM in the sub-division to corresponding potentially longer and wetter or potentially shorter and drier seasonal rainfall anomalies of the ISM. However, parts of central India display insignificant influence of the variations of the onset of the ISM to either seasonal length or seasonal rainfall anomalies.
It is shown from this study that the TMPA dataset (and therefore its follow up, the Global Precipitation Measurement (GPM) Integrated Multiscale Retrievals for GPM (IMERG) rainfall product) could be usefully adopted for monitoring the onset of the ISM and therefore extend its use to anticipate the likelihood of potential anomalies of the seasonal length and seasonal rainfall anomalies of the ISM in many of the Indian meteorological sub-divisions.
Author Contributions
V.M. conceived the presented idea. A.B. developed the codes and figures; all the authors analyzed the results, V.M. and A.B. wrote the paper together.
Funding
This work was funded by NASA grants NNX17AG72G, NNX16AD83G, NSF award number 1606296, and the Earth System Science Organization, Ministry of Earth Sciences, Government of India (MM/SERP/FSU/2014/SSC-02/002). Datasets used in this study are from cited references.
Acknowledgments
The authors acknowledge the data shared by the Indian Meteorological Department, India and NASA, USA.
Conflicts of Interest
The authors declare no conflict of interest.
References
- Goswami, B.N.; Xavier, P.K. ENSO control on the south Asian monsoon through the length of the rainy season. Geophys. Res. Lett. 2005, 32, L18717. [Google Scholar] [CrossRef]
- Noska, R.; Misra, V. Characterizing the onset and demise of the Indian summer monsoon. Geophys. Res. Lett. 2016, 43, 4547–4554. [Google Scholar] [CrossRef]
- Misra, V.; Bhardwaj, A.; Mishra, A. Local onset and demise of the Indian summer monsoon. Clim. Dyn. 2018, 51, 1609–1622. [Google Scholar] [CrossRef]
- Joseph, P.V.; Eischeid, J.K.; Pyle, R.J. Interannual Variability of the Onset of the Indian Summer Monsoon and Its Association with Atmospheric Features, El Niño, and Sea Surface Temperature Anomalies. J. Clim. 1994, 7, 81–105. [Google Scholar] [CrossRef] [Green Version]
- Wang, B. LinHo Rainy Season of the Asian–Pacific Summer Monsoon. J. Clim. 2002, 15, 386–398. [Google Scholar] [CrossRef]
- Misra, V.; Bhardwaj, A.; Noska, R. Understanding the Variations of the Length and the Seasonal Rainfall Anomalies of the Indian Summer Monsoon. J. Clim. 2016, 30, 1753–1763. [Google Scholar] [CrossRef]
- Gadgil, S.; Gadgil, S. The Indian Monsoon, GDP and Agriculture. Econ. Polit. Wkly. 2006, 41, 4887–4895. [Google Scholar]
- Giné, X.; Townsend, R.M.; Vickery, J. Rational Expectations? Evidence from Planting Decisions in Semi-Arid India. unpublished work. 11 June 2007. [Google Scholar]
- Kumar, K.K.; Kumar, K.R.; Ashrit, R.G.; Deshpande, N.R.; Hansen, J.W. Climate impacts on Indian agriculture. Int. J. Climatol. 2004, 24, 1375–1393. [Google Scholar] [CrossRef] [Green Version]
- Ambika, A.K.; Wardlow, B.; Mishra, V. Remotely sensed high resolution irrigated area mapping in India for 2000 to 2015. Sci. Data 2016, 3, 160118. [Google Scholar] [CrossRef] [PubMed] [Green Version]
- Parthasarathy, B.; Munot, A.A.; Kothawale, D.R. Regression model for estimation of indian foodgrain production from summer monsoon rainfall. Agric. For. Meteorol. 1988, 42, 167–182. [Google Scholar] [CrossRef]
- Parthasarathy, B.; Rupa Kumar, K.; Munot, A.A. Forecast of rainy season foodgrain production based on monsoon rainfall. Indian J. Agric. Sci. 1992, 62, 1–8. [Google Scholar]
- Gadgil, S. Climate change and agriculture – An Indian perspective. Curr. Sci. 1995, 69, 649–659. [Google Scholar]
- Pai, D.; Sridhar, L.; Rajeevan, M.; Sreejith, O.; Satbhai, N.; Mukhopadhyay, B. Development of a new high spatial resolution (0.25° × 0.25°) long period (1901–2010) daily gridded rainfall data set over India and its comparison with existing data sets over the region. Mausam 2014, 65, 1–18. [Google Scholar]
- Pai, D.S.; Sridhar, L.; Badwaik, M.R.; Rajeevan, M. Analysis of the daily rainfall events over India using a new long period (1901–2010) high resolution (0.25° × 0.25°) gridded rainfall data set. Clim. Dyn. 2015, 45, 755–776. [Google Scholar] [CrossRef]
- Huffman, G.J.; Adler, R.F.; Rudolf, B.; Schneider, U.; Keehn, P.R. Global Precipitation Estimates Based on a Technique for Combining Satellite-Based Estimates, Rain Gauge Analysis, and NWP Model Precipitation Information. J. Clim. 1995, 8, 1284–1295. [Google Scholar] [CrossRef] [Green Version]
- Huffman, G.J.; Adler, R.F.; Arkin, P.; Chang, A.; Ferraro, R.; Gruber, A.; Janowiak, J.; McNab, A.; Rudolf, B.; Schneider, U. The Global Precipitation Climatology Project (GPCP) Combined Precipitation Dataset. Bull. Am. Meteorol. Soc. 1997, 78, 5–20. [Google Scholar] [CrossRef] [Green Version]
Figure 1.
The outline of the 36 meteorological sub-divisions of India.

Figure 2.
Time series of daily rainfall climatology (IMD) of the 34-meteorological sub-divisions of India (MSDs; blue dots) and the corresponding cumulative daily anomaly curve (red line) with onset (OD) and Demise (DD) dates marked in Julian days. The onset and demise are marked by dotted red lines that mark the inflection points where the slope of the cumulative daily anomaly curve changes.

Figure 3.
The climatological (a) onset and (b) demise dates in Julian days from IMD (Black) and TMPA (Red) are shown. These are statistically significant at 90% confidence interval according to t-test.
Figure 3.
The climatological (a) onset and (b) demise dates in Julian days from IMD (Black) and TMPA (Red) are shown. These are statistically significant at 90% confidence interval according to t-test.

Figure 4.
The correlation of the onset date (OD) in each of the MSD with corresponding ISM seasonal (a,c) rainfall and (b,d) length anomalies using (a,b) IMD, (c,d) TMPA rainfall datasets. Only statistically significant values at 90% significance level is shaded. SRA and SL in the panel titles refer to Seasonal Rainfall Anomaly and Seasonal Length, respectively. Note that the correlations range from 0 to −1.

© 2019 by the authors. Licensee MDPI, Basel, Switzerland. This article is an open access article distributed under the terms and conditions of the Creative Commons Attribution (CC BY) license (http://creativecommons.org/licenses/by/4.0/).
Share and Cite
MDPI and ACS Style
Bhardwaj, A.; Misra, V. Monitoring the Indian Summer Monsoon Evolution at the Granularity of the Indian Meteorological Sub-divisions using Remotely Sensed Rainfall Products. Remote Sens. 2019, 11, 1080. https://doi.org/10.3390/rs11091080
AMA Style
Bhardwaj A, Misra V. Monitoring the Indian Summer Monsoon Evolution at the Granularity of the Indian Meteorological Sub-divisions using Remotely Sensed Rainfall Products. Remote Sensing. 2019; 11(9):1080. https://doi.org/10.3390/rs11091080
Chicago/Turabian StyleBhardwaj, Amit, and Vasubandhu Misra. 2019. "Monitoring the Indian Summer Monsoon Evolution at the Granularity of the Indian Meteorological Sub-divisions using Remotely Sensed Rainfall Products" Remote Sensing 11, no. 9: 1080. https://doi.org/10.3390/rs11091080
Note that from the first issue of 2016, this journal uses article numbers instead of page numbers. See further details here.