Ocean Observations in Support of Studies and Forecasts of Tropical and Extratropical Cyclones
 Ricardo Domingues1,2*
  Akira Kuwano-Yoshida3
  Patricia Chardon-Maldonado4,5
  Robert E. Todd6
  George Halliwell2
  Hyun-Sook Kim2,7 I.-I. Lin8
  Katsufumi Sato9 Tomoko Narazaki9 Lynn K. Shay10
  Travis Miles11 Scott Glenn11 Jun A. Zhang1,2
  Steven R. Jayne6
  Luca Centurioni12 Matthieu Le Hénaff1,2
  Gregory R. Foltz2
  Francis Bringas2
  M. M. Ali13
  Steven F. DiMarco14
  Shigeki Hosoda15 Takuya Fukuoka9
  Benjamin LaCour2
  Avichal Mehra2 Elizabeth R. Sanabia16 John R. Gyakum17 Jili Dong2
  John A. Knaff2
  Gustavo Goni2
- 1Cooperative Institute for Marine and Atmospheric Studies, University of Miami, Miami, FL, United States
- 2Atlantic Oceanographic and Meteorological Laboratory, National Oceanic and Atmospheric Administration, Miami, FL, United States
- 3Shirahama Oceanographic Observatory Shionomisaki Wind Effect Laboratory, Disaster Prevention Research Institute, Kyoto University, Kyoto, Japan
- 4Caribbean Coastal Ocean Observing System, Mayagüez, Puerto Rico
- 5University of Puerto Rico at Mayagüez, Mayagüez, Puerto Rico
- 6Woods Hole Oceanographic Institution, Woods Hole, MA, United States
- 7I.M. Systems Group, Inc., Rockville, MD, United States
- 8Department of Atmospheric Sciences, National Taiwan University, Taipei, Taiwan
- 9Atmosphere and Ocean Research Institute, University of Tokyo, Kashiwa, Japan
- 10Rosenstiel School of Marine and Atmospheric Science, University of Miami, Miami, FL, United States
- 11Department of Ocean Sciences, Rosenstiel School of Marine and Atmospheric Science, University of Miami, Coral Gables, FL, United States
- 12Scripps Institution of Oceanography, La Jolla, CA, United States
- 13Center for Ocean-Atmospheric Prediction Studies, Florida State University, Tallahassee, FL, United States
- 14Texas A&M University, College Station, TX, United States
- 15Japan Agency for Marine-Earth Science and Technology, Yokosuka, Japan
- 16United States Naval Academy, Annapolis, MD, United States
- 17U.S. Integrated Ocean Observing System, National Oceanic and Atmospheric Administration, Miami, FL, United States
Over the past decade, measurements from the climate-oriented ocean observing system have been key to advancing the understanding of extreme weather events that originate and intensify over the ocean, such as tropical cyclones (TCs) and extratropical bomb cyclones (ECs). In order to foster further advancements to predict and better understand these extreme weather events, a need for a dedicated observing system component specifically to support studies and forecasts of TCs and ECs has been identified, but such a system has not yet been implemented. New technologies, pilot networks, targeted deployments of instruments, and state-of-the art coupled numerical models have enabled advances in research and forecast capabilities and illustrate a potential framework for future development. Here, applications and key results made possible by the different ocean observing efforts in support of studies and forecasts of TCs and ECs, as well as recent advances in observing technologies and strategies are reviewed. Then a vision and specific recommendations for the next decade are discussed.
Introduction
Extreme weather events are natural hazards that affect marine and terrestrial areas around the world and are associated with different temporal and spatial scales (Elsner et al., 2008; Menkes et al., 2016; Zhou et al., 2018). Tropical cyclones (TCs) and their extratropical counterparts, often referred to as extratropical “bomb” cyclones (ECs), are deep low pressure systems that produce and sustain high intensity winds. TCs develop exclusively over the ocean (e.g., Knapp et al., 2010), while ECs predominantly form in the land-ocean margin, in the vicinity of western boundary currents (e.g., Sanders and Gyakum, 1980), and can also occasionally develop over land (e.g., Hakim et al., 1995). TCs and ECs are among the deadliest and most destructive types of extreme weather, often causing widespread damage due to strong winds, storm surge, and heavy precipitation. Understanding their dynamical mechanisms and having the ability to accurately forecast them is a critical societal need but remains a challenge.
The understanding of upper-ocean processes leading to extreme weather events has largely benefited from the climate-oriented sustained ocean observing system (e.g., Legler et al., 2015) and observational process studies. Clearly, ocean observations are vital in ECs and TCs research and forecasts, since they enable examining the details of air-sea interaction processes that can lead to the formation and intensification of these systems (e.g., Leipper and Volgenau, 1972; Sanders and Gyakum, 1980; Mainelli et al., 2008; Kuwano-Yoshida and Minobe, 2017). In addition, ocean observations have been increasingly acknowledged by the forecast community as a critical piece to improve extreme weather forecasts (e.g., Dong et al., 2017). Their important role will likely continue to increase in light of improvements in coupled model capabilities (see below), and future extreme weather projections, which expects intense weather systems to become more frequent (e.g., Colle et al., 2015; Bacmeister et al., 2018). In fact, more and more occurrences of record-breaking “Cat-6” types of TCs were observed over the last decade, with three Cat-6 storms ( > = 165 kts) forming during 2008–2018 (Haiyan, November, 2013; Patricia, October, 2015; and Meranti, September, 2016), and no Cat-6 TCs recorded globally in the earlier decade during 1999–2008. These recent changes and projections in occurrence of intense TCs and ECs emphasize the need for a sustained observing system in support of extreme weather studies and forecasts.
Recent advances in research and ocean observing efforts during the past decade have largely addressed specific recommendations identified by the scientific community during OceanObs’ 09 (e.g., Goni et al., 2010) about key areas to focus in support of TC studies and forecasts. Since then, new technologies, pilot networks, and targeted deployments have further expanded the reach of the global observing system and have been used in weather analyses, outlooks, and improved ocean-atmosphere numerical forecasts models. For instance, (i) extensive synergies between the scientific and operational communities continue to facilitate transitioning of research results into operations (e.g., Shay et al., 2014); (ii) networks specifically designed in support of TC studies and forecasts have been implemented (e.g., Domingues et al., 2015; Miles et al., 2015); (iii) targeted airborne profiling observations ahead of forecasted TCs have been extensively implemented (e.g., D’Asaro et al., 2014; Meyers et al., 2015; Jaimes et al., 2016; Zhang et al., 2018); (iv) substantial progress has been made toward understanding the role of upper ocean salinity (e.g., Balaguru et al., 2012a,b; Domingues et al., 2015) and temperature stratification (Price, 2009; Lin et al., 2013a,b; Balaguru et al., 2015, 2018; Glenn et al., 2016) in controlling TC intensity and development; (v) real-time assimilation of ocean observations into coupled weather forecast systems continues to provide critical information for improved ocean representation (e.g., Chen et al., 2017; Dong et al., 2017); and (vi) new, state-of-the-art, coupled numerical weather models have evolved and are now being used in experimental and operational forecasting modes (e.g., Kim et al., 2014).
On a broader context, recent advances in ocean observations in support of extreme weather were accompanied by an overall improvement of global coverage based on in situ and satellite ocean observations, and in their analysis. For example: improved sensor technology and satellite coverage enabled substantial advances in satellite altimetry (Verrier et al., 2018); satellite-derived salinity measurements (Meissner et al., 2018), now available with the launch of the Aquarius and the Soil-Moisture Active Passive (SMAP) missions, have produced unprecedented spatial coverage of sea surface salinity observations (Meissner et al., 2018); advances in in situ observing systems and networks (e.g., Foltz et al., 2019; Goni et al., 2019; Roemmich et al., 2019; Todd et al., 2019) have also enabled many groundbreaking research of the global oceans and climate system. In addition, community-wide efforts aimed at advancing data availability, and data assimilation within high-resolution numerical models through the US GODAE (Chassignet et al., 2009), the GODAE/Mercator-Ocean forecast system (Drévillon et al., 2008), and other similar efforts, have also provided significant advances in oceanic forecasting capabilities. Currently, there are also ongoing efforts from the Environmental Modeling Center (EMC) within the National Oceanic and Atmospheric Administration (NOAA) to implement a global data assimilation scheme into the Real-Time Ocean Forecast System (RTOFS), and a similar scheme more specifically in support of hurricane modeling systems. Some examples of such systems include the regional scale coupled HYbrid Coordinate Ocean Model – Hurricane Weather Research and Forecast (HYCOM-HWRF), and the HYCOM – Hurricanes in a Multi-scale Ocean-coupled Non-hydrostatic model (HYCOM-HMON). Additional details of such hurricane models are explored further in Section “Impact of Ocean Data in Tropical Cyclone Intensity Forecasts” of this manuscript.
In this community white paper, we describe some of the most important advances in the observational efforts in support of studies and forecasts of TCs and ECs since OceanObs’ 09, and present and discuss some potential enhancements to ocean observing strategies for the upcoming future, as well as provide specific recommendations. This manuscript is organized as follows: Sections “Tropical Cyclones” and “Extratropical Bomb Cyclones” provide detailed descriptions of TCs and ECs, respectively, and discuss the role of the ocean in their genesis and intensification; in Section “Ocean Observations and Parameters in Support of Extreme Weather Studies and Forecasts,” key components of the ocean observing system, products, and pilot networks in support of TC and/or ECs studies and forecasts are described; Section “Highlighted Applications and Results” presents selected applications of ocean observations in support of research into TCs and ECs; in Section “Impact of Ocean Data in Tropical Cyclone Intensity Forecasts,” the impact of ocean observations in the forecast of TC is specifically addressed; Section “Data Management” describes recent advances and needs concerning data management; and in Section “The Vision for the Next 10 years,” the recommendations from the scientific community and the vision for the upcoming decade are provided.
Tropical Cyclones
A TC is a fast-rotating storm system that is characterized by a low pressure center that forms in the tropics. TCs are observed in seven ocean basins worldwide (Figure 1), namely the: North Atlantic, Northeast Pacific, Northwest Pacific, Southwest Indian, North Indian, Southeast Indian, and South Pacific. In the North Atlantic Ocean basin, for example, 11–12 named TCs, 6 hurricanes, and 2–3 major hurricanes develop between June and November in a typical year (e.g., Landsea, 1993). TC development is associated with unstable atmospheric conditions, which are primarily linked with boundary layer temperature [i.e., sea surface temperatures (SST) under the eyewall], and to a lesser extent to the upper-level temperatures (see discussion in Balaguru et al., 2015). In addition, favorable atmospheric conditions for TC genesis and intensification, in order of importance, include: (i) relatively little variation in the vertical profile of the environmental winds (low vertical wind shear); (ii) an atmosphere characterized by lower-level convergence and upper-level divergence; (iii) sufficient environmental mid- and upper-level moisture; and (iv) relatively slow (less than 8 m s–1) deep layer steering. Favorable environmental conditions for TC intensification have been thoroughly documented in many studies (e.g., DeMaria and Kaplan, 1994; Knaff et al., 2005, 2018; Kaplan et al., 2010; DeMaria et al., 2014).
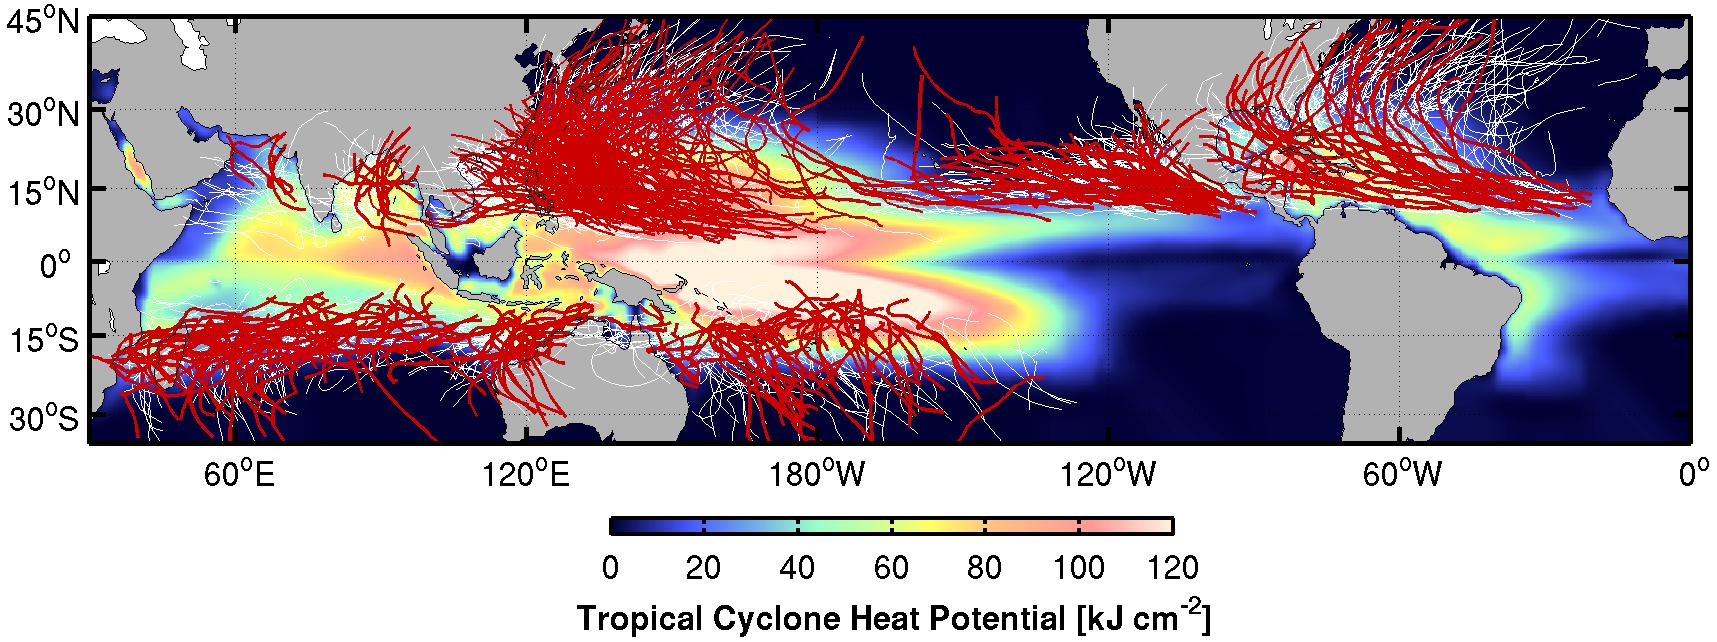
Figure 1. Global TC tracks during the time period of 1993–2011, overlaid on the average hurricane season satellite-derived tropical cyclone heat potential (TCHP) (upper-ocean heat content (OHC) above 26°C isotherm) for each hemisphere computed for the same time period. Thin white lines show the tracks of TCs with Cat-2 and below according to the Saffir–Simpson TC wind scale, and red lines show tracks of major TCs with Cat-3 and above.
Under favorable atmospheric conditions, SSTs above 26°C are needed for development and maintenance of TCs (e.g., Leipper and Volgenau, 1972; Dare and McBride, 2012). The vertical structure of the upper ocean plays a key role in the intensification and weakening of TCs with both thermal structure (e.g., Leipper and Volgenau, 1972; Shay et al., 2000; Mainelli et al., 2008; Goni et al., 2009; Shay and Brewster, 2010) and stratification (e.g., Lin et al., 2008; Price, 2009; Balaguru et al., 2012a,b, 2015, 2018; Domingues et al., 2015; Emanuel, 2015; Huang et al., 2015; Seroka et al., 2016; Rudzin et al., 2017, 2018) being important. The upper ocean heat content (OHC) is an indicator of how much energy is potentially available for TC intensification, while the stratification can act as a barrier to TC-induced mixing, suppressing upper ocean cooling, and helping maintain enthalpy fluxes from the ocean into the TC. Intense upper ocean mixing events caused by the strong hurricane winds can quickly erode the thermal signature of subsurface warm or cold features (Pickard and Emery, 1990), leading to SST misrepresenting the ocean thermal energy, and potential TC intensity. Several studies (e.g., Mao et al., 2000; Shay et al., 2000; Ali et al., 2007, 2013; Mainelli et al., 2008; Lin et al., 2013b) demonstrated the importance of ocean thermal energy, represented by warm ocean features.
Tropical cyclone intensification involves the interaction of very complex mechanisms at a range of scales, such as internal TC dynamics, upper ocean interaction, and atmospheric circulation. Rapid intensification is often associated with TCs moving over warm ocean features (i.e., upper-OHC values larger than 60 kJ cm–2, Figure 2), which maintain warmer SSTs (due to suppression of TC-induced sea surface cooling) near the convective center of the TC (Shay et al., 2000; Lin et al., 2005, 2009). The thermal energy across the sea surface is central to the enthalpy fluxes that transport heat and moisture from the ocean to the atmosphere, fueling the TC. For this reason, OHC estimates from a variety of datasets and methodologies are routinely used to provide operational guidance and carry out studies for intensity change and rapid intensification (e.g., Goni and Trinanes, 2003; DeMaria et al., 2005; Kaplan et al., 2010; Shay and Brewster, 2010; Meyers et al., 2014; Rogers et al., 2017; Knaff et al., 2018; Yamaguchi et al., 2018).
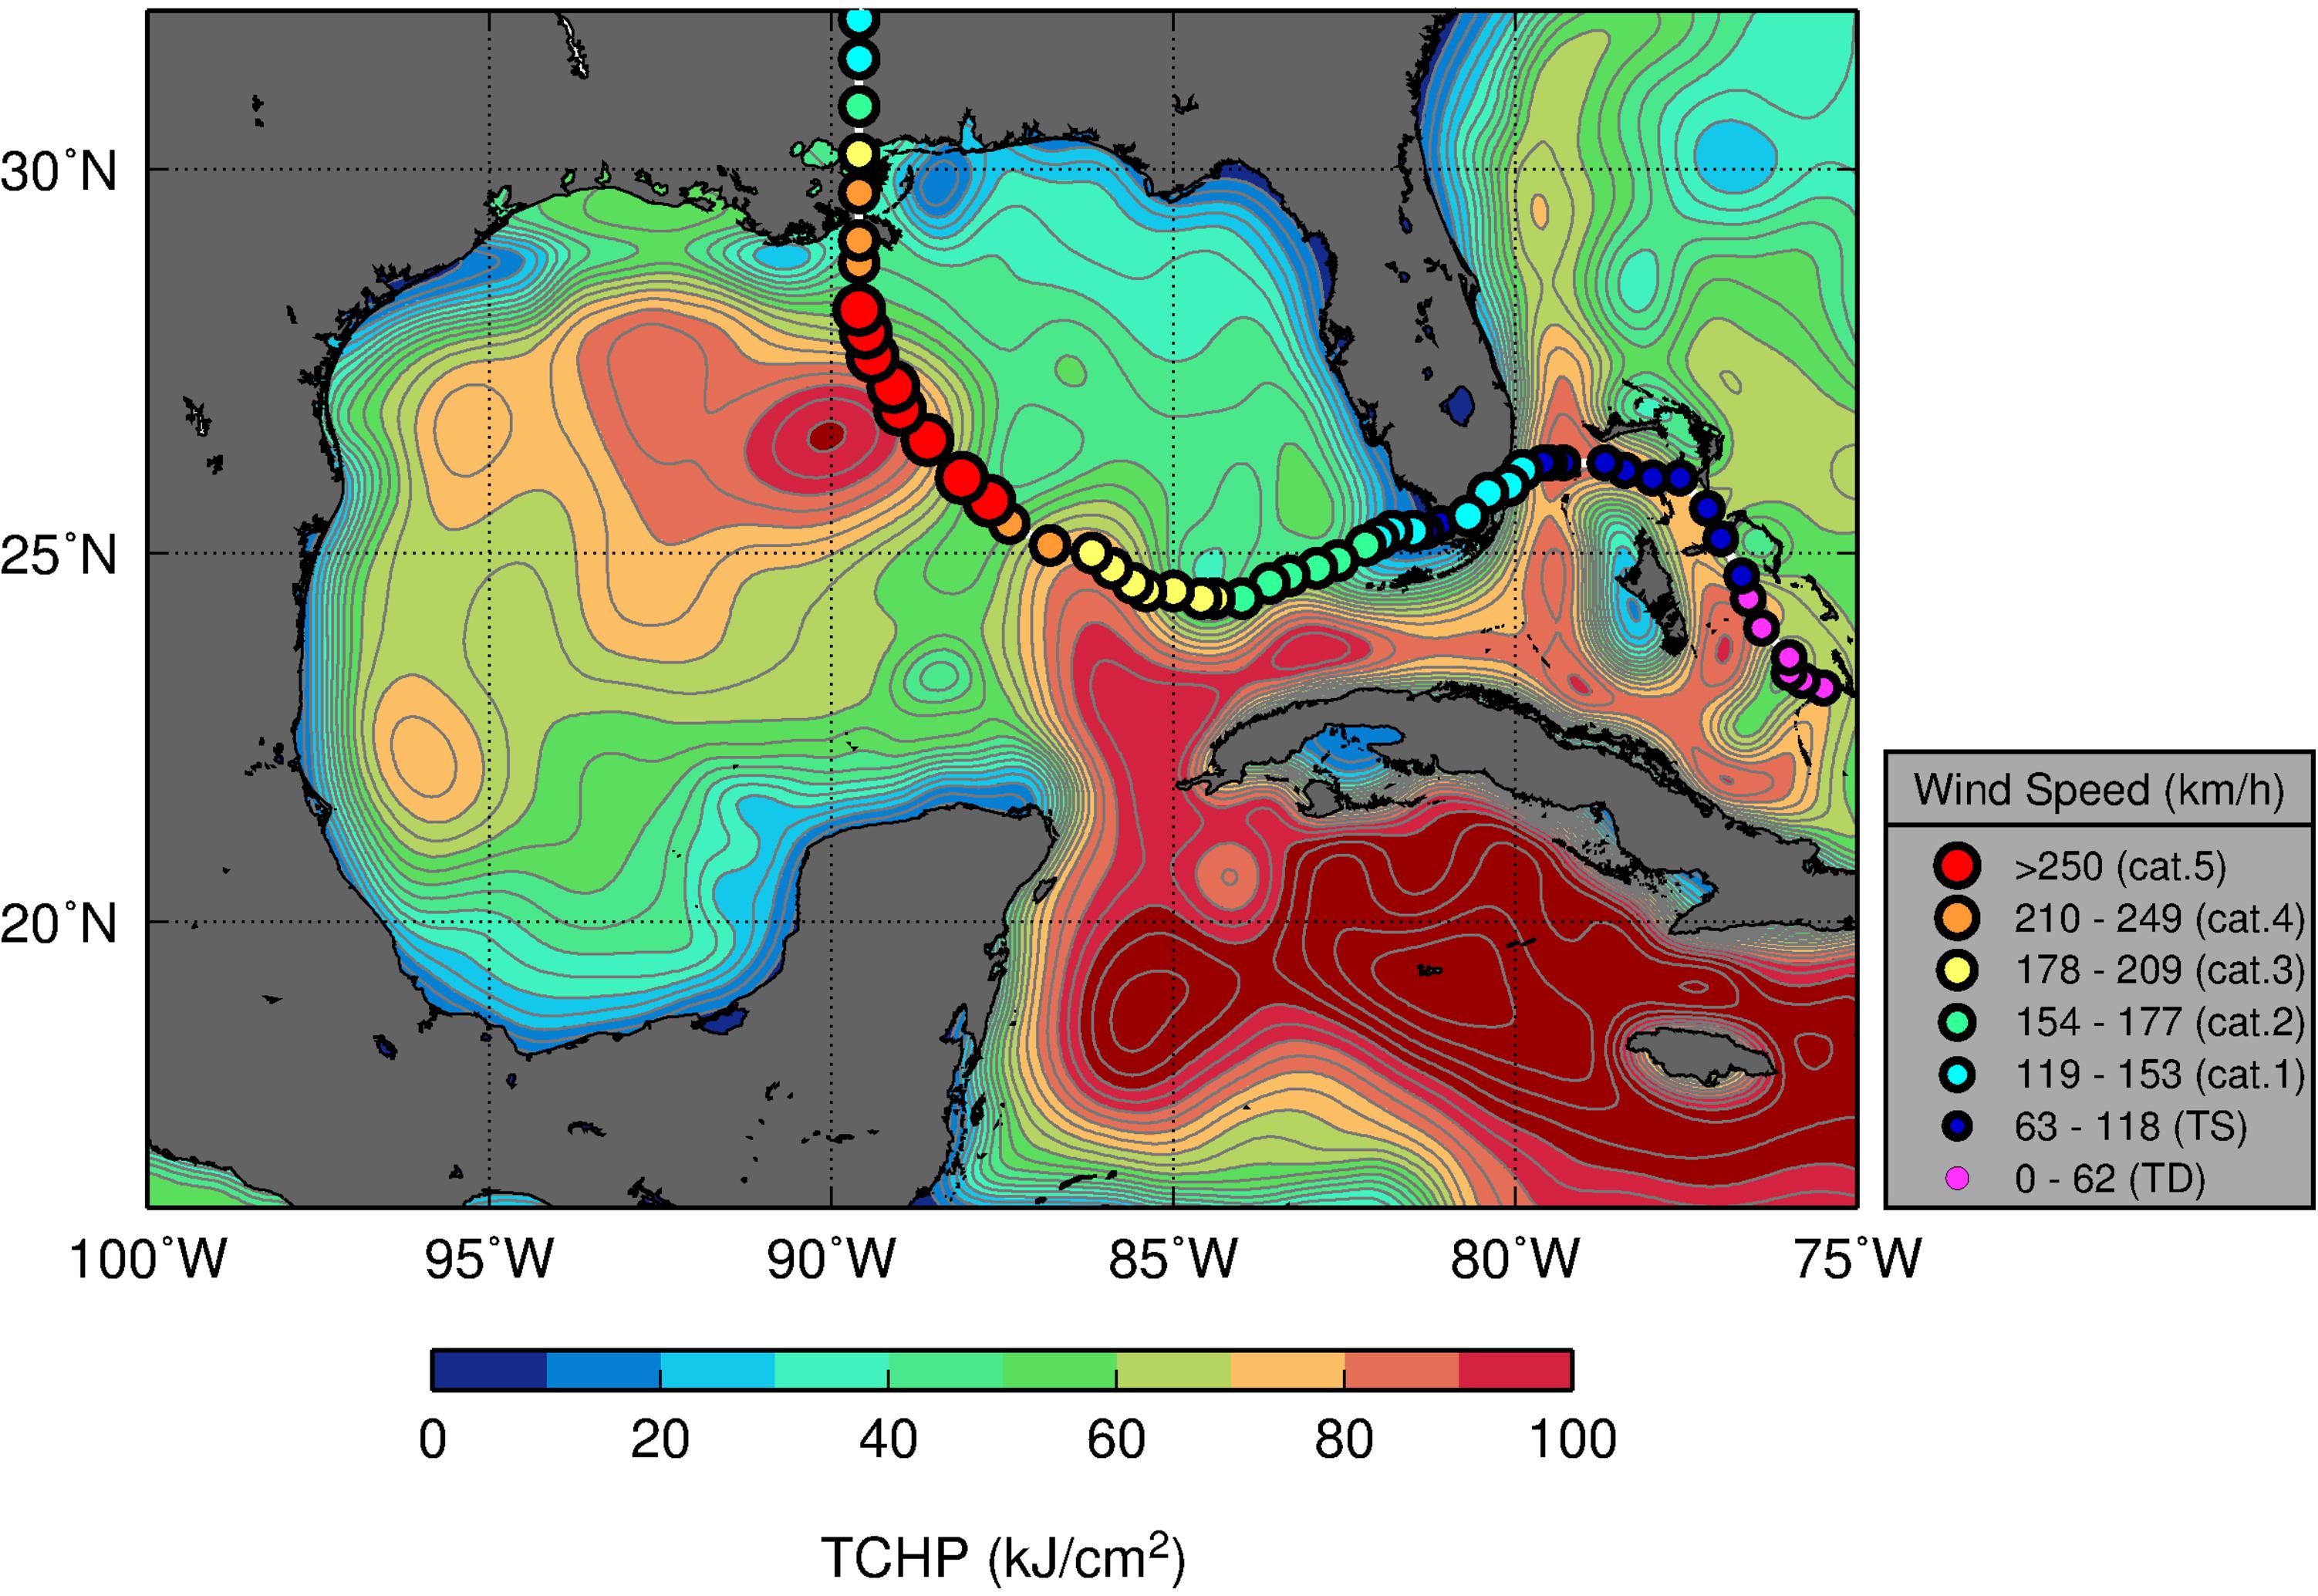
Figure 2. Track of Hurricane Katrina (2005) overlaid on tropical cyclone heat potential (TCHP, upper-OHC) conditions in the Gulf of Mexico on 08/20/2005 (prior to the passage of Katrina). Gray contours are displayed every 5 kJ cm–2 units.
Despite these advances in understanding the role that the upper ocean plays in TC intensification, officially-issued short-term intensity forecast errors have not been significantly reduced over the past two decades in any basin (e.g., Figure 3; DeMaria et al., 2007, 2014). One of the factors contributing to the lag in improvement of TC intensity forecasts relative to TC track forecasts may be the lack of a dedicated ocean observing system with sustained and targeted ocean observations to correctly represent the ocean component in ocean-atmosphere coupled intensity forecast models. Nonetheless, operational intensity forecast tools and models have been improving and are starting to reduce official intensity errors (DeMaria et al., 2014), which may, in part, be due to improved atmospheric and ocean data assimilation (DA).
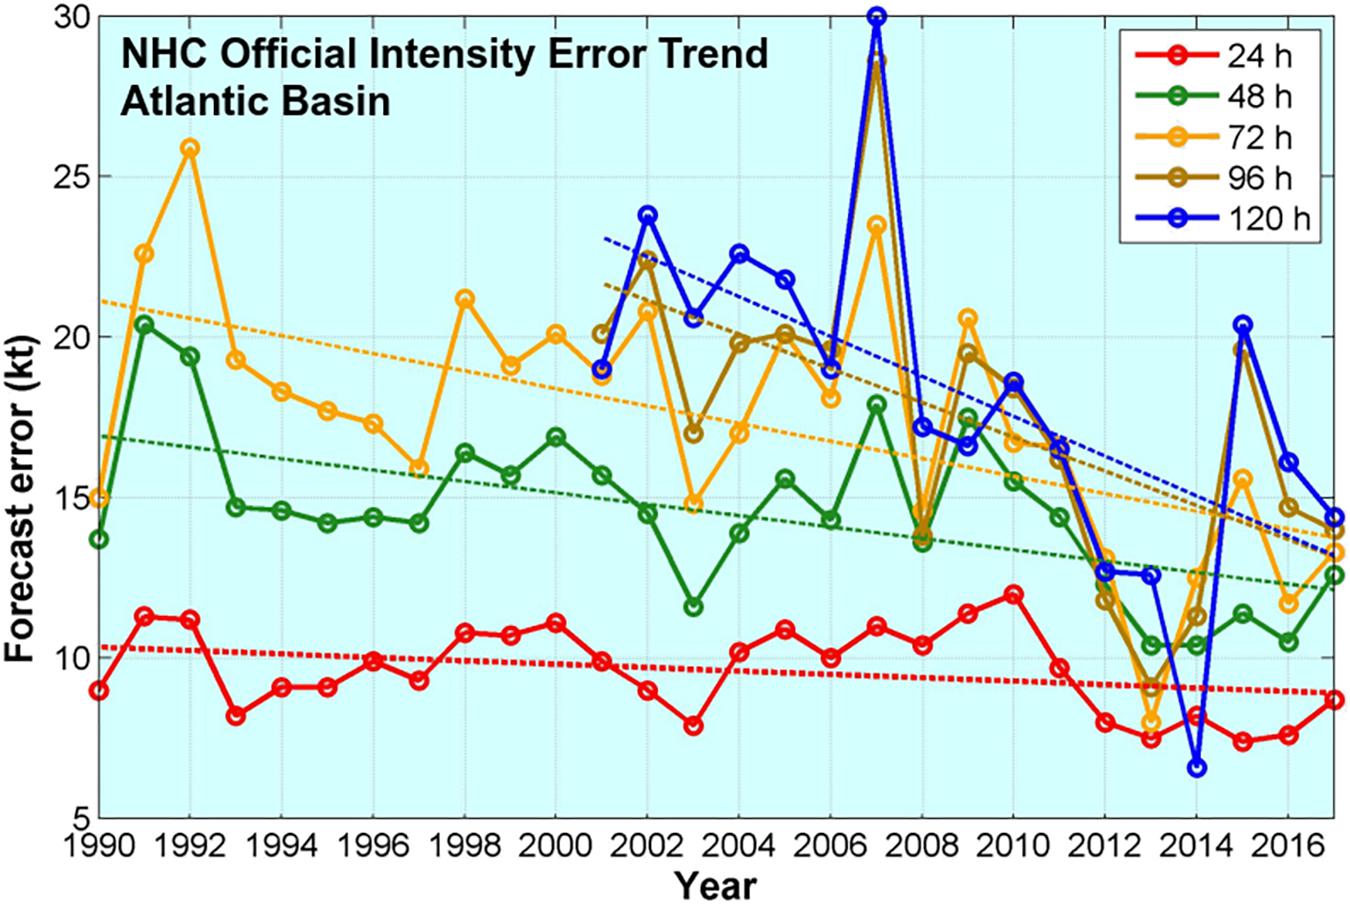
Figure 3. Official Atlantic hurricane intensity forecast error for the Atlantic basin reported by NOAA’s National Hurricane Center. Source: https://www.nhc.noaa.gov/verification/verify5.shtml.
Extratropical Bomb Cyclones
An EC is an extratropical cyclone that undergoes rapid deepening of its low pressure by 24 hPa or more in a period of 24 h (i.e., ‘explosive cyclogenesis’; Sanders and Gyakum, 1980). This process is predominantly maritime, with seldom occurrences over continental land masses. Though they are typically winter events, and their genesis involves processes distinct from those associated with TC development, ECs produce winds as strong as hurricanes and are often associated with large rainfall and storm surges. Explosive cyclogenesis is mainly observed within the four basins, namely the Northwest Pacific, the North Atlantic, the Southwest Pacific, and the South Atlantic (Black and Pezza, 2013). Though ECs in the North Atlantic basin occur preferentially along the east coast of North America, in the vicinity of the Gulf Stream current (Sanders and Gyakum, 1980), several cases of ECs have occurred offshore of western Europe (e.g., Young et al., 1987; Burt and Mansfield, 1988). Additionally, ECs do occasionally occur over continents. Examples include the “Cleveland Superbomb” in January 1978 (Hakim et al., 1995) and the more recent Colorado EC of March 2019.
Atmospheric baroclinic instabilities, upper-level vorticity coupling, and diabatic processes have been acknowledged as the main atmospheric mechanisms causing ECs genesis (Shapiro et al., 1999; Yoshida and Asuma, 2004; Kuwano-Yoshida and Asuma, 2008). Over the North Atlantic ocean, the number of explosive cyclogenesis events is modulated by the North Atlantic Oscillation (NAO), with positive NAO favoring a larger number of ECs due to stronger atmospheric baroclinicity (Pinto et al., 2009). Large-scale heat convergence linked with the Atlantic Meridional Overturning Circulation is also thought to influence atmospheric baroclinicity and modulate EC activity (Gómara et al., 2016). While these atmospheric and ocean conditions are mostly linked with the number of ECs developing, the strength, intensification and trajectory of the ECs are known for being directly influenced by upper ocean conditions (Kuwano-Yoshida and Minobe, 2017), with their genesis often associated with oceanic frontal systems. For example, the maximum frequency of explosive cyclogenesis and deepening is found to occur near the Kuroshio or the Gulf Stream; these oceanic western boundary currents are associated with large heat fluxes from the ocean to the atmosphere (Sanders and Gyakum, 1980; Ulbrich et al., 2009; Hirata et al., 2015, 2016, 2018; Kuwano-Yoshida and Minobe, 2017). Future projections suggest that strong ECs will tend to increase, while the total number of ECs is expected to decrease (Colle et al., 2015; Chang, 2017). Some of these climate model projections, however, cannot fully resolve sharp gradients linked with the Kuroshio and the Gulf Stream currents, and may lack in the accurate representation of the number of ECs forming (Haarsma et al., 2016). Further studies based on observations, or on high-resolution numerical simulations will likely be needed to confirm these trends.
In addition, the intensities of ECs that develop over warmer ocean regions are usually underestimated when compared to those that develop over cooler ocean regions (Kuwano-Yoshida and Enomoto, 2013). This is because cloud condensation associated with latent heat release over warm ocean areas is more important for rapid development than the upper-level vorticity forcing (Catto et al., 2010). For example, recent analyses using satellite-based high-resolution SST measurements suggest that ECs are affected by SST fluctuations associated with fronts and mesoscale eddies around western boundary currents (Booth et al., 2012; Hirata et al., 2015, 2016, 2018; Kuwano-Yoshida and Minobe, 2017). Considering that the western boundary currents such as the Gulf Stream and the Kuroshio are warming more rapidly than the global average rate (Wu et al., 2012), the ocean’s effect on ECs generation is likely to increase in the future. With respect to ocean response to ECs winds, recent ocean simulations suggest that ECs can induce surface horizontal divergence and upwelling reaching depths of 6,000 m, which can impact the deep ocean circulation and ecosystems through mixing and bio-geochemical transport (Kuwano-Yoshida et al., 2017).
Ocean Observations and Parameters in Support of Extreme Weather Studies and Forecasts
The Global Ocean Observing System (GOOS) provides measurements from a diverse suite of observing platforms that enable studies of the complex dynamics of extreme weather systems and help improve the overall skill of extreme weather forecast models. Accurate TC and EC forecasts based on coupled models, for example, require a correct representation of the upper-OHC, vertical density structure, and the mesoscale eddy field. This in turn requires upper ocean observations with high spatial and temporal resolution.
Analyses of ocean observations in the vicinity of TCs and ECs have led to improved understanding of their development and intensification, which occur over distinct geographic domains and during different seasons. The GOOS includes several multi-national ocean observing efforts that support studies and forecasts of both TCs and ECs. While the observational requirements and needs for TCs and ECs are different, some of the observing platforms are used in support of studies on both types of storms, and some are specifically used to provide observations for TCs or ECs.
Here we discuss the importance of the integrated ocean observing system and of targeted ocean observations, focusing on their application to TCs and ECs. We also provide an overview of these various components based on several successful examples, which illustrate applications that are helping understand the dynamics of these extreme weather systems, and are also helping to improve the overall skill of their forecast. To be most effective for operational forecasting, observing platforms should transmit their data in real-time via the Global Telecommunications System (GTS).
Ocean Observations
Satellites
Satellite-derived fields of SST1 and sea surface height (SSH)2 are used to estimate the upper-OHC (Leipper and Volgenau, 1972), which is sometimes also referred to as Tropical Cyclone Heat Potential3 (TCHP; Goni and Trinanes, 2003). The TCHP is defined as the excess heat content in the water column from the sea surface to the depth of the 26°C isotherm. TCHP fields can provide key qualitative and quantitative spatial information about areas where TCs may intensify, mainly by identifying the location and thermal characteristics of the oceanic upper layer, including warm eddies and current frontal regions (Meyers et al., 2014). For example, high values of TCHP (larger than approximately 50 kJ cm–2) have been shown to be linked to intensification of Atlantic hurricanes (e.g., Mainelli et al., 2008). It should be acknowledged, however, that TCHP from satellite-derived SST and SSHA can sometimes result in inaccurate estimates in regions that are strongly influenced by freshwater sources. In the Bay of Bengal, for example, where river water can persist in the near surface layer, salinity can have a dominant role in determining the subsurface density structure and the SSH (e.g., Yu and McPhaden, 2011); this can have a detrimental effect on the TCHP derived from satellite observations. Nevertheless, comparison of TCHP values derived from satellites and in situ observations in the Bay of Bengal has shown that satellite-derived estimates are generally unbiased, and estimates with a precision better than 20 kJ cm–2 are often obtained (Nagamani et al., 2012).
Fields of SST and TCHP are routinely used by the NOAA National Hurricane Center (NHC) and the Joint Typhoon Warning Center for their subjective TC intensity forecasts and quantitatively in the Statistical Hurricane Intensity Prediction Scheme (SHIPS; DeMaria and Kaplan, 1994; DeMaria et al., 2005) and rapid intensification aids (Kaplan et al., 2010; Knaff et al., 2018). Notable examples of use of satellite fields to assess links between the ocean and hurricane intensification include Hurricane Opal (Shay et al., 2000), super-typhoon Maemi (Lin et al., 2005), Hurricane Katrina (Figure 2; Goni et al., 2009), and “killer cyclone” Nargis (Lin et al., 2009).
Underwater Gliders
Autonomous underwater gliders (Rudnick, 2016) provide measurements of temperature and salinity in the upper several 100 m and are becoming key components of the ocean observing system (Liblik et al., 2016; Testor et al., 2019). In addition to the standard measurements of temperature, salinity, and depth-average currents, gliders can be equipped to measure current profiles (e.g., Todd et al., 2017), bio-optical properties, dissolved oxygen, and turbulent microstructure. Because of their adaptability and versatility, gliders fill important observational gaps in the ocean observing system (Liblik et al., 2016), particularly with respect to TC intensity forecasts. Glider observations are, for example, frequently assimilated into ocean-atmosphere coupled models and used for hurricane intensity forecasts. Sustained glider deployments monitor upper ocean conditions in areas frequently impacted by TCs (e.g., Domingues et al., 2015; Miles et al., 2015; Todd et al., 2018) and are part of the NOAA Hurricane Field Program4. Gliders also have particular utility measuring ocean processes on continental shelves before and during landfall of TCs, where alternative ocean observations are scarce (e.g., Glenn et al., 2016; Miles et al., 2017). In addition to measuring physical variables, gliders can carry specialized sensor payloads; sensors for key biogeochemical variables offer the promise of advancing our understanding of the role of TCs and ECs on ecosystems. For instance, dissolved oxygen measurements could help to characterize the storm-driven ventilation of subsurface waters in areas with oxygen minimum zones (e.g., the Arabian Sea; Morrison et al., 1999).
Since gliders move slowly (about 25 km/day) compared to most atmospheric cyclones O (300 km/day), actively piloting them into the paths of storms is generally not feasible due to the short lead times of forecasts. Thus, sustained deployment of gliders at locations prone to TCs or ECs (e.g., Domingues et al., 2015; Glenn et al., 2016; Perry et al., 2017) or along oceanic boundaries as part of boundary current observing systems (Todd et al., 2018, 2019; Testor et al., 2019) is preferable. Compared to rapid response deployments (e.g., Miles et al., 2015; Goni et al., 2017), sustained glider surveillance has the distinct advantage of providing critical high-resolution observations in the open ocean and over the continental shelf prior to storm arrival; these observations have been shown to improve the representation of the ocean in operational coupled forecast models of hurricane intensity (e.g., Dong et al., 2017). Most underwater glider data collected in support of Atlantic Hurricane studies and forecasts are transmitted in real-time to the GTS and U.S. Integrated Ocean Observing System (IOOS) underwater glider data assembly center5, and made available for immediate use by operational forecast centers.
Surface Drifters
Different types of drifters provide observations of ocean current velocities, SST, and sea level pressure (SLP) that are also used in support of weather forecasts, including TCs and ECs. Sustained global observations from drifters are used for constraining satellite SST errors and biases (e.g., Zhang et al., 2009) and have had a positive impact on global weather forecast throughout the troposphere thanks to assimilation of in situ SLP observations (Centurioni et al., 2017; Horányi et al., 2017; Ingleby and Isaksen, 2018). Horányi et al. (2017) showed that, in the case of intense cyclogenesis, SLP observations from drifters made possible large reduction in forecast errors, sometimes the largest among all the other assimilated observations. Furthermore, targeted deployments of drifters are sometimes carried out in front of TCs. During the Atlantic hurricane season, for example, Surface Velocity Program (SVP), Surface Velocity Program Barometer (SVPB) and Autonomous Drifting Ocean Station drifters (Centurioni, 2010; see also Centurioni, 2018, for a complete description of the drifter technology) are often air-deployed in front of TCs that may impact the US mainland. New drifters capable of measuring the directional wave spectra of surface gravity waves, termed Directional Wave Spectra Drifters (Centurioni et al., 2016, 2019) have also been deployed ahead of TCs. Successful deployments of various drifters have been carried out in the Atlantic Ocean during the following TCs: Fabian (2003), Frances (2004), Rita (2005), Dean (2007), Gustav (2008), Ike (2008), Isaac (2012) and Michael (2018), and in the western Pacific Ocean during Hagupit (2008), Jangmi (2008), Fanapi (2010), and Malakas (2010). In addition, drifters that are part of the Global Drifter Program6 array, often come close to TCs and provide valuable SST and SLP observations. In the 2013–2018 period a total of 116 SVP and SVPB drifters were located within 55 km of the tracks of systems that eventually developed into hurricanes (Centurioni et al., 2019). However, the effect of SLP drifter observation in improving TC track forecast has yet to be studied.
Air Deployed Profiling Instruments
Airborne profiling instruments are often deployed in targeted sampling mode in front of TCs in the Atlantic and Pacific basins. In the Atlantic, deployments of Airborne eXpendables Bathythermographs (AXBTs), Airborne eXpendable Conductivity Temperature and Depth (AXCTDs), and Airborne eXpendable Current Profilers (AXCPs) are generally conducted to sample ocean conditions ahead and under TCs as part of the NOAA Hurricane Field Program (Meyers et al., 2015; Jaimes et al., 2016; Zhang et al., 2018). Paired deployments of AXBTs and dropsondes, for example, provide collocated measurements of SST, air temperature, humidity and TC wind speed that allow for the estimation of bulk air-sea fluxes. Exchange coefficients used in such computations are based on direct flux data (Zhang et al., 2008). These data provide valuable information that is used to evaluate and improve TC model physics such as boundary-layer parameterizations (e.g., Zhang et al., 2015). In recent years, the following Atlantic TCs were sampled: Edouard (2014), Harvey (2017), Irma (2017), Maria (2017), Nate (2017), and Michael (2018). In the Pacific, paired deployments of AXBTs and dropsondes were also carried out during the 2010 Impact of Typhoon on Pacific (ITOP) international field experiment (D’Asaro et al., 2014, see section “The 2010 ITOP Field Campaign”).
More recently, the Air-Launched Autonomous Micro-Observer (ALAMO) (Jayne and Bogue, 2017) profiling float was developed to be deployed from an aircraft Sonobuoy-A size tube, similarly to AXBTs (Sanabia et al., 2013). A key distinction between ALAMO floats and other airborne expendable profiling instruments is that these floats are capable of sampling 100s of profiles continuously before, during, and after the passage of TCs for up to 6 months, depending on instrument configurations. During the 2014–2018 period, a total of 60 ALAMO floats were deployed in support of the NOAA Hurricane Field Program in both the Atlantic and eastern North Pacific basins.
Profiling Floats
Profiling floats (e.g., Riser et al., 2016; Roemmich et al., 2019) offer the advantage of providing a sustained long-term and large-scale record of most of global oceans. Temperature and salinity observations from Argo floats7 are routinely assimilated into operational ocean models (e.g., Chassignet et al., 2009) that are used to initialize the ocean component of hurricane forecast models. In addition, operational Argo floats have been found to be very important in regions where routine and/or opportunistic airborne AXBTs observations are lacking, e.g., in the case of “Cat-6” supertyphoon Haiyan which devastated the Philippines in 2013 (Lin et al., 2014).
Profiling floats also offer valuable information of upper ocean processes contributing to ECs formation and intensification. The typical observation interval for individual Argo floats, however, is 10 days, which is generally too long to capture the rapid air-sea interactions associated with enthalpy fluxes and exchanges. High-frequency and adaptive fine scale profiling float sampling are generally needed to fully capture mesoscale ocean features usually associated with storm intensification, and also to characterize the storm-induced upper ocean response in detail. Argo floats under developing ECs were used to obtain 73 high-frequency profiles of the upper 700 m at 6-h intervals during the 2015/2016 and 2016/2017 winters. These data were critical to understanding ocean changes under ECs in the Northwestern Pacific (Kuwano-Yoshida et al., 2018) and emphasize the advantage of adaptive profiling float sampling using two-way communication systems. Observation interval and depth of modern Argo floats can be controlled using two-way satellite communication. Interactive operation of the floats with satellite and assimilated data enables high-frequency and high-resolution observation at fronts, i.e., the floats observe short interval if satellite and assimilated data suggest that the floats are located near the SST fronts. These in situ observations will complement satellite observations, increase temporal sampling, and enable resolving the fine structure associated with SST fronts that may help improve EC and TC forecasts.
In addition, expanding coverage of Biogeochemical Argo float observations also offer opportunities for evaluating phytoplankton response to mixing forced by TCs and ECs (e.g., Chacko, 2017) and studying the role that these extreme weather events play in ventilating subsurface waters in oxygen minimum zones. These new applications of profiling floats will enable detailed investigations of the upper ocean processes involved in EC intensification and the role that these extreme weather events play in the ocean biogeochemistry within their main formation basins, such as the Northwest Pacific and North Atlantic ocean.
EM-APEX (Electromagnetic Autonomous Profiling Explorer) Floats
EM-APEX were developed to measure profiles of upper ocean temperature, salinity and currents. Velocity estimates are based on measuring the voltage induced by seawater moving through the earth’s magnetic field as first pioneered with expendable current profilers (Sanford et al., 1987; Shay et al., 1992) and later added to standard profiling floats (Sanford et al., 2007, 2011). EM-APEX floats were successfully air-deployed in front of Hurricane Frances (2004), during the ITOP missions in the western Pacific (2010), and more recently during Hurricane Michael (2018). The EM-APEX floats can profile to depths of 2000 m or over a specific depth region such as the mixed layer through the seasonal thermocline. Profiling configurations (i.e., sampling rate, and depth) can be changed via two-way Iridium communications, allowing for significant flexibility in an adaptive sampling before, during, and after storm passage, capturing air-sea interactions, and the oceanic response for several weeks following passage. For example, during Hurricane Michael (2018), a EM-APEX float sampled from 30 to 300 m during the storm at 1 h intervals to assess the role of current shear in vertical mixing processes to evaluate model parameterizations. With the high-resolution measurements, the evolution of the Richardson numbers could be determined at vertical resolution of 2–4 m in an active entrainment zone. In addition, the momentum flux from the surface wind stress into the surface mixed layer provides a method to back out the surface drag coefficient that are needed in examining the complex air-sea interactions that occur during TC passage (e.g., Shay and Brewster, 2010).
Biologging
It has also been used to collect in situ meteorological and physical oceanographic observations. Marine mammals (Campagna et al., 2000; Boehlert et al., 2001; Boyd et al., 2001), seabirds (Koudil et al., 2000; Watanuki et al., 2001; Charrassin et al., 2002; Wilson et al., 2002), sea turtles (Fukuoka et al., 2015; Narazaki et al., 2015) and fish (Block et al., 2001) have been adopted as autonomous samplers of oceanographic parameters such as temperature, conductivity and depth (Koudil et al., 2000; Block et al., 2001; Watanuki et al., 2001; Charrassin et al., 2002; Wilson et al., 2002; Fedak, 2013). These animals often live around western boundary currents and frontal systems where TCs and ECs are often observed (Figure 4). For example, biologging by sea turtles observed daily temperature profiles in surface layers in the northwestern Pacific (Fukuoka et al., 2015; Narazaki et al., 2015). The profiles were collected during 77 EC events in 6 consecutive winters. Both Argo floats and biologging captured rapid temperature changes under ECs. These ocean observations are crucial to identify near-surface baroclinic zones and ocean-atmosphere fluxes of heat and moisture. Such processes are crucial to the successful predictions and simulations of ECs.
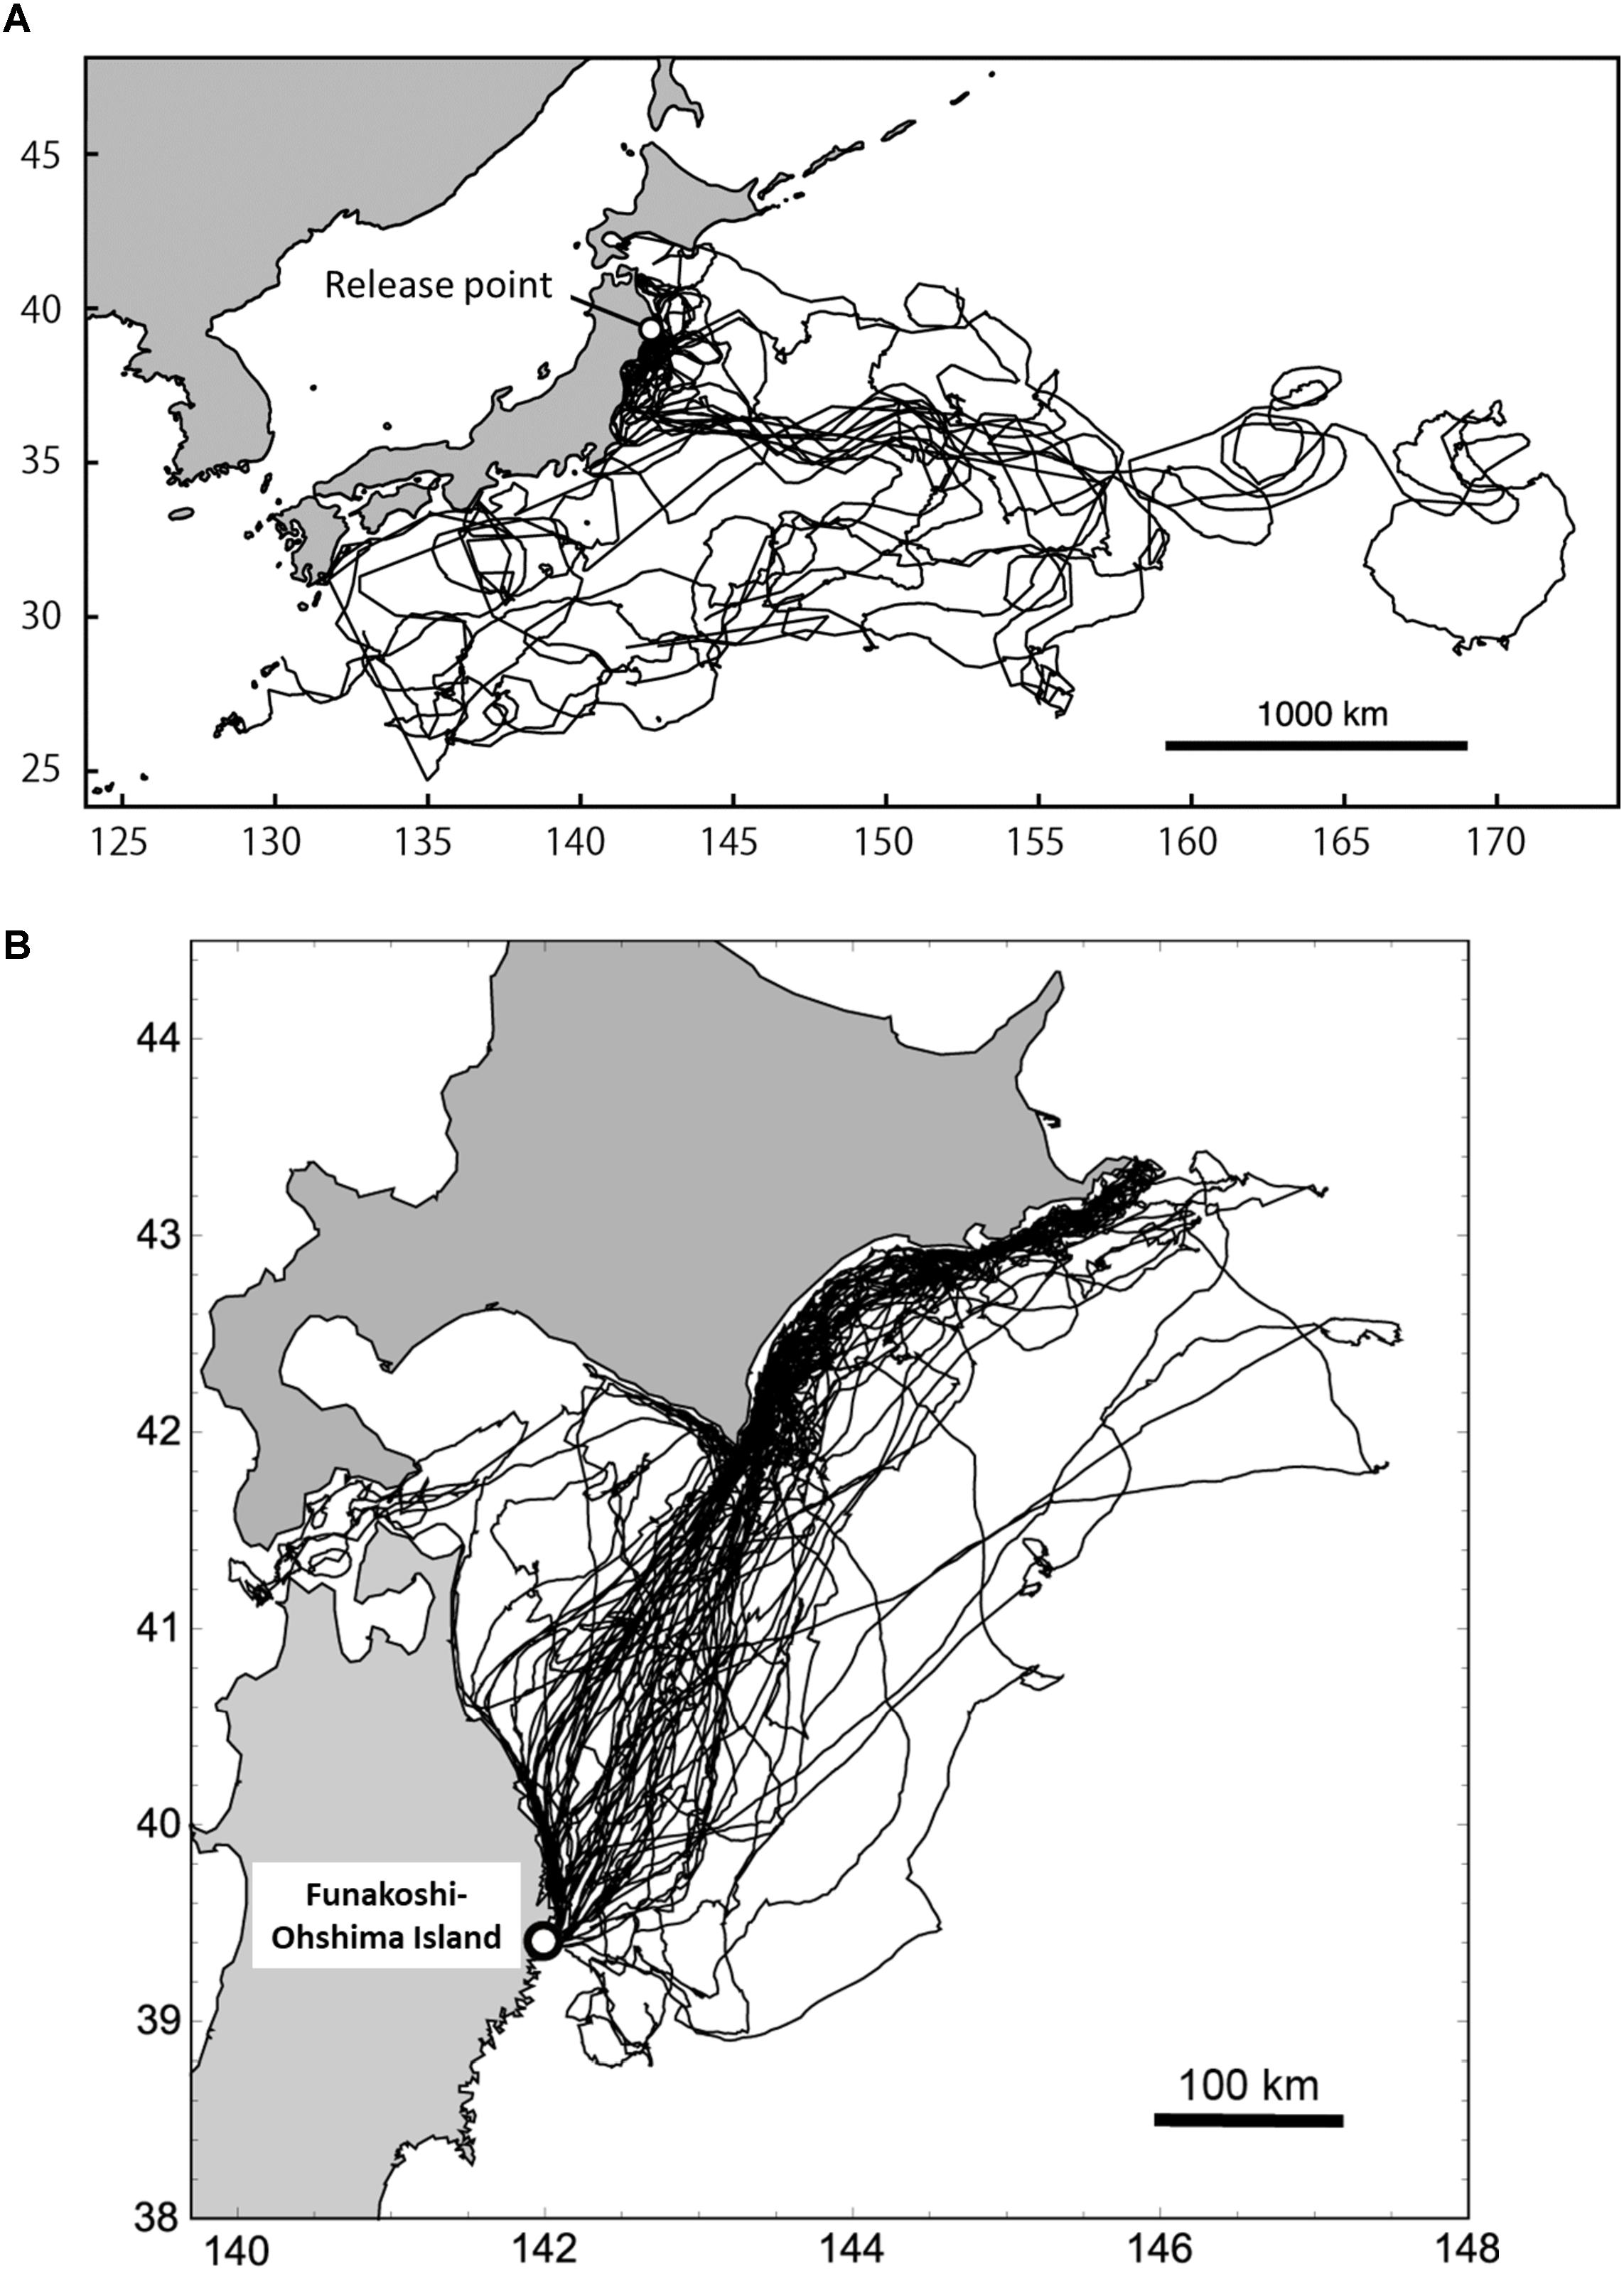
Figure 4. (A) Satellite tracks of 15 loggerhead turtles released from Sanriku coast, Japan (open circle) between 2010 and 2014. (B) Tracks of 33 streaked shearwaters from a breeding colony in Funakoshi-Ohshima Island, Japan (open circle) between August and September in 2013 and 2014.
Ocean Metrics for TC/EC Intensification Studies
Various parameters derived from in situ and remotely sensed observations that describe energy available in the upper ocean have been used to estimate the potential for TC and EC development and intensification. The TCHP is one example, but it has dimensions that differ from SST and so cannot be used in place of SST in numerical models. Moreover, Price (2009) demonstrated that depth-averaged temperature is a more robust metric of hurricane-ocean interaction than is TCHP. Ali et al. (2015) then used satellite-derived TCHP and the depth of the 26°C isotherm (D26) to estimate ocean mean temperature (OMT) with a few assumptions. This OMT estimate was a better predictor for Indian monsoon rainfall than SST (Ali et al., 2015; Venugopal et al., 2018). Use of OMT in place of SST in numerical models offers potential for improvement in cyclone forecasting.
Thermodynamically, the subsurface ocean affects TCs through its control of TC-induced cold SST wakes. When the cold wake is weak (less than about 0.5°C), TCHP is a very good predictor of TC intensification, exceeding the skill of other predictors such as SST and vertically-averaged temperature (Figure 5; Balaguru et al., 2018). However, when the cold wake is strong (>0.5°C) (e.g., when SST is very warm and temperature stratification is shallow) ocean dynamic temperature (Tdy) performs significantly better (Figure 5; Balaguru et al., 2018). Tdy is defined as the ocean temperature averaged from the surface to the post-storm mixed layer depth, which depends on the upper-ocean stratification as well as the TC intensity and translation speed (Balaguru et al., 2015). An additional limitation of temperature-based metrics such as TCHP and OMT is that they do not account for salinity, which has been shown to be important in all TC basins (Wang et al., 2011; Balaguru et al., 2012b, 2016; Grodsky et al., 2012; Neetu et al., 2012; Domingues et al., 2015; Foltz and Balaguru, 2016). Satellite-based sea surface salinity measurements, when combined with subsurface in situ observations, can provide further information about the salinity stratification. This additional metric, when incorporated into Tdy may result in further improvements to statistical TC prediction schemes and enable more meaningful validation of operational ocean analyses and forecasts.
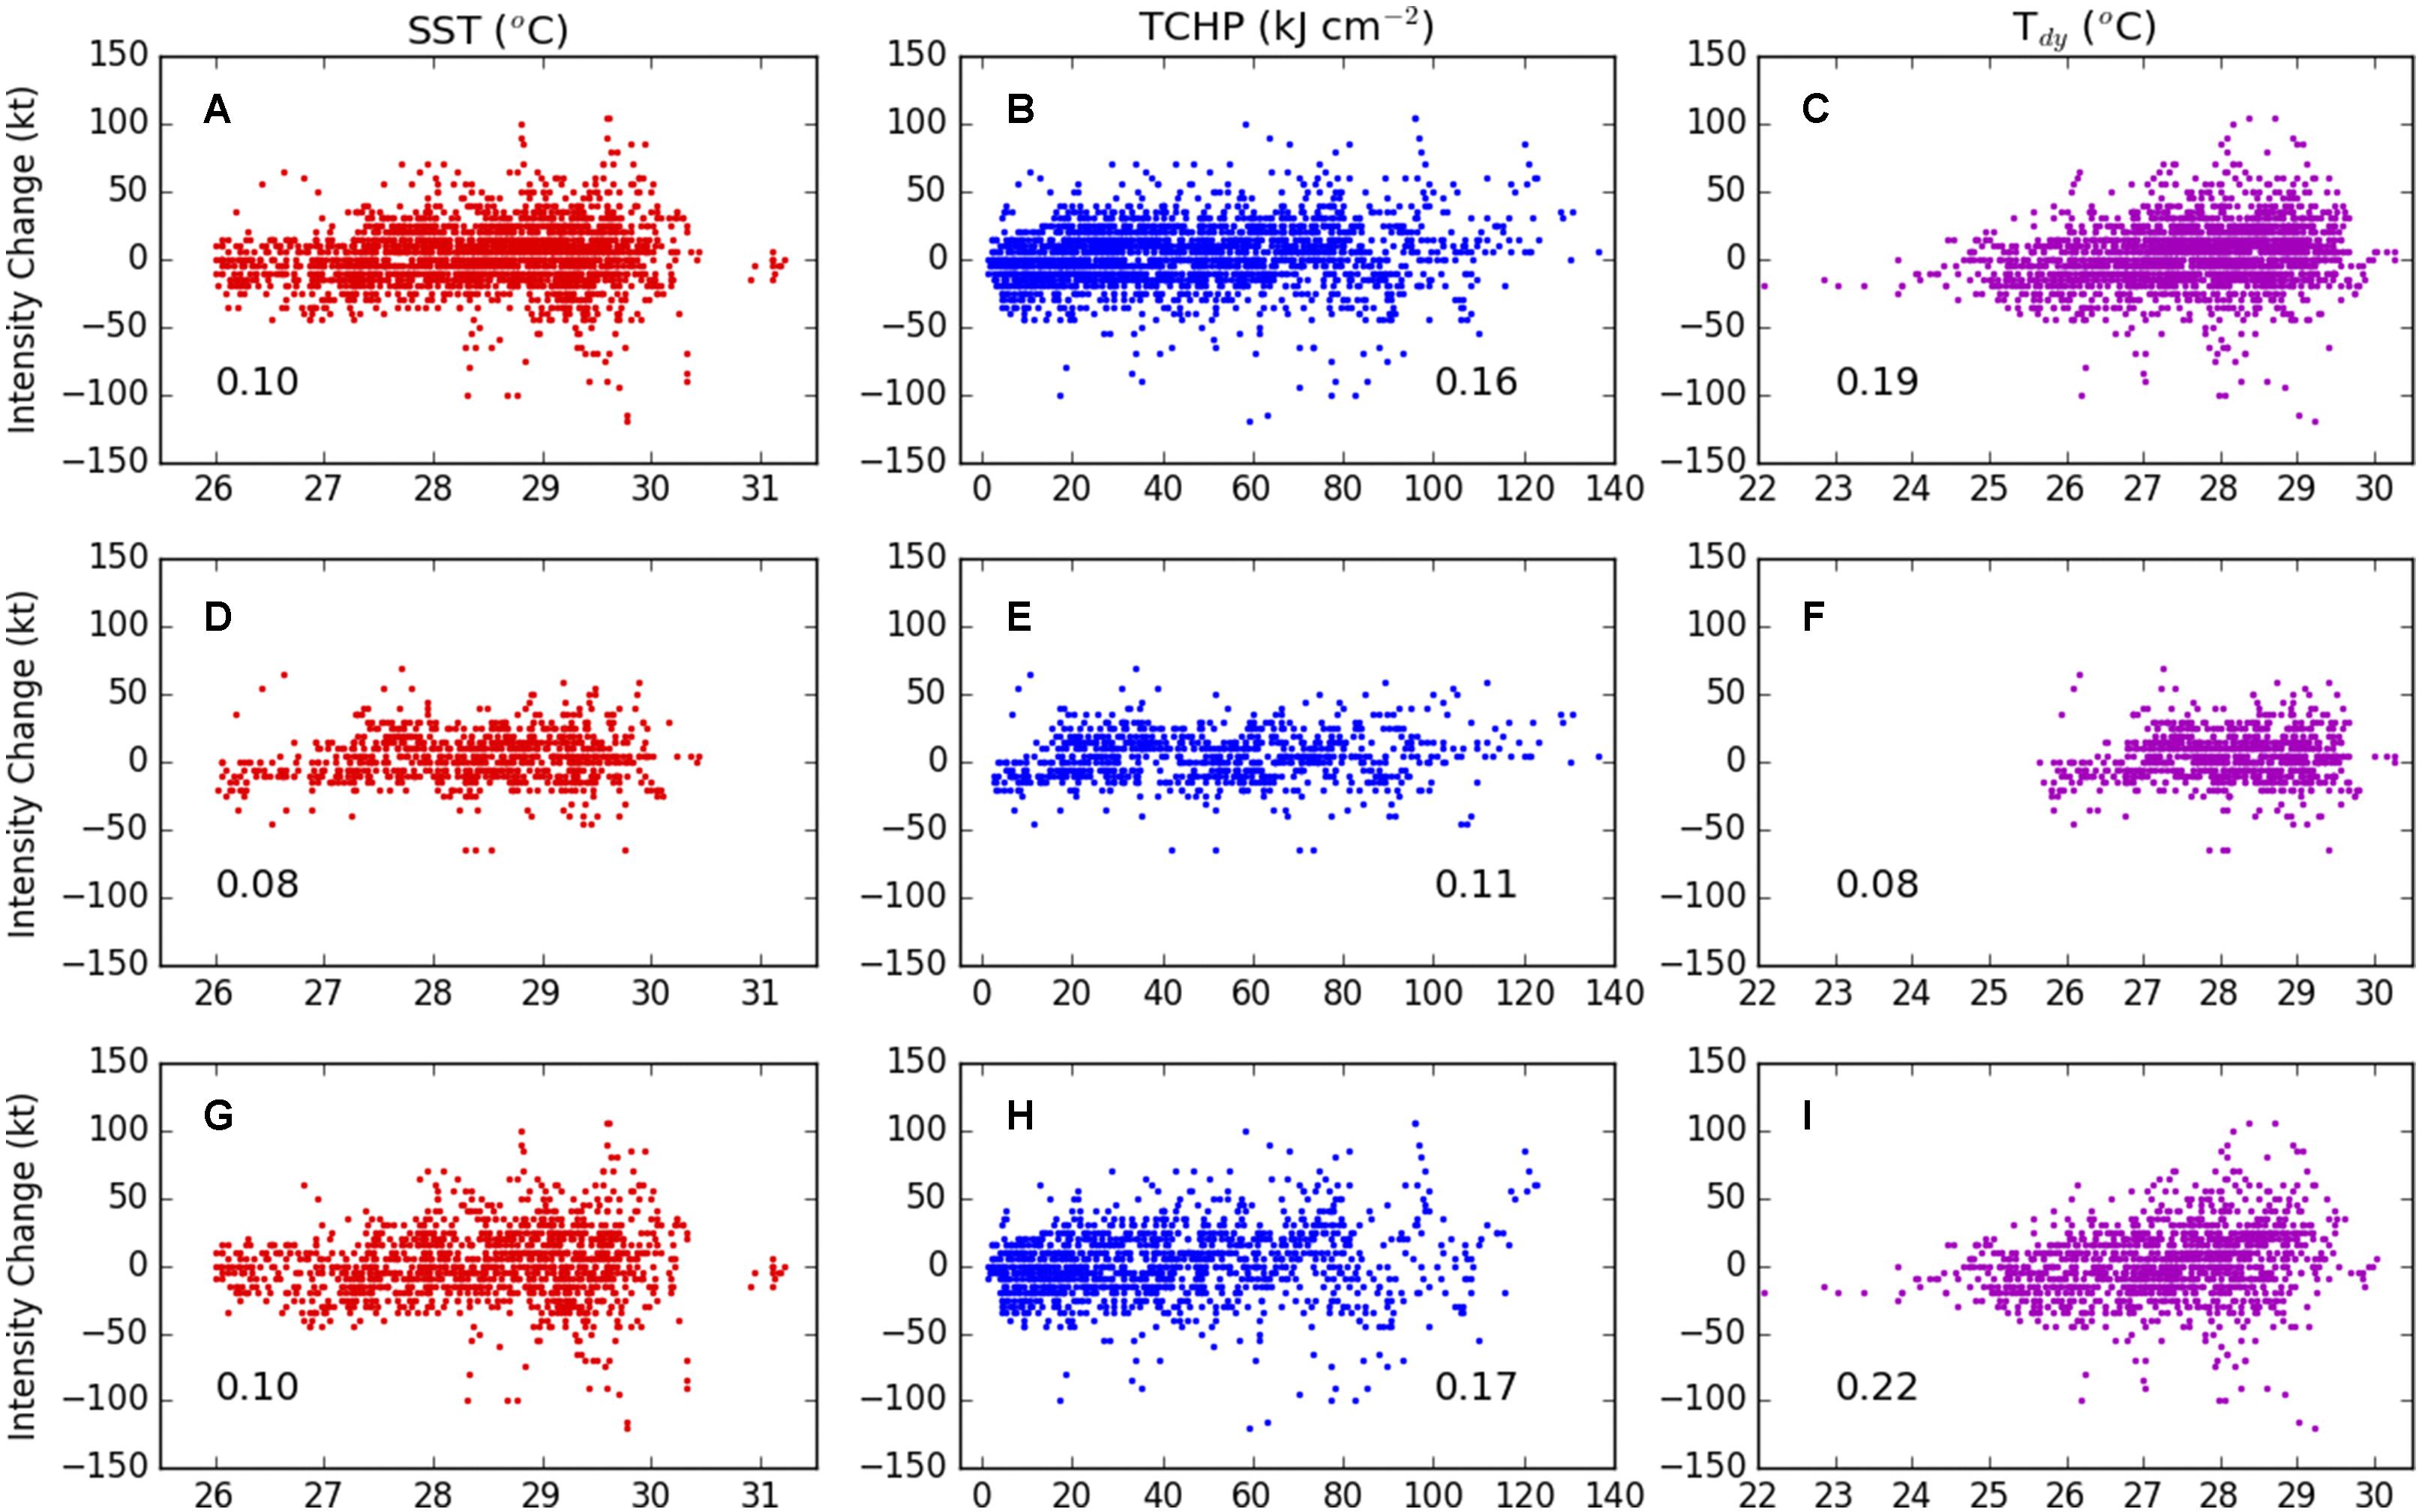
Figure 5. Scatter between 36-h intensity changes of Atlantic TCs and SST (red), TCHP (blue), and Tdy (magenta) for the 10-year period 2005–2014. (A–C) All storm locations, (D–F) cases where the magnitude of the hurricane-induced SST cooling is below 0.5°C, and (G–I) cases where the cold wake magnitude is greater than 0.5°C. Correlation coefficients are also indicated in each panel. Reproduced from Balaguru et al. (2018).
Highlighted Applications and Results
In this section, key results, sampling strategies, and applications of ocean observations in support of studies and forecasts of TCs and ECs are described. These case studies provide additional information on some of the successful examples of employing data derived from the GOOS, new pilot networks, and targeted deployments to enhance our understanding of the ocean-atmosphere interaction processes that can lead to TC and EC intensification.
The 2011 and 2012 Atlantic Hurricane Seasons: Hurricanes Irene (2011) and Sandy (2012)
Over the broad continental shelf of the Middle Atlantic Bight along the US East Coast, research carried out with gliders observations has shown that cool subsurface waters (i.e., the “Cold Pool”; Houghton et al., 1982) can be mixed with the surface waters under intense wind conditions, thereby impacting storm intensity. Since the Cold Pool is obscured from the view of satellites, in situ observations, such as those obtained by gliders, are needed to capture its properties and impact on cyclone intensity (Glenn et al., 2016; Seroka et al., 2016). For example, a glider deployed ahead of Hurricane Irene (2011) observed larger than usual ahead-of-eye-center cooling of over 6°C (Seroka et al., 2016) caused by intense mixing of surface waters with cold subsurface waters forced by the hurricane winds. Subsequent ocean and atmosphere model sensitivity studies identified this process as the missing component necessary to capture Irene’s rapid weakening just prior to landfall. In contrast, glider observations collected during Hurricane Sandy (2012) showed that the storm winds were downwelling favorable and led to offshore advection of the subsurface Cold Pool waters, which prevented upper ocean cooling and favored the sustained intensity of Sandy (Miles et al., 2015, 2017).
The 2014 Atlantic Hurricane Season: Hurricanes Gonzalo (2014) and Fay (2014)
Studies carried out using all ocean observations, including those from underwater gliders, in the western tropical Atlantic and Caribbean Sea, were used to assess the pre- and post-storm ocean conditions associated with Hurricanes Fay and Gonzalo (2014). When Hurricane Gonzalo passed north of Puerto Rico, the general background ocean conditions were provided by Argo floats and satellite-derived SST and SSH fields. In addition, there was one glider surveying upper ocean temperature and salinity structure in the vicinity of the projected path of Gonzalo (Figure 6A). This glider was the only observing platform to capture the presence of a 20-m-thick barrier layer (Domingues et al., 2015), a salinity stratified layer (e.g., Sprintall and Tomczak, 1992) within the deeper isothermal layer. This layer inhibited vertical mixing and limited surface cooling forced by Gonzalo’s winds to only 0.4°C, allowing the storm to intensify to Cat-4 (Domingues et al., 2015). When Gonzalo subsequently crossed the path of Fay near Bermuda (Figure 6A), it weakened from Cat-3 to Cat-2 due to the upper ocean cooling of approximately 4°C observed in the wake of Fay (Goni et al., 2017).
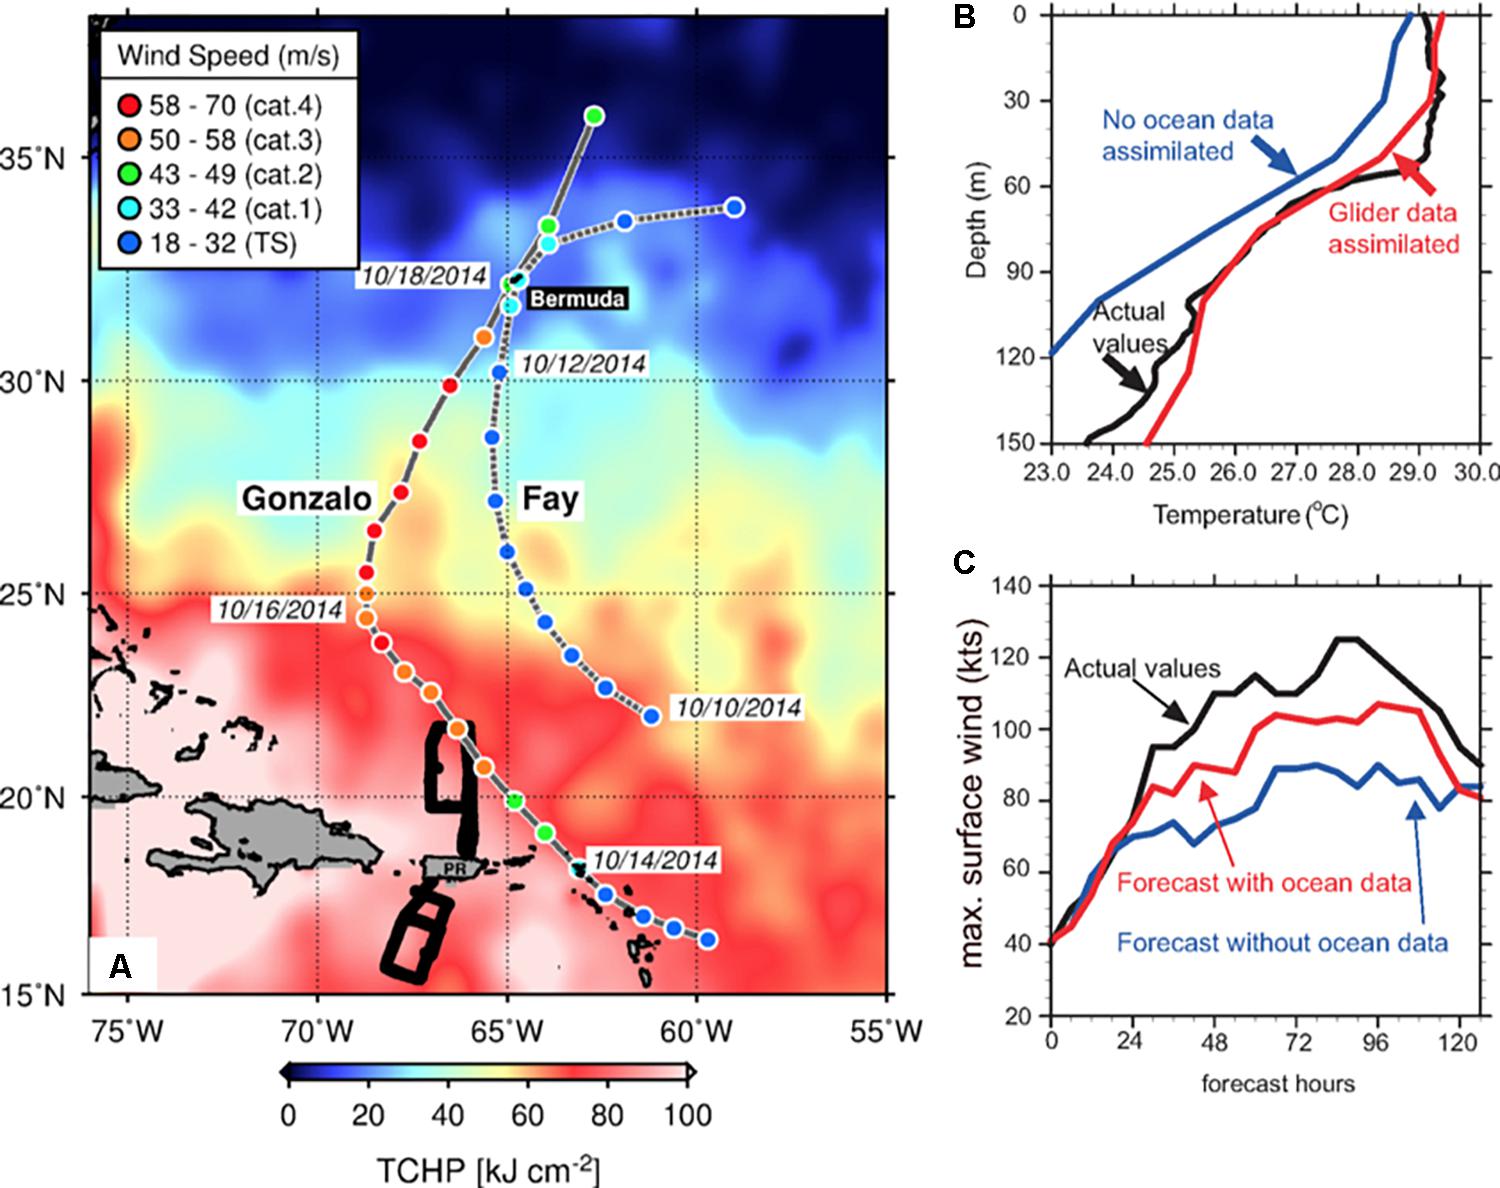
Figure 6. (A) Tracks of Hurricanes Gonzalo (2014) and Fay (2014) superimposed on the altimetry-derived tropical cyclone heat potential (TCHP) during October 2014. (B) Impact of glider temperature profiles on the initialization of HYCOM-HWRF. (C) Impact of glider and other ocean data to reduce errors in TC intensity (maximum wind speed) during the forecast of Gonzalo tested on October 13, 2014. Figure adapted from Goni et al. (2017).
The 2017 Atlantic Hurricane Season: Hurricanes Harvey, Irma, Jose, Maria, and Nate
The 2017 Atlantic hurricane season was one of the most active in recent history with 17 named storms, and six major hurricanes. Underwater gliders, profiling floats, XBTs, airborne observations, and other observing platforms collected crucial ocean data to assess upper ocean conditions and changes before, during, and after the passage of multiple hurricanes. Here we describe ocean observations and key results from Hurricanes Harvey, Irma, Maria, Jose, and Nate. Data from the ocean observing system were used in support of operational hurricane intensity forecasts.
In August, Hurricane Harvey developed in the tropical Atlantic and passed through the Caribbean Sea south of Puerto Rico. In this area, observations from one underwater glider showed that a relatively shallow mixed layer favored cooling of the upper ocean. Together with the moderate wind shear, this contributed to Harvey’s lack of intensification within the Caribbean. Once Harvey reached the Gulf of Mexico, where TCHP derived from Argo floats was at a record level and SST exceeded 30°C (Trenberth et al., 2018), it intensified from a tropical depression (16 m s–1/56 km h–1 sustained winds) into a Cat-4 hurricane (59 m s–1/212 km h–1 sustained winds) in less than 48 h before making landfall along the Texas coast with devastating effects.
In September, SST values of ∼30°C were observed across the western Atlantic and Caribbean (Figure 7), which, along with low wind shear, helped sustain the development and intensification of Hurricanes Irma, Maria and Jose (Camp et al., 2018). Hurricane Irma, the strongest TC globally in 2017, reached its maximum intensity (Cat-5) on September 6, while traveling over waters north of Puerto Rico and Hispaniola. Observations from underwater gliders showed that a fresh water barrier layer ∼15 m thick (Figure 8A) inhibited mixing between the upper ocean and colder underlying waters, similar to Hurricane Gonzalo (2014; Domingues et al., 2015; Dong et al., 2017). These observations also revealed that the upper 50 m of the ocean cooled by approximately 1°C as a result of storm-induced mixing. A few days after Irma, Hurricane Jose passed 2–3 degrees of latitude to the north of Irma’s track. Jose’s trajectory coincided with the cold wake left by Hurricane Irma, so it interacted with a relatively cooler and well-mixed upper-ocean as observed by underwater glider data. These cooler ocean conditions may have contributed to its weakening from Cat-4 to Cat-3. Later in the month, Hurricane Maria passed through the Caribbean Sea and then the same area as Irma in the tropical North Atlantic. Following a landfall in Dominica, Maria reached peak intensity on September 20 with maximum sustained winds of 78 m s–1 (280 km h–1). Underwater glider observations revealed the existence of a very stable barrier layer that was approximately 30 m deep along the path of Maria (Figure 8A), providing favorable ocean conditions for intensification. On September 20, Maria made landfall in Puerto Rico as an intense Cat-4 hurricane. By the end of September, positive SST anomalies recorded before the passage of these hurricanes had dissipated due to the intense mixing caused by these major storms, and SSTs closer to neutral conditions were observed (Figure 7A). Farther north, Todd et al. (2018) used glider observations and volume transport measurements in the Florida Straits to show that the Gulf Stream exhibited a large freshwater anomaly that was attributable to rains from Irma and also a transient reduction in volume transport that was attributable to wind forcing associated with the passing storm; further studies with numerical simulations are needed to better understand the dynamics of the storm impacts on the western boundary current.
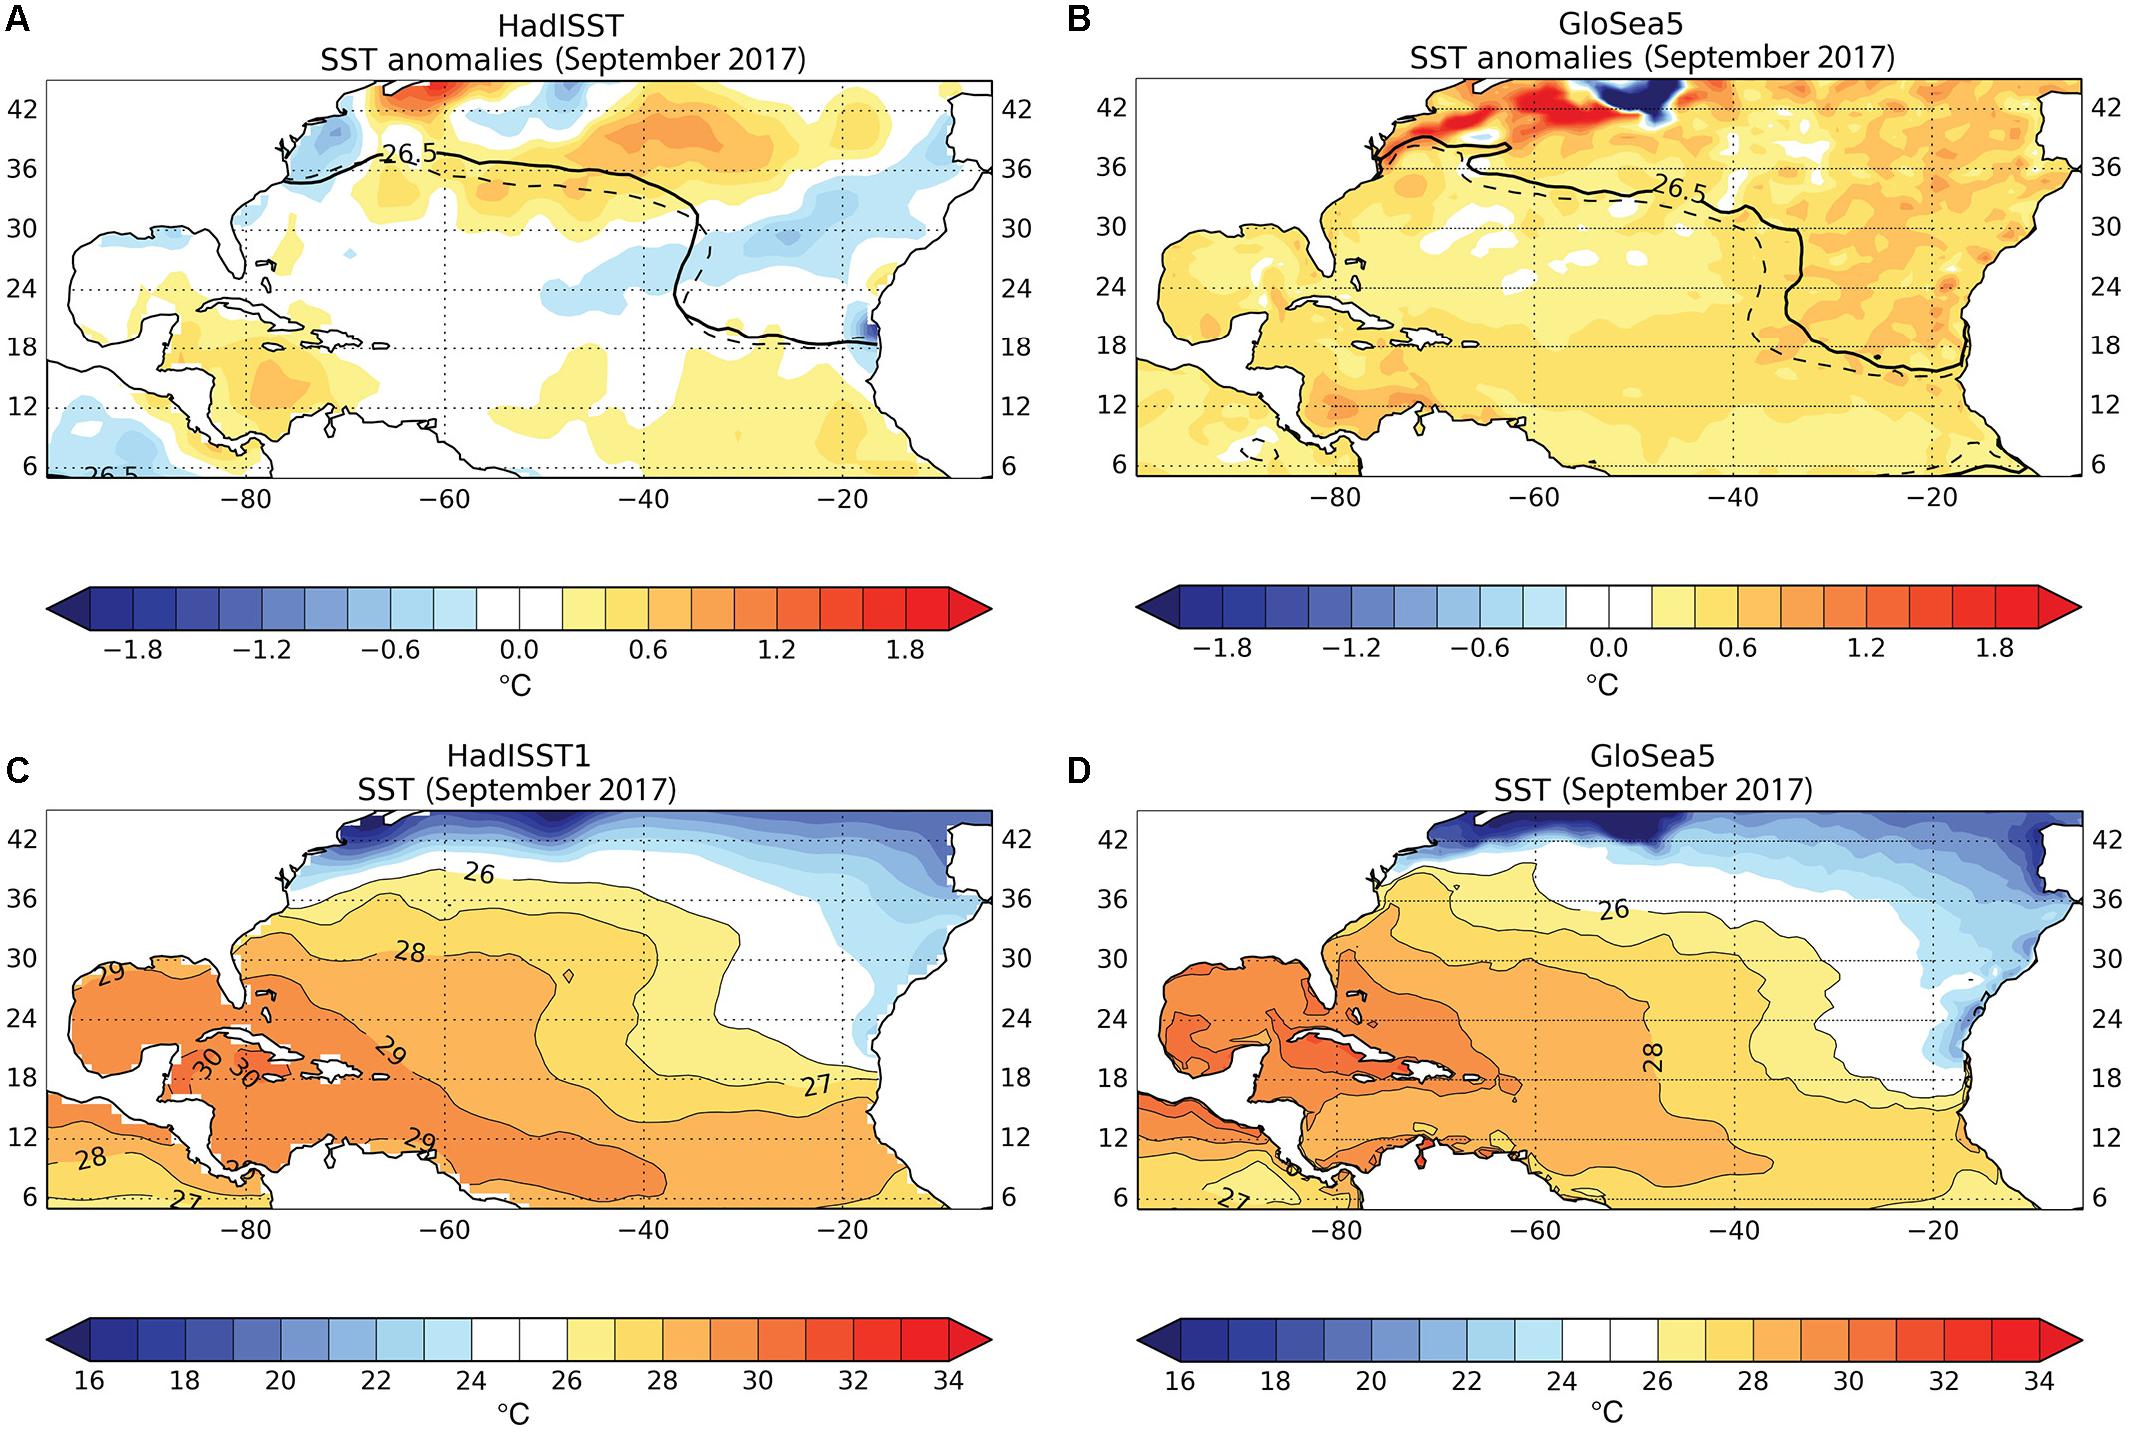
Figure 7. North Atlantic sea surface temperature forecasts: (A) observed and (B) forecast mean Atlantic SST anomalies during September 2017. The location of the 26.5°C isotherm during September 2017 (solid black line) relative to average September conditions during 1993–2015 (dashed line) are also shown. (C) Observed and (D) forecast mean Atlantic SSTs during September 2017. Anomalies relative to September 1993–2015. Adapted from Camp et al. (2018).
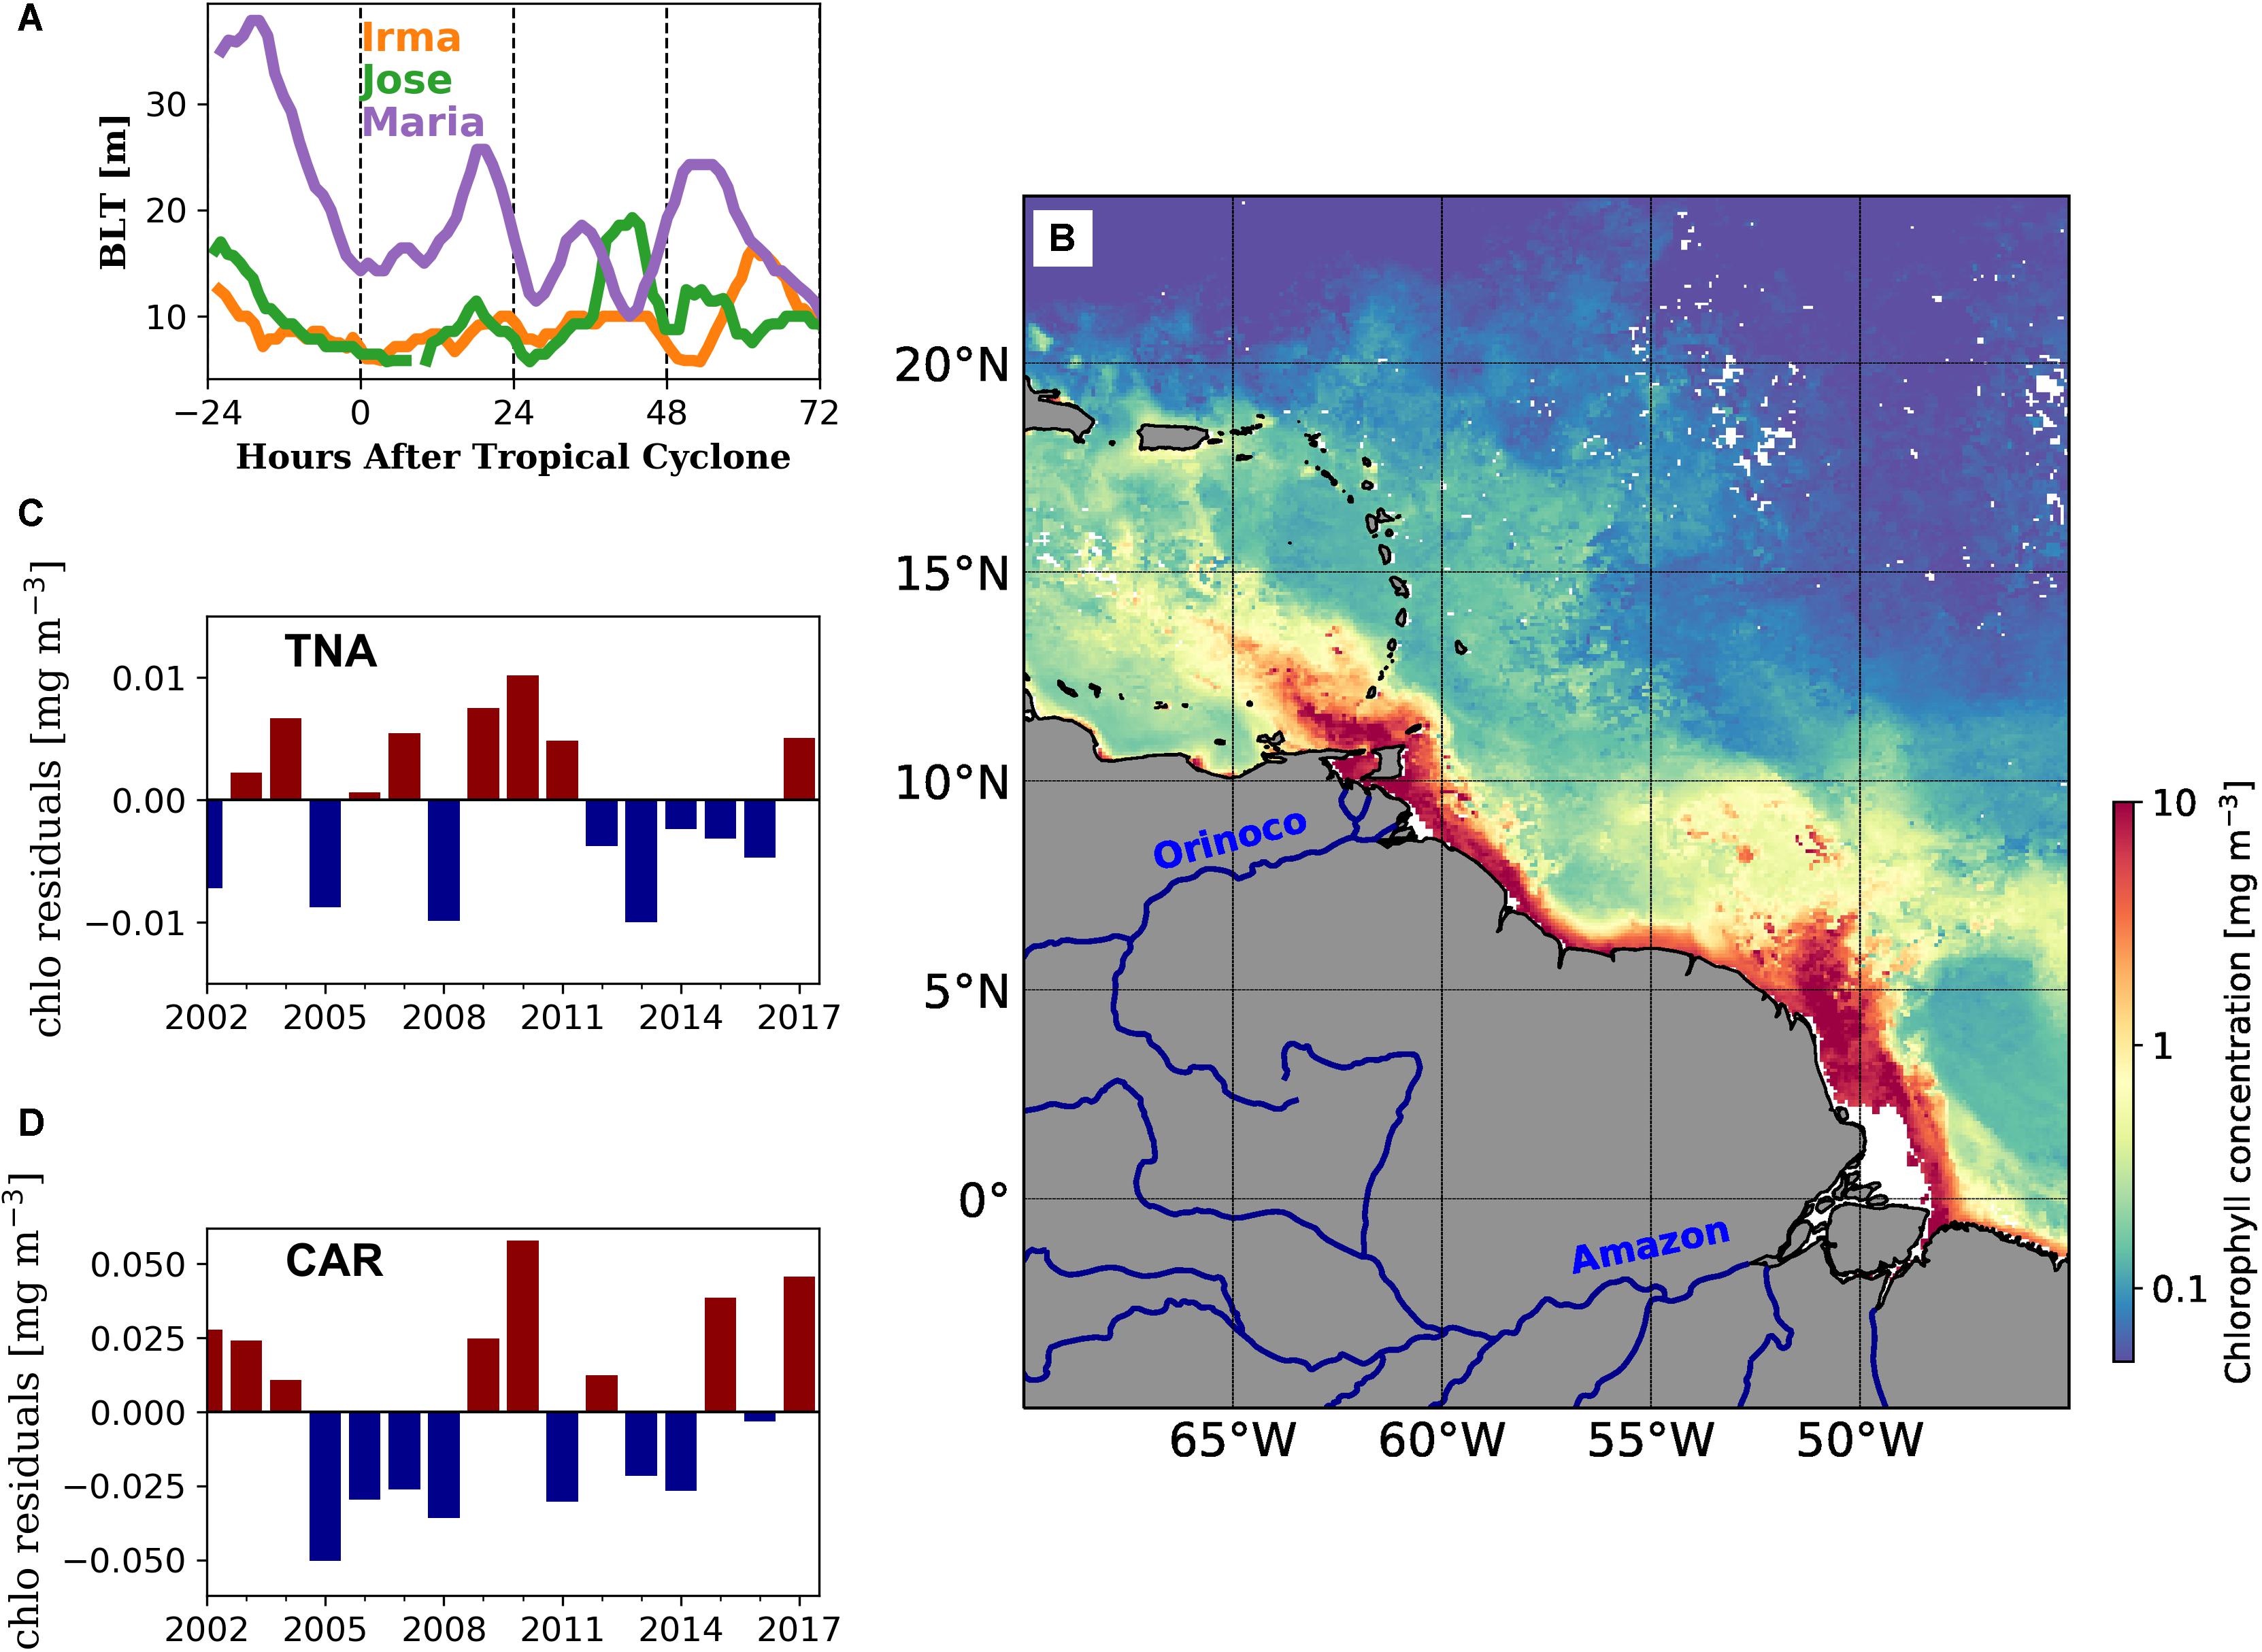
Figure 8. (A) Barrier layer thickness (BLT) calculated using underwater glider observations collected in areas off Puerto Rico under major 2017 TCs. (B) Average surface chlorophyll concentration for August 2017 derived from MODIS-Aqua data. Major rivers contributing to elevated chlorophyll concentrations are indicated. (C) Chlorophyll anomalies during hurricane season in the Tropical North Atlantic (TNA) Ocean for areas off Puerto Rico. (D) Same as (C), but for areas in the Caribbean Sea (CAR) off Puerto Rico.
In October, Hurricane Nate developed and steadily gained strength over warm waters of the northwestern Caribbean Sea. Once Nate reached the Gulf of Mexico, EM-APEX floats located near the projected track (Figure 9) were reprogrammed to profile every 2 to 4 h, returning vertical profiles of temperature, salinity, currents, dissolved oxygen, chlorophyll fluorescence, backscatter as a proxy of particle concentration, and chromophoric dissolved organic carbon. In addition, 140 AXCPs and AXCTDs were deployed from the NOAA WP-3D aircraft prior to, during and after Nate (Figure 9). These observations showed an upper ocean velocity response with magnitude of 0.5–0.75 m s–1 and rotation of the current vectors with increasing depth that led to strong current shear at depths of 40–60 m. The development of strong shear favored the deepening of the oceanic mixed layer under Nate by 10 to 15 m and mixed layer cooling of 1.5–2°C. The observed response was predominantly near-inertial in character, and likely impacted the air-sea fluxes and the intensity and structure of the storm (e.g., Jaimes et al., 2016).
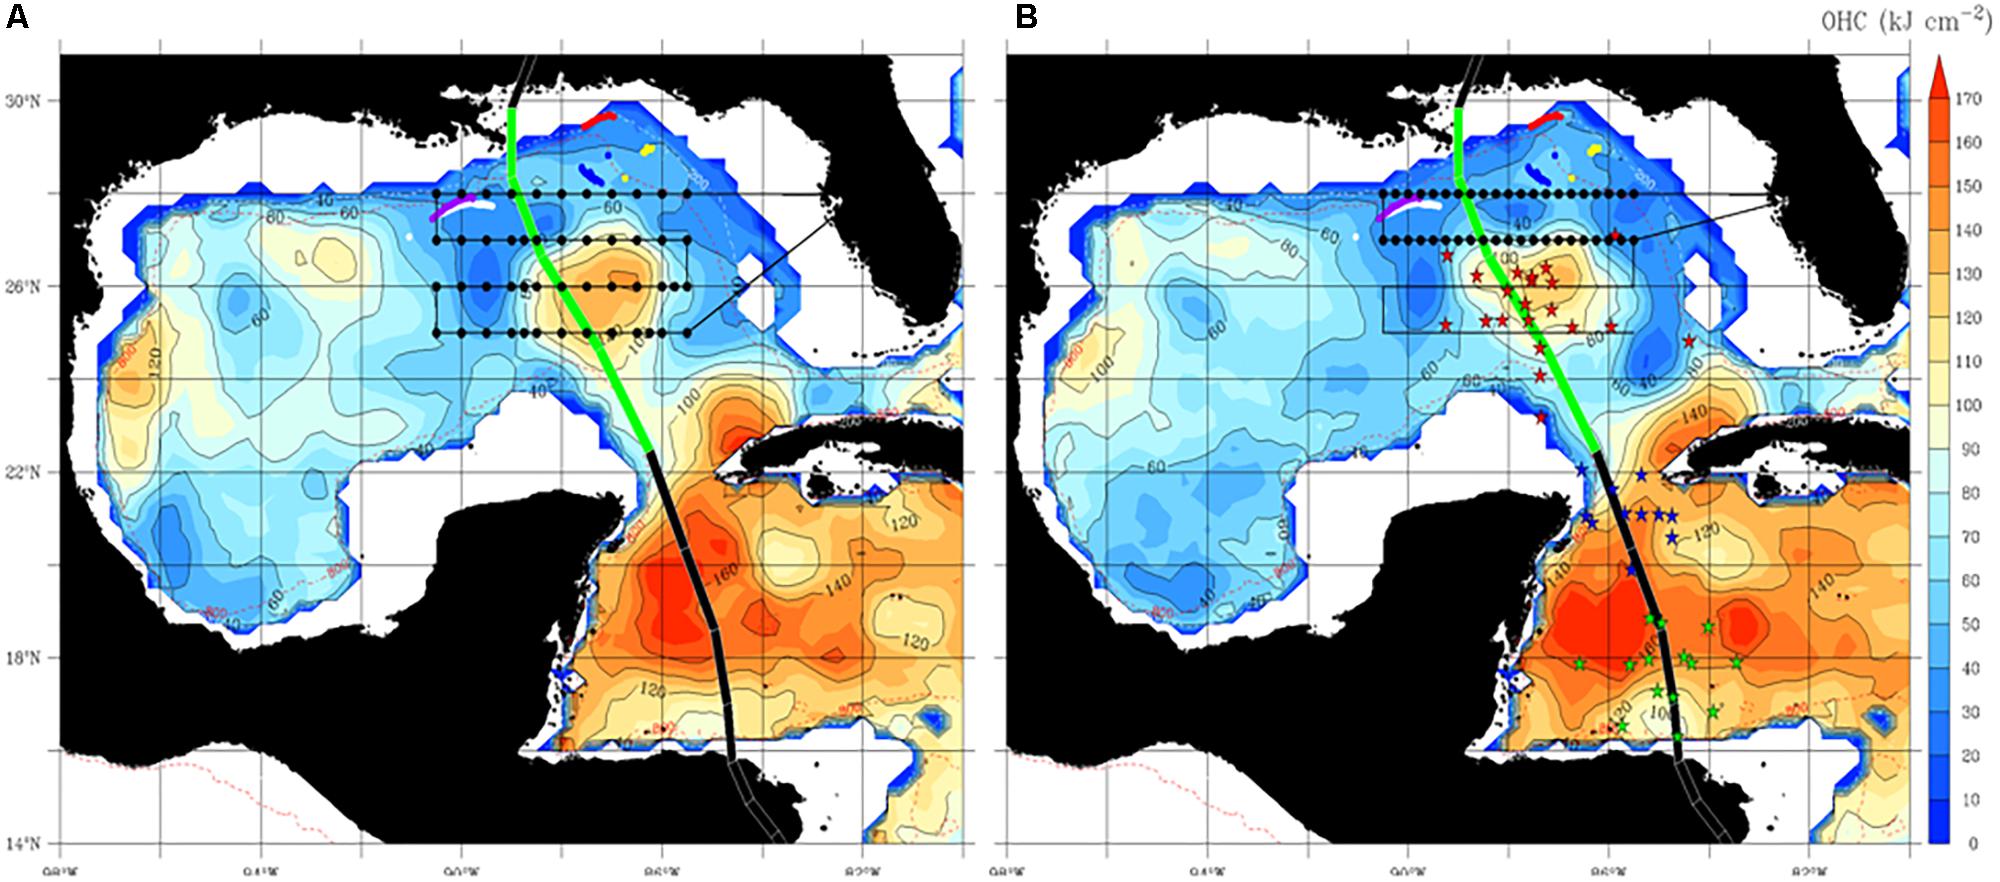
Figure 9. The separation of a LC warm core eddy during the passage of Hurricane Nate of 2017. The color scale is for OHC relative to the 26°C isotherm, from the satellite fields (Meyers et al., 2014). APEX-EM floats (purple, white, red, and yellow dots) that were active during Nate’s passage of Nate over the Gulf. (A) Pre-storm OHC structure on 5 October, 2017. (B) Post-storm OHC structure on 10 October, 2017. Black dots in (A,B) depict airborne ocean profilers deployed from NOAA WP-3D research aircraft; green, blue, and red stars in (B) represent in-storm oceanographic and atmospheric airborne profilers.
Impact of Riverine Outflows on Tropical Cyclones
Areas in the Caribbean Sea and Tropical North Atlantic, where hurricanes commonly intensify, are sensitive to different freshwater sources, including major rivers such as the Amazon and Orinoco (e.g., Kelly et al., 2000; Balaguru et al., 2012a; Johns et al., 2014), and the Mississippi River (Goni and Domingues, 2019), which can contribute to the formation of barrier layers. In regions under the influence of strong fresh water sources, such as in the Bay of Bengal, low salinity conditions at the surface may sustain thermal inversions in the upper layer, which may further help suppress the TC-induced SST cooling (e.g., Sengupta et al., 2008). Barrier layers can be tens of meters thick, and have been indicated as a potential contributor to the rapid intensification of several TCs worldwide (e.g., Balaguru et al., 2012b).
Several major Atlantic hurricanes in 2017 encountered pre-existing barrier layer conditions along their trajectories (see section “The 2017 Atlantic Hurricane Season: Hurricanes Harvey, Irma, Jose, Maria, and Nate,” Figure 8A). Analysis of satellite-derived chlorophyll data8 for August 2017 (Figure 8B) indicates that freshwater plumes from the Amazon and Orinoco rivers were advected into the Caribbean basin, contributing to barrier layer formation. Comparison with historical chlorophyll data for the tropical North Atlantic Ocean and Caribbean Sea (Figures 8C,D) suggests that entrainment of freshwater plumes from these rivers into the basin-scale circulation in 2017 may have caused unusually strong freshwater transport into these areas. While investigation is still ongoing to assess the potential impact of these freshwater conditions on the 2017 hurricanes, these results emphasize that the correct representation of salinity conditions within coupled TC forecast models can be key to produce accurate hurricane predictions. This may be especially true for areas that are particularly sensitive to large freshwater sources, such as the Caribbean Sea, Gulf of Mexico, and tropical North Atlantic Ocean.
Development of Biologging as an Ocean Observation Platform for ECs
Flight and drift paths of sea birds soaring and floating over the ocean surface enable measurement of fine-scale winds and currents. Yonehara et al. (2016) and Goto et al. (2017) found out that fine-scale flight trajectories by recording one position per second and minute provide 5-min to 1-h interval surface wind direction and speed along the trajectories. The bird-estimated wind directions showed good agreement with those from satellite, although wind speeds were slower than satellite winds because sea birds flew at lower altitudes than 10 m at which satellite winds were calibrated. Only the wind estimates from three birds had meaningful impact on data assimilation when severe rainfall occurred in Japan associated with two typhoons using regional numerical forecast system (Wada et al., 2017). Yoda et al. (2014) developed a new method for obtaining in situ ocean current measurements by using sea birds with GPS/GNSS loggers floating at the surface as Lagrangian current sensors akin to drifting buoys. The sea birds forage boundary areas between two oceanic mesoscale eddies where primary productivity and prey density are thought to be high. The current data from sea birds improved reproducibility of eddies through data assimilation into an operational ocean nowcast/forecast system (Miyazawa et al., 2015).
Biologging of temperature and salinity measurements derived from turtles also has the potential for improving numerical simulations in support of EC forecasts. Loggerhead turtles, for example, favor waters warmer than 15°C, which corresponds to the northern edge of the Kuroshio and its extension near the surface in winter. A feasibility study for data assimilation of temperature measurements by the turtles suggests that the turtle measurements captured the warm core rings separating from the Kuroshio Extension better than the Oyashio intrusion branches (Miyazawa et al., 2019). The improved ocean representation of such features may allow for better EC forecast through a more accurate simulation of air-sea interaction fluxes associated with these warm ocean rings and meanders.
The 2010 ITOP Field Campaign
The ITOP international field campaign in the western North Pacific Ocean is an important example for future field observation strategy and planning (Figure 10; D’Asaro et al., 2014). The western North Pacific was chosen because this basin is where the largest number and the most intense TCs are usually recorded (Figure 1). In the summer of 2010, the ITOP field campaign used targeted aircraft AXBT observations to collect the pre-storm temperature profiles ahead of three TCs of distinct intensity: Megi, Fanapi, and Malakas. Supertyphoon Megi (with peak intensity 82 m s–1/296 km/h, Cat-5) was the most intense TC recorded globally until 2010, while Fanapi was a Cat-3 moderate TC and Malakas was a Cat-2 TC. The pre-TC ocean conditions were different for these three TCs (Figure 11A). Among the three, Megi intensified over warm ocean temperatures, characterized by TCHP values larger than 140 kJ cm–2, and D26 of 120 m. In contrast, both Fanapi and Malakas traveled over waters with shallower D26 and TCHP values lower than 100 kJ cm–2. Analysis of the available ocean observations revealed that these large differences in upper-OHC played a key role in the intensification of these TCs (Lin et al., 2013a; D’Asaro et al., 2014).
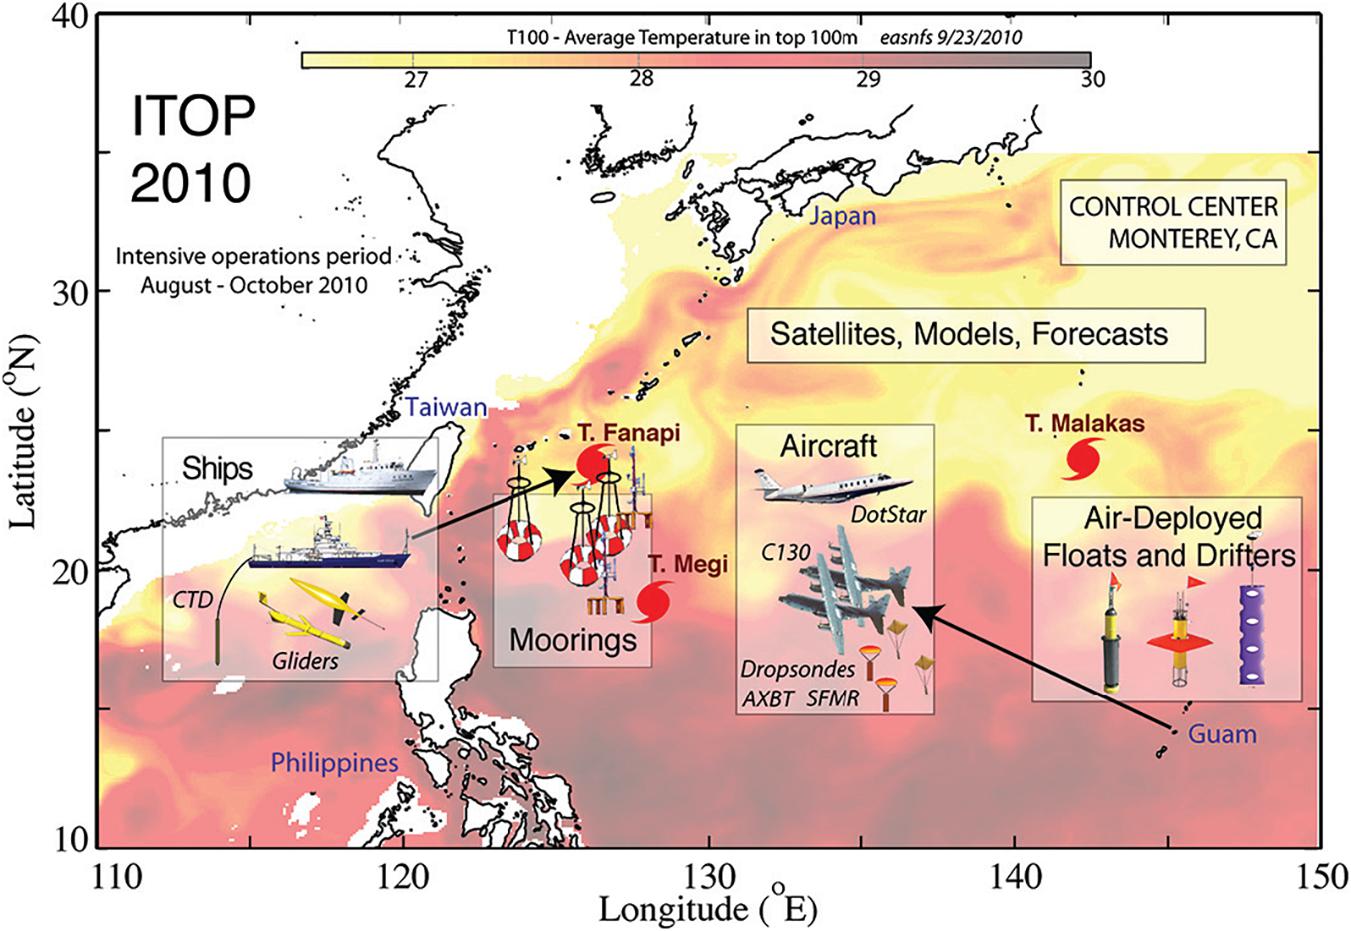
Figure 10. Background color map of average temperature for the upper 100 m (T100) from the East Asia Seas Nowcast/Forecast System on 23 September, 2010. Overlaid are graphical representations of the ITOP operations area, experimental tools, and strategy. Locations of the three major ITOP storms at the time of maximum sampling are shown by storm symbols. Figure originally from D’Asaro et al. (2014), ©American Meteorological Society. Used with permission.
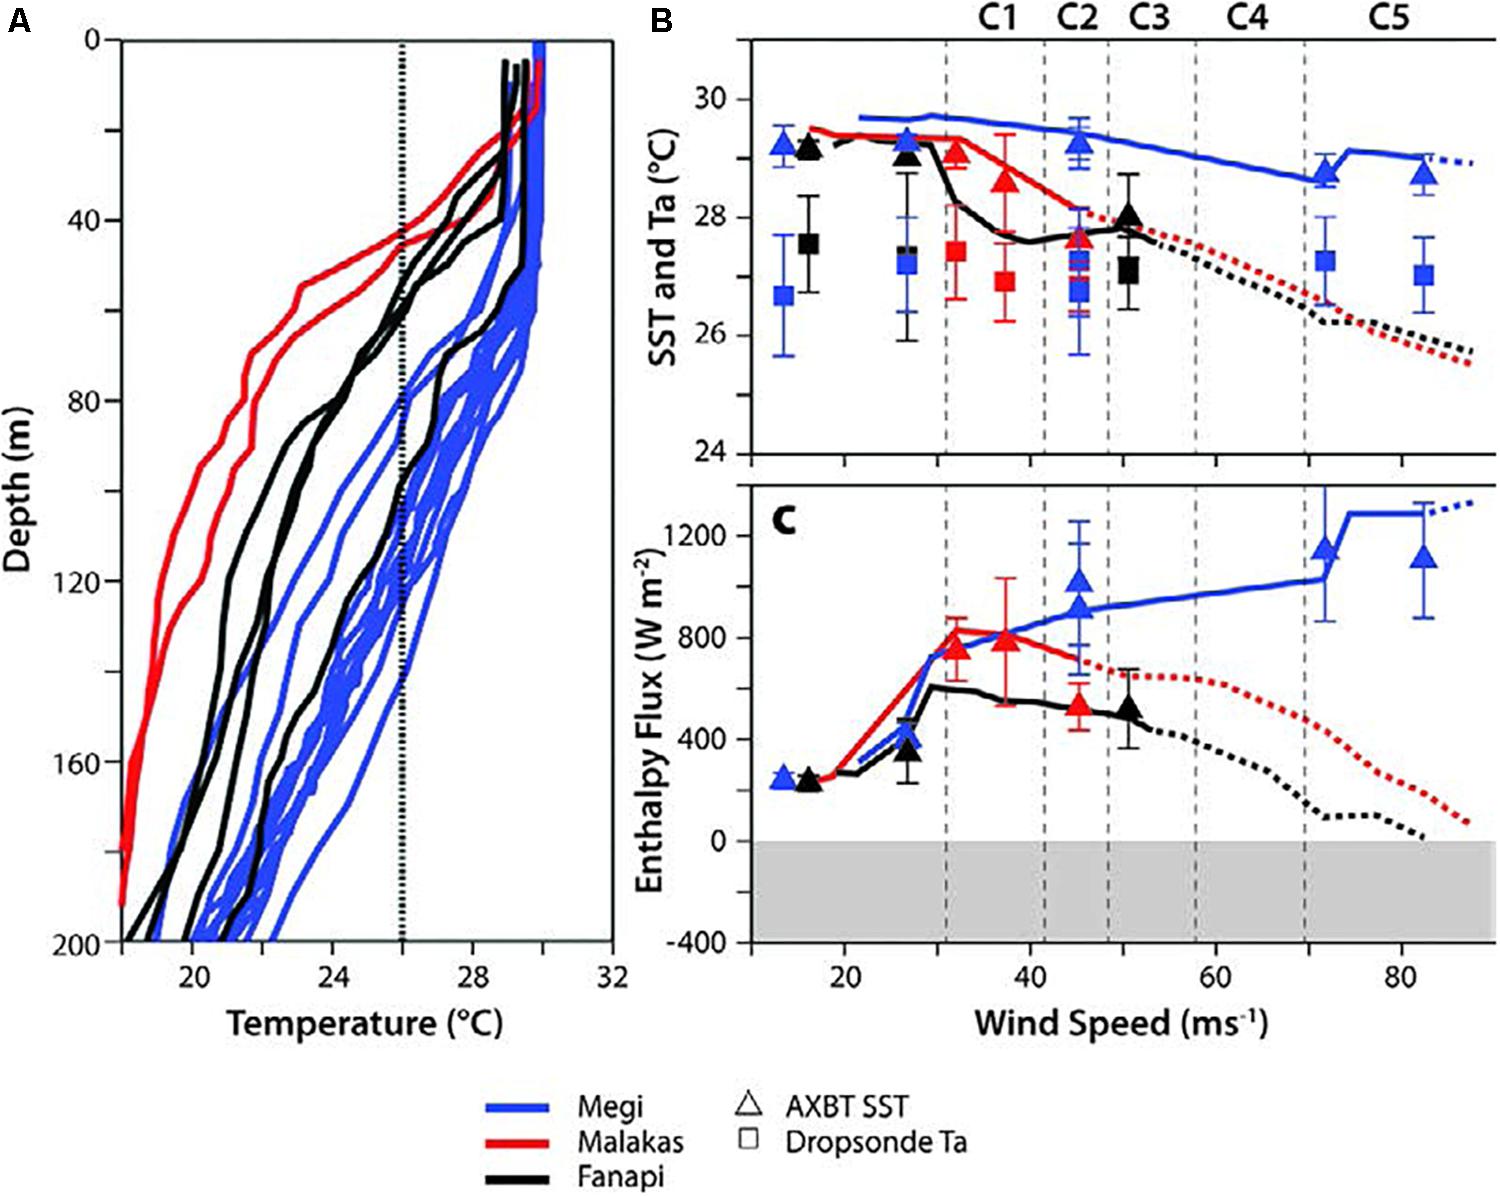
Figure 11. Evolution of temperature and air–sea fluxes for three ITOP TCs (Megi, Fanapi, and Malakas). (A) Pre-TC temperature profiles from ARGO floats. (B) Symbols: SST and air temperature at the core of each TC as measured by dropsonde/AXBT pairs. Lines: results of an ocean model (Price et al., 1994) driven by the observed TC (solid) and extrapolated to higher wind speeds (dashed). (C) As in (B), but for estimated total enthalpy flux (after Lin et al., 2013a).
In addition to assessing the pre-TC ocean conditions using AXBT profiles, the paired ocean-atmosphere observations during TC intensification were also collected. These observations were used to evaluate the SST and air temperature at the TC core (Figure 11B), and their derived air-sea sensible and latent heat fluxes. The correct representation of these fluxes is needed to obtain accurate TC intensification forecasts. Direct observations of air-sea fluxes were obtained deploying co-incident/co-located atmospheric dropsoundes and ocean AXBTs during TC-penetration flights (see Figure 11C). With these unique observations obtained during ITOP, accurate air-sea sensible and latent fluxes were obtained (Lin et al., 2013a; D’Asaro et al., 2014), revealing that enthalpy fluxes were substantially larger during Supertyphoon Megi as it reached Cat-2 (Figure 11C) and then continued to intensify into a Cat-5 Supertyphoon. Results from ITOP emphasize the value of paired, co-located, ocean-atmosphere observations to improve model prediction performance and for improving our understanding on the role that different types of ocean conditions can play in the TC intensification processes.
Impact of Ocean Data in Tropical Cyclone Intensity Forecasts
A variety of observations collected near TCs in recent years have impacted the fidelity of TCs forecasts, typically by reducing errors and biases in analyses used to initialize the ocean component of coupled prediction models. For example, Halliwell et al. (2011) analyzed the impact of multiple factors toward reducing errors in HYCOM ocean analyses in the Gulf of Mexico prior to Hurricane Isaac (2005). They determined that assimilation of ocean observations is a leading-order factor in reducing initialization errors in comparison to ocean model attributes such as vertical mixing and surface flux parameterizations, along with model resolution.
More recently, Dong et al. (2017) conducted observing system experiments (OSEs) focused on the influence of conventional ocean observing systems plus underwater glider data on prediction of Gonzalo’s intensity. A twin experiment was performed comparing an analysis that assimilated underwater glider data from July 15 to October 13 along with other in situ and satellite observations to an analysis produced by an unconstrained (ocean observations not assimilated) model simulation. These two analyses were then used to initialize the high-resolution HWRF-HYCOM coupled forecast system (Dong et al., 2017). Assimilation of subsurface observations from gliders improved the representation of pre-storm vertical structure of both temperature (Figure 6B) and salinity, capturing the barrier layer previously observed in the region (Domingues et al., 2015). Consequently, forecast intensity errors (e.g., Figure 6C) were reduced by approximately 50% as a result of assimilating all available observations, enabling a substantially improved forecast for Hurricane Gonzalo.
Observing system experiments are now being conducted for the 2017 North Atlantic hurricane season. The fields of mean TCHP and D26 presented in Figure 12 demonstrate the impact of assimilating all ocean profilers (Argo and Alamo floats plus underwater gliders). Comparing fields produced by an unconstrained model simulation (Figures 12C,D) to observation-based estimates provided by the NOAA/AOML TCHP analysis product (Figures 12A,B), the unconstrained model produces TCHP that is too small and an upper-ocean warm layer that is too thin across the entire North Atlantic hurricane development region. Assimilation of all available ocean profiles (Figures 12E,F) substantially corrects these large-scale biases. The planned next step in this analysis will be to assess the impact on intensity prediction by using these fields to initialize the HYCOM-HWRF forecasting model.
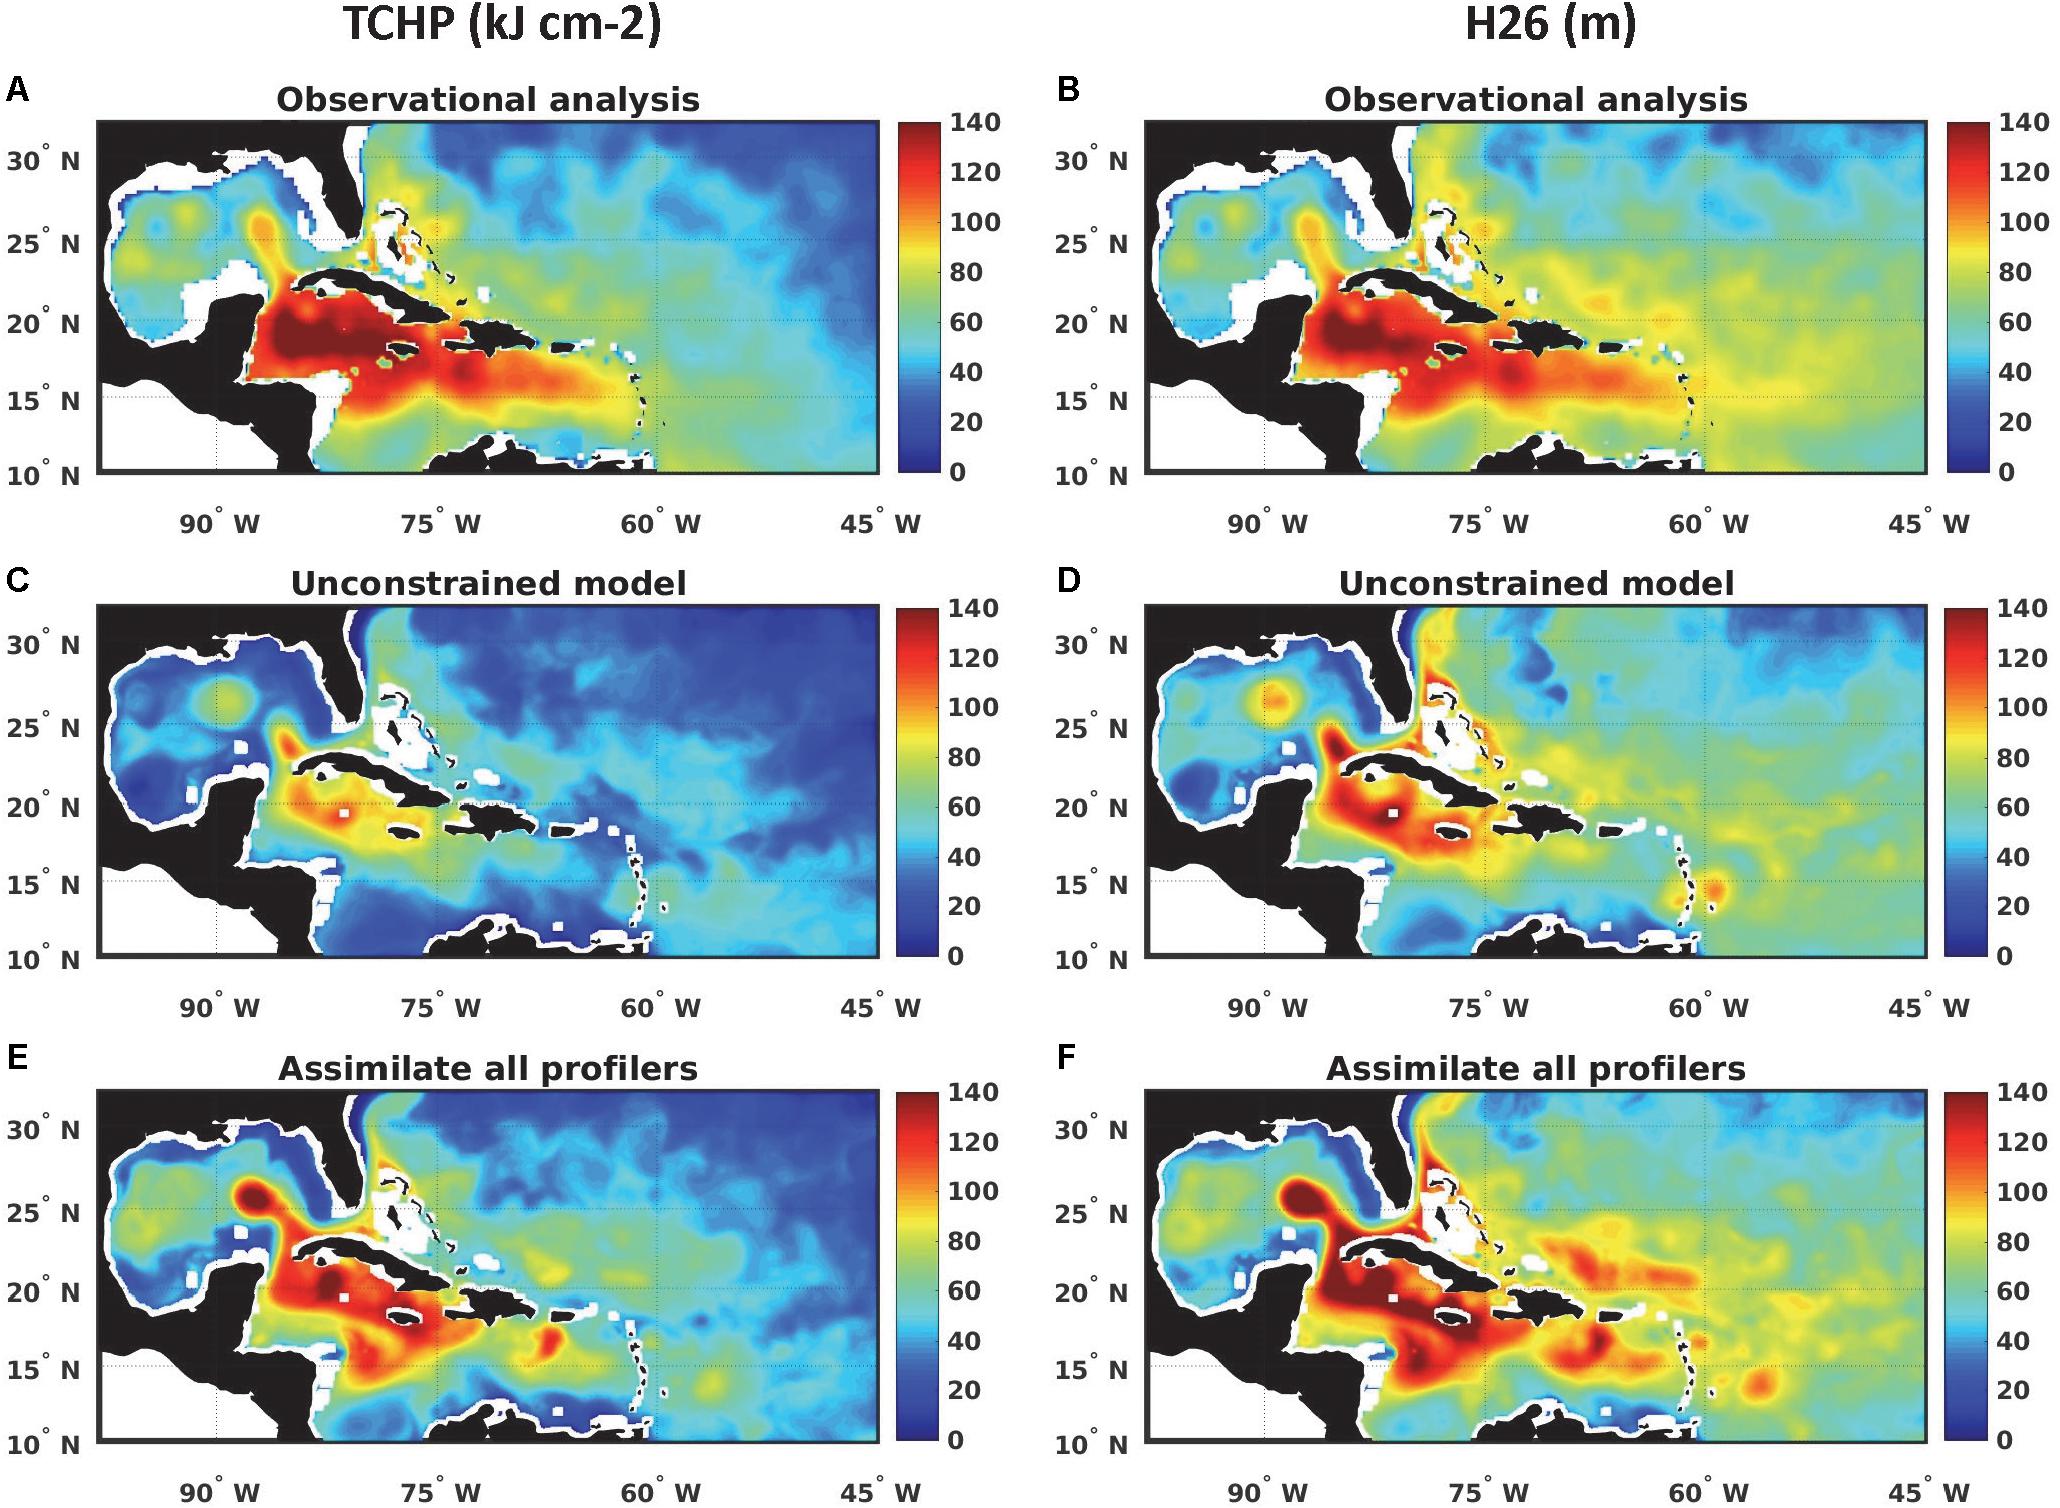
Figure 12. Mean fields of TCHP (A,C,E) and depth of the 26°C isotherm (H26) (B,D,F) averaged over the time interval 21 August through 8 October 2017. Observation-based estimates are provided by the NOAA/AOML TCHP product (A,B). Model fields are from an unconstrained simulation (C,D) and from an analysis that assimilated all available data from ocean profilers (Argo floats, underwater gliders, and Alamo floats).
Observing System Simulation Experiments (OSSEs) have also been performed over the North Atlantic hurricane region. Given that the Nature Run, a validated, unconstrained, and realistic ocean simulation by a state-of-the-art ocean model, is known, it is possible to evaluate new observing systems and alternate deployment strategies for existing systems. Previous OSSEs have quantitatively assessed the positive impacts of existing observing systems and different deployment strategies for systems, such as underwater gliders and picket-fence deployments of thermistor chains (Halliwell G. R. H. et al., 2017), and also for pre-storm airborne ocean profiler surveys (Halliwell G. R. et al., 2017). More recently, OSSEs were performed to demonstrate the advantages of collecting ocean profiles from moving platforms such as gliders compared to collecting profiles from stationary platforms. These results are summarized by Fujii et al. (2019). Moving forward, OSSEs will continue to be an important tool for the design and implementation of optimized ocean sampling strategies in support of both TCs and ECs forecasts, while OSEs will also continue providing further quantitative information on the impacts of different components of the existing ocean observing system.
Data Management
Efficient data management, including data transmission is critical for ensuring observations are available in real-time or near-real-time for assimilation into forecast models. Latency in data availability can have unwanted downstream effects on the use of observations for operational purposes.
For weather forecasting, it is critical that Data Assembly Centers (DACs) and operators transmit data in real time to systems such as the GTS to ensure data availability for forecasters and to validate models. In order to make the data available for assimilation into forecast numerical models, most of the data obtained by the different observational platforms considered here need to be transmitted in real-time or near-real time through different satellite networks. After reception on land, the data typically undergo platform-dependent quality assurance (QA) and quality control (QC) procedures that are designed to identify possible inaccuracies in the observations. For most platforms these QA/QC procedures include tests designed to identify data gaps or missing values, spikes or unrealistic gradients in the data, and invalid dates or locations, among other error sources. The data are normally not modified during QA/QC, but individual records are flagged according to the results of the tests applied, or the data from a malfunctioning platform may be blacklisted and removed altogether from GTS distribution. The data are then encoded into different traditional alphanumeric formats (e.g., FM 63-XI Ext. BATHY for XBTs and AXBTs, FM 64-XI Ext. TESAC for Argo floats and underwater gliders; World Meteorological Organization (WMO), 2015a – Part A), or into binary universal form for the representation of meteorological data (FM 94–XIV BUFR, World Meteorological Organization (WMO), 2015a – Part B). For example, the data format TM315009 is used by the Lagrangian Drifter Laboratory at the Scripps Institution of Oceanography, by MeteoFrance, and by the UK Met Office for their contribution to the Global Surface Drifter Array, and for submission into the GTS (World Meteorological Organization (WMO), 2015b) for near real-time distribution and numerical model assimilation. Other data centers includes the Global Temperature and Salinity Profile Program (GTSPP; XBT, Argo floats, underwater glider), the U.S. IOOS Glider Data Assembly Center (GDAC), and NOAA/NCEI (XBT, Argo, underwater glider) as part of long term archival and for distribution for other delayed-mode scientific applications. At this step the data may be submitted to delayed-mode QC that may result in flags for individual records or in modifications to the data set to ensure the highest possible data quality for all applications.
For research and retrospective analysis, data management is important to ensuring collected observations from various platforms, operated by diverse organizations, is easily available, QA/QCed, and compatible with relevant standards. DACs can be leveraged to provide a diverse observation platform community a single place to store, share, archive, and quality control their data. In addition to providing standardized, easy to access, QA/QCed ocean observations critical for extreme weather events.
The Vision for the Next 10 Years
Ocean Observations in Support of Tropical Cyclones Studies and Forecasts
An integrated multiplatform ocean observing system for studies and forecasts of TCs is not currently in place. Analysis of ocean observations from the largely climate-focused ocean observing system often provides valuable information on the mechanisms and processes associated with these extreme weather conditions. Ocean data in support of extreme weather events need to focus on resolving upper ocean features such as barrier layers, spatial variability of warm currents, mesoscale OHC changes, and surface waves (Centurioni et al., 2019) prior to and during the season in each basin where TCs occur, with distribution of data in real-time. However, the scientific and operational requirements of observing platforms, such as profiling floats (Roemmich et al., 2019), moorings (Foltz et al., 2019; Masumoto et al., 2019; Smith et al., 2019), and expendable probes (Goni et al., 2019), do not explicitly target these needs. Sustained and targeted high-resolution ocean observations provide a means to better understand the processes responsible for the rapid evolution of the ocean and its feedback on the atmosphere during these extreme weather conditions. These concerns have been presented and discussed in workshops on TCs from a global perspective, as for example where WMO Recommendations focused on structure and intensity of TCs (Shay et al., 2014).
Pilot networks of sustained multi-platform observations and targeted observations in the tropical Atlantic during hurricane season have proven to provide key upper ocean observations to initialize numerical ocean-atmosphere coupled forecast models in areas where TC intensification and weakening may occur. The assimilation of ocean observations allows for a better representation of ocean conditions within coupled TC forecast models, which in turn provides a more realistic simulation of air-sea interactions and flux exchanges, generally resulting in an improved TC intensity forecast (e.g., Chen et al., 2017; Dong et al., 2017). OSEs (e.g., Dong et al., 2017) need to be extended to more storms in order to provide a more robust estimate of the benefit of various types of observations. These experiments should ideally be performed using operational models so as to quantify the benefit of ocean observations in operational conditions. Furthermore, the OSSE approach dedicated to hurricanes should continue to be followed in order to optimize the deployment of dedicated TC ocean observations, typically gliders and air-deployed profilers. Carrying out OSSEs and OSEs to design, implement, and assess the impact of new sustained components within the ocean observing system (e.g., underwater gliders, profiling floats, drifters, etc.) will be key to continued improvement of TC intensity forecasts, since significant errors still remain in data-assimilative ocean analyses due to existing observations being scarce in space and time. Improvements in spatial and temporal coverage of ocean observations should improve the ocean representation within coupled TC forecast models, which in turn will allow for better forecasts. Targeted ocean sampling, when appropriate, also has the potential to help improve TC predictions (e.g., Chen et al., 2017). In addition, improvements in data availability for the forecast community are also essential for ensuring that ocean observations reach operational forecast centers in real-time. In one effort to help with this requirement, the EMC and the National Data Buoy Center (NDBC) within NOAA are working to increase the frequency of data transfer to the GTS.
For the next decade, coupled model systems will extend to multi-way dynamic coupling. In recent years, NOAA/EMC has demonstrated three-way dynamic coupling with HYCOM-WaveWatchIII-HWRF model. This would allow for revisiting air-sea interaction dynamics in greater detail, and also exploring observational measurements to support research and simulations. The importance of air-sea flux exchanges to TC development is widely known, yet simulations are still based on bulk parameterizations. To support evolving modeling efforts, observational efforts should accordingly extend to collecting data on waves, sea spray, roughness, turbulence, and relative humidity over the ocean. For example, measurements derived from turbulent microstructure sensors, such as those based on underwater gliders (e.g., St. Laurent and Merrifield, 2017) and moorings (e.g., Warner et al., 2016) will help obtain direct measurements of diapycnal heat flux and temperature diffusivity that can be used to develop, assess, and validate turbulent mixing schemes employed in coupled forecast models.
Expansion of sustained and targeted upper ocean observations in locations where TCs often intensify is one of the best strategies to support hurricane studies and forecasts. Underwater gliders and other autonomous vehicles offer one option for carrying out sustained surveillance in support of TCs studies and forecasts, given that these vehicles can be remotely operated along predetermined routes, they can provide observations in real-time continuously for several months, they withstand hurricane-force winds, and they can be refurbished and serviced for multi-year applications. Targeted and rapid-response observations also provide critical information that instruments surveying in sustained mode cannot. For instance, air-deployed instruments are particularly useful since they are deployed from aircraft already tasked with storm surveillance, and they are logistically easier to position along the forecast track ahead of a TC. Flexible deployments of in situ marine and airborne platforms also allows for co-located measurements with other air/ocean observing systems that are key for advancing our understanding air-sea fluxes across the oceanic surface.
Further advances in satellite remote sensing are also expected to improve the representation of features that impact storm development. For instance, the advent of wide-swath, high-resolution satellite altimetry (e.g., Fu and Ubelmann, 2014) will enable the evaluation of air-sea interaction processes during high-wind events in detail, such as, for example, the generation of internal waves in the wake of TCs that help drive upper-ocean mixing. Satellite measurements of surface salinity also have potential for improving our understanding of the oceanic factors and processes that lead to TC intensification, especially in the western Atlantic and the Bay of Bengal, where there is persistent shallow salinity stratification. It is important that these measurements continue, along with satellite SST, sea level, and winds.
Considering the positive impacts of upper-ocean observations from pilot networks, and targeted deployments, the following key recommendations have been identified to continue and enhance ocean observations in support of TCs:
• Maintain the elements of the observing system that have proven valuable for Tropical Cyclone ocean research and operational intensity forecast.
• Utilize numerical Observing System Experiments to quantify the impact of the current ocean observing platforms in Tropical Cyclone forecasts.
• Evaluate optimal ocean observational strategies in support of Tropical Cyclone studies and forecasts using numerical Observing System Simulation Experiments.
• Implement sustained and targeted ocean observations (gliders, profiling floats, drifters, etc.) dedicated to improving Tropical Cyclone intensity forecasts; and foster co-incident, co-located air-deployed profile observations (AXBTs, AXCTDs, floats, thermistor chains, etc.) of ocean temperature, salinity, and currents.
• Foster additional sustained measurements of sea level pressure (e.g., from drifters and moorings), and of waves, sea spray, and mixed-layer turbulence (e.g., from gliders) to help develop, evaluate, and validate boundary layer parameterizations.
• Use upper ocean metrics (e.g., Tropical Cyclone Heat Potential, ocean mean temperature, barrier layer thickness, etc.) derived from profile and satellite ocean observations in the operational evaluation and validation of numerical forecast models.
• Continue with efforts focused on improving coupled ocean-atmospheric numerical weather models, especially those relating to enhancing ocean data assimilation techniques and mixed layer parametrizations.
• Create an ocean database easily accessible to the scientific community to facilitate research in support of assessments of the role of the ocean in Tropical Cyclones studies.
• Enhance data management efforts to transmit and QA/QC data in real-time for assimilation in operational forecast models.
Ocean Observations in Support of Extratropical Bomb Cyclones Studies
Recommendations to improve the understanding of ocean-atmosphere interactions during EC events are:
• Increase efforts to implement and improve coverage of high-frequency and high-resolution observations using profiling instruments and biologging to detect oceanic fronts associated with western boundary currents in winter.
• Enhance efforts dedicated to observing surface wind, and waves, using surface drifters, and floating seabirds equipped with weather, GNSS, and motion sensors, respectively, to estimate air-sea flux exchanges under Extratropical Bomb Cyclones.
• Foster additional efforts aimed at observing ocean turbulent mixing induced by Extratropical Bomb Cyclones using, profiling floats and other platforms (e.g., gliders, moorings, floats, etc.).
• Incorporate real-time meteo-ocean observations, including ocean bottom pressure, in moorings from the Tsunami monitoring network in support of Extratropical Bomb Cyclones studies and forecasts.
Air-sea interactions under ECs are poorly understood because of the sparseness of in situ observations and lack of satellite observations caused by thick clouds and heavy rain. Seabirds are often observed to fly and float under ECs to forage (Yoda et al., 2014; Yonehara et al., 2016; Goto et al., 2017), providing an additional potential source of environmental data. Estimation of surface winds and waves using biologging, GNSS and motion sensor can provide useful information about air-sea interaction processes under ECs as well as their temperature and pressure measurements. In addition, the development of profiling floats equipped with motion sensors can also help to provide metrics to evaluate ocean mixing near the sea surface.
To monitor Tsunami, several real-time observation networks of ocean bottom pressure have been established (Kaneda, 2010; Bernard and Meinig, 2011; Lawson et al., 2011; Mochizuki et al., 2017). Most of the sites in the networks are located under the area where ECs frequently develop. Recently, seismic stations on land can catch microseisms induced by ECs (Nishida and Takagi, 2016). The real-time monitoring networks will provide oceanic responses to ECs and informations of winds and waves which may contribute to forecast improvement of ECs.
Summary
In this community white paper, we provide a summary of current ocean observing efforts, and recent research findings in support of studies and forecasts of TCs and ECs. Substantial progress has been made over the past decade in terms of ocean observations, improving our understanding of the role that the ocean plays in the evolution of TCs and ECs, and on transitioning state-of-the art coupled forecast models to operational mode. These advances have largely addressed recommendations made by the scientific community during OceanObs’09 (e.g., Goni et al., 2010) and emphasize the critical value of sustained and targeted ocean observations, real-time data transmission, and multi-platform efforts.
With recent advances in ocean modeling and coupled atmosphere-ocean modeling, operational forecasts increasingly rely on assimilating real-time ocean measurements to produce accurate ocean, weather and extreme weather forecasts. For example, assimilation of ocean observations can dramatically improve hurricane intensity forecasts (e.g., Dong et al., 2017). OSEs can assist in quantifying the impact of upper ocean observations on TC and ECs forecasts. Similarly, OSSEs can also be applied to various regions to design optimal and cost-effective deployment strategies for both targeted and sustained observations in support of ECs and TCs.
Given the large benefits provided by the ocean observing system in support of extreme weather studies and forecasts, it is critical that current components are maintained and possibly expanded over the next decade. In addition, new technologies, pilot networks, and targeted deployments are greatly expanding the observation capabilities; incorporating these components into the sustained observing system will likely greatly benefit studies and forecasts of TCs and ECs. Finally, considering the large number of countries whose coastal areas are often impacted by TCs and ECs, results and advances presented here emphasize the critical value of carrying out a coordinated international effort in the design, implementation, maintenance, and data management of key aspects of ocean observations that will ensure the feasibility of logistical, operational, and research activities.
Author Contributions
RD, AK-Y, PC-M, and GG elaborated the initial outline, and wrote the first draft of the manuscript. All authors of this community white paper have provided input in the form of language, figures, and recommendations for the future of the ocean observing system in support of studies and forecasts of Tropical and Extratropical Cyclones.
Funding
This study was supported by the National Oceanic and Atmospheric Administration and JSPS KAKENHI (Grant Numbers: JP17K19093, JP16K12591, and JP16H01846).
Conflict of Interest Statement
H-SK was employed by company I.M. Systems Group, Inc.
The remaining authors declare that the research was conducted in the absence of any commercial or financial relationships that could be construed as a potential conflict of interest.
Footnotes
- ^ NOAA High-resolution Blended Analysis of Daily SST available at: https://www.esrl.noaa.gov/psd/data/gridded/data.noaa.oisst.v2.highres.html.
- ^ Satellite altimetry products made available by the Copernicus Marine Environment Monitoring Service: http://marine.copernicus.eu/.
- ^ TCHP fields made available by the NOAA Atlantic Oceanographic and Meteorological Laboratory (NOAA/AOML) at: http://www.aoml.noaa.gov/phod/cyclone/data/.
- ^ NOAA Hurricane Field Program: https://www.aoml.noaa.gov/hrd/programs_sub/HFP.html.
- ^ U.S. Glider Data Assembly Center: https://gliders.ioos.us/data/.
- ^ The Global Drifter Program: http://www.aoml.noaa.gov/phod/gdp/index.php and http://gdp.ucsd.edu.
- ^ Argo Global Data Assembly Center at: http://www.usgodae.org/argo/argo.html.
- ^ NASA Ocean Color website: https://oceancolor.gsfc.nasa.gov/.
References
Ali, M. M., Jagadeesh, P. S. V., and Jain, S. (2007). Effects of eddies on Bay of Bengal cyclone intensity. EOS Trans. Am. Geophys. Union 88, 93–95. doi: 10.1029/2007EO080001
Ali, M. M., Kashyap, T., and Nagamani, P. V. (2013). Use of sea surface temperature for cyclone intensity prediction needs a relook. EOS Trans. Am. Geophys. Union 94, 177–177. doi: 10.1002/2013EO190005
Ali, M. M., Nagamani, P. V., Sharma, N., Gopal, R. T. V., Rajeevan, M., Goni, G. J., et al. (2015). Relationship between ocean mean temperatures and Indian summer monsoon rainfall. Atmos. Sci. Lett. 16, 408–413. doi: 10.1002/asl2.576
Bacmeister, J. T., Reed, K. A., Hannay, C., Lawrence, P., Bates, S., Truesdale, J. E., et al. (2018). Projected changes in tropical cyclone activity under future warming scenarios using a high-resolution climate model. Climatic Change 146, 547–560. doi: 10.1007/s10584-016-1750-x
Balaguru, K., Chang, P., Saravanan, R., and Jang, C. J. (2012a). The barrier layer of the Atlantic warm pool: formation mechanism and influence on the mean climate. Tellus Dyn. Meteorol. Oceanogr. 64:18162. doi: 10.3402/tellusa.v64i0.18162
Balaguru, K., Chang, P., Saravanan, R., Leung, L. R., Xu, Z., Li, M., et al. (2012b). Ocean barrier layers’ effect on tropical cyclone intensification. Proc. Natl. Acad. Sci. U.S.A. 109, 14343–14347. doi: 10.1073/pnas.1201364109
Balaguru, K., Foltz, G. R., Leung, L. R., Asaro, E. D., Emanuel, K. A., Liu, H., et al. (2015). Dynamic potential intensity: an improved representation of the ocean’s impact on tropical cyclones. Geophys. Res. Lett. 42, 6739–6746. doi: 10.1002/2015GL064822
Balaguru, K., Foltz, G. R., Leung, L. R., and Emanuel, K. A. (2016). Global warming-induced upper-ocean freshening and the intensification of super typhoons. Nat. Commun. 7:13670. doi: 10.1038/ncomms13670
Balaguru, K., Foltz, G. R., Leung, L. R., Hagos, S. M., and Judi, D. R. (2018). On the use of ocean dynamic temperature for hurricane intensity forecasting. Weather Forecast. 33, 411–418. doi: 10.1175/WAF-D-17-0143.1
Bernard, E. N., and Meinig, C. (2011). “History and future of deep-ocean tsunami measurements,” in Proceedings of the OCEANS’ 11 MTS/IEEE, Kona, (Waikoloa, HI: IEEE)
Black, M. T., and Pezza, A. B. (2013). A universal, broad-environment energy conversion signature of explosive cyclones. Geophys. Res. Lett. 40, 452–457. doi: 10.1002/grl.50114
Block, B. A., Dewar, H., Blackwell, S. B., Williams, T. D., Prince, E. D., Farwell, C. J., et al. (2001). Migratory movements, depth preferences, and thermal biology of Atlantic bluefin tuna. Science 293, 1310–1314. doi: 10.1126/science.1061197
Boehlert, G. W., Costa, D. P., Crocker, D. E., Green, P., O’Brien, T., Levitus, S., et al. (2001). Autonomous pinniped environmental samplers: using instrumented animals as oceanographic data collectors. J. Atmospheric Ocean. Technol. 18, 1882–1893. doi: 10.1175/1520-0426(2001)018<1882:apesui>2.0.co;2
Booth, J. F., Thompson, L., Patoux, J., and Kelly, K. A. (2012). Sensitivity of midlatitude storm intensification to perturbations in the sea surface temperature near the Gulf Stream. Mon. Weather Rev. 140, 1241–1256. doi: 10.1175/MWR-D-11-00195.1
Boyd, I. L., Hawker, E. J., Brandon, M. A., and Staniland, I. J. (2001). Measurement of ocean temperatures using instruments carried by Antarctic fur seals. J. Mar. Syst. 27, 277–288. doi: 10.1016/s0924-7963(00)00073-7
Burt, S. D., and Mansfield, D. A. (1988). The great storm of 15-16 October 1987. Weather 43, 90–110. doi: 10.1002/j.1477-8696.1988.tb03885.x
Camp, J., Scaife, A. A., and Heming, J. (2018). Predictability of the 2017 North Atlantic hurricane season. Atmos. Sci. Lett. 19:e813. doi: 10.1002/asl.813
Campagna, C., Rivas, A. L., and Marin, M. R. (2000). Temperature and depth profiles recorded during dives of elephant seals reflect distinct ocean environments. J. Mar. Syst. 24, 299–312. doi: 10.1016/s0924-7963(99)00091-3
Catto, J. L., Shaffrey, L. C., and Hodges, K. I. (2010). Can climate models capture the structure of extratropical cyclones? J. Clim. 23, 1621–1635. doi: 10.1175/2009JCLI3318.1
Centurioni, L. R. (2018) “Drifter technology and impacts for sea surface temperature, sea-level pressure, and ocean circulation studies,” in Observing the Oceans in Real Time, eds R. Venkatesan, A. Tandon, E. D’Asaro, and M. Atmanand. (Cham: Springer), 37–57.
Centurioni, L., Braasch, L., Lauro, E. D., Contestabile, P., Leo, F. D., Casotti, R., et al. (2016). A new strategic wave measurement station off Naples port main breakwater. Coas. Eng. Proc. 1:36. doi: 10.9753/icce.v35.waves.36
Centurioni, L., Horányi, A., Cardinali, C., Charpentier, E., and Lumpkin, R. (2017). A global ocean observing system for measuring sea level atmospheric pressure: effects and impacts on numerical weather prediction. Bull. Am. Meteorol. Soc. 98, 231–238. doi: 10.1175/bams-d-15-00080.1
Centurioni, L. R. (2010). Observations of large-amplitude nonlinear internal waves from a drifting array: instruments and methods. J. Atmospheric Ocean. Technol. 27, 1711–1731. doi: 10.1175/2010jtecho774.1
Centurioni, L. R., Turton, J. D., Lumpkin, R., Braasch, L., Brassington, G., Chao, Y., et al. (2019). Multidisciplinary global in-situ observations of essential climate and ocean variables at the air-sea interface. Front. Mar. Sci. 6:419. doi: 10.3389/fmars.2019.00419
Chacko, N. (2017). Chlorophyll bloom in response to tropical cyclone Hudhud in the Bay of Bengal: Bio-Argo subsurface observations. Deep Sea Res. Part Oceanogr. Res. Pap. 124, 66–72. doi: 10.1016/j.dsr.2017.04.010
Chang, E. K. (2017). Projected significant increase in the number of extreme extratropical cyclones in the Southern Hemisphere. J. Clim. 30, 4915–4935. doi: 10.1175/jcli-d-16-0553.1
Charrassin, J.-B., Park, Y.-H., Maho, Y. L., and Bost, C.-A. (2002). Penguins as oceanographers unravel hidden mechanisms of marine productivity. Ecol. Lett. 5, 317–319. doi: 10.1046/j.1461-0248.2002.00341.x
Chassignet, E. P., Hurlburt, H. E., Metzger, E. J., Smedstad, O. M., Cummings, J. A., Halliwell, G. R., et al. (2009). US GODAE: global ocean prediction with the HYbrid Coordinate Ocean Model (HYCOM). Oceanography 22, 64–75. doi: 10.5670/oceanog.2009.39
Chen, S., Cumming, J. A., Schmidt, J. M., Sanabia, E. R., and Jayne, S. R. (2017). Targeted ocean sampling guidance for tropical cyclones. J. G. R Oceans 122, 3505–3518. doi: 10.1002/2017JC01272
Colle, B. A., Booth, J. F., and Chang, E. K. (2015). A review of historical and future changes of extratropical cyclones and associated impacts along the US East Coast. Curr. Clim. Change Rep. 1, 125–143. doi: 10.1007/s40641-015-0013-7
Dare, R. A., and McBride, J. L. (2012). Sea surface temperature response to tropical cyclones. Mon. Wea. Rev. 139, 3798–3808. doi: 10.1175/mwr-d-10-05019.1
D’Asaro, E. A., Black, P. G., Centurioni, L. R., Chang, Y.-T., Chen, S. S., Foster, R. C., et al. (2014). Impact of typhoons on the ocean in the Pacific. Bull. Am. Meteorol. Soc. 95, 1405–1418.
DeMaria, M., and Kaplan, J. (1994). A statistical hurricane intensity prediction scheme (SHIPS) for the Atlantic basin. Weather Forecast. 9, 209–220. doi: 10.1175/1520-0434(1994)009<0209:aships>2.0.co;2
DeMaria, M., Knaff, J. A., and Sampson, C. (2007). Evaluation of long-term trends in tropical cyclone intensity forecasts. Meteorol. Atmospheric Phys. 97, 19–28. doi: 10.1007/s00703-006-0241-4
DeMaria, M., Mainelli, M., Shay, L. K., Knaff, J. A., and Kaplan, J. (2005). Further improvements to the statistical hurricane intensity prediction scheme (SHIPS). Weather Forecast. 20, 531–543. doi: 10.1175/waf862.1
DeMaria, M., Sampson, C. R., Knaff, J. A., and Musgrave, K. D. (2014). Is tropical cyclone intensity guidance improving? Bull. Am. Meteorol. Soc. 95, 387–398. doi: 10.1175/bams-d-12-00240.1
Domingues, R., Goni, G., Bringas, F., Lee, S.-K., Kim, H.-S., Halliwell, G., et al. (2015). Upper ocean response to Hurricane Gonzalo (2014): salinity effects revealed by targeted and sustained underwater glider observations. Geophys. Res. Lett. 42, 7131–7138. doi: 10.1002/2015gl065378
Dong, J., Domingues, R., Goni, G., Halliwell, G., Kim, H.-S., Lee, S.-K., et al. (2017). Impact of assimilating underwater glider data on Hurricane Gonzalo (2014) forecasts. Weather Forecast. 32, 1143–1159. doi: 10.1175/waf-d-16-0182.1
Drévillon, M., Bourdallé-Badie, R., Derval, C., Lellouche, J. M., Rémy, E., Tranchant, B., et al. (2008). The GODAE/Mercator-Ocean global ocean forecasting system: results, applications and prospects. J. Oper. Oceanogr. 1, 51–57. doi: 10.1080/1755876x.2008.11020095
Elsner, J. B., Kossin, J. P., and Jagger, T. H. (2008). The increasing intensity of the strongest tropical cyclones. Nature 455, 92–95. doi: 10.1038/nature07234
Emanuel, K. (2015). Effect of upper-ocean evolution on projected trends in tropical cyclone activity. J. Clim. 28, 8165–8170. doi: 10.1175/jcli-d-15-0401.1
Fedak, M. A. (2013). The impact of animal platforms on polar ocean observation. Deep Sea Res. Part Top. Stud. Oceanogr. 8, 7–13. doi: 10.1016/j.dsr2.2012.07.007
Foltz, G. R., and Balaguru, K. (2016). Prolonged El Niño conditions in 2014-2015 and the rapid intensification of Hurricane Patricia in the eastern Pacific: El Niño and Hurricane Patricia. Geophys. Res. Lett. 43:355. doi: 10.1002/2016GL070274
Foltz, G. R., Brandt, P., Rodriguez-Fonseca, M., Hernandez, F., Dengler, M., Rodrigues, R., et al. (2019). The Tropical Atlantic observing system. Front. Mar. Sci. 6:36. doi: 10.3389/fmars.2019.00206
Fu, L.-L., and Ubelmann, C. (2014). On the transition from profile altimeter to swath altimeter for observing global ocean surface topography. J. Atmospheric Ocean. Technol. 31, 560–568. doi: 10.1175/JTECH-D-13-00109.1
Fujii, Y., Remy, E., Zuo, H., Oke, P. R., Halliwell, G. R., Garparin, F., et al. (2019). Observing system evaluation based on ocean data assimilation and prediction systems: on-going challenges and future vision for designing/supporting ocean observational networks. Front. Mar. Sci. 6:417. doi: 10.3389/fmars.2019.00417
Fukuoka, T., Narazaki, T., and Sato, K. (2015). Summer-restricted migration of green turtles Chelonia mydas to a temperate habitat of the northwest Pacific Ocean. Endanger. Species Res. 28, 1–10. doi: 10.3354/esr00671
Glenn, S. M., Miles, T. N., Seroka, G. N., Xu, Y., Forney, R. K., Yu, F., et al. (2016). Stratified coastal ocean interactions with tropical cyclones. Nat. Commun. 7:10887. doi: 10.1038/ncomms10887
Gómara, I., Rodríguez-Fonseca, B., Zurita-Gotor, P., Ulbrich, S., and Pinto, J. G. (2016). Abrupt transitions in the NAO control of explosive North Atlantic cyclone development. Clim. Dyn. 47, 3091–3111. doi: 10.1007/s00382-016-3015-9
Goni, G., DeMaria, M., Knaff, J., Sampson, C., Ginis, I., Bringas, F., et al. (2009). Applications of satellite-derived ocean measurements to tropical cyclone intensity forecasting. Oceanography 22, 190–197. doi: 10.5670/oceanog.2009.78
Goni, G., DeMaria, M., Knaff, J., Sampson, C., Price, J., Mehra, A., et al. (2010). “The ocean observing system for tropical cyclone intensification forecasts and studies,” in Proceedings of the OceanObs’ 09 Conference, (Venice).
Goni, G., and Domingues, R. (2019). “The particular upper ocean conditions in the gulf of mexico during hurricane michael (2018),” in State of the Climate in 2018, eds J. Blunden, D. S. Arndt, and G. Hartfield (Massachusetts: Bulletin of the American Meteorological Society).
Goni, G. J., Sprintall, J., Bringas, F., Cheng, L., Cirano, M., Dong, S., et al. (2019). More than 50 years of successful continuous temperature section measurements by the global expendable bathythermograph network, its integrability, societal benefits, and future. Front. Mar. Sci. 6:452. doi: 10.3389/fmars.2019.00452
Goni, G. J., Todd, R. E., Jayne, S. R., Halliwell, G., Glenn, S., Dong, J., et al. (2017). Autonomous and Lagrangian ocean observations for Atlantic tropical cyclone studies and forecasts. Oceanography 30, 92–103. doi: 10.5670/oceanog.2017.227
Goni, G. J., and Trinanes, J. A. (2003). Ocean thermal structure monitoring could aid in the intensity forecast of tropical cyclones. EOS Trans. Am. Geophys. Union 84, 573–578.
Goto, Y., Yoda, K., and Sato, K. (2017). Asymmetry hidden in birds’ tracks reveals wind, heading, and orientation ability over the ocean. Sci. Adv. 3:e1700097. doi: 10.1126/sciadv.1700097
Grodsky, S. A., Reul, N., Lagerloef, G., Reverdin, G., Carton, J. A., Chapron, B., et al. (2012). Haline hurricane wake in the Amazon/Orinoco plume: AQUARIUS/SACD and SMOS observations. Geophys. Res. Lett. 39:L20603. doi: 10.1029/2012GL053335
Haarsma, R. J., Roberts, M. J., Vidale, P. L., Senior, C. A., Bellucci, A., Bao, Q., et al. (2016). High Resolution Model Intercomparison Project (HighResMIP v1.0) for CMIP6. Geosci. Model Dev. 9, 4185–4208. doi: 10.5194/gmd-9-4185-2016
Hakim, G. J., Bosart, L. F., and Keyser, D. (1995). The Ohio Valley wave merger cyclogenesis event of 25-26 January 1978. Part 1: multiscale case study. Mon. Wea. Rev. 123, 2663–2692. doi: 10.1175/1520-0493(1995)123<2663:tovwmc>2.0.co;2
Halliwell, G. R., Shay, L. K., Brewster, J. K., and Teague, W. J. (2011). Evaluation and sensitivity analysis of an ocean model response to Hurricane Ivan. Mon. Weather Rev. 139, 921–945. doi: 10.1175/2010MWR3104.1
Halliwell, G. R. H., Mehari, M. F., Hénaff, M. L., Kourafalou, V. H., Androulidakis, I. S., Kang, H. S., et al. (2017). North Atlantic Ocean OSSE system: evaluation of operational ocean observing system components and supplemental seasonal observations for potentially improving tropical cyclone prediction in coupled systems. J. Oper. Oceanogr. 10, 154–175. doi: 10.1080/1755876X.2017.1322770
Halliwell, G. R., Mehari, M., Shay, L. K., Kourafalou, V. H., Kang, H., Kim, H.-S., et al. (2017). OSSE quantitative assessment of rapid-response prestorm ocean surveys to improve coupled tropical cyclone prediction. J. Geophys. Res. Oceans 122, 5729–5748. doi: 10.1002/2017JC012760
Hirata, H., Kawamura, R., Kato, M., and Shinoda, T. (2015). Influential role of moisture supply from the Kuroshio/Kuroshio extension in the rapid development of an extratropical cyclone. Mon. Weather Rev. 143, 4126–4144. doi: 10.1175/MWR-D-15-0016.1
Hirata, H., Kawamura, R., Kato, M., and Shinoda, T. (2016). Response of rapidly developing extratropical cyclones to sea surface temperature variations over the western Kuroshio–Oyashio confluence region. J. Geophys. Res. Atmos. 121, 3843–3858. doi: 10.1002/2015JD024391
Hirata, H., Kawamura, R., Kato, M., and Shinoda, T. (2018). A positive feedback process related to the rapid development of an extratropical cyclone over the Kuroshio/Kuroshio extension. Mon. Weather Rev. 146, 417–433. doi: 10.1175/MWR-D-17-0063.1
Horányi, A., Cardinali, C., and Centurioni, L. (2017). The global numerical weather prediction impact of mean-sea-level pressure observations from drifting buoys. Q. J. R. Meteorol. Soc. 143, 974–985. doi: 10.1002/qj.2981
Houghton, R. W., Schlitz, R., Beardsley, R. C., Butman, B., and Chamberlin, J. L. (1982). The middle Atlantic bight cold pool: evolution of the temperature structure during summer 1979. J. Phys. Oceanogr. 12, 1019–1029. doi: 10.1175/1520-0485(1982)012<1019:tmabcp>2.0.co;2
Huang, P., Lin, I.-I., Chou, C., and Huang, R.-H. (2015). Change in ocean subsurface environment to suppress tropical cyclone intensification under global warming. Nat. Commun. 6:7188. doi: 10.1038/ncomms8188
Ingleby, B., and Isaksen, L. (2018). Drifting buoy pressures: impact on NWP. Atmospheric Sci. Lett. 19:e822. doi: 10.1002/asl.822
Jaimes, B., Shay, L. K., and Brewster, J. K. (2016). Observed air-sea interactions in tropical cyclone Isaac over Loop Current mesoscale eddy features. Dyn. Atmospheres Oceans 76, 306–324. doi: 10.1016/j.dynatmoce.2016.03.001
Jayne, S. R., and Bogue, N. M. (2017). Air-deployable profiling floats. Oceanography 30, 29–31. doi: 10.5670/oceanog.2017.214
Johns, E. M., Muhling, B. A., Perez, R. C., Müller-Karger, F. E., Melo, N., Smith, R. H., et al. (2014). Amazon river water in the northeastern Caribbean Sea and its effect on larval reef fish assemblages during April 2009. Fish. Oceanogr. 23, 472–494. doi: 10.1111/fog.12082
Kaneda, Y. (2010). “The advanced ocean floor real time monitoring system for megathrust earthquakes and tsunamis-application of DONET and DONET2 data to seismological research and disaster mitigation,” in Proceedings of the OCEANS 2010 MTS/IEEE, (Seattle), 1–6. doi: 10.1109/OCEANS.2010.5664309
Kaplan, J., DeMaria, M., and Knaff, J. A. (2010). A revised tropical cyclone rapid intensification index for the Atlantic and eastern North Pacific basins. Weather Forecast. 25, 220–241. doi: 10.1175/2009WAF2222280.1
Kelly, P. S., Lwiza, K. M. M., Cowen, R. K., and Goni, G. J. (2000). Low-salinity pools at Barbados, West Indies: their origin, frequency, and variability. J. Geophys. Res. Oceans 105, 19699–19708. doi: 10.1029/1999JC900328
Kim, H.-S., Lozano, C., Tallapragada, V., Iredell, D., Sheinin, D., Tolman, H. L., et al. (2014). Performance of Ocean coupled HWRF–HYCOM model. J. Atmospheric Ocean. Technol. 31, 545–559. doi: 10.1175/JTECH-D-13-00013.1
Knaff, J. A., Sampson, C. R., and DeMaria, M. (2005). An operational statistical typhoon intensity prediction scheme for the Western North Pacific.Wea. Forecasting 20, 688–699. doi: 10.1175/waf863.1
Knaff, J. A., Sampson, C. R., and Musgrave, K. D. (2018). An operational rapid intensification prediction aid for the western North Pacific. Weather Forecast. 33, 799–811. doi: 10.1175/WAF-D-18-0012.1
Knapp, K. R., Kruk, M. C., Levinson, D. H., Diamond, H. J., and Neumann, C. J. (2010). The international best track archive for climate stewardship (IBTrACS) unifying tropical cyclone data. Bull. Am. Meteorol. Soc. 91, 363–376. doi: 10.1175/2009bams2755.1
Koudil, M., Charrassin, J.-B., Le Maho, Y., and Bost, C.-A. (2000). Seabirds as monitors of upper-ocean thermal structure. king penguins at the Antarctic polar front, east of Kerguelen sector. Comptes Rendus Académie Sci. Ser. III Sci. Vie 323, 377–384. doi: 10.1016/S0764-4469(00)00144-X
Kuwano-Yoshida, A., and Asuma, Y. (2008). Numerical study of explosively developing extratropical cyclones in the northwestern Pacific region. Mon. Weather Rev. 136, 712–740. doi: 10.1175/2007MWR2111.1
Kuwano-Yoshida, A., and Enomoto, T. (2013). Predictability of explosive cyclogenesis over the northwestern Pacific region using ensemble reanalysis. Mon. Weather Rev. 141, 3769–3785. doi: 10.1175/MWR-D-12-00161.1
Kuwano-Yoshida, A., and Minobe, S. (2017). Storm-track response to SST fronts in the northwestern Pacific region in an AGCM. J. Clim. 30, 1081–1102. doi: 10.1175/JCLI-D-16-0331.1
Kuwano-Yoshida, A., Sasaki, H., Sasai, Y., and Hosoda, S. (2018). “Impact of explosive cyclones on the deep ocean in the North Pacific: simulations and observations,” in Proceedings of the OCEANS’ 18 MTS/IEE Kobe/Techno-Ocean 2018, (Kobe).
Kuwano-Yoshida, A., Sasaki, H., and Sasai, Y. (2017). Impact of explosive cyclones on the deep ocean in the North Pacific using an eddy-resolving ocean general circulation model. Geophys. Res. Lett. 44, 320–329. doi: 10.1002/2016GL071367
Landsea, C. W. (1993). A climatology of intense (or major) Atlantic hurricanes. Mon. Weather Rev. 121, 1703–1713. doi: 10.1175/1520-0493(1993)121<1703:acoima>2.0.co;2
Lawson, R. A., Graham, D., Stalin, S., Meinig, C., Tagawa, D., Lawrence-Slavas, N., et al. (2011). “From research to commercial operations: the next generation Easy-to-Deploy (ETD) tsunami assessment buoy,” in Proceedings of the OCEANS 2011 IEEE, (Spain).
Legler, D. M., Freeland, H. J., Lumpkin, R., Ball, G., McPhaden, M. J., North, S., et al. (2015). The current status of the real-time in-situ Global Ocean Observing System for operational oceanography. J. Oper. Oceanogr. 8, s189–s200. doi: 10.1080/1755876X.2015.1049883
Leipper, D. F., and Volgenau, D. (1972). Hurricane heat potential of the Gulf of Mexico. J. Phys. Oceanogr. 2, 218–224. doi: 10.1175/1520-0485(1972)002<0218:hhpotg>2.0.co;2
Liblik, T., Karstensen, J., Testor, P., Alenius, P., Hayes, D., Ruiz, S., et al. (2016). Potential for an underwater glider component as part of the Global Ocean observing system. Methods Oceanogr. 17, 50–82. doi: 10.1016/j.mio.2016.05.001
Lin, I.-I., Black, P., Price, J. F., Yang, C.-Y., Chen, S. S., Lien, C.-C., et al. (2013a). An ocean coupling potential intensity index for tropical cyclones. Geophys. Res. Lett. 40, 1878–1882. doi: 10.1002/grl.50091
Lin, I.-I., Goni, G. J., Knaff, J. A., Forbes, C., and Ali, M. M. (2013b). Ocean heat content for tropical cyclone intensity forecasting and its impact on storm surge. Nat. Hazards 66, 1481–1500. doi: 10.1007/s11069-012-0214-5
Lin, I.-I., Chen, C.-H., Pun, I.-F., Liu, W. T., and Wu, C.-C. (2009). Warm ocean anomaly, air sea fluxes, and the rapid intensification of tropical cyclone Nargis (2008). Geophys. Res. Lett. 36:L03817. doi: 10.1029/2008GL035815
Lin, I.-I., Pun, I.-F., and Lien, C.-C. (2014). “Category-6” supertyphoon Haiyan in global warming hiatus: contribution from subsurface ocean warming. Geophys. Res. Lett. 41, 8547–8553. doi: 10.1002/2014GL061281
Lin, I.-I., Wu, C.-C., Emanuel, K. A., Lee, I.-H., Wu, C.-R., and Pun, I.-F. (2005). The interaction of supertyphoon Maemi (2003) with a warm ocean eddy. Mon. Weather Rev. 133, 2635–2649. doi: 10.1175/MWR3005.1
Lin, I.-I., Wu, C.-C., Pun, I.-F., and Ko, D.-S. (2008). Upper-ocean thermal structure and the western North Pacific category 5 typhoons. Part I: ocean features and the category 5 typhoons’. Intensification. Mon. Weather Rev. 136, 3288–3306. doi: 10.1175/2008MWR2277.1
Mainelli, M., DeMaria, M., Shay, L. K., and Goni, G. (2008). Application of oceanic heat content estimation to operational forecasting of recent Atlantic category 5 hurricanes. Weather Forecast. 23, 3–16. doi: 10.1175/2007WAF2006111.1
Mao, Q., Chang, S. W., and Pfeffer, R. L. (2000). Influence of large-scale initial oceanic mixed layer depth on tropical cyclones. Mon. Weather Rev. 128, 4058–4070. doi: 10.1175/1520-0493(2000)129<4058:iolsio>2.0.co;2
Masumoto, Y., Hermes, J. C., Beal, L. M., Roxy, M. K., Vialard, J., Andres, M., et al. (2019). Sustained Indian Ocean observing system. Front. Mar. Sci. 6:355. doi: 10.3389/fmars.2019.00355
Meissner, T., Wentz, F., and Le Vine, D. (2018). The salinity retrieval algorithms for the NASA Aquarius version 5 and SMAP version 3 releases. Remote Sens. 10:1121. doi: 10.3390/rs10071121
Menkes, C. E., Lengaigne, M., Lévy, M., Ethé, C., Bopp, L., Aumont, O., et al. (2016). Global impact of tropical cyclones on primary production. Glob. Biogeochem. Cycles 30, 767–786. doi: 10.1002/2015GB005214
Meyers, P. C., Shay, L. K., and Brewster, J. K. (2014). Development and analysis of the systematically merged Atlantic regional temperature and salinity climatology for oceanic heat content estimates. J. Atmospheric Ocean. Technol. 31, 131–149. doi: 10.1175/JTECH-D-13-00100.1
Meyers, P. C., Shay, L. K., Brewster, J. K., and Jaimes, B. (2015). Observed ocean thermal response to Hurricanes Gustav and Ike. J. Geophys. Res. Oceans 121, 162–179. doi: 10.1002/2015JC010912
Miles, T., Seroka, G., and Glenn, S. (2017). Coastal ocean circulation during Hurricane Sandy. J. Geophys. Res. Oceans 122, 7095–7114. doi: 10.1002/2017JC013031
Miles, T., Seroka, G., Kohut, J., Schofield, O., and Glenn, S. (2015). Glider observations and modeling of sediment transport in Hurricane Sandy. J. Geophys. Res. Oceans 120, 1771–1791. doi: 10.1002/2014JC010474
Miyazawa, Y., Guo, X., Varlamov, S. M., Miyama, T., Yoda, K., Sato, K., et al. (2015). Assimilation of the seabird and ship drift data in the north-eastern sea of Japan into an operational ocean nowcast/forecast system. Sci. Rep. 5:17672. doi: 10.1038/srep17672
Miyazawa, Y., Kuwano-Yoshida, A., Doi, T., Nishikawa, H., Narazaki, T., Fukuoka, T., et al. (2019). Temperature profiling measurements by sea turtles improve ocean state estimation in the Kuroshio-Oyashio Confluence region. Ocean Dyn. 69, 267–282. doi: 10.1007/s10236-018-1238-5
Mochizuki, M., Kanazawa, T., Uehira, K., Shimbo, T., Shiomi, K., Kunugi, T., et al. (2017). “S-net project: construction of large scale seafloor observatory network for tsunamis and earthquakes in Japan,” in Proceedings of the AGU Fall Meeting 2017, (New Orleans).
Morrison, J. M., Codispoti, L. A., Smith, S. L., Wishner, K., Flagg, C., Gardner, W. D., et al. (1999). The oxygen minimum zone in the Arabian Sea during 1995. Deep Sea Res. Part Top. Stud. Oceanogr. 46, 1903–1931.
Nagamani, P. V., Ali, M. M., Goni, G. J., Pedro, D. N., Pezzullo, J. C., Udaya Bhaskar, T. V., et al. (2012). Validation of satellite-derived tropical cyclone heat potential with in situ observations in the North Indian Ocean. Remote Sens. Lett. 3, 615–620. doi: 10.1080/01431161.2011.640959
Narazaki, T., Sato, K., and Miyazaki, N. (2015). Summer migration to temperate foraging habitats and active winter diving of juvenile loggerhead turtles Caretta caretta in the western North Pacific. Mar. Biol. 162, 1251–1263. doi: 10.1007/s00227-015-2666-0
Neetu, S., Lengaigne, M., Vincent, E. M., Vialard, J., Madec, G., Samson, G., et al. (2012). Influence of upper-ocean stratification on tropical cyclone-induced surface cooling in the Bay of Bengal. J. Geophys. Res. Oceans 117:C12020. doi: 10.1029/2012JC008433
Nishida, K., and Takagi, R. (2016). Teleseismic S wave microseisms. Science 353, 919–921. doi: 10.1126/science.aaf7573
Perry, R. L., Leung, P. T., Bouchard, R., Petraitis, D., Smith, W. C., Sharma, N., et al. (2017). “The continuation of an ocean observing collaboration to improve hurricane and loop current forecasting and modeling in the Gulf of Mexico,” in Proceedings of the OCEANS 2017, (Anchorage), 1–7.
Pickard, G. L., and Emery, W. J. (1990). Descriptive Physical Oceanography. New York, NY: Academic Press.
Pinto, J. G., Zacharias, S., Fink, A. H., Leckebusch, G. C., and Ulbrich, U. (2009). Factors contributing to the development of extreme North Atlantic cyclones and their relationship with the NAO. Climate Dyn. 32, 711–737. doi: 10.1007/s00382-008-0396-4
Price, J. F. (2009). Metrics of hurricane-ocean interaction: vertically-integrated or vertically-averaged ocean temperature? Ocean Sci. 5, 351–368. doi: 10.5194/os-5-351-2009
Price, J. F., Sanford, T. B., and Forristall, G. Z. (1994). Forced stage response to a moving hurricane. J. Phys. Oceanogr. 24, 233–260. doi: 10.1175/1520-0485(1994)024<0233:FSRTAM>2.0.CO;2
Riser, S. C., Freeland, H. J., Roemmich, D., Wijffels, S., Troisi, A., Belbéoch, M., et al. (2016). Fifteen years of ocean observations with the global Argo array. Nat. Clim. Change 6, 145–153. doi: 10.1038/nclimate2872
Roemmich, D., Alford, M. H., Claustre, H., Johnson, K. S., King, B., Moum, J., et al. (2019). On the future of Argo: a global, full-depth, multi-disciplinary array. Front. Mar. Sci. 6:439. doi: 10.3389/fmars.2019.00439
Rogers, R. F., Aberson, S., Bell, M. M., Cecil, D. J., Doyle, J. D., Kimberlain, T. B., et al. (2017). Rewriting the tropical record books: the extraordinary intensification of Hurricane Patricia (2015). Bull. Am. Meteorol. Soc. 98, 2091–2112. doi: 10.1175/BAMS-D-16-0039.1
Rudnick, D. L. (2016). Ocean Research Enabled by Underwater Gliders. Annu. Rev. Mar. Sci. 8, 519–541. doi: 10.1146/annurev-marine-122414-033913
Rudzin, J. E., Shay, L. K., Jaimes, B., and Brewster, J. K. (2017). Upper ocean observations in eastern Caribbean Sea reveal barrier layer within a warm core eddy. J. Geophys. Res. Oceans 122, 1057–1071. doi: 10.1002/2016JC012339
Rudzin, J. E., Shay, L. K., and Johns, W. E. (2018). The influence of the barrier layer on SST response during tropical cyclone wind forcing using idealized experiments. J. Phys. Oceanogr. 48, 1471–1478. doi: 10.1175/JPO-D-17-0279.1
Sanabia, E. R., Barrett, B. S., Black, P. G., Chen, S., and Cummings, J. A. (2013). Real-time upper-ocean temperature observations from aircraft during operational hurricane reconnaissance missions: AXBT demonstration project year one results. Weather Forecast. 28, 1404–1422. doi: 10.1175/WAF-D-12-00107.1
Sanders, F., and Gyakum, J. R. (1980). Synoptic-dynamic climatology of the “bomb. 108, 1589–1606. doi: 10.1175/1520-0493(1980)108<1589:sdcot>2.0.co;2
Sanford, T. B., Black, P. G., Haustein, J. R., Feeney, J. W., Forristall, G. Z., and Price, J. F. (1987). Ocean response to a hurricane. Part I: observations. J. Phys. Oceanogr. 17, 2065–2083. doi: 10.1371/journal.pone.0153735
Sanford, T. B., Price, J. F., and Girton, J. B. (2011). Upper-ocean response to Hurricane Frances (2004) observed by profiling EM-APEX floats. J. Phys. Oceanogr. 41, 1041–1056. doi: 10.1175/2010JPO4313.1
Sanford, T. B., Price, J. F., Girton, J. B., and Webb, D. C. (2007). Highly resolved observations and simulations of the ocean response to a hurricane. Geophys. Res. Lett. 34:L13604. doi: 10.1029/2007GL029679
Sengupta, D., Goddalehundi, B. R., and Anitha, D. S. (2008). Cyclone-induced mixing does not cool SST in the post-monsoon North Bay of Bengal. Atmos. Sci. Lett. 9, 1–6. doi: 10.1002/asl.162
Seroka, G., Miles, T., Xu, Y., Kohut, J., Schofield, O., and Glenn, S. (2016). Hurricane Irene sensitivity to stratified coastal ocean cooling. Mon. Weather Rev. 144, 3507–3530. doi: 10.1175/MWR-D-15-0452.1
Shapiro, M., Wernli, H., Bao, J.-W., Methven, J., Zou, X., Doyle, J., et al. (1999). “A planetary-scale to mesoscale perspective of the life cycles of extratropical cyclones: the bridge between theory and observations,” in The Life Cycles of Extratropical Cyclones, eds M. A. Shapiro and S. Grønås (Boston, MA: American Meteorological Society), 139–185. doi: 10.1007/978-1-935704-09-6_14
Shay, L. K., Ali, M. M., Chen, S., Ginis, I., Halliwell, G., Kim, H., et al. (2014). Air-sea Interface and Oceanic Influences (Topic 4.4)”, Jeju, Republic of Korea. Geneva: World Meteorological Organization.
Shay, L. K., Black, P. G., Mariano, A. J., Hawkins, J. D., and Elsberry, R. L. (1992). Upper ocean response to Hurricane Gilbert. J. Geophys. Res. Oceans 97, 20227–20248. doi: 10.1029/92JC01586
Shay, L. K., and Brewster, J. K. (2010). Oceanic heat content variability in the eastern Pacific Ocean for hurricane intensity forecasting. Mon. Weather Rev. 138, 2110–2131. doi: 10.1175/2010MWR3189.1
Shay, L. K., Goni, G. J., and Black, P. G. (2000). Effects of a warm oceanic feature on Hurricane Opal. Mon. Weather Rev. 128, 1366–1383. doi: 10.1175/1520-0493(2000)128<1366:eoawof>2.0.co;2
Smith, E. R., Kessel, W., Cravatte, S., Sprintall, S., Cronin, S., Sutton, M., et al. (2019). Tropical Pacific observing system. Front. Mar. Sci. 6:31. doi: 10.3389/fmars.2019.00031
Sprintall, J., and Tomczak, M. (1992). Evidence of the barrier layer in the surface layer of the tropics. J. Geophys. Res. Oceans 97, 7305–7316. doi: 10.1029/92JC00407
St Laurent, L., and Merrifield, S. (2017). Measurements of near-surface turbulence and mixing from autonomous ocean gliders. Oceanography 30, 116–125. doi: 10.5670/oceanog.2017.231
Testor, P., DeYoung, B., Rudnick, D. L., Glenn, S., Hayes, D., Lee, C., et al. (2019). OceanGliders: a component of the integrated GOOS. Front. Mar. Sci. 6:422. doi: 10.3389/fmars.2019.00422
Todd, R. E., Asher, T. G., Heiderich, J., Bane, J. M., and Luettich, R. A. (2018). Transient response of the Gulf Stream to multiple hurricanes in 2017. Geophys. Res. Lett. 10:519. doi: 10.1029/2018GL079180
Todd, R. E., Chavez, F. P., Clayton, S., CRAVATTE, S. E., Goes, M. P., Graco, M. I., et al. (2019). Global Perspectives on Observing Ocean Boundary Current Systems. Front. Mar. Sci. 6:423. doi: 10.3389/fmars.2019.00423
Todd, R. E., Rudnick, D. L., Sherman, J. T., Owens, W. B., and George, L. (2017). Absolute velocity estimates from autonomous underwater gliders equipped with Doppler current profilers. J. Atmospheric Ocean. Technol. 34, 309–333. doi: 10.1175/JTECH-D-16-0156.1
Trenberth, K. E., Cheng, L., Jacobs, P., Zhang, Y., and Fasullo, J. (2018). Hurricane harvey links to ocean heat content and climate change adaptation. Earths Future 6, 730–744. doi: 10.1029/2018EF000825
Ulbrich, U., Leckebusch, G. C., and Pinto, J. G. (2009). Extra-tropical cyclones in the present and future climate: a review. Theor. Appl. Climatol. 96, 117–131. doi: 10.1007/s00704-008-0083-8
Venugopal, T., Ali, M. M., Bourassa, M. A., Zheng, Y., Goni, G. J., Foltz, G. R., et al. (2018). Statistical evidence for the role of southwestern Indian Ocean heat content in the Indian summer monsoon rainfall. Sci. Rep. 8:12092. doi: 10.1038/s41598-018-30552-0
Verrier, S., Le Traon, P. Y., Remy, E., and Lellouche, J. M. (2018). Assessing the impact of SAR altimetry for global ocean analysis and forecasting. J. Oper. Oceanogr. 11, 82–86. doi: 10.1080/1755876x.2018.1505028
Wada, A., Kunii, M., Yonehara, Y., and Sato, K. (2017). Impacts on local heavy rainfalls of surface winds measurement by seabirds. CAS/JSC WGNE Res. Activities Atm. And. Oceanic Model. 47, 1–25.
Wang, X., Han, G., Qi, Y., and Li, W. (2011). Impact of barrier layer on typhoon-induced sea surface cooling. Dyn. Atmospheres Oceans 52, 367–385. doi: 10.1016/j.dynatmoce.2011.05.002
Warner, S. J., Becherer, J., Pujiana, K., Shroyer, E. L., Ravichandran, M., Thangaprakash, V. P., et al. (2016). Monsoon mixing cycles in the Bay of Bengal: a year-long subsurface mixing record. Oceanography 29, 158–169. doi: 10.5670/oceanog.2016.48
Watanuki, Y., Mehlum, F., and Takahashi, A. (2001). Water temperature sampling by foraging Brünnich’s Guillemots with bird-borne data loggers. J. Avian Biol. 32, 189–193. doi: 10.1034/j.1600-048X.2001.320214.x
Wilson, R. P., Grémillet, D., Syder, J., Kierspel, M. A. M., Garthe, S., Weimerskirch, H., et al. (2002). Remote-sensing systems and seabirds: their use, abuse and potential for measuring marine environmental variables. Mar. Ecol. Prog. Ser. 228, 241–261. doi: 10.3354/meps228241
World Meteorological Organization (WMO) (2015a). Manual on Codes (WMO 306). Geneva: World Meteorological Organization.
World Meteorological Organization (WMO) (2015b). Manual on the Global Telecommunication System (WMO 386). Geneva: World Meteorological Organization.
Wu, L., Cai, W., Zhang, L., Nakamura, H., Timmermann, A., Joyce, T., et al. (2012). Enhanced warming over the global subtropical western boundary currents. Nat. Clim. Change 2, 161–166. doi: 10.1038/nclimate1353
Yamaguchi, M., Owada, H., Shimada, U., Sawada, M., Iriguchi, T., Musgrave, K. D., et al. (2018). Tropical cyclone intensity prediction in the western North Pacific basin using SHIPS and JMA/GSM. SOLA 14, 138–143. doi: 10.2151/sola.2018-024
Yoda, K., Shiomi, K., and Sato, K. (2014). Foraging spots of streaked shearwaters in relation to ocean surface currents as identified using their drift movements. Prog. Oceanogr. 122, 54–64. doi: 10.1016/j.pocean.2013.12.002
Yonehara, Y., Goto, Y., Yoda, K., Watanuki, Y., Young, L. C., Weimerskirch, H., et al. (2016). Flight paths of seabirds soaring over the ocean surface enable measurement of fine-scale wind speed and direction. Proc. Natl. Acad. Sci. U.S.A. 113, 9039–9044. doi: 10.1073/pnas.1523853113
Yoshida, A., and Asuma, Y. (2004). Structures and environment of explosively developing extratropical cyclones in the northwestern Pacific region. Mon. Weather Rev. 132, 1121–1142. doi: 10.1175/1520-0493(2004)132<1121:saeoed>2.0.co;2
Young, M. V., Monk, G. A., and Browning, K. A. (1987). Interpretation of satellite imagery of a rapidly deepening cyclone. Q. J. R. Meteorol. Soc. 113, 1089–1115. doi: 10.1002/qj.49711347803
Yu, L., and McPhaden, M. J. (2011). Ocean preconditioning of Cyclone Nargis in the Bay of Bengal: interaction between Rossby waves, surface fresh waters, and sea surface temperatures. J. Phys. Oceanogr. 41, 1741–1755. doi: 10.1175/2011jpo4437.1
Zhang, H.-M., Reynolds, R. W., Lumpkin, R., Molinari, R., Arzayus, K., Johnson, M., et al. (2009). An integrated global observing system for sea surface temperature using satellites and in-situ data: research to operations. Bull. Am. Meteorol. Soc. 90, 31–38. doi: 10.1175/2008BAMS2577.1
Zhang, J. A., Atlas, R., Emmitt, G. D., Bucci, L., and Ryan, K. (2018). Airborne Doppler wind lidar observations of the tropical cyclone boundary layer. Remote Sens. 10:825. doi: 10.3390/rs10060825
Zhang, J. A., Black, P. G., French, J. R., and Drennan, W. M. (2008). First direct measurements of enthalpy flux in the hurricane boundary layer: the CBLAST results. Geophys. Res. Lett. 35:L14813. doi: 10.1029/2008GL034374
Zhang, J. A., Nolan, D. S., Rogers, R. F., and Tallapragada, V. (2015). Evaluating the impact of improvements in the boundary layer parameterization on hurricane intensity and structure forecasts in HWRF. Mon. Weather Rev. 143, 3136–3155. doi: 10.1175/MWR-D-14-00339.1
Keywords: tropical cyclones, extratropical bomb cyclones, upper-ocean temperature, ocean heat content, global ocean observing system, weather extremes, natural hazards, coupled ocean-atmosphere forecasts
Citation: Domingues R, Kuwano-Yoshida A, Chardon-Maldonado P, Todd RE, Halliwell G, Kim H-S, Lin I-I, Sato K, Narazaki T, Shay LK, Miles T, Glenn S, Zhang JA, Jayne SR, Centurioni L, Le Hénaff M, Foltz GR, Bringas F, Ali MM, DiMarco SF, Hosoda S, Fukuoka T, LaCour B, Mehra A, Sanabia ER, Gyakum JR, Dong J, Knaff JA and Goni G (2019) Ocean Observations in Support of Studies and Forecasts of Tropical and Extratropical Cyclones. Front. Mar. Sci. 6:446. doi: 10.3389/fmars.2019.00446
Received: 20 November 2018; Accepted: 05 July 2019;
Published: 30 July 2019.
Edited by:
John Siddorn, Met Office, United KingdomReviewed by:
Girishkumar Madathil Sivasankaran, Indian National Centre for Ocean Information Services, IndiaSaša Gaberšek, Naval Research Laboratory Marine Meteorology Division, United States
Copyright © 2019 Domingues, Kuwano-Yoshida, Chardon-Maldonado, Todd, Halliwell, Kim, Lin, Sato, Narazaki, Shay, Miles, Glenn, Zhang, Jayne, Centurioni, Le Hénaff, Foltz, Bringas, Ali, DiMarco, Hosoda, Fukuoka, LaCour, Mehra, Sanabia, Gyakum, Dong, Knaff and Goni. This is an open-access article distributed under the terms of the Creative Commons Attribution License (CC BY). The use, distribution or reproduction in other forums is permitted, provided the original author(s) and the copyright owner(s) are credited and that the original publication in this journal is cited, in accordance with accepted academic practice. No use, distribution or reproduction is permitted which does not comply with these terms.
*Correspondence: Ricardo Domingues, Ricardo.Domingues@noaa.gov