Ship-Based Contributions to Global Ocean, Weather, and Climate Observing Systems
 Shawn R. Smith1*
  Gaël Alory2
  Axel Andersson3
  William Asher4
  Alex Baker5
  David I. Berry6
  Kyla Drushka4 Darin Figurskey7
  Eric Freeman8
  Paul Holthus9 Tim Jickells5 Henry Kleta10
  Elizabeth C. Kent6
  Nicolas Kolodziejczyk11
  Martin Kramp12 Zoe Loh13
  Paul Poli14
  Ute Schuster15
  Emma Steventon16
  Sebastiaan Swart17,18
  Oksana Tarasova19 Loic Petit de la Villéon20
  Nadya Vinogradova-Shiffer21
- 1Center for Ocean-Atmospheric Prediction Studies, The Florida State University, Tallahassee, FL, United States
- 2LEGOS, CNES/CNRS/IRD/UPS, Toulouse, France
- 3Maritimes Datenzentrum, Deutscher Wetterdienst, Hamburg, Germany
- 4Applied Physics Laboratory, University of Washington, Seattle, WA, United States
- 5School of Environmental Sciences, University of East Anglia, Norwich, United Kingdom
- 6National Oceanography Centre, Southampton, United Kingdom
- 7Ocean Prediction Center, NOAA National Weather Service, College Park, MD, United States
- 8ERT, Inc., National Centers for Environmental Information/CCOG, Asheville, NC, United States
- 9World Ocean Council, Honolulu, HI, United States
- 10Maritimes Messnetz, Deutscher Wetterdienst, Hamburg, Germany
- 11Laboratory of Ocean Physics, University of Brest, Plouzané, France
- 12JCOMMOPS, WMO/IOC-UNESCO, Brest, France
- 13Oceans and Atmosphere, CSIRO, Aspendale, VIC, Australia
- 14Centre de Météorologie Marine, Météo-France, Brest, France
- 15College of Life and Environmental Sciences, Hatherly Laboratories, University of Exeter, Exeter, United Kingdom
- 16Met Office, Exeter, United Kingdom
- 17Department of Marine Sciences, University of Gothenburg, Gothenburg, Sweden
- 18Department of Oceanography, University of Cape Town, Rondebosch, South Africa
- 19Global Atmosphere Watch Programme, World Meteorological Organization, Geneva, Switzerland
- 20IFREMER/Sismer, Plouzané, France
- 21Science Mission Directorate, NASA Headquarters, Washington, DC, United States
The role ships play in atmospheric, oceanic, and biogeochemical observations is described with a focus on measurements made near the ocean surface. Ships include merchant and research vessels; cruise liners and ferries; fishing vessels; coast guard, military, and other government-operated ships; yachts; and a growing fleet of automated surface vessels. The present capabilities of ships to measure essential climate/ocean variables and the requirements from a broad community to address operational, commercial, and scientific needs are described. The authors provide a vision to expand observations needed from ships to understand and forecast the exchanges across the ocean–atmosphere interface. The vision addresses (1) recruiting vessels to improve both spatial and temporal sampling, (2) conducting multivariate sampling on ships, (3) raising technology readiness levels of automated shipboard sensors and ship-to-shore data communications, (4) advancing quality evaluation of observations, and (5) developing a unified data management approach for observations and metadata that meet the needs of a diverse user community. Recommendations are made focusing on integrating private and autonomous vessels into the observing system, investing in sensor and communications technology development, developing an integrated data management structure that includes all types of ships, and moving toward a quality evaluation process that will result in a subset of ships being defined as mobile reference ships that will support climate studies. We envision a future where commercial, research, and privately owned vessels are making multivariate observations using a combination of automated and human-observed measurements. All data and metadata will be documented, tracked, evaluated, distributed, and archived to benefit users of marine data. This vision looks at ships as a holistic network, not a set of disparate commercial, research, and/or third-party activities working in isolation, to bring these communities together for the mutual benefit of all.
Introduction
Since the days when sailing vessels were the primary vehicle for commerce and exploration on the high seas, ships have observed the marine environment (Woodruff et al., 2005). With the exception of a few research voyages (e.g., HMS Beagle, Keynes, 2012; HMS Challenger, Corfield, 2003), these early observations of sea water temperature, winds, and atmospheric pressure were made to support day-to-day operations (e.g., Richardson, 1980). Today, all types of ships make routine weather and ocean observations that are shared internationally to support weather forecasting, safety at sea, and commercial ventures (e.g., energy, fisheries, and transportation), while dedicated oceanographic research vessels make a wide range of atmospheric, oceanographic, chemical, biological, and other observations to support research into the complex interactions between the marine atmosphere, hydrosphere, cryosphere, and biosphere. Research vessels provide an extremely versatile sampling platform from which highly sophisticated instrumentation can be deployed by national research facilities, navies, coast guards, universities, or private institutions. Many are designed to operate in remote and inhospitable waters, providing data from regions outside commercial shipping lanes; however, sampling from research vessels often suffers from a lack of regularity and repeat sampling at given locations and can be subject to large seasonal biases, with high latitude regions rarely visited during the winter months. In contrast, commercial ships tend to traverse the ocean along traditional and, with decreased Arctic ice cover in recent years, evolving shipping lanes, thus repeating observations in spatially limited regions of the ocean. Over long timescales (decades to centuries), meteorological and oceanographic observations made from pre-industrial sailing vessels, research vessels, and commercial ships and more recently autonomous surface vessels underpin our understanding of marine climate variability and change.
The focus herein is on the role ships presently play in atmospheric and oceanic observations and outlines a vision for the coming decade. The vision builds upon the recommendations from the OceanObs’09 meeting (Smith et al., 2010). Of the 14 recommendations made in Smith et al. (2010), successes include improving linkages between the physical, biological, and carbon communities [e.g., through the Joint Technical Commission for Oceanography and Marine Meteorology (JCOMM, see Appendix) Observation Coordination Group]; working toward standardized metadata [e.g., converging on World Meteorological Organization (WMO) Integrated Global Observing System (WIGOS) metadata standards and developing unique identifiers for observing platforms]; identifying new ships to provide observations (e.g., recruiting racing yachts from the Volvo Ocean Race and research vessels to underway data programs); and outlining new approaches to recruit ships through non-traditional methods [e.g., JCOMM approval in 2018 of a new third-party class to recruit ships outside of the traditional national meteorological and hydrographic services (NMHS)]. There has also been success in developing automated precipitation systems for ships (e.g., Klepp, 2015) and including air-flow modeling in new ship design (e.g., specifically for the research vessels Sikuliaq, Sally Ride, and Neil Armstrong in the United States). One recent success in the area of addressing diplomatic obstacles was the workshop on enhancing ocean observations and research, and the free exchange of data, to foster services for the safety of life and property hosted by WMO in February 2019. The workshop recognized the importance of Observing System Simulation Experiments (OSSEs) and sensitivity analyses to be used to investigate the importance of data collected within nation’s exclusive economic zones. Despite the successes since OceanObs’09, a number of the recommendations saw little progress in the past decade. There is still a need to advance instrument technology for autonomous sampling, particularly for cloud cover, cloud type, and sea state. Adequate resources have not been available to coordinate research vessel cruise data, to develop consolidated marine datasets, standardize data quality evaluation across multiple ship measurement programs, or conduct systematic comparisons of different sensor systems typically deployed on ships. The proposed vision includes some of the topics not addressed over the past decade.
Throughout this review, the term “ship” includes, but is not limited to, merchant and research vessels; cruise liners and ferries; fishing vessels; coast guard, military, and other government-operated ships; yachts and other private crafts; and a growing fleet of autonomous surface vessels. The primary focus will be on ships with a crew; however, autonomous surface vessels (e.g., Caccia et al., 2005; German et al., 2012) and large fixed or mobile platforms (e.g., drilling platforms and light towers) can provide similar observational capabilities. While recognizing the great importance of ships for deploying atmosphere- and ocean-observing technology (e.g., balloon soundings, McBean et al., 1986; expendable bathythermographs, Goni et al., 2019; Argo floats, Roemmich et al., 2009; drifters, Pazan and Niiler, 2004; moorings, McPhaden et al., 1998; Send et al., 2010; and gliders, Rudnick et al., 2004), the focus here is on measurements by automated instrumentation and both visual estimates and instrumental readings taken by observers on board ships. Ships provide a platform for simultaneous measurements of the physical and biogeochemical properties within the atmosphere and ocean through the use of fully automated instruments, manual observations, or a combination of the two. The suite of observations (Table 1) that can be made from ships includes essential climate variables (ECVs; Bojinski et al., 2014; Global Climate Observing System [GCOS], 2016) and essential ocean variables (EOVs; Global Ocean Observing System [GOOS], 2018), along with other parameters that address a wide range of applications. The instrumentation installed on ships (along with human observers) supports making measurements over a wide range of heights in the atmosphere and depths in the ocean. While we recognize that ship-based instruments can make atmospheric and ocean profiles (e.g., balloon sondes, rosette casts, and expendable bathythermographs) and include remote sensing systems (e.g., radar, sonar, and acoustic Doppler current profiler), the discussion herein focuses on measurements made near the ocean surface and typically within the physical dimensions of the ship. This limitation is motivated by community requirements (see Community Requirements) to observe those parameters near the ocean surface that are essential to (1) understand the processes that govern the energy, nutrient, and chemical exchanges at the ocean–atmosphere interface; (2) support operational weather, ocean, and climate forecasting; (3) provide observations to validate and evaluate space-based observations of the ocean’s surface and numerical model analyses; (4) quantify biases in ship observations and derived products used in climate research and assessments; (5) examine and understand the variations in the near-surface marine climate system on timescales from hours to centuries; and (6) support ocean ecosystem management.
Table 1. Parameters observed by ships near the ocean surface.
The decadal vision expands the multivariate observations needed from ships to understand and forecast the exchanges across the ocean–atmosphere interface. The vision addresses (1) recruiting additional vessels to improve both spatial and temporal sampling, (2) conducting multivariate sampling on ships, (3) raising technology readiness levels of automated shipboard sensors and ship-to-shore data communications, (4) advancing quality evaluation of observations, and (5) developing a unified data management approach for shipboard observations and metadata that meet the needs of a diverse user community. Leveraging existing programs and developing innovative methods will be a cost-effective approach to support the measurement of multiple physical and biogeochemical observations on individual ships, thereby maximizing ship contributions to GOOS. The authors envision a ship-based observational network that integrates across operational and research communities to deliver needed information.
Community Requirements
Overview
Marine data are used directly and indirectly by a broad community to address operational, commercial, and scientific needs. User requirements differ between the real-time versus delayed-mode (climate) communities resulting in various sampling and collection strategies, data transmission technologies, metadata and documentation, and data quality evaluation. A primary challenge is effectively managing resources provided by commercial, governmental, and private entities to meet these varied requirements. Most observations made to support operational marine forecasting are funded and managed by NMHS, while many other observations are supported by time-limited national or private sector research funding. A continuing challenge is how to sustain observations that are initiated within the research community, but where users see a need for long-term observations and data management. Equally challenging is ensuring that observations primarily funded and made available by the operational community, but used downstream for climate analyses and research, (a) are of sufficient quality and quantity, (b) are appropriately described by metadata, and (c) have suitable provision for sustained data management.
Forecasting, Navigation, and Safety
For centuries observations from ships have provided safety-related meteorological services for ships at sea and have been used for climatological purposes (e.g., Maury, 1854; Mallory, 1855; International Maritime Organization [IMO], 2018). The Safety of Life at Sea Convention (International Maritime Organization [IMO], 2002), Regulation 5, “Meteorological Forecasts and Warnings,” specifies provisions whereby contracting governments are encouraged to arrange for a selection of ships to be equipped with tested marine meteorological instruments and to take, record, and transmit meteorological observations at the main standard times for surface synoptic observations. Contracting governments are also instructed to encourage other ships to make, record, and transmit observations in a modified form, particularly in areas with sparse data. In addition, ship observations have set an early open-access example: WMO (1995) Resolution 40 Annex 1 lists marine data among “data and products to be exchanged without charge and with no conditions on use.” Presently, the Voluntary Observing Ships’ (VOS) Scheme (Kent et al., 2010), a panel of the Ship Observations Team of the JCOMM of WMO and the Intergovernmental Oceanographic Commission (IOC), provides the governance by which ships are recruited by NMHSs for making and transmitting meteorological observations. For near-real-time applications, the data are delivered to users via the WMO Global Telecommunication System (GTS). VOS meteorological reports are a unique and invaluable contribution to operational meteorology and marine meteorological services (Fletcher, 2008).
Requirements for near-surface ship observations to support numerical weather prediction and operational forecasting include, but are not limited to, atmospheric pressure, wind speed and direction, air temperature, relative humidity, and sea surface temperature (SST), as well as wave height, direction, and period (Anderson, 2018). A major ongoing problem is the scarcity of in situ data from vast areas of the world’s oceans. While the near global coverage from satellite-based remote sensing helps overcome this, data from ships remain essential. Ship-based observations provide parameters that satellites cannot observe (e.g., atmospheric pressure), data from regions with gaps in satellite coverage (Figure 1), and validation data that are relevant to forecast operations. Beyond their use in numerical weather prediction, data from ships are also used operationally in the preparation of forecasts and warnings, including those for the Global Maritime Distress and Safety System, and to support the routing of ships to avoid adverse weather and efficiently transport cargo (International Maritime Organization [IMO], 2018).
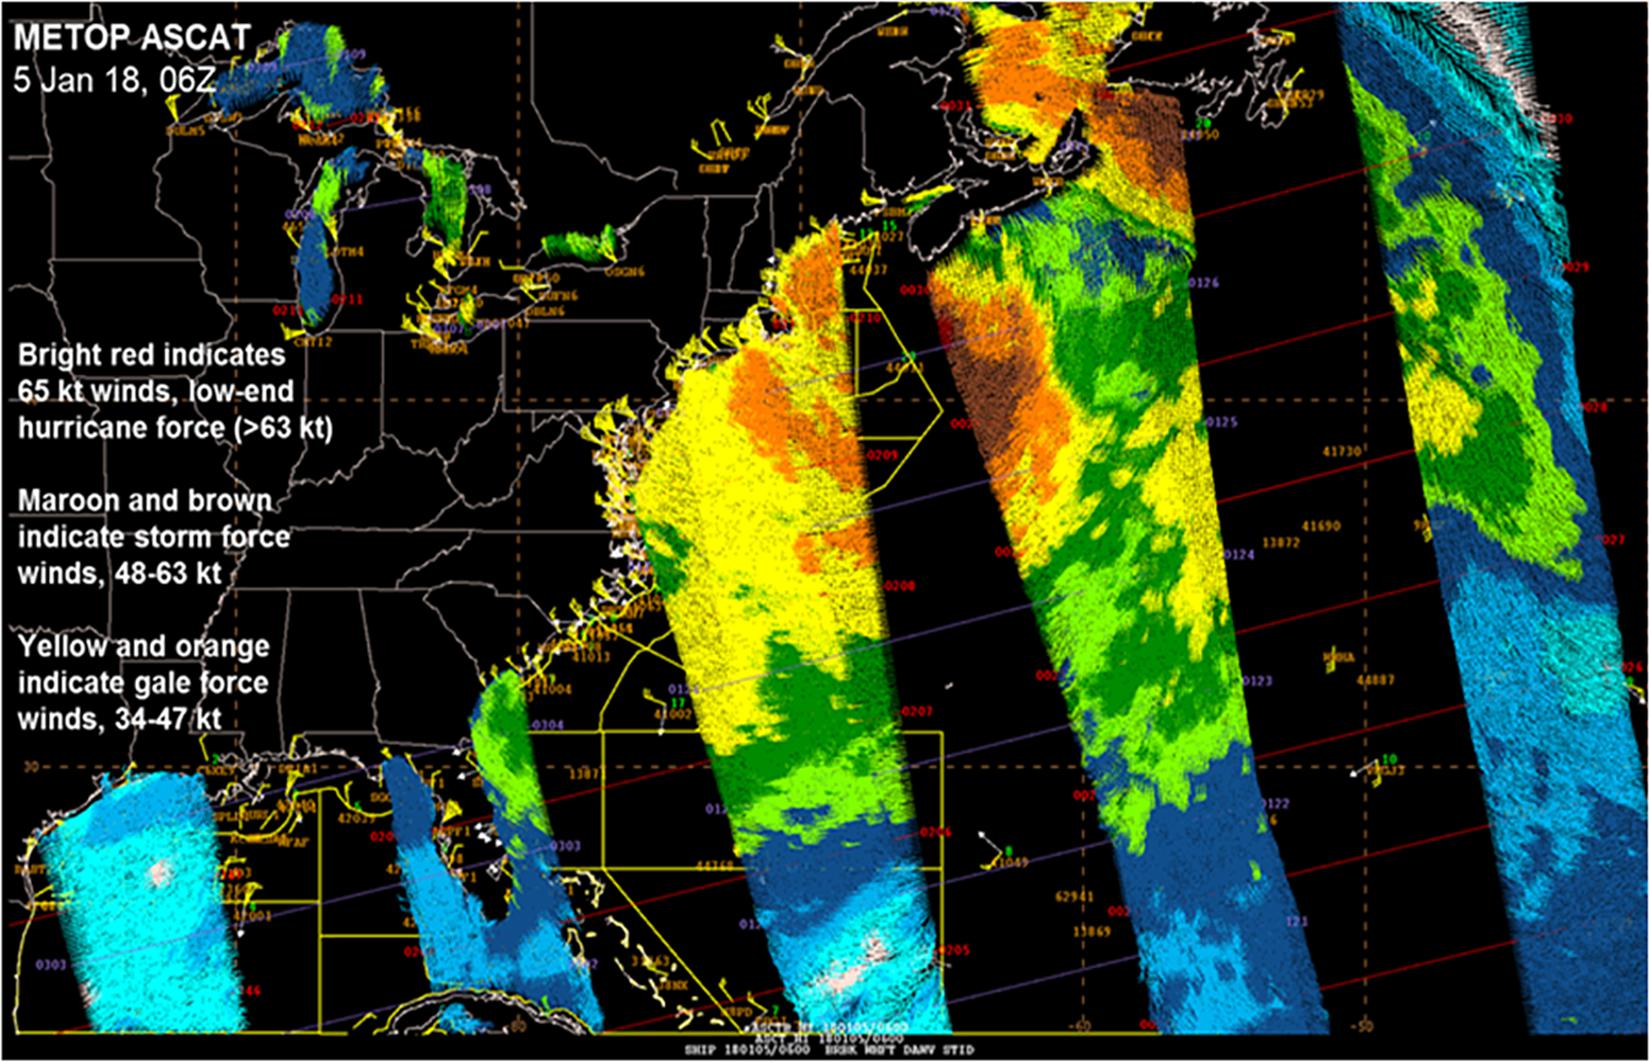
Figure 1. EUMETSAT MetOp Advanced Scatterometer data (colored swaths), with available ship observations (using standard synoptic station notation), from 0600 UTC on 5 January 2018. Courtesy of National Oceanic and Atmospheric Administration, National Weather Service, Ocean Prediction Center.
An example of ship observations assisting in the issuance of a warning for the high seas of the North Atlantic occurred July 29, 2015, when a ship observation on the near-west side of an extratropical cyclone reported hurricane-force sustained winds of 65 knots (Figure 2). The low-pressure center in the 6-h forecast of the National Centers for Environmental Prediction Environmental Modeling Center’s Global Forecasting System model (Figure 3) was located too far west and was too weak. Using the ship observation, a forecaster at the National Weather Service’s Ocean Prediction Center upgraded high seas forecasts to include a hurricane-force wind warning for the cyclone. While the skill of global numerical weather prediction models is increasing (Bauer et al., 2015), human guidance still adds value to daily forecasts, watches, and warnings. This is especially true for high-impact events, specifically in the 12–48 h of the forecast period (e.g., Stern and Davidson, 2015).
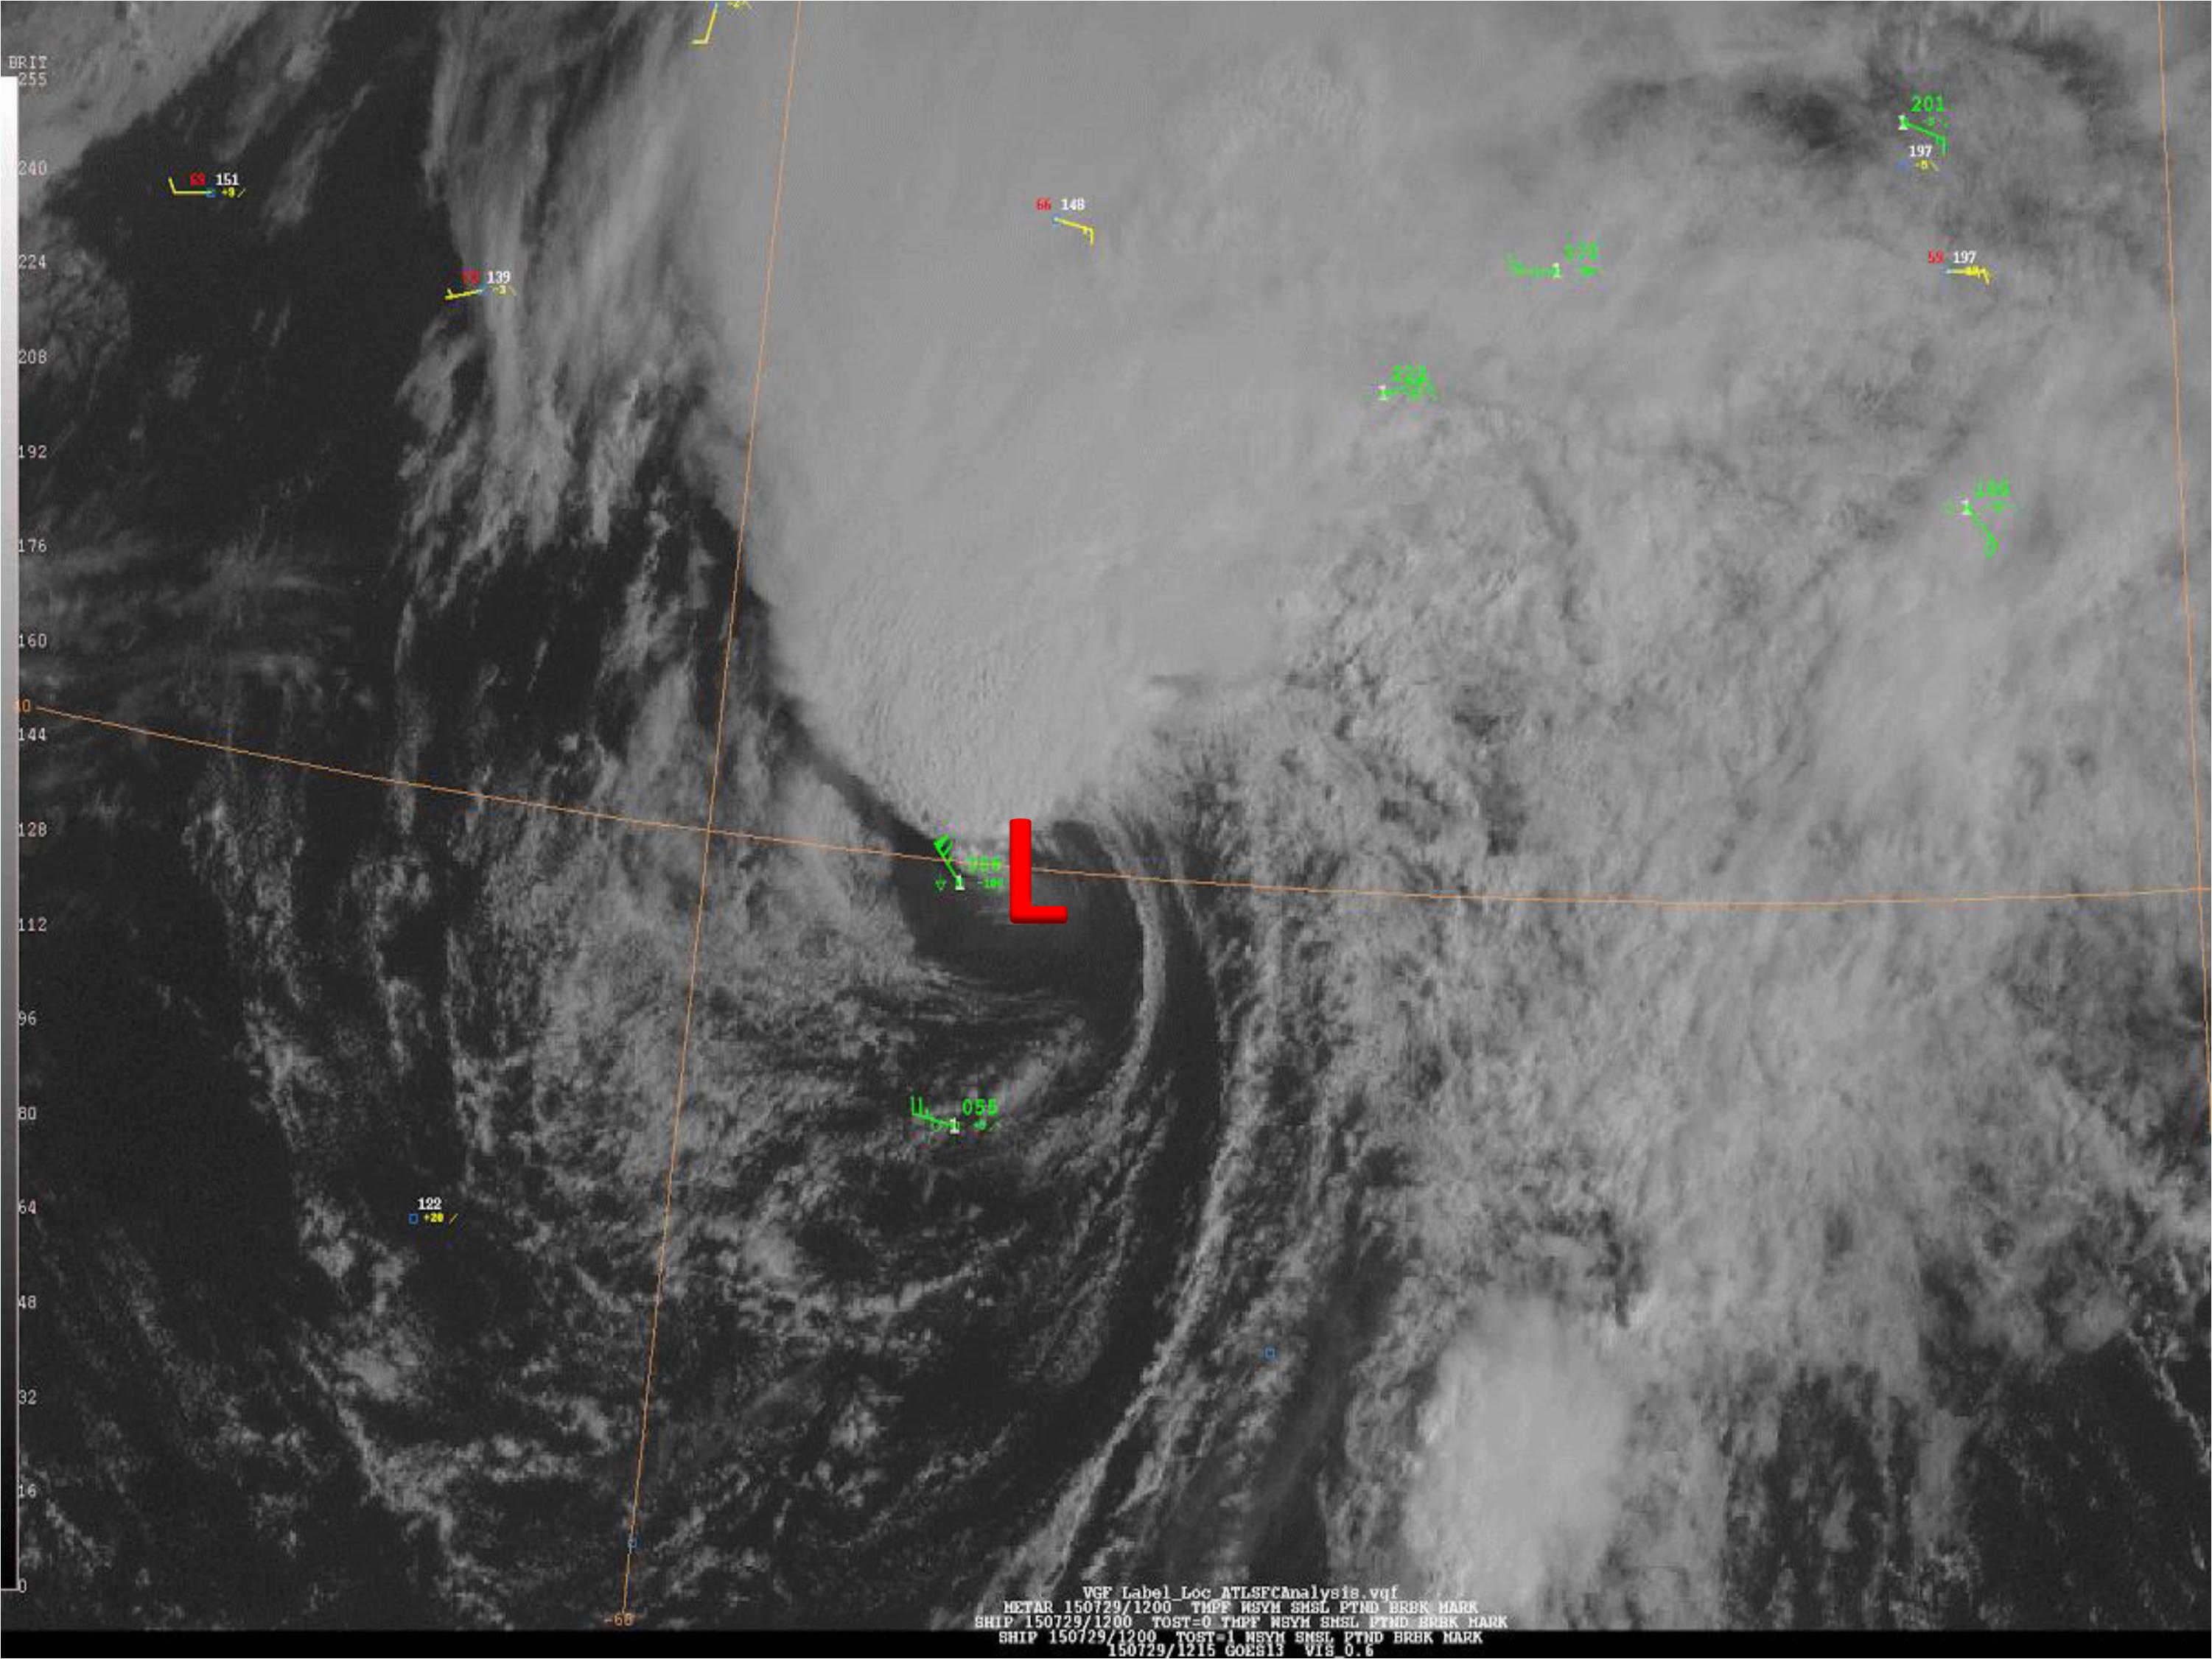
Figure 2. Visible satellite image with available ship observations (overlain in green and yellow using standard synoptic station notation) in the central Atlantic Ocean (1200 UTC, 29 July 2015). Based on this image, the low pressure is centered near 40∘N, 58∘W. Courtesy of National Oceanic and Atmospheric Administration, National Weather Service, Ocean Prediction Center.
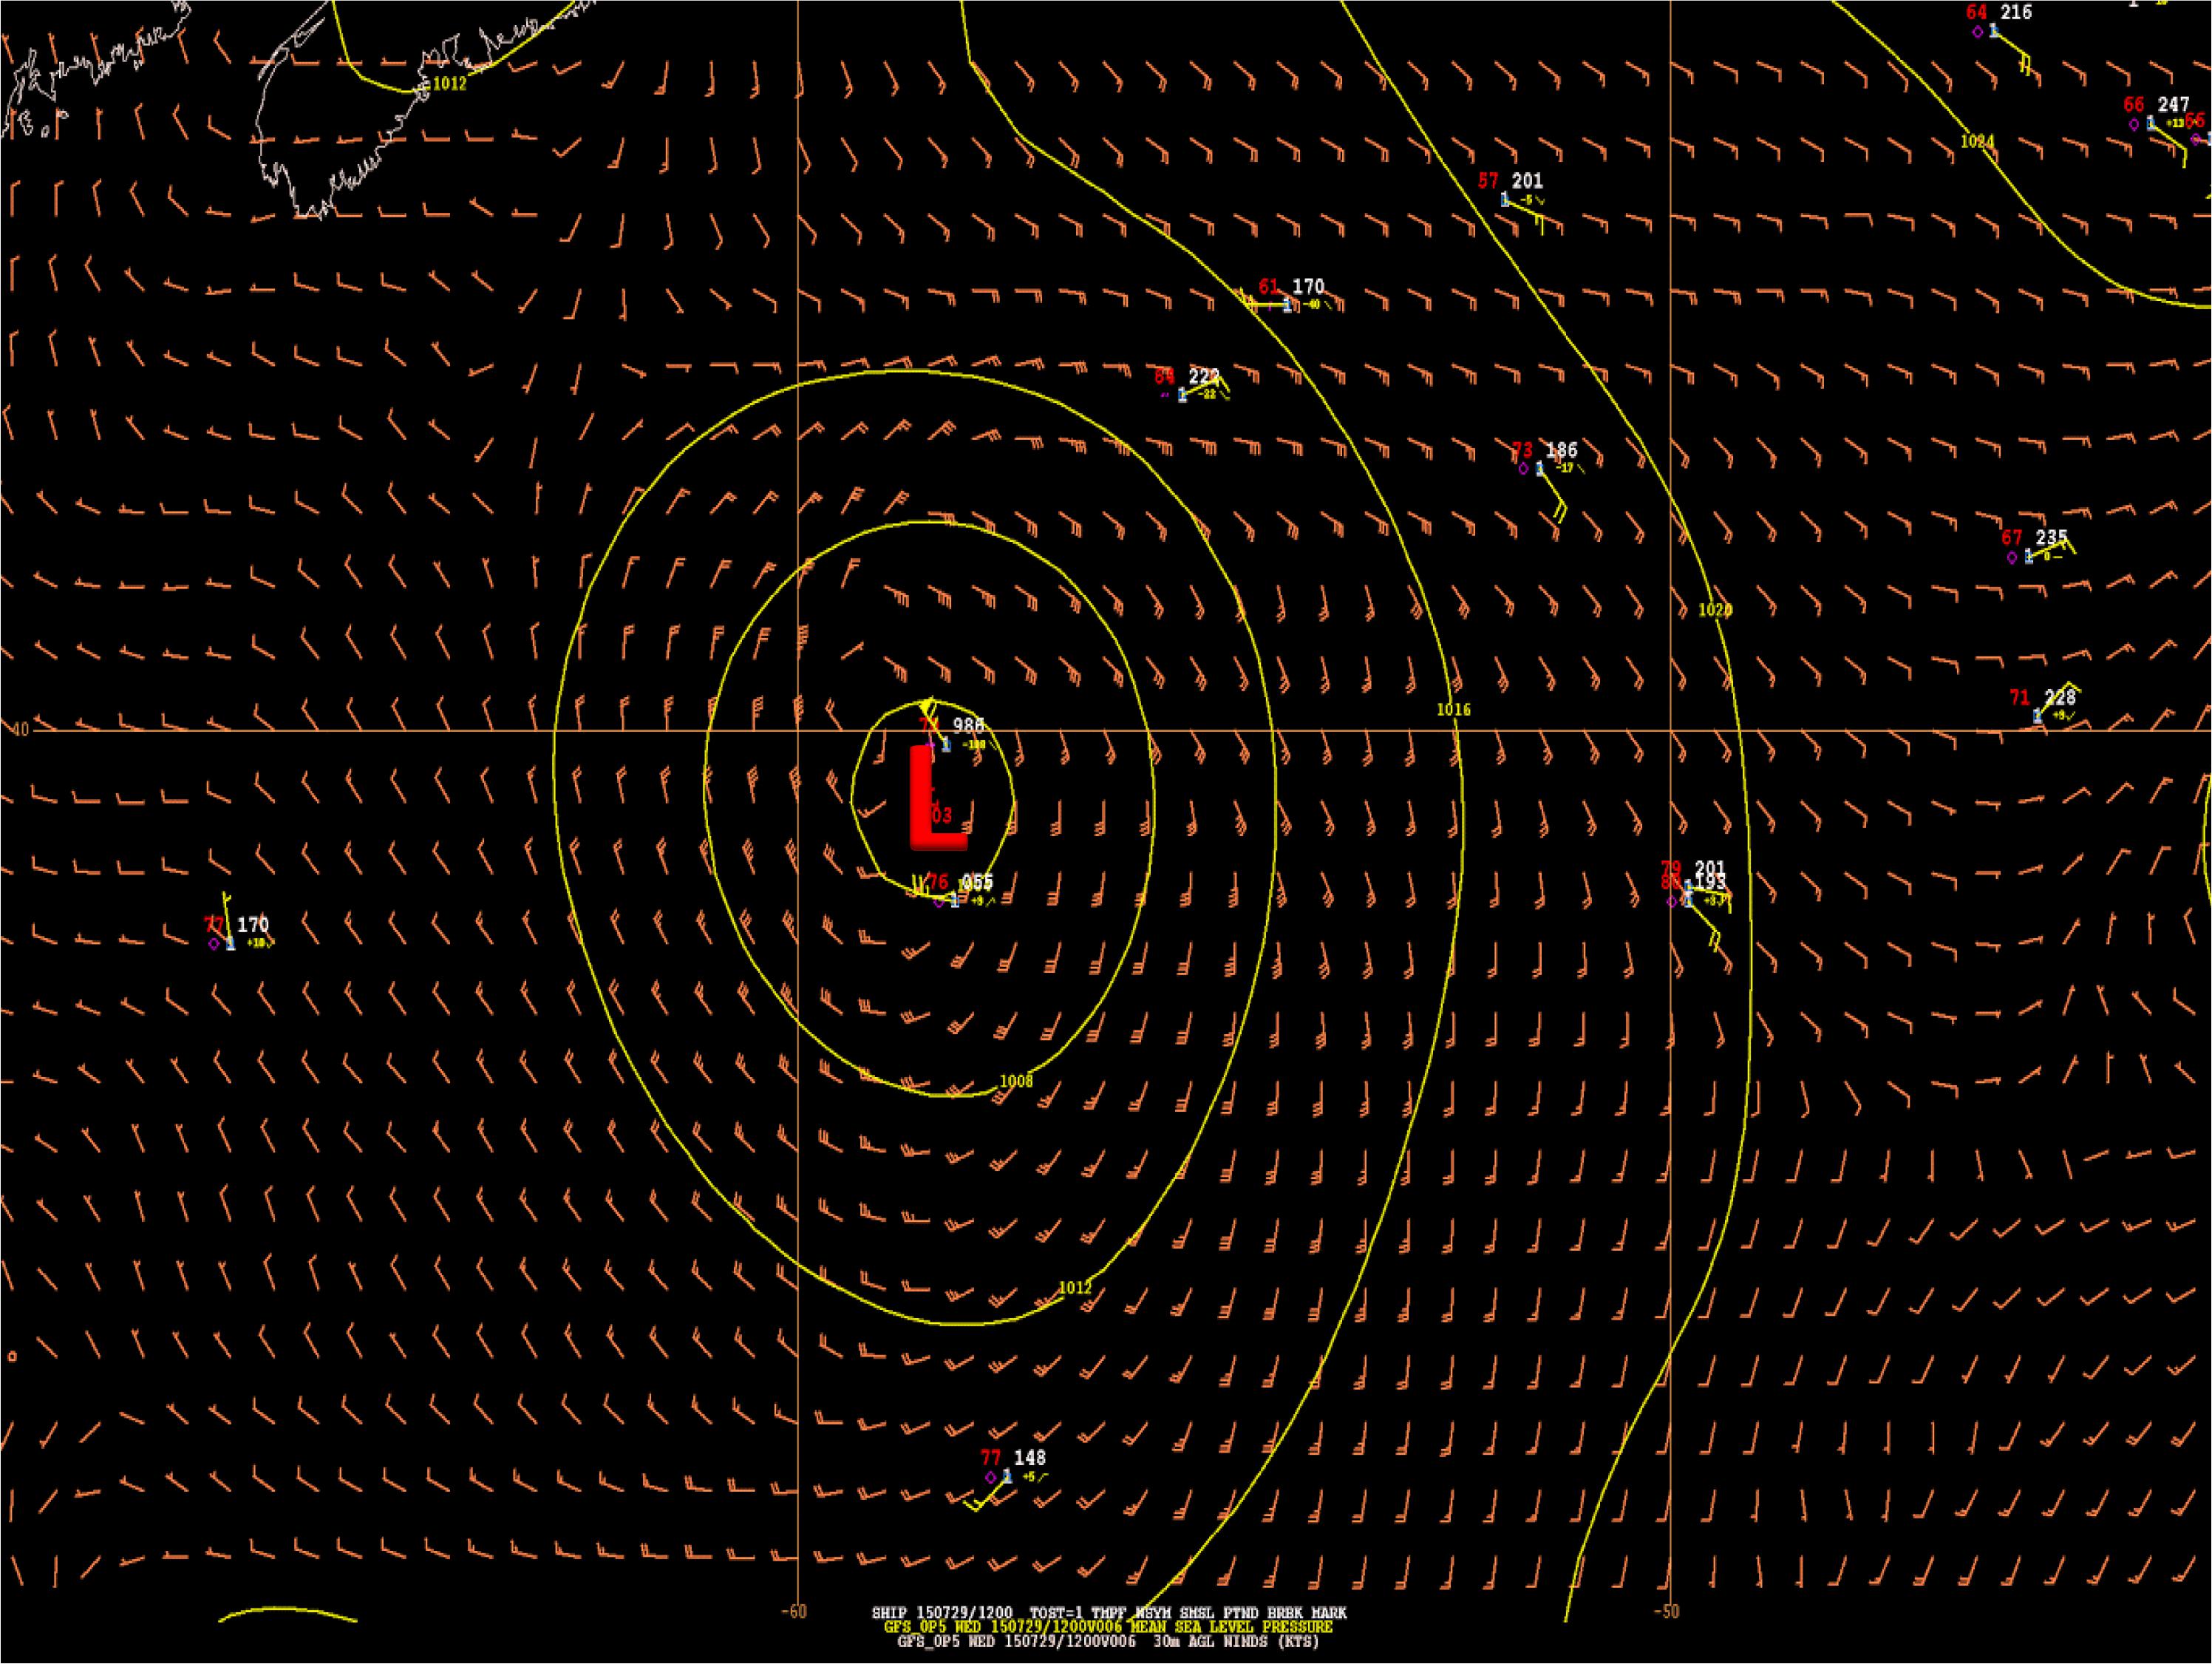
Figure 3. GFS model 29 July 2015 0600 UTC 6-h forecast, valid 1200 UTC 29 July 2015, with available ship observations using standard synoptic station notation. Isobars are drawn with yellow lines, and the model wind field is indicated by wind barbs in orange. The low pressure center is located near 39∘N, 58.5∘W. Courtesy of National Oceanic and Atmospheric Administration, National Weather Service, Ocean Prediction Center.
Ship-based observations transmitted via the GTS are also essential to the growing field of operational oceanography, which provides a basis for our knowledge of the marine environment on timescales sufficient to support Blue Growth applications. Operational short-term ocean prediction systems (e.g., Bell et al., 2015) require both surface and subsurface observations of sea water temperature, salinity, and ocean currents. Ships can provide these observations (Table 1), although SST is the most commonly measured parameter on ships, for direct assimilation or to support satellite product development (see Development and Evaluation of Models and Products) prior to assimilation of satellite products into the model.
Climate Monitoring, Assessments, and Services
Observations from ships are an essential component of the Global Climate Observing System (GCOS) and complement observations from other marine networks (e.g., Argo, drifting buoys, and moorings). The key challenge is that the surface marine climate record is mainly constructed from observations originally collected for other reasons, typically from weather logs that are part of normal ship activities or to support numerical weather prediction. Even among those observations collected for climate applications, the motivation was to establish normal conditions rather than to quantify variability and long-term change. Requirements for the construction of long-term surface marine records are detailed in Kent et al. (2019). Ship observations of ECVs and EOVs (Table 1) are far more valuable for the construction of climate records when they are a multivariate record described by extensive platform and observational metadata, including information related to quality assurance and quality control, uncertainty estimation, and bias adjustment. Routine weather reports from the VOS Scheme contribute to GCOS “comprehensive” global networks (Global Climate Observing System [GCOS], 2016), providing frequent sampling over much of the ocean to capture variability. Research vessel observations are often used in a similar way. Although research vessels are fewer in number, hence covering less of the ocean on any given day, they typically collect observations at higher temporal frequency (sampling rates of 1 min or higher) with sensors that are designed for research-quality observations; thus, they have the potential to be used for evaluation, quantification of uncertainty, and as “baseline” or “reference” observation stations.
Climate services provide climate information to assist decision-making. The sources of information used range from observational data, through model forecasts and hindcasts, to climate projections and socioeconomic data, with timescales ranging from a few days to decades and centuries. Marine climate services include applications in both coastal and open ocean environments, ranging from design criteria for vessels, offshore structures, and coastal defenses to seasonal prediction and forecasting seasonal energy production and demand. Examples of developing climate services can be found through the European Union Copernicus Climate Change Service and the Sectoral Information System (e.g., for global shipping, a demonstration project can be found at https://climate.copernicus.eu/global-shipping-project).
The variables required to develop climate services include, inter alia, the following: air and sea temperature and humidity (e.g., for human safety/comfort operating at sea and seasonal prediction); wind, waves, and pressure (e.g., to establish design criteria and wind/wave loading of structures, coastal inundation, and ship routing); and oceanographic parameters (for seasonal prediction, evaluating ecosystem health, and studying biogeochemical cycles). Historically, ship observations have been the primary source of many of these variables (Table 1) and underpin many of the climate datasets used (e.g., Kent et al., 2019).
More recently, ship observations are used indirectly through assimilation into model forecasts, hindcasts, reanalyses, and resulting databases (e.g., Pilar et al., 2008; Geyer and Rockel, 2013; von Schuckmann et al., 2018) to support climate studies. Models provide a self-consistent and spatiotemporally complete representation of the atmosphere and oceans beyond what can be sampled directly. Ship observations, alongside other ocean, land-based, and satellite observations, are now regularly assimilated into global and regional climate analyses that depict the four-dimensional evolution of our environment. Atmospheric reanalyses (e.g., Gelaro et al., 2017), ocean reanalyses (e.g., Storto et al., 2016), coupled reanalyses (e.g., Saha et al., 2010), and ocean/sea-ice state estimates assimilate observations from various sources into domain models (ocean, land, atmosphere, and ice) used for a range of climate applications. New approaches combining components via coupling are emerging (Laloyaux et al., 2018), while traditional approaches continue to mature. Multivariate climate reanalysis products form the backbone of climate services, describing the past and present states of the climate.
The first use of ship data to describe the steady ocean circulation using different hydrographic datasets and inverse box applications was introduced in the 1970s (Wunsch, 1978). Since then, a great variety of integrated ship data products have been developed, demonstrating the essential role of ship data in producing ocean state estimates, including, but not limited to, circulation, ocean energetics, air–sea exchange, property fluxes, dynamical balances, and ventilation and mixing. For many applications, such gridded information forms the tip of the iceberg of Earth’s environmental digital history, alongside geological and biological datasets (Keim, 2011).
Development of datasets to support climate studies began in 1963 when the international exchange of delayed-mode marine climatological data was put in place through establishment of the WMO Marine Climatological Summaries Scheme. The JCOMM Expert Team on Marine Climatology updated the summaries scheme to facilitate timely exchange, access, and long-term preservation of marine climate data (Pinardi et al., 2019). This new Marine Climate Data System (MCDS), endorsed in 2012 by JCOMM, provides a JCOMM-wide unified approach to data management and higher-quality climate observations. The MCDS is now in the implementation phase and encompasses a data flow structure with defined roles and tasks to be applied to all data types across JCOMM. In 2016, JCOMM confirmed the establishment of the first MCDS Center for Marine Meteorological and Oceanographic Climate Data. Since then, additional centers have been established and the MCDS will be operational by 2020.
Ship data, as in the International Comprehensive Ocean-Atmosphere Data Set (ICOADS; Freeman et al., 2017), are among the most important contributions to reanalyses (Buizza et al., 2018) and for climate studies. The surface marine observational record is almost entirely based on ship observations prior to the 1980s (Freeman et al., 2017) with records for some parameters dating back to approximately 1750 (Table 1). Efforts to extend and enhance the climate data record via data rescue (Brönnimann et al., 2018) are often motivated by the need to improve reanalyses (e.g., Allan et al., 2011). With the top few meters of the ocean containing as much heat as the atmosphere, global SST observations from ships are essential to develop longer reanalyses such as the 20th Century Reanalysis (Compo et al., 2011) or the ERA20C (Poli et al., 2016), which aim to estimate past climate and weather. These reanalyses also assimilate ship surface pressure observations (Figure 4) for a realistic timing of the synoptic events.
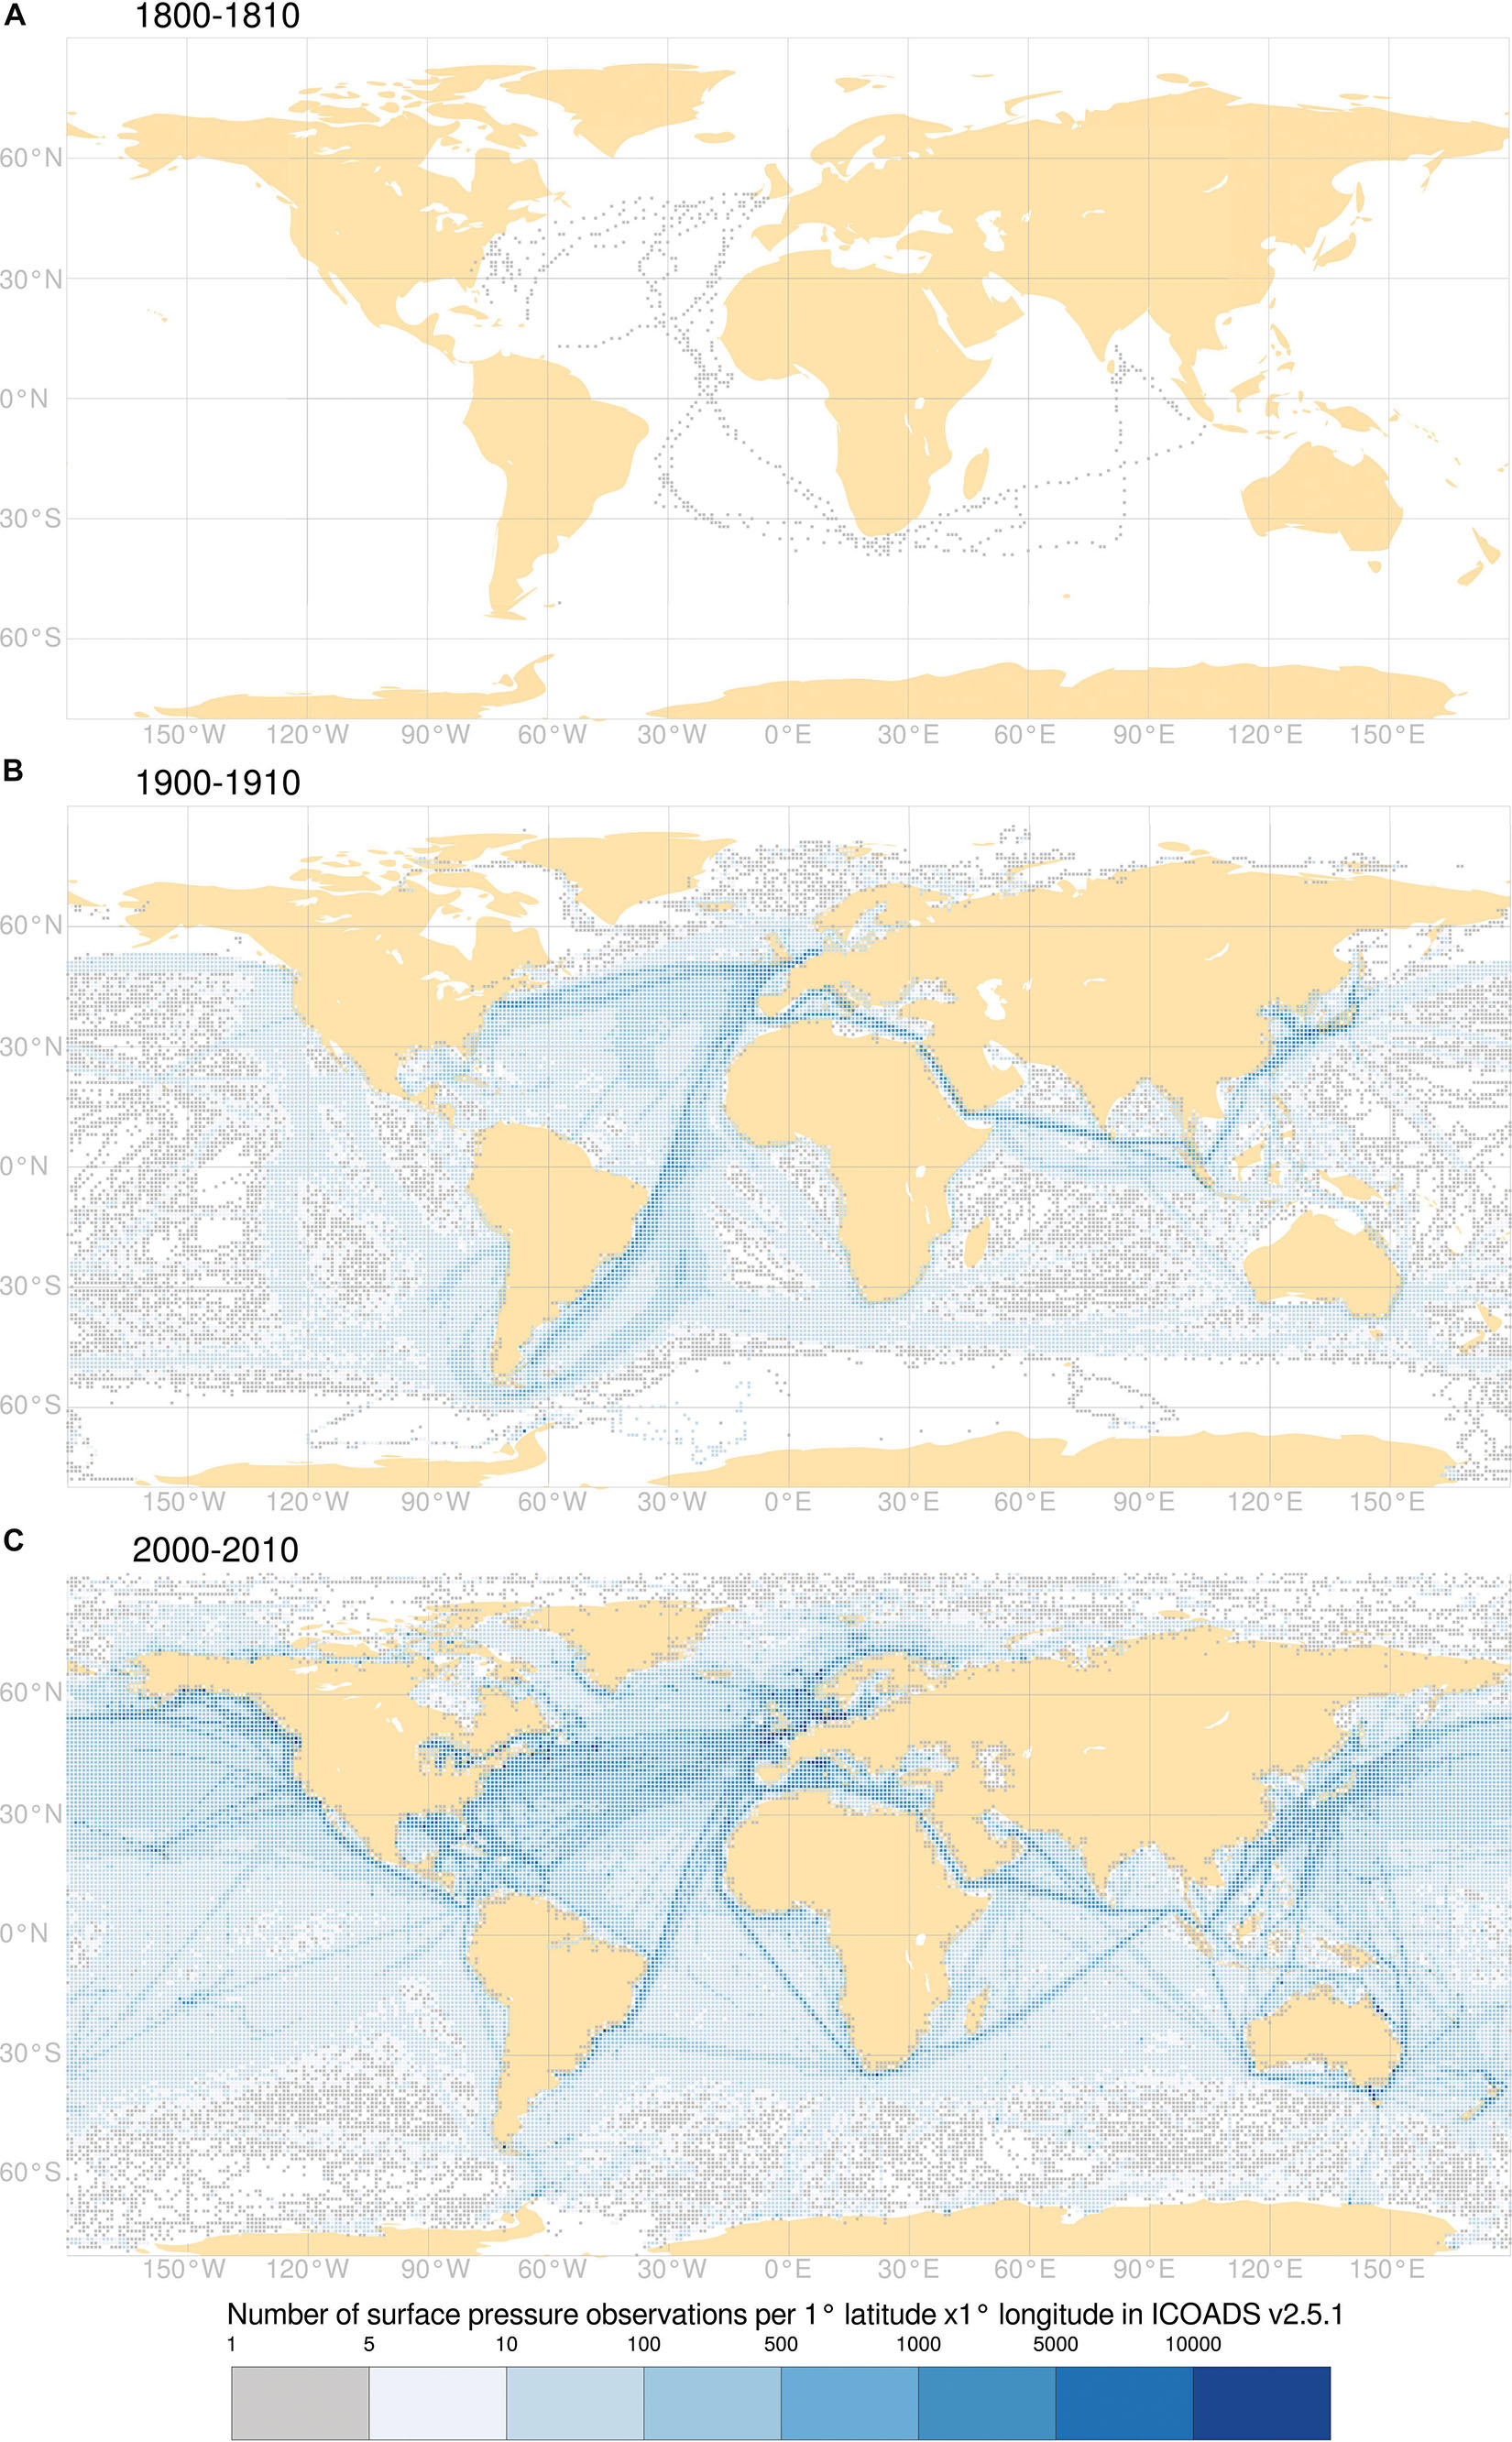
Figure 4. Data counts per 1∘ × 1∘ latitude, longitude of surface pressure observations by ships in ICOADS (version 2.5.1: Woodruff et al., 2011), used by the National Oceanic and Atmospheric Administration and European Centre for Medium-Range Weather Forecasts 20th century reanalyses, for three selected time periods: (A) 1800–1810, (B) 1900–1910, and (C) 2000–2010.
Development and Evaluation of Models and Products
Production of models or data products, for either climate research or operational needs, requires careful assessment of the underlying numerical system or data processing algorithms, evaluation of the model skill and realism, and definition of its application domain (i.e., scales and processes that are resolved by the model or analysis). Ship observations are routinely used in model development studies to demonstrate the system’s stability, identify deficiencies in model physics, and derive new numerical schemes and parameterizations to enhance the system’s overall performance. The majority of model evaluation studies (e.g., Smith et al., 2001, 2016a; Delcroix et al., 2011; Perlwitz et al., 2015; Jones et al., 2016) are completed using historical (delayed-mode) shipboard observations; however, real-time ship observations can be used to validate operational models and near-term forecasts. Another requirement for evaluation studies is for the shipboard observations to be independent of the observations assimilated into the model. For this reason, it is necessary to provide model feedback metadata (ship identifier, vessel type, data quality, etc.) that allow users to select observations that are not assimilated (frequently, these observations are from research vessels and other research platforms that are not routinely transmitted over the GTS). To evaluate fluxes and other derived fields within numerical models, it is essential to have multivariate observations (e.g., winds, SST, air temperature, pressure, and humidity) that are taken simultaneously (or as near as possible to the same time and location). This is one great advantage of ships as an observing platform—they are capable of carrying numerous instrument systems and making simultaneous observations.
Ships also provide observations of SST, waves, sea ice, salinity, chlorophyll concentration, humidity, air temperature, and winds (Table 1), each of which has corresponding remote sensing systems deployed on Earth-orbiting satellites or aircraft. Remote sensing communities rely on surface observations to develop and validate retrieval algorithms used to derive geophysical parameters from the measurements made by remote sensing systems. For example, satellites can measure a backscatter from the ocean surface that is then used to derive wind direction and speed (Naderi et al., 1991) or radiance, which is used to derive air temperature and humidity. Ship-based observations are used to develop and refine these retrieval algorithms (e.g., Benallal et al., 2016; Jackson and Wick, 2016). Satellite-based estimates of chlorophyll concentrations rely on in situ measurements of surface water optical properties to refine and calibrate retrieval algorithms (McClain, 2009; Brewin et al., 2016). In addition, in situ ship measurements are used to validate and evaluate products developed from one or more remote sensing systems (e.g., Bourassa et al., 2003; Liman et al., 2018). The remote sensing community is seeking observations taken at high temporal sampling rates (1 min or less) to support precise collocations with satellite measurements and from a wide range of ocean environments (e.g., tropics to polar regions and light winds to storm conditions) to help constrain the retrieval algorithms and ensure the measurements are accurate across all oceanic and atmospheric conditions. Ships can also measure the multiple, simultaneous parameters needed to adjust observations measured at various sensor heights to a common reference height or depth. The high horizontal resolution of ship measurements also resolves sub-footprint processes, helping to interpret and validate the satellite measurements (e.g., Kolodziejczyk et al., 2015b; Boutin et al., 2018).
Monitoring and Process Studies
Ship-based observations are used for a wide range of activities to monitor the marine environment and to conduct research into the fundamental processes that govern the interactions between the ocean and atmosphere. Observations of air/sea temperature, wind speed, relative humidity, radiation, and the concentration of dissolved gasses are critical in quantifying atmosphere–ocean fluxes of heat, freshwater, momentum, and gasses. Knowledge of these fluxes over the global ocean is important in understanding ocean dynamics, biogeochemical cycling, and the global water cycle. For example, SST, wind velocity, air temperature, and relative humidity are key factors in determining the magnitude and direction of the air–sea fluxes of momentum and latent/sensible heat (e.g., Smith et al., 2016b). Similarly, water temperature, wind speed, and the air–sea difference in the partial pressure of carbon dioxide (ΔpCO2; which is a component of the inorganic carbon ECV) are important factors in determining the air–sea flux of carbon dioxide (CO2; Watson et al., 2009). Ocean acidification is recognized as a major threat to the marine environment and methods for measuring ocean pH directly or indirectly via automated systems are just becoming available for use on ships (e.g., Shangguan et al., 2019). The water cycle drives tropical atmospheric circulation and is therefore a key component of climate and weather. Ship-based observations of salinity and temperature provide in situ data to monitor the water cycle response to increasing global mean temperature (e.g., Terray et al., 2012). On smaller scales, diurnal heating or freshwater input (from precipitation, rivers, or melting ice) can cause a stable density stratification with vertical gradients in temperature and/or salinity over the upper few meters of the ocean (e.g., Tomczak, 1995; Kawai and Wada, 2007). This stratification can affect the air–sea fluxes of heat and moisture, and a better understanding of its formation, evolution, spatiotemporal statistics, and effect on air–sea interaction and satellite remote sensing measurements is needed. The presence of near-surface temperature and salinity gradients (e.g., Reverdin et al., 2013; Anderson and Riser, 2014; Boutin et al., 2018) complicates the comparison between near-surface in situ and skin-layer satellite measurements, which are made at different depths. One way to address this issue is to make simultaneous measurements at multiple depths to characterize the near-surface vertical gradients and hence the in situ–satellite comparisons.
Atmospheric composition and processes over the oceans in general are poorly known. The flow of chemicals from land to ocean and changes in atmospheric composition (e.g., levels of pollution) have been greatly increased by human activity and have the potential to perturb ocean ecosystems. Working Group 38 of the United Nation’s Joint Group of Experts on the Scientific Aspects of Marine Environmental Protection1 and others reveal that atmospheric deposition represents the major route by which nutrients, such as iron and nitrogen, and contaminants, such as cadmium, lead, and copper, reach the open ocean (Duce et al., 1991; Jickells et al., 2017). These substances are removed relatively quickly from the atmosphere, than are less reactive components (e.g., CO2), creating strong concentration gradients over the oceans. Accurate estimates of these atmospheric inputs, via deposition samples, are vital to improve estimates of atmospheric inputs into the ocean (e.g., Baker et al., 2010; Powell et al., 2015) and for prediction of their ecological impacts. In several cases, especially for the trace metals, knowledge of the chemical form of the substance that is deposited is needed, since insoluble forms are typically unavailable to biota. Direct observation of atmospheric deposition chemical composition is therefore essential. Multi-year averaged observation- and model-based estimates of the inputs of these nutrients and contaminants are in good agreement at the ocean basin scale but are more difficult to evaluate at the higher resolutions relevant to ecosystem impacts (Baker et al., 2010, 2013). Improved model flux estimates require improved data on the atmospheric concentrations of these components to test and validate models. A step change in observations of nutrients and contaminants over and into the ocean, ideally using commercial ships, is required if we are to provide reliable estimates of atmospheric deposition at appropriate scales to quantify the impact of these atmospheric fluxes.
Building knowledge of atmospheric composition over the oceans requires a significantly greater number of direct observations. Several Global Atmosphere Watch (GAW) stations (e.g., Mauna Loa, Mace Head, Cape Verde, Cape Grim)2 are able to sample air that arrives from the open ocean, but these observatories are located on land and routinely measure terrestrial signals. Presently, the vast majority of sampling for aerosol composition over the ocean is done from research vessels, with a focus on the Southern Ocean. This allows researchers to develop a better understanding of the composition and chemistry of the marine atmosphere, which is important for climate science because understanding “pristine, pre-industrial-like” environments is needed to reduce climate model uncertainty (Carslaw et al., 2013).
Supporting monitoring of the marine environment and process studies requires measuring or estimating the range of both surface ocean and atmospheric variables simultaneously. Only limited observational platforms are currently able to obtain these measurements, namely, ships (e.g., Berry and Kent, 2011) and surface moorings (e.g., Ogle et al., 2018). Ships also provide a platform to support sensors that require human intervention and monitoring. Additionally, routine underway observations from well-maintained and well-sited sensors on ships can provide information to quantify variability and co-variability of ECVs and EOVs. Improved quantification of short-term variability, including diurnal variations, would enable a more informed comparison of observations separated in space or time or that resolve different spatial or temporal scales.
Present Capabilities and Challenges
Observations
Weather, sea state, and surface ocean observations have been collected and disseminated on a systematic basis for over 200 years (Table 1). Observations from ships are now relayed to shore in real time, providing important information on meteorological conditions at sea, along with a long-term record of observations important for climate applications. Traditionally, observations were made using human-read instrumentation supplemented by visual observations made by officers serving on ships operating worldwide. In recent decades, there has been a substantial shift toward shipboard automatic weather stations and a decline in the visual observations.
The VOS Scheme is the primary source of real-time meteorological observations from ships (Figure 5) and the main source of several ECVs, including air temperature and humidity. Unfortunately, the number of VOSs has declined over the last 30 years. This decline can be attributed to a number of factors, including, but not limited to, (1) successive changes in ships’ ownership and widespread use of flag of convenience; (2) reduction in the number of crew members aboard vessels; (3) concerns of vessel owners and operators, for perceived or actual economic as well as legal reasons, not to provide any meteorological information that could reveal a vessel’s geographical position; (4) ship companies claiming not to be able to take up meteorological tasks due to budgetary constraints; (5) perception that increased satellite and available buoy observations are sufficient and ship observations are not used; and (6) financial strain on NMHSs to recruit and retain vessels in national VOS fleets (JCOMM, 2002; Kent et al., 2010). But while the number of ships has declined, new technologies, such as automatic weather stations and electronic logbooks, have led to an increased number of reports per ship from a smaller VOS fleet, as well as some increase in the quality of observations (Ingleby, 2010). However, fewer ships (typically only 300–400 may be reporting at any given synoptic hour) mean less coverage of the oceans (e.g., Berry and Kent, 2017). The numerical weather prediction need for atmospheric pressure data has led to installation of pressure-only automatic weather stations, and this increase in pressure observations has been offset by a reduction in measurements of other ECVs (e.g., air temperature, humidity, clouds, weather, waves, sea ice, and sea state) required by the marine climate community.
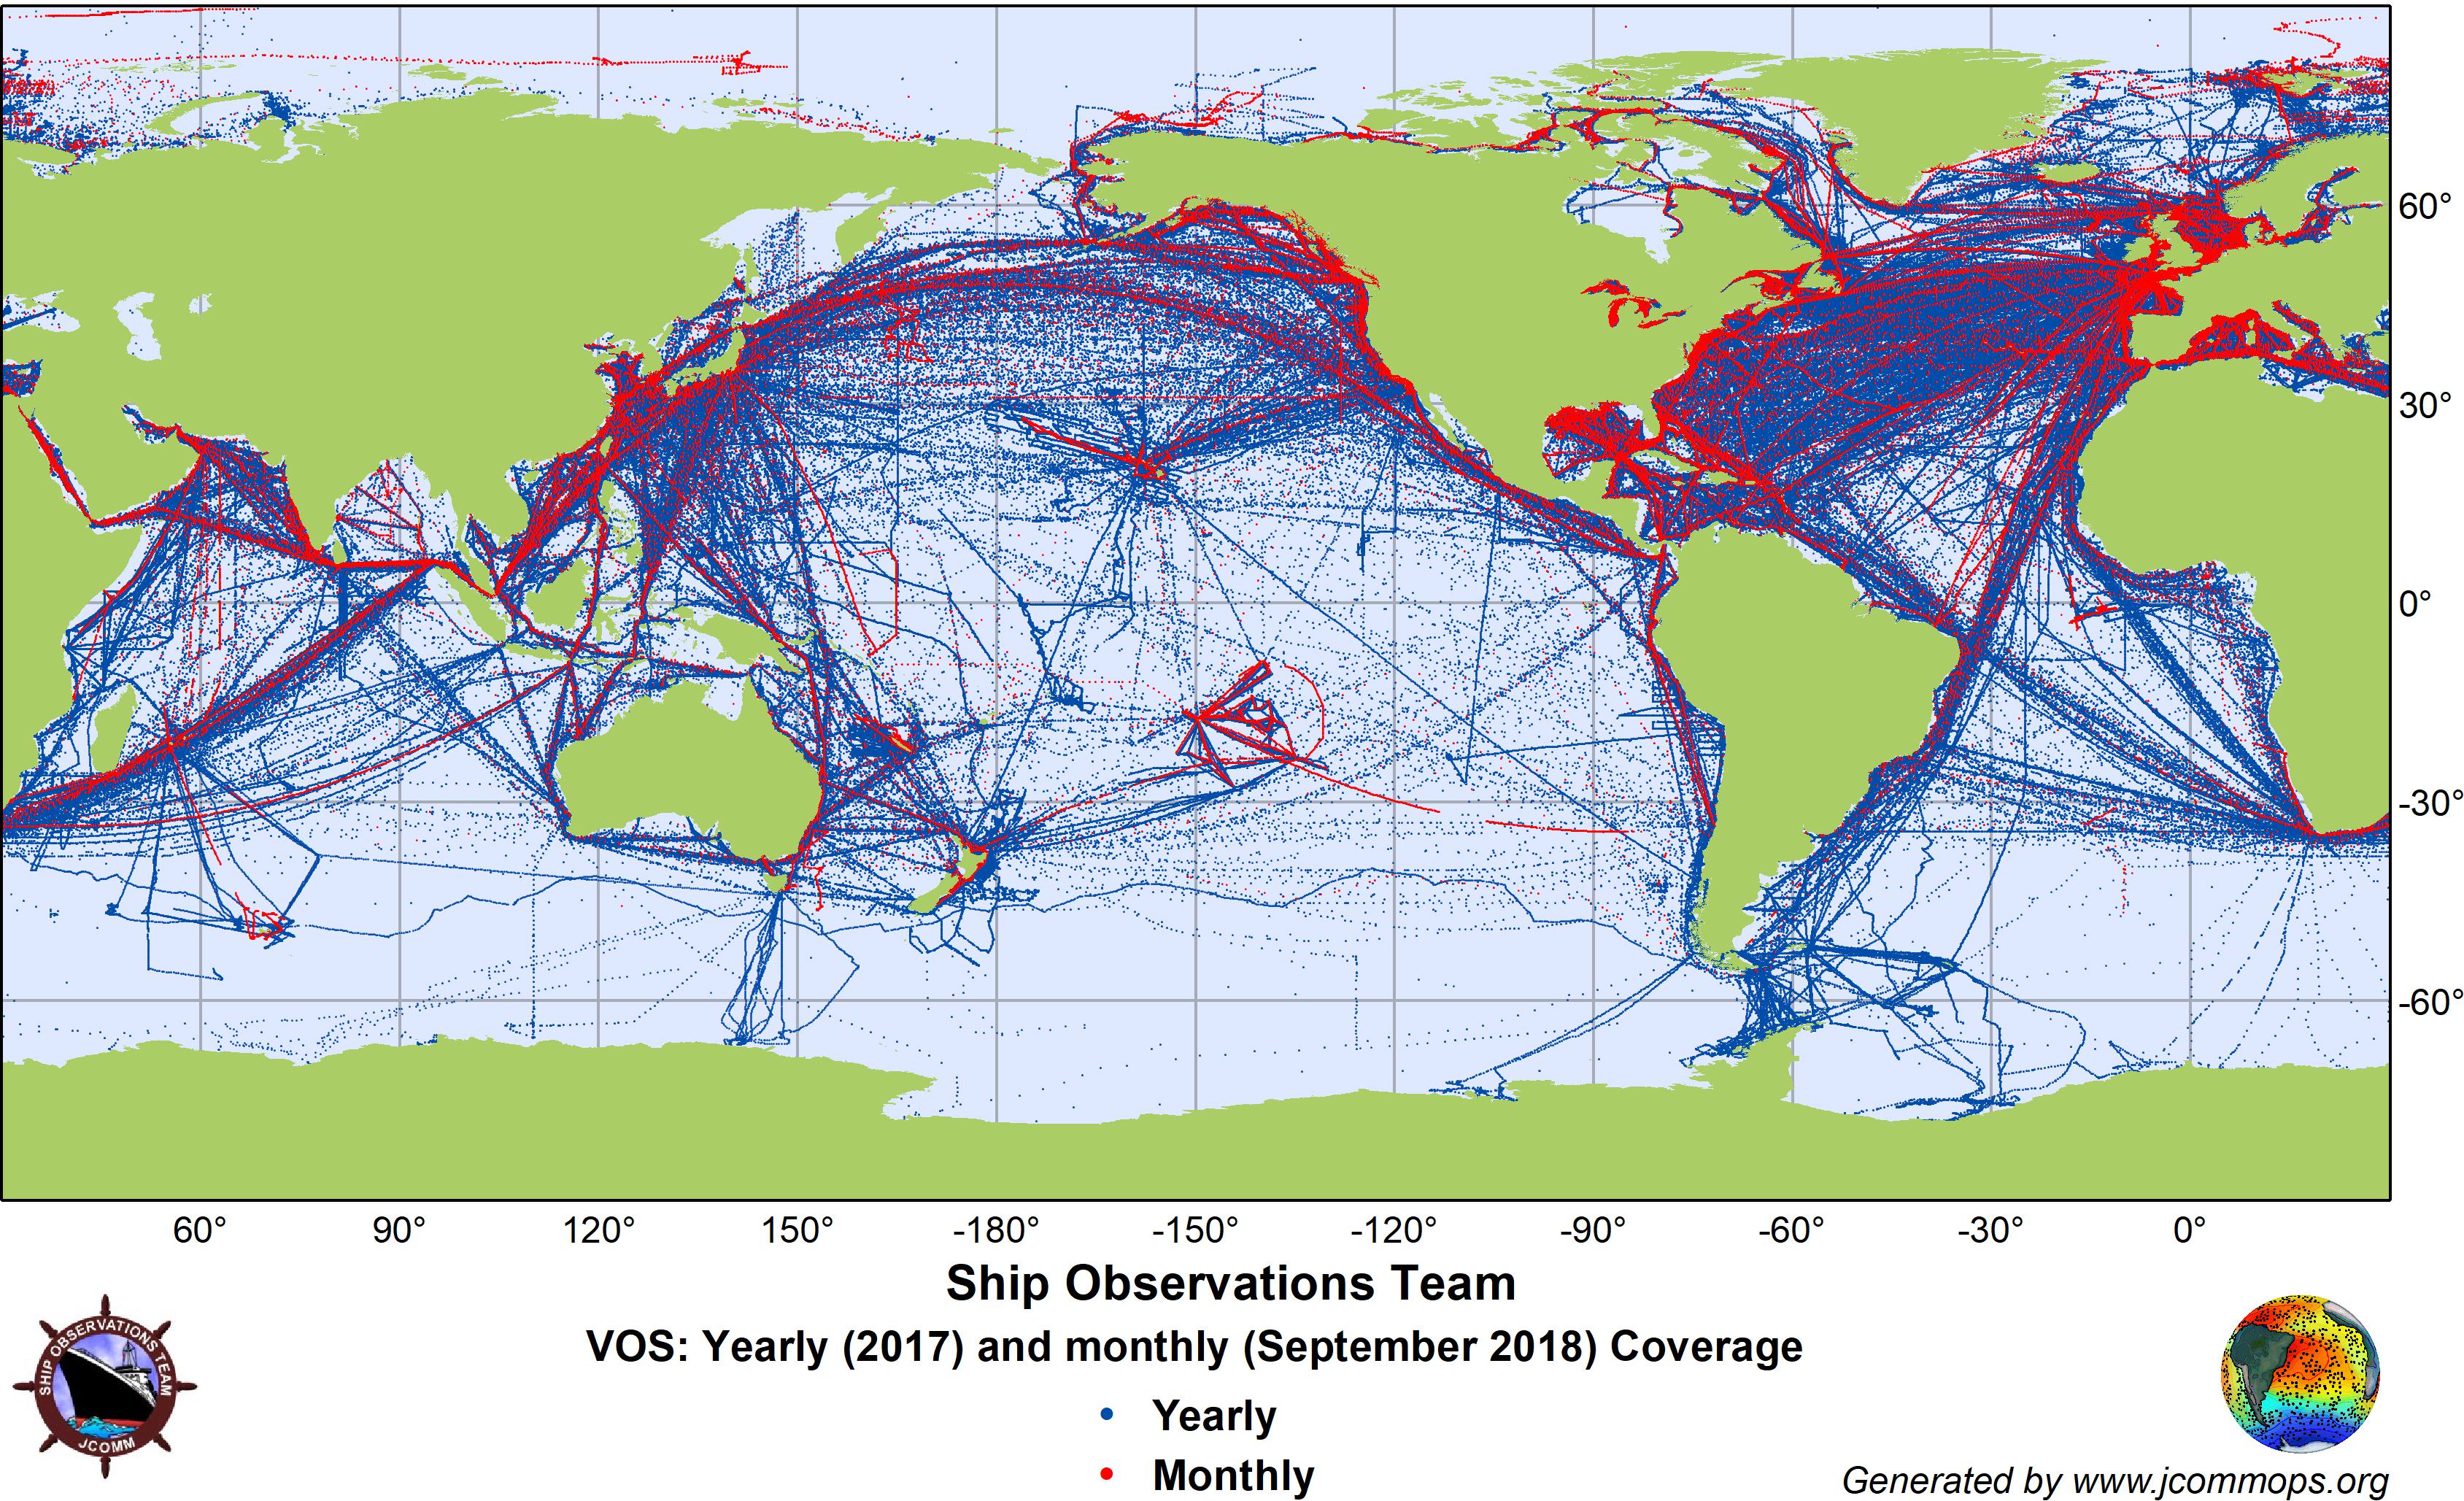
Figure 5. Coverage of the ocean vessels participating in the VOS Scheme (including both character-based and BUFR reports) on monthly (red, September 2018) and yearly (blue, 2017) bases. While approximately 2,000 vessels contributed in total, more than 90% of the data are submitted by fewer than 600 ships.
Increasing satellite communications bandwidth continues to reduce the latency and to increase the volume of real-time VOS data transmissions. The recent introduction of table-driven codes (the Binary Universal Form for the Representation of meteorological data or BUFR) to replace traditional alphanumeric codes (i.e., FM-13 SHIP Code) will help to increase the availability of high-resolution data and more detailed metadata in the coming years. However, the transition to BUFR is ongoing, and challenges remain for real-time data systems relating to varying ship-to-shore data exchange formats, the shore-side conversion to BUFR, and ensuring that all required data and metadata make it from real-time observations into the long-term climate archives (Kent et al., 2019).
Meteorological observations on research vessels include both the standard weather observations made to support the VOS Scheme and also dedicated air–sea interaction experiments that directly measure turbulent exchanges (i.e., momentum, heat, water, gasses, and aerosols; Weller et al., 2008), radiative fluxes (typically in wavelength bands required to measure the upwelling/downwelling thermal infrared flux, solar radiation, and photosynthetically active radiation), precipitation (e.g., Galloway et al., 1983; Klepp, 2015), and atmospheric composition measurements (Baker et al., 2010, 2013). The longest observation-based estimates of surface heat and momentum fluxes are based on ICOADS (da Silva et al., 1994; Berry and Kent, 2011) and currently begin in the middle to late 20th century. Research vessels also measure variables necessary to interpret flux observations and develop parameterizations such as mean conditions (wind speed and direction, air and sea temperatures, humidity, pressure, pCO2, and salinity) and sea-state parameters (such as wave heights, periods, lengths, directions, spectra, and whitecap fraction). Although capability to make comprehensive flux measurements on other types of ships, moored buoys, or autonomous surface vessels is developing rapidly (Cronin et al., 2019; Swart et al., 2019), research vessels will be the primary platform used to evaluate data from these emerging technologies.
Research vessel observations are geolocated via the high-precision navigational systems typically deployed to support research vessel science operations. Research vessels often carry both standard weather instruments of the type supplied to vessels by NMHS to contribute to the VOS Scheme and sophisticated automatic weather stations, which are frequently custom designed and built by individual research vessel operators. Although research vessels may transmit a subset of their observations in real-time via the GTS, most observations are recorded and used in delayed mode, typically as part of an end of cruise dataset. There are no international standards for meteorological parameters to be sampled by research vessels, but since 2005, the U.S.-funded Shipboard Automated Meteorological and Oceanographic System (SAMOS) initiative (Smith et al., 2018) has provided guidance to the research vessel community. SAMOS has developed standard data formats for research vessel ship-to-shore data exchange, distribution, and archival along with training materials for marine technicians on research vessels with regard to sensor selection, siting and exposure, data processing, and quality evaluation.
Most research vessels, selected commercial vessels (e.g., Alory et al., 2015; Gaillard et al., 2015), and more recently racing yachts (e.g., Kramp et al., 2010)3 are equipped with flow-through sea water systems that measure sea temperature and salinity [using a thermosalinograph (TSG)], fluorescence, transmissivity, and other biogeochemical properties (e.g., oxygen, alkalinity, chlorophyll, and carbon). Flow-through water sampling systems on ships typically take water from a single port in the hull at a depth of a few meters. There is large uncertainty on this depth on commercial ships, as it can vary by several meters depending on the ship’s load; moreover, the incoming water can be strongly mixed by the ship’s wake. While these observations are invaluable for gaining information on the temporal variability in the ocean surface, they cannot provide information on vertical gradients of water properties or concentrations. To study vertical gradients in temperature, salinity, gas concentrations, and other properties, the Applied Physics Laboratory at the University of Washington installed through-hull ports for sensors and water sampling at depths of 2 and 3 m (below mean water level) aboard three global-class research vessels (R/V Thomas G. Thompson, R/V Roger Revelle, and Ronald G. Brown; Jessup and Branch, 2008; Asher et al., 2014). When instrumented with salinity sensors (Asher et al., 2014), the data from the instruments in these ports combined with the ship’s own TSG sampling at a depth of 5 m provide profiles of temperature and salinity in the upper ocean. These data have proven valuable in studying diurnal warm layers and rain-formed salinity gradients and could be readily extended to include underway measurement of vertical gradients in alkalinity, partial pressure of carbon dioxide, and biological properties of interest. Additionally, flow water systems can be used to pump water through filters to measure concentrations and conduct analyses of particulate, plankton, or microplastics.
The global network of ship-based TSG measurements (Figure 6) has enormously increased our ability to study variations in ocean salinity. Ongoing projects managing flow-through water data include SAMOS, the U.S. Rolling Deck to Repository4, Global Ocean Surface Underway Data (GOSUD; Kolodziejczyk et al., 2015b), Ferryboxes (Petersen, 2014)5, and the Surface Ocean Carbon Observing NETwork (Wanninkhof, 2019). Although profiles of surface temperature and salinity are available at single points through Argo (Roemmich et al., 2009; Riser et al., 2016), conductivity–temperature–depth (CTD) casts (e.g., Talley et al., 2016), and moorings (McPhaden et al., 1998; Bourlès et al., 2008), only TSGs on ships, drifters, and autonomous surface vessels provide the capability to measure high-horizontal salinity variations in frontal and sub-mesoscale structures (e.g., Kolodziejczyk et al., 2015a). Repeat transects of ships instrumented with TSGs provide long-term salinity time series at relatively low cost (e.g., Alory et al., 2015). Additionally research vessels provide TSG (along with carbon) measurements in ocean regions outside of well-traveled commercial shipping lanes.
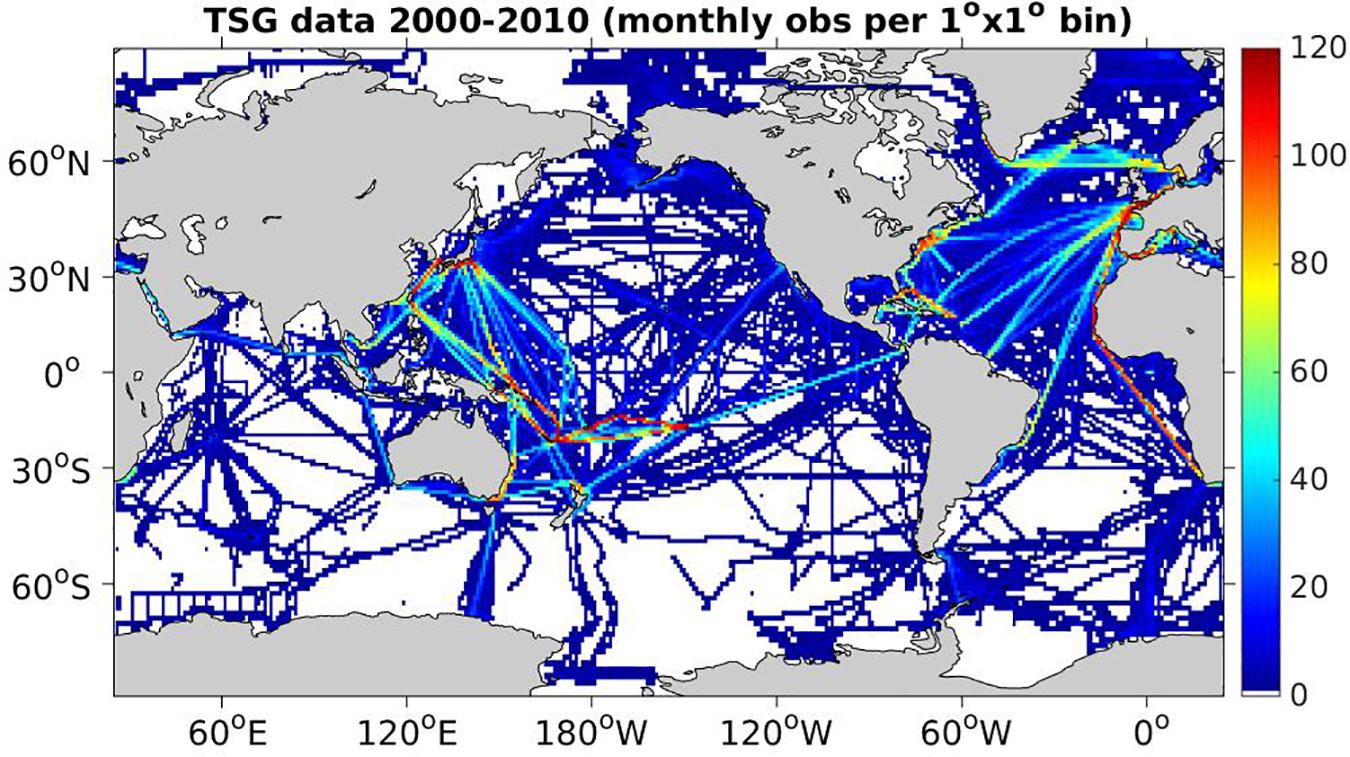
Figure 6. Density map of global real-time and delayed-mode thermosalinograph observations covering 2000–2010 from multiple data sources, including the following: French Sea Surface Salinity Observation Service; GOSUD; SAMOS; National Oceanic and Atmospheric Administration Atlantic Oceanographic and Meteorological Laboratory, Pacific Marine Environmental Laboratory, and National Centers for Environmental Information; Japan Agency for Marine-Earth Science and Technology; Japan National Institute for Environmental Studies; VOS Nippon; Commonwealth Scientific and Industrial Research Organisation; Australian Antarctic Division; and the Alfred Wegener Institute for Polar and Marine Research.
Regardless of the vessel, making continuous SSS measurements poses significant challenges. TSGs on research vessels can be serviced regularly, while those on commercial ships or autonomous surface vessels can only be inspected and serviced during harbor calls. Salinity measurements tend to drift due to sensor fouling in turbid waters or abruptly shift after calls in dirty harbors. Therefore, measurements often need to be calibrated with independent SSS data, from water samples collected onboard and later analyzed, from CTD casts done on the same ship, or from collocated Argo profiles. External temperature sensors cannot always be installed at the water intake, and the temperature measured by the TSG, often located in a hot engine room, is then biased warm. Systems without a flow meter can also have undetected data degradation when flow is insufficient.
The recent advancement of fairly small (∼2–7 m in length) and robust autonomous surface vessels have also provided opportunities for air–sea flux measurements. Miniaturized sensors, improved battery capacity, and energy harvesting techniques (currently limited to using wind, waves, and sunlight) have allowed these robotic platforms to support mainstream ocean observing approaches. Examples include Wave Gliders and Saildrones, but there is an ever-growing number of platforms emerging (e.g., Sailbuoy, Autonaut, Navocean’s Nav2, and C-Enduro). Autonomous surface vessels are proven to work well in a variety of regions ranging from the tropics to the ice-free polar oceans and in extreme conditions such as enduring multi-month missions in the Southern Ocean (e.g., Monteiro et al., 2015; Schmidt et al., 2017; Thomson and Girton, 2017) or transecting through hurricanes (Lenain and Melville, 2014).
Several projects have shown over the last decade that sailing expedition vessels and ocean racing yachts can not only deploy autonomous instruments (drifters and floats) in sea areas with very limited or no other shipping (e.g., Arctic and Antarctic waters) but also directly gather ocean–atmosphere data with innovative underway instrumentation (Choquer, 2014). Such projects are often well covered by the media and thus help in reaching out to a broader public. The emerging data are of sufficient quality for many operational or research applications (Kramp et al., 2010), for example, the validation of SMOS remotely sensed salinity (Salat et al., 2013). The IOC has signed several cooperation agreements, including for the joint organization of the second international ocean research conference6. The sailors are highly motivated and sometimes submit data gathered with their own instruments and at their own satellite cost (Kramp and Rusciano, 2016). Several round-the-world races (Volvo Ocean Race, Barcelona World Race, and Vendée Globe) now comprise corresponding science projects and will thus create valuable time series from particularly the Southern Ocean.
Presently, RVs also provide the primary platform capable of measuring a wide range of chemical and biogeochemical properties and processes within the atmosphere and ocean, including atmospheric deposition of nutrients and contaminants (e.g., Powell et al., 2015) and characterization of atmospheric aerosols in the marine troposphere (Quinn and Bates, 2005). Examples include the collection of wet deposition samples onboard research vessels and the deployment of two dedicated atmospheric sampling laboratories on the research vessel Investigator7, which measure major tropospheric long-lived greenhouse gasses along with carbon monoxide, ozone, radon, and a broad range of aerosol microphysical and chemical properties. The Investigator routinely transits the Southern Ocean, providing atmospheric and oceanic data in a region with minimal anthropogenic influence; however, reliance on research vessels and a limited number of coastal and island stations provides only limited measurements from a small fraction of the oceans. Aerosol sampling (e.g., Martino et al., 2014), sampling for climatologically important trace gasses (Nara et al., 2011, 2014; Yokouchi et al., 2012), and potentially deposition sampling from ships of opportunity is also possible but requires fairly high levels of support from the ship’s crew and operators. Automation may simplify this sampling in the future, and further sampler development (e.g., automated switching of sampling cassettes in the case of aerosol collection) is required to decrease the impact of sampling on shipboard operations.
Although the focus of this paper is primarily on physical and chemical observations, a number of biologically relevant measurements can be made by ships. In addition to sensors in flow water systems that measure pH, transmittance, fluorescence, chlorophyll, oxygen, and inorganic carbon, we note that the Continuous Plankton Recorder (CPR) has been deployed regularly from a select group of commercial ships since the 1930s8, with the initial aim of improving knowledge of zooplankton stocks for fisheries management purposes. The CPR has also delivered an immensely valuable long-term record of ocean biological variability and how marine species respond to climate change (e.g., Beaugrand and Kirby, 2018). However, the nature of the CPR operation is necessarily based on small numbers of ships with subsequent painstaking laboratory analyses of the collected samples and, hence, is rather different to the approach of using a wide range of research, commercial, and private ships discussed herein.
Metadata
Almost as important as the measurements themselves are the associated metadata that provide supporting information about host vessels, instrumentation, and the data. A sophisticated metadata catalog allows for detailed and standardized quality monitoring of individual vessels and instruments, as well as the health of the network of VOS, research vessels, and complementary private and autonomous vessels. WIGOS has developed metadata requirements (WMO, 2017) that are designed to make the observations (e.g., Table 1) useful to downstream users. Mapping community-developed metadata schemas (e.g., VOS, SAMOS, and GOSUD) to identify overlaps and gaps with respect to these requirements is an ongoing challenge.
Information on the ship’s characteristics and meteorological instrument type and siting is also important for climate studies. Different observing methods have different error characteristics, with systematic errors leading to biases in derived climate products if not corrected. When the observing methods change over time, the mean biases also change, leading to artificial signals being introduced into the climate record. For example, the height at which air temperature observations have been made have changed by several tens of meters since the late 1800s. If unaccounted for, this would result in the recent climate warming being underestimated by 0.25∘C over the past 100 years and by 0.1∘C over the past 30 years (Kent et al., 2013). Conversely, if not accounted for, the change from SST measurements made using buckets to engine room intakes would result in an overestimation of the change over the last 100 years (Kent et al., 2017). To account for these changes, metadata are required, such as the height or depth of observation and the measurement method.
Metadata for ships participating in the VOS Scheme are recorded in the WMO Publication No. 47 (Pub 47; Kent et al., 2007). This framework was initially developed by the WMO but is presently managed by a task team of the JCOMM Ship Observation Team. In an effort to modernize and sustain the VOS metadata record and transition from Pub 47 to the WIGOS standard, a new VOS metadata database is being implemented and managed by the JCOMM Observations Programme Support Centre (JCOMMOPS). While Pub47 is an extensive metadata schema, there are only five mandatory metadata fields required to register a ship within the VOS Scheme: recruiting country, callsign, VOS recruitment date, vessel type, and general observing practice. The present challenge is to map all the prior Pub47 metadata fields into the new WIGOS schema and define new metadata fields to support a broader user community while also working with VOS operators to collect and provide a larger number of mandatory metadata fields.
Another metadata challenge arose from an increased sensitivity of vessel owners and operators to the location and identification of their vessels (IDs) being available in near real time. There have been a number of different schemes [callsign masking, use of generic callsigns (e.g., SHIP), callsign encryption, etc.] implemented to accommodate the vessel operators and maintain their contribution to the VOS Scheme. However, these all come with limitations, for both the operational and climate communities. The loss of IDs makes quality control and blacklisting of low-quality data difficult for the operational users. The loss of callsigns makes associating the observations with vessel metadata (e.g., Pub 47) impossible, resulting in lower-quality climate monitoring products. Some attempts have been made to overcome this by expanding the range of metadata in the VOS real-time formats to include those required to fully understand and use the observations, but reporting of the additional metadata has been limited to date.
Parallel to these developments, advancements in Automated Information Systems (AIS) technology largely negate attempts to “hide” ships from unwanted interest. In light of this, JCOMMOPS is implementing a new approach for ship metadata that separates the “ship” metadata from the “observing station” metadata so that no detectable reference to the ship is included with the observation. A master list of all participating ships will be retained by JCOMMOPS to re-associate the ship with the instruments for authorized users. At present, not all countries operating VOS contribute their metadata to the international database. With the global decline in the number of manually observing VOS and the increasing number of automated systems, a fully representative metadata database containing records for all international VOS would improve the capabilities of operational monitoring and therefore maximize data availability for climate and research purposes.
Discovery metadata are required to enable users to find and retrieve the observations. This includes information such as the spatial and temporal coverage of the observations, information on the reported parameters, licensing and usage rights, and how to access and download the data. Historically, this information has been provided through project web pages, but there is an increasing requirement for the metadata to be machine readable and interoperable, driven by, inter alia, the following: the volume and distributed nature of the observations; ease of use and the increasing standardization of data delivery; and the development of web services. This is usually achieved through the publication of discovery metadata records for observation collections based on international standards (e.g., the ISO 19115 standard). Once published through online data catalogs, such as those provided by the IODE Ocean Data Portal9 and the ERDDAP software10, the observation collections are easily locatable and retrievable through a single or limited number of locations. In addition to providing access to observational collections, systems are being developed to provide bespoke access to individual observations (e.g., through the Copernicus Climate Data Store11, systems based on the OGC Web Feature Service interface).
Quality Assurance and Control
Well-documented data quality evaluation and adjustment procedures (e.g., post-deployment calibration) are essential to develop a wide range of products. Quality assurance is more of an end-to-end process where attention is given to all stages of data collection, transmission, processing, and distribution, while quality control focuses more on evaluating the observations relative to some standard of physical reality or plausibility. Quality control is typically done following the data collection and may or may not rely on or be an integral part of the quality assurance for an observing system. Additionally, the level of and approach to quality control depend on the particular purpose and use of the evaluated data. Most real-time quality control focuses on assigning flags to suspect data without removing these values. In contrast, quality control for data assimilation typically rejects suspect data or even blacklists entire data records, based on lack of agreement with the data assimilation assumptions. Finally, quality evaluation to create research data products, including the use of visual quality control, can result in a combination of value rejection and value flagging.
Real-time quality control is frequently done by NMHS and other centers to meet operational mission requirements and tends to be limited to basic quality tests (e.g., range checks, consistency, and validity of position data). The SAMOS initiative provides an example of a fully automated real-time quality control with the data processing being completed within a minute of data being received (Smith et al., 2018). Real-time quality control associated with the data assimilation process for numerical weather prediction or other operational modeling (e.g., Cummings, 2011) is basically a “buddy check” whereby the individual observations typically are compared to the first guess model fields and accepted or rejected according to tolerances set for the assimilation process.
Alternatively, a number of projects and centers [e.g., GOSUD; Kolodziejczyk et al., 2015b, SAMOS; Smith et al., 2018, Surface Ocean CO2 Atlas (SOCAT); Pfeil et al., 2013, Global Ocean Data Analysis Project (GLODAP); Olsen et al., 2016, MCDS, World Ocean Database12 ] focus on developing research products using delayed-mode quality evaluation, each using techniques that are specialized to their area of scientific expertise. For example, data from flow-through systems, for which fouling can induce sensor drift, typically undergo preliminary automatic quality tests but often require manual evaluation from science area experts to ensure the highest data quality. For time series adjustment, pre-calibration/post-calibration data can be used along with comparison with discrete samples or collocated data. The best practice for research product development is to employ a quality control system that only applies flags to data values and does not remove the values—decisions to accept or reject data failing quality control tests are left up to the data user. Furthermore, the best practice includes checking the consistency of the quality control and adjustment from different groups that produce delayed-mode ship data. Indeed, post-calibration or co-located measurements are not systematically available; thus, quality control and correction decisions need to be checked and discussed to provide the highest data quality for climate.
In performing observations, the traceability to the common standards also plays an important role. Such traceability especially for the measurement of the same qualities ensures that the biases are minimized and the data from different platforms can be used together (e.g., in the data assimilation systems). In the case of the physical measurements, the traceability is usually established to the international system of units through the initial calibration of equipment versus standards supported by the National Metrology Institutes. In the cases of the chemical or biological measurements, the primary standards and the measurement traceability are established by the relevant networks.
If data are accompanied by estimates of their uncertainty, this is extremely beneficial for users, allowing a simple assessment of whether the data quality meets the requirements for their application. In practice, the assignment of uncertainty estimates is challenging, and this is typically done by expert users rather than by data providers. In some cases, biases in the observations can be identified and quantified, adjustments applied, and the uncertainty in that adjustment estimated (Kent et al., 2019). The quality of the adjustment for bias and the estimation of uncertainty in observations are dependent on the availability of observational metadata (providing information on instruments, observing protocols, etc.), on information on data management practices (e.g., data precision and any conversions or calibrations applied), and, in some cases, on knowledge of the ambient environmental conditions (Kent et al., 2019).
An alternative to the provision of uncertainty estimates is an end-to-end quality assessment, which is much more challenging than quality control completed following data collection as described above. The GAW atmospheric composition monitoring program is one example of a quality assessment approach that ensures all its observing sites are comparable. This is essential to produce globally consistent datasets. GAW mandates the use of a primary standard for most parameters to define a measurement scale. The scale is maintained by a single institution and propagated to all other members of the program in a traceable manner. Clear data quality objectives have been articulated, and these are supported by measurement guidelines developed by the community of researchers. Detailed logbooks and metadata are required to be maintained, along with a commitment to submit data to the World Data Centers in a timely manner. Audits and inter-comparison programs are routine. Participating institutions are encouraged to deliver measurements with uncertainty within agreed limits.
The atmospheric laboratories on the research vessel Investigator have opted to adhere to the quality assessment guidelines of the GAW program, making it the first mobile GAW station. Personnel for the research vessel Investigator have committed to the GAW quality assessment principles for a suite of ship-borne measurements. This includes regular maintenance of all instrumentation, routine calibration and quality control, annual delivery of data to the relevant World Data Centers (with a view to [near] real-time delivery in future), and provision of appropriate filter methods to remove local pollution (e.g., ship exhaust).
Vision for the Next Decade
An efficient shipboard observational network needs to include ships from commercial, private, and research fleets with sufficient operational flexibility to take advantage of continued advances in technology and communications. Many industries (e.g., cruise lines, ferries, fisheries, energy, and transportation) operate thousands of ships that could contribute to cost-effectively collecting data (Holthus, 2018). A comprehensive structure and process is needed to connect these industries with the scientific data collection community to expand the spatial and temporal extent of observations. Vessel owners and operators are often interested in the health of the oceans and seek opportunities to make measurements to support marine operational and research activities (e.g., Watson et al., 2009; Nara et al., 2011). These communities need a mechanism to register their instrumentation and provide observations to the community with both real-time or delayed-mode options. For research vessels, the challenges are less in making the observations but more focused on the coordination of observations between nations, standardizing observational methods and quality assessment/control, and ensuring consistent data management.
Over the next decade, the international community needs to focus on a unified program of marine observations from crewed ships and autonomous surface vessels. Challenges to be addressed include (1) recruiting additional vessels to improve both spatial and temporal sampling of the parameters outlined in Table 1, (2) conducting multivariate sampling on ships, (3) raising the technology readiness level of automated sensors for autonomous shipboard observation and ship-to-shore data communications, (4) advancing quality evaluation of observations, (5) and developing a unified data management approach for shipboard observations and metadata that meet the needs of a diverse user community. Given the diversity of operational and research applications (see Community Requirements), there is no ideal sampling scheme for near-surface marine observations from ships, but the need for additional sampling over the global oceans to increase measurements of parameters listed in Table 1 is recognized. More vessels are needed to increase sampling in remote oceans (e.g., polar seas, South Atlantic, and the Pacific), to increase the frequency of observations (more per day) even along well-traveled shipping lanes, and to measure multiple parameters simultaneously on a single ship.
Vessel Recruitment
The decline in ships contributing to the VOS Scheme and the impact this has on both operational forecasts/warnings and climate studies are described above. Recruiting additional ships to contribute to the VOS Schema and make other atmospheric and oceanic observations requires communication with the ocean industries that operate ships across the global ocean. The first recommendation to recruit additional vessels is for users of shipboard observations to create a list of the instruments they wish to see deployed on ships that will meet their needs to measure the parameters in Table 1. Once developed, this list can be used to approach owners/operators to determine what level of instrumentation they are willing to host on their ships. It is anticipated that partnerships will be needed between NMHS, World Ocean Council (WOC), the research community, and individual vessel owner/operators to deploy a combination of instrumentation on each vessel (see Coordinating Vessel Recruitment). Better coordination between the observational programs is essential for unified requests (i.e., not from multiple individual researchers or operational groups) to be made to the vessel owner/operators to ensure that requests do not adversely impact the core mission of the vessels. The WOC is one option to address these coordination needs.
Despite the diverse observing capabilities of research vessels, they are an underutilized component of the observing network. A concerted effort is needed to coordinate marine observations from research vessels. Firstly, we recommend all research vessels to be recruited into the VOS Scheme, have their metadata documented by JCOMMOPS, and be provided with tools to submit data via the GTS. Ensuring research vessel data acquisition systems are compatible with existing (e.g., TurboWin) or new VOS reporting software will increase research vessel capabilities to provide real-time observations. The authors further recommend engaging the research vessel operator community in a dialogue to (a) determine which research vessels routinely operate in high-priority ocean regions, (b) support installation of multiple sensor packages on research vessels in these regions, and (c) maximize data collection by ensuring that all sensor packages on each research vessel are operating on every voyage. The Arctic Research Icebreakers Consortium13 program provides an example of how countries are working to coordinate research vessels for data collection, and interaction with the commercial fleets via the WOC.
Additional ships are needed to collect observations to estimate air–sea fluxes by installing sensors and undertaking further automated approaches to collect the full suite of observations required. This is particularly true in regions where we currently have few observations and large uncertainties (e.g., the Southern Ocean, Swart et al., 2019; Western Boundary Currents, Bentamy et al., 2017) and yet where there is growing ship activity via research, tourist, or other ships. We recommend enhancing current capability for direct flux measurements from research vessels and ensuring that high temporal resolution underway observations from all research vessels and a subset of commercial ships are routinely collected and managed in a SAMOS-type data system, including real-time transmission if needs are identified. These enhancements will help identify biases and improve data quality. Direct flux measurements will always be sparse, so meeting required accuracy targets for regional and global fluxes (Cronin et al., 2019) requires expanding our knowledge of near-surface atmospheric and oceanic states and improvements to parameterizations of air–sea exchange. Ship and potentially autonomous surface vessel observations can provide direct measurements of fluxes and the observations required to calculate fluxes via bulk methods to enable improvements to flux parameterizations and uncertainty characterization.
Since NMHS and the research community do not have adequate resources to deploy instrumentation on all the ships they may be able to recruit, it is essential for the marine community to develop a method for vessel operators to provide weather, ocean, and other measurements using instrumentation purchased and deployed by the owner/operator. Such “third party” data collection can be facilitated through a crowd-sourced data collection approach, which have been widely successful in other communities. Examples include the Community Collaborative Rain, Hail and Snow Network14, and Weather Underground’s Personal Weather Station Network15. Several user communities (e.g., satellite product developers and numerical modelers) acknowledge the value of observations from third-party platforms, provided that the platform metadata are sufficient to allow these users to conduct quality evaluation necessary for their application. In some cases, this may result in rejection of these records based on comparison with model first guess fields or neighboring ship, mooring, or other observations with a known quality. The authors recommend establishing a pilot project, possibly in partnership with JCOMM, to develop a web portal to support third-party data collection. Such a portal would support registration of the vessel, collecting minimum vessel and instrumental metadata, and submission of their observations. Promotion of third-party ship observations may be achieved via international organizations (e.g., WOC and JCOMM), ship owners’ associations, maritime exchanges, marine training institutes, mariners’ or shipmasters’ associations, and outreach to yacht and pleasure craft owners.
Multivariate Shipboard Observations
As platforms with ample space and power, along with the presence of human resources, ships are ideally suited for multivariate observations. Achieving the goals outlined by the broad community of shipboard data users requires collaboration between existing international research and operational activities to build a program to measure multiple parameters across a network of ships. Many users need co-located observations to address their operational and scientific goals. For example, the heights at which observations of the marine air temperature, humidity, and wind speed are made vary, which means that applications such as satellite calibration and evaluation require adjusting data to a common reference height. This requires co-located measurements of these parameters be combined with accurate metadata on observing heights. Furthermore, many users calculate fluxes of heat, moisture, momentum, carbon, and other quantities using shipboard observations (e.g., Smith et al., 2016b). Accurate flux estimation requires co-located measurements of winds, air and sea temperature, humidity, pressure, salinity, and other quantities (e.g., pCO2 and chemical properties). Temperature and salinity must always be measured on platforms where alkalinity and pCO2 are measured, as this allows improved empirical relationships for calculating the latter from the former that are more widely available (e.g., Lee et al., 2006; Bonou et al., 2016). To maximize efficiency by which observations are made, the authors recommend that multiple sensor systems be deployed on individual ships and every effort should be made to ensure all systems are operating and transmitting data on every voyage. As described in the “Quality Assurance and Control” section, the estimation of data uncertainty is often improved by the availability of co-located observations providing information on the ambient conditions.
Technological Advancement
Over the next decade, there is a need for additional investment to advance the technological readiness level of instrumentation and sensors, increase the capabilities of ship-to-shore communications, and enhance the design of new vessels to support marine observations.
Although autonomous sensors are becoming more common on all types of vessels, many technologies need improvement to expand autonomous marine measurements, as ships offer a cost-effective way to vastly increase data collection. Examples include automated atmospheric aerosol samplers (Sholkovitz and Sedwick, 2006) that could provide routine estimates of biogeochemical fluxes; sensors to measure cloud parameters, precipitation, and visibility; and automated sensors for carbon cycle parameters of high enough quality to be comparable with manual analytical instrumentation. Some land-based sensors for these measurements exist but are typically too costly and not sufficiently robust to be routinely deployed on ships. The authors recommend additional investment into autonomous sensors for shipboard use. We also recommend using research vessels as well-established labs for testing new sensors prior to their wider deployment on commercial and private ships. Any such effort will require partnerships with sensor manufacturers to leverage their design and engineering experience and also to allow scientists to inform the design to ensure that all essential data and metadata are correctly encoded into sensor data records. As a community, we should be moving away from the days when data and metadata (e.g., calibration factors and units) are provided separately from the data values—they should be provided simultaneously by “smart sensors” in any electronic data records using community-developed methodology (e.g., SensorML16 ; Aloisio et al., 2006).
In addition to new sensor development, existing technologies should be further exploited. For example, the AIS may be used to increase the availability of observations globally. AIS is a maritime navigation safety communications system standardized by the International Telecommunication Union and adopted by the IMO that provides vessel information (i.e., identity, type, position, course, speed, navigational status, and other safety-related information) automatically to appropriately equipped shore stations, other ships, and aircraft. Its primary use is as a navigation tool for collision avoidance; however, a promising methodology has been recently developed to estimate surface currents from AIS navigation data (Guichoux et al., 2016), potentially in real time, as an updated version of historical ship drift data (e.g., Richardson and Walsh, 1986). Services like AIS can also be used to transmit Application Specific Messages17. The Environmental Application Specific Messages can be incorporated into AIS messages and has great potential to transmit meteorological and oceanographic information from automated sensors. For example, pressure is variable from which other parameters could be derived to assist in improved weather forecasts and warnings over the high seas. From pressure, conceivably one could generate better model wind information that, in turn, could generate better model wave information. The potential of AIS technologies to increase ship observations can be estimated by viewing the hundreds of millions of ship locations from 2012 displayed at https://www.shipmap.org/.
As data volumes from autonomous sensor technology grow, continued development of ship-to-shore communications technology is needed. The obvious first step is to continue to increase the bandwidth of satellite broadband technology; however, collaboration with telecommunications companies is needed to develop reasonable cost models for these transmissions, including two-way communication. Much like space agencies communicate with satellites, shore-side personnel should be able to monitor shipboard sensor performance at sea, to provide updates to software/firmware, and to alter the sampling characteristic of the sensors as needed. To achieve further mutual benefit, the communities active in shipboard and autonomous surface vessel observations need to jointly develop and advance two-way communications.
Needs for marine observing should be built into new vessel design (Rossby, 2011), as this would simplify the installation of scientific instrumentation and ensure more consistent data quality when sensors are moved from vessel to vessel. For commercial ships, the focus should be on providing a dedicated water intake and location to install flow-through systems, together with cable and tubing routes (e.g., to the bridge level for satellite communication instrumentation and atmospheric gas sensors). On research vessels, designs should also include well-stabilized forward masts to support meteorological and air–sea flux sensors. Several examples of these designs have been implemented on recently constructed research vessels (e.g., Sikuliaq and RRS Sir David Attenborough). Whenever possible, all vessels should also undergo both atmospheric and oceanic flow modeling during the design phase, and these results should be made available to the user community. Finally, when vessel designs cannot be changed, the alternative is developing new sensor technology that can easily be fitted onto any vessel (e.g., magnetic sensor packages for deployment on ship hulls).
Evaluating Data Quality
All observations need to undergo timely, standardized quality control procedures established by the wider community of data managers to identify gross errors (e.g., check data within defined ranges, time and location, and climatological test). Near-real-time quality control should take advantage of collocated measurements from other marine networks (e.g., ships versus Argo) and be optimized by retrospective comparison with more refined delayed-mode processing (e.g., Alory et al., 2015). Coordination is needed between the different components of the marine observational community (e.g., meteorological, oceanic, and biogeochemical observations) working toward standard approaches to evaluate the data.
Ideally quality control activities are conducted by scientific experts using community-developed, accepted, and shared tools. Programs like SAMOS, GOSUD, ICOADS, SOCAT, GLODAP, Copernicus, and others have developed quality control software and tools specific to a type of ship (commercial versus research vessel) and various parameters. Many of these systems are highly customized, making them difficult to disseminate to the wider observational community, but these tools should be harmonized and open-source code made available. The authors recommend organizing an international working group to focus on developing and distributing quality control tools. Such an effort may be coordinated by the MCDS or JCOMM or via workshops to include the diverse research communities that conduct much of the not presently “operational” marine observing from ships.
A further challenge is to identify some shipboard observations to serve as “reference” stations similar to what is being done in the land-surface community (e.g., Thorne et al., 2018). Most likely, these would be research vessels, but they should adhere to the highest standard for quality assessment/control. Presently, no standards for shipboard reference stations exist, but lessons can be learned from GAW program or the definition of core voyages in GLODAP (Olsen et al., 2016). We recommend identifying a set of vessel operators willing to work toward developing and supporting a standard to be known as a mobile reference station. Ideally, these vessels would host as many data systems as possible, meeting the multivariate observing goal outlined in the “Multi-Variate Shipboard Observations” section.
Data Management
Operational data need to be made available as soon as possible after transmission from the ship to shore. For synoptic meteorological data, procedures are well established to push observations onto the GTS; however, for a number of oceanographic and biogeochemical parameters, especially those made on research vessels, the procedures for real-time data dissemination are not as clearly defined. Over the next decade, there is a need for the meteorological, oceanographic, and biogeochemical observing communities to come together to establish protocols for real-time transmission of at least a subset of the parameters in Table 1. Further efforts will be needed to manage full-temporal resolution observations that are collected from vessels post voyage (in delayed mode).
It is important to recognize that data collected for operational purposes also serve a wide range of climate applications. For example, the National Centers for Environmental Information currently combines two GTS data streams to create monthly updates of ICOADS (Freeman et al., 2017). Creating such interim products supports climate assessment and monitoring. Identifying duplicate and near-duplicate reports can be difficult, especially if ship identifiers have been masked. Data derived from the GTS are periodically combined with data from delayed-mode data systems in major ICOADS updates, again with challenges for identifying duplicate reports received from different data management systems.
For the climate record, it is sometimes the case that only a real-time observation exists, and there is no corresponding delayed-mode source. We recommend preserving all metadata included with BUFR or earlier fixed character-based messages. With the current transition to BUFR, more metadata can be made available alongside the observed data, which should eventually remove the need for the VOS delayed-mode data system. While metadata fields available in BUFR are much more expansive than those in past formats, encoding of metadata into the BUFR records may not be complete, depending on the network owner responsible for providing this information; so a central metadata repository, such as that provided by JCOMMOPS, is still required to maintain historical vessel/platform metadata and lineage.
GTS collections at different NMHS may vary in their contents (JCOMM, 2010), and in some cases, data are circulating on the GTS with a low level of metadata (a situation that will significantly improve when the BUFR format is fully adopted). To facilitate capturing the full range of observations on the GTS, the authors recommend establishing a real-time GTS data assembly center within the JCOMM MCDS to harvest and manage all ship observations circulating on the GTS. This center could accept data received from the GTS by multiple NMHS, conduct duplicate evaluation, and provide these observations to downstream users and product developers. The result would be a consolidated source for real-time GTS data with agreed quality control that could be aggregated to climate datasets such as ICOADS or the World Ocean Database, providing full provenance from instruments to archives/products as intended by the MCDS (Pinardi et al., 2019). Aggregating the data in the MCDS would provide a more complete collection and assure permanent preservation in international archives and repositories, guaranteeing their existence for future applications.
Beyond the real-time data transmitted via the GTS, there presently is no global repository dedicated to all data types (Table 1) collected onboard vessels. Most research vessel observations are neither available in near real time for operational applications nor processed in delayed mode to be submitted to global climate archives. There are examples of good stewardship of EOVs and ECVs, including the Rolling Deck to Repository, SAMOS, GOSUD, SOCAT, GLODAP, PANGAEA Data Publisher18, and the Australian Ocean Data Network, which provide quality assurance and dissemination and securely archive observations from research vessels (e.g., Gaillard et al., 2015). Much of the data are archived by different national data centers, and only some of these data are included in global marine climate databases (e.g., ICOADS and World Ocean Database). There are counter-examples where national research vessel operators do not always continuously log or manage data from underway systems. The authors recommend establishing a distributed set of data assembly centers, possibly affiliated with the MCDS, to catalog, manage, and deliver underway data from research vessels in a manner that support efficient data exchange across different computer platforms. The first step is to develop a unified catalog of vessels collecting data in Table 1, including metadata on what parameters are being sampled, at what frequency, and who is responsible for managing the individual sensor systems on research vessels. Any global research vessel observation catalog will need to leverage ongoing vessel metadata efforts at JCOMMOPS and from individual operational and research projects. This could be achieved in the next few years by organizing cross network workshops to engage the diverse shipboard observing community with the goal being to unlock existing data collected by research vessels and to expand observing capabilities by coordinating deployment of existing and new autonomous technology.
Community Engagement
Coordination between the operational and research observational communities needs to be strengthened at national and international levels, drawing on expertise in making the observations, collecting and tracking comprehensive metadata, and ensuring the observations are distributed and available in a manner that is transparent to the user. Data user communities need to be involved to assess their requirements for observations (e.g., identifying regions to improve sampling and focusing on specific physical parameters). Coordination is needed in the recruitment of ships to make observations, in developing technology for autonomous use on ships, and in collecting, tracking, and archiving of both the observations and the metadata that are critical for real-time (e.g., forecasting and warnings, and safety of life at sea) and delayed-mode (e.g., reanalyses, process studies, satellite algorithm development and product evaluation, and model evaluation) applications of the observations.
Coordinating Vessel Recruitment
For vessel recruitment, additional coordination is needed between international governing bodies and panels that are central to specific ship communities. For example, additional interaction is needed between international research vessel operators, the passenger cruise industry (e.g., Cruise Lines International Association, International Association of Antarctic Tour Operators), and the panels of JCOMM to coordinate recruitment across these large fleets. The WOC Smart Ocean-Smart Industries program provides a potential platform/portal to facilitate communication between the scientific ocean observing community and marine industries. The program goal is to increase the number of companies from a range of ocean industries involved in the sustained collection and reporting of standardized data for input to operational and scientific programs that improve the safety and sustainability of commercial activities at sea and contribute to understanding the ocean. The WOC brings together representatives from (a) shipping, oil/gas, ferries, offshore wind, and fisheries industries; (b) marine technology, instrumentation, and IT/communications companies; (c) international and national oceanographic/meteorological organizations; and (d) existing voluntary observation programs.
One major issue in using commercial vessels as observing platforms is that ships are frequently on short-term charters due to changing markets in a globalized world, while climate monitoring requires repetitive long-term observations. The resulting instability of repeat ship lines makes climate monitoring difficult and costly since a ship recruited for one line can switch to another line, sometimes on the other side of the world, on very short notice when the contract ends, and the in-port window can be very short for retrieving instrument for installation on another ship. Advancing vessel design to support observations may help to reduce this problem (see Technological Advancement), but more direct coordination with shipping companies will be required.
Not all marine observations are made from or coordinated by vessels officially recruited by an NMHS. Where commercial operators have a requirement for meteorological data for their operations, these data can be purchased or shared with NMHSs as a supplement to official operated networks. An example of third-party data includes automatic weather stations situated on offshore rigs, platforms, and floating production units. The oil and gas industries have a requirement for high-quality meteorological data (particularly wind) to carry out safe helicopter operations. Additional engagement with these third-party operators is essential to ensure valuable data are shared and made available, ideally free of cost, to the wider marine community.
Within the VOS Scheme, a dedicated “ZZ” category exists for recruited VOS ships that have no particular affiliation with a national VOS fleet. There are currently over 300 such ships registered within the VOS metadata database. This allows for the ad hoc recruitment of certain vessels where, for example, their voyage route looks to be beneficial (e.g., within a data sparse area), the voyage is only for a dedicated period of time, or there is limited resource to manage the data as part of a national fleet. Other benefits can be obtained by building relationships with private operators (e.g., yachts and racing teams) of vessels equipped with atmospheric or oceanic sensors, which may not be of the highest quality, but are occupying routes/regions not typically occupied by vessels recruited to VOS or research vessels (e.g., Southern Ocean). The advantage of doing so is that data supply is increased and the wider community is engaged with the making of ocean observations. As long as the platform metadata describe the source of the data sufficiently, data users can assess the usefulness for their operational or research goals. The recommendation to develop tools to collect third-party data using ships outside the traditional commercial and research vessel operators (see Vessel Recruitment) will engage new operators in the collection of the parameters in Table 1.
Leveraging Technological Advances
The authors recommend establishing routine communication between ship- and autonomous surface vessel-based science communities to develop and disseminate techniques between their domains, as an optimum ocean observational network is multi-platform. We expect autonomous surface vessels to play an ever-growing role in ocean observations for a variety of disciplines as new sensors become integrated (e.g., air–sea fluxes, ocean biogeochemistry, and fisheries; Swart et al., 2016; Centurioni et al., 2019). The role of the autonomous surface vessels to enhance and broaden existing and future ship-based observing needs to be defined. There is significant benefit to connect these communities, since the introduction of autonomous surface vessels creates the potential to scale up traditionally ship-limited observations and reduce the space–time data gaps inherent with ship-based surveys (Greene et al., 2014; Swart et al., 2016), such as envisioning a quasi-permanent science platform presence and year-round monitoring in both local and remote ocean regions. Meanwhile, ships will continue to be a primary contributor to the marine observational network and will be required for calibration, validation, and technological testing of sensors deployed on autonomous surface vessels, as well as to launch/recover autonomous surface vessels.
As noted above, AIS is a promising option to transmit observations for AIS-equipped ships. Although AIS was not designed for satellite reception and it has very limited bandwidth, there has been substantial success in receiving AIS transmission from satellites, increasing its potential for collecting weather observations. Recently, the VHF Data Exchange System (VDES) is being developed with higher bandwidth and designed to include two-way satellite communication capabilities. VDES will augment AIS and holds promise to be well suited for collection of weather observations from ships. AIS and VDES are inexpensive, essentially free beyond equipment cost, and likely to be aboard many, including smaller, vessels. The authors recommend the establishment of pilot projects, to include industry, governments, and providers of hardware and software, which will transmit meteorological and oceanographic information via AIS messages. This is in keeping with the U.S. National Transportation Safety Board’s recommendation to the National Oceanic and Atmospheric Administration in their report on the El Faro sinking19 (United States Coast Guard [USCG], 2017).
Data Users
Within the marine climate research community, international workshops promote best practices: the JCOMM Workshop on Advances in Marine Climatology and the International Workshop on Advances in the Use of Historical Marine Climate Data. These workshops focus on data management aspects of marine climatology, the development and production of multidecadal to centennial climate products, and sharing improvements in bias adjustment and uncertainty estimation methodologies. Both series include dataset developers and users, but it would be beneficial and is recommended to expand the scope to include operational users of marine data, allowing connections to be made between the need to make observations to support immediate operational needs and also to foster understanding that reusing these data is essential to meet longer-term climate objectives.
Models, from simple to fully coupled atmosphere–ocean biogeochemical global circulation models, benefit from observations for assimilation and evaluation. A more coordinated, multivariate approach to the collection of marine data from ships, along with easing accessibility to and better documentation of these data, will increase the use of observations by the modeling community. For example, the annually published global carbon budget (Le Quéré et al., 2018) now routinely combines data from observations and models, which reduces uncertainties and increases the confidence level in contemporary analyses as well as future model predictions. Such efforts foster not only communicating result to non-specialists but also enabling information flow to policy makers, either direct or via other organizations (e.g., the Intergovernmental Panel on Climate Change). It is essential in the next decade that shipboard observation of biogeochemical parameters become routine, in addition to traditional meteorological and physical oceanographic measurements, and the authors recommend further investment in the personnel and technology required to advance shipboard biogeochemical observation.
The role of shipboard observations in retrieval algorithm development and the calibration/validation of remotely sensed marine parameters will continue throughout the next decade. Indefinitely, the role of these observations in transportation and safety will be very important. More advanced satellite and aircraft remote sensing system will be developed, each requiring in situ observations to evaluate sensors and systems. Continued collaboration between the shipboard and remote sensing communities, and even among these communities, NMHSs, and the private sector (e.g., AIS and instrumentation developers and manufacturers), is important, whether at joint workshops, meetings of opportunity, or, ideally, joint observing projects. The authors recommend that agencies supporting satellite and remote sensing systems development provide complimentary funding to enhance shipboard observations. In many cases, the cost will be minimal compared with the cost of deploying new remote sensing systems.
Summary and Recommendations
All types of ships have the capability to provide essential atmospheric, oceanic, and biogeochemical observations. We envision a future where commercial, research, and privately owned vessels are making multivariate observations using a combination of automated and human-observed measurements. All data and metadata will be documented, tracked, evaluated, distributed, and archived to benefit users of marine data. This vision looks at ships as a holistic network, not a set of disparate VOS, research, commercial, and/or third-party activities working in isolation. The idea is to bring these communities together for the mutual benefit of all.
Toward that end, the authors make the following summary recommendations to be discussed at OceanObs’1920 and to be acted on over the coming decade. The authors note that the level of capital investment, both financial and human, varies between these recommendations. Those marked with bold text are deemed by the authors to be feasible with lower investments that may be supported through the funding infrastructure of individual nations (or small collaboratives). The other recommendations, though necessary to advance the coordination of shipboard observing and data management, will require higher levels of international cooperation and capital investment.
• Expand recruitment of new ships to make observations of the parameters outlined in Table 1 to
○ include recruitment via traditional means, ensuring that all research vessels are contributing to operational and research data collection efforts, and seeking new collaborations with commercial and private ship owners/operators,
○ increase and improve communications between the WOC, JCOMM, the research community, and relevant panels/communities in identifying additional ships to make observations, and
○ engage the user community to develop a list of sensors to be widely deployed on ships and to define high-priority regions of the ocean to target for increased sampling.
• The research vessel community should
○ provide metadata regarding their observational capabilities to international metadata catalogs,
○ expand capabilities to conduct direct flux measurements,
○ host new technology to provide a testbed prior to installation on commercial or private ships,
○ support installation of multiple sensor packages on research vessels, and
○ ensure that all sensor packages on each research vessel operate on every voyage (to maximize data collection).
• Agencies should invest in technology development by, but not limited to
○ establish pilot projects; to include industry, governments, and equipment and software providers; and to develop methods to transmit meteorological and oceanographic information via AIS messages,
○ work with sensor manufacturers to develop cost-effective, self-describing sensors that could deliver their metadata in a normalized format,
○ develop automated atmospheric composition sampling systems that could be installed on ships of opportunity, and
○ develop a web portal and other recruitment tools to support third-party data collection.
• Improve data access and interoperability by
○ agreeing internationally to a fully open policy for the exchange of and access to data and metadata from ships and
○ establishing distributed, but interoperable, regional/global data centers (affiliated with the MCDS), to catalog, evaluate, and distribute shipboard underway data, including VOS and research vessels, collected in real time and delayed mode. One center should focus on receiving, processing, and evaluating GTS data from multiple NMHS.
• Move ship observing networks toward standard quality control and assessment methodology by organizing an international working group to focus on developing and distributing tools and best practices.
Author Contributions
All authors contributed to writing sections of the manuscript, and each read and approved the submitted version. DF, PP, MK, and GA developed and contributed the figures.
Conflict of Interest Statement
EF was employed by ERT, Inc, as a contractor for the National Centers for Environmental Information.
The remaining authors declare that the research was conducted in the absence of any commercial or financial relationships that could be construed as a potential conflict of interest.
Funding
Preparation of this article by SRS and associated page charges are provided by a cooperative agreement (NA16OAR4320199) from the Climate Program Office, Ocean Observing and Monitoring Division of the National Oceanographic and Atmospheric Administration (FundRef#100007298) via a subaward (191001.363513.01D) from the Northern Gulf of Mexico Cooperative Institute administered by the Mississippi State University. EK and DB were supported by the UK NERC under the CLASS program (NE/R015953/1). SS was supported by a Wallenberg Academy Fellowship (WAF 2015.0186). US was supported by the UK NERC projects ABC Fluxes project (NE/M005070/1), the SONATA (NE/P021417/1), and the EU Horizon 2020 projects RINGO (#730944), and the AtlantOS (#633211).
Footnotes
- ^ http://www.gesamp.org/work/groups/38
- ^ https://gawsis.meteoswiss.ch/GAWSIS/index.html#
- ^ https://www.volvooceanrace.com/en/news/10225_What-is-the-Science-Programme.html
- ^ https://www.rvdata.us/
- ^ www.ferrybox.org
- ^ http://iocunesco-oneplanetoneocean.fnob.org/
- ^ https://www.csiro.au/en/research/facilities/marine-national-facility/research-case-studies
- ^ https://www.cprsurvey.org/
- ^ http://www.oceandataportal.org/
- ^ https://coastwatch.pfeg.noaa.gov/erddap/
- ^ https://cds.climate.copernicus.eu/
- ^ https://www.nodc.noaa.gov/OC5/WOD/pr_wod.html
- ^ https://www.arice.eu/
- ^ https://www.cocorahs.org/
- ^ https://www.wunderground.com/weatherstation/overview.asp
- ^ https://www.opengeospatial.org/standards/sensorml
- ^ http://www.iala-aism.org/asm/weather-observation-report-ship/
- ^ www.Pangaea.de
- ^ https://www.ntsb.gov/investigations/AccidentReports/Reports/MAR1701.pdf
- ^ http://www.oceanobs19.net/
References
Allan, R., Brohan, P., Compo, G. P., Stone, R., Luterbacher, J., and Brönnimann, S. (2011). The international atmospheric circulation reconstructions over the earth (ACRE) initiative. Bull. Amer. Meteor. Soc. 92, 1421–1425. doi: 10.1175/2011bams3218.1
Aloisio, G., Conte, D., Elefante, C., Marra, G. P., Mastrantonio, G., and Quarta, G. (2006). “Globus monitoring and discovery service and SensorML for grid sensor networks,” in Proceedings of the 15th IEEE International Workshops on Enabling Technologies: Infrastructure for Collaborative Enterprises, Manchester, doi: 10.1109/WETICE.2006.44
Alory, G., Delcroix, T., Téchiné, P., Diverrès, D., Varillon, D., Cravatte, S., et al. (2015). The french contribution to the voluntary observing ships network of sea surface salinity. Deep Sea Res. 105, 1–18. doi: 10.1016/j.DSR.2015.08.005
Anderson, E. (2018). Statement of Guidance for Global Numerical Weather Prediction (NWP), WMO. Available at: https://www.wmo.int/pages/prog/www/OSY/SOG/SoG-Global-NWP.pdf doi: 10.1016/j.dsr.2015.08.005 (accessed July 22, 2018).
Anderson, J. E., and Riser, S. C. (2014). Near-surface variability of temperature and salinity in the near-tropical ocean: observations from profiling floats. J. Geophys. Res. 119, 7433–7448. doi: 10.1002/2014JC010112
Asher, W. E., Jessup, A. T., Branch, R., and Clark, D. (2014). Observations of rain-induced near-surface salinity anomalies. J. Geophys. Res. 119, 5483–5500. doi: 10.1002/2014jc009954
Baker, A. R., Adams, C., Bell, T. G., Jickells, T. D., and Ganzeveld, L. (2013). Estimation of atmospheric nutrient inputs to the Atlantic Ocean from 50∘N to 50∘S based on large-scale field sampling: iron and other dust-associated elements. Glob. Biogeochem. Cycles 27, 755–767. doi: 10.1002/gbc.20062
Baker, A. R., Lesworth, T., Adams, C., Jickells, T. D., and Ganzeveld, L. (2010). Estimation of atmospheric nutrient inputs to the atlantic ocean from 50∘N to 50∘S based on large-scale field sampling: fixed nitrogen and dry deposition of phosphorus. Glob. Biogeochem. Cycles 24:GB3006. doi: 10.1029/2009GB003634
Bauer, P., Thorpe, A., and Brunet, G. (2015). The quiet revolution of numerical weather prediction. Nature 525, 47–55. doi: 10.1038/nature14956
Beaugrand, G., and Kirby, R. R. (2018). How do marine pelagic species respond to climate change? Theories and observations. Annu. Rev. Mar. Sci. 10, 169–197. doi: 10.1146/annurev-marine-121916-063304
Bell, M. J., Schiller, A., Le Traon, P.-Y., Smith, N. R., Dombrowsky, E., and Wilmer-Becker, K. (2015). An introduction to GODAE OceanView. J. Oper. Oceanogr. 8, s2–s11. doi: 10.1080/1755876X.2015.1022041
Benallal, M., Moussa, H., Touratier, F., Goyet, C., and Poisson, A. (2016). Ocean salinity from satellite-derived temperature in the Antarctic Ocean. Antarct. Sci. 28, 127–134. doi: 10.1017/S0954102015000516
Bentamy, A., Piollé, J. F., Grouazel, A., Danielson, R., Gulev, S., Paul, F., et al. (2017). Review and assessment of latent and sensible heat flux accuracy over the global oceans. Remote Sens. Environ. 201, 196–218. doi: 10.1016/j.rse.2017.08.016
Berry, D. I., and Kent, E. C. (2011). Air–sea fluxes from ICOADS: the construction of a new gridded dataset with uncertainty estimates. Int. J. Climatol. 31, 987–1001. doi: 10.1002/joc.2059
Berry, D. I., and Kent, E. C. (2017). Assessing the health of the global surface marine climate observing system. Int. J. Climatol. 37, 2248–2259. doi: 10.1002/joc.4914
Bojinski, S., Verstraete, M., Peterson, T. C., Richter, C., Simmons, A., and Zemp, M. (2014). The concept of essential climate variables in support of climate research, applications, and policy. Bull. Am. Meteor. Soc. 95, 1431–1443. doi: 10.1175/BAMS-D-13-00047.1
Bonou, F. K., Noriega, C., Lefèvre, N., and Araujo, M. (2016). Distribution of CO2 parameters in the Western Tropical Atlantic Ocean. Dyn. Atmos. Oceans 73, 47–60. doi: 10.1016/j.dynatmoce.2015.12.001
Bourassa, M. A., Legler, D. M., O’Brien, J. J., and Smith, S. R. (2003). SeaWinds validation with research vessels. J. Geophys. Res. 108:3019. doi: 10.1029/2001JC001028
Bourlès, B., Lumpkin, R., McPhaden, M. J., Hernandez, F., Nobre, P., Campos, E., et al. (2008). The PIRATA program: history, accomplishments, and future directions. Bull. Am. Meteor. Soc. 89, 1111–1126. doi: 10.1175/2008BAMS2462.1
Boutin, J., Chao, Y., Asher, W. E., Delcroix, T., Drucker, R., Drushka, K., et al. (2016). Satellite and in situ salinity: understanding near-surface stratification and sub-footprint variability. Bull. Am. Meteor. Soc. 97, 1391–1407. doi: 10.1175/BAMS-D-15-00032.1
Boutin, J., Vergely, J. L., Marchand, S., D’Amico, F., Hasson, A., Kolodziejczyk, N., et al. (2018). New SMOS sea surface salinity with reduced systematic errors and improved variability. Remote Sens. Environ. 214, 115–134. doi: 10.1016/j.rse.2018.05.022
Brewin, R. J. W., Dall’Olmo, G., Pardo, S., van Dongen-Vogels, V., and Boss, E. S. (2016). Underway spectrophotometry along the atlantic meridional transect reveals high performance in satellite chlorophyll retrievals. Remote Sens. Environ. 183, 82–97. doi: 10.1016/j.rse.2016.05.005
Brönnimann, S., Allan, R., Atkinson, C., Buizza, R., Bulygina, O., Dahlgren, P., et al. (2018). Observations for reanalyses. Bull. Am. Meteor. Soc. 99, 1851–1866. doi: 10.1175/BAMS-D-17-0229.1
Buizza, R., Poli, P., Rixen, M., Alonso-Balmaseda, M., Bosilovich, M. G., Brönnimann, S., et al. (2018). Advancing global and regional reanalyses. Bull. Am. Meteor. Soc. 99, ES139–ES144. doi: 10.1175/BAMS-D-17-0312.1
Caccia, M., Bono, R., Bruzzone, G., Bruzzone, G., Spirandelli, E., Veruggio, G., et al. (2005). “Design and exploitation of an autonomous surface vessel for the study of sea–air interactions,” in Proceedings of the 2005 IEEE International Conference on Robotics and Automation, Barcelona, doi: 10.1109/ROBOT.2005.1570665
Carslaw, K. S., Lee, L. A., Reddington, C. L., Pringle, K. J., Rap, A., Forster, P. M., et al. (2013). Large contribution of natural aerosols to uncertainty in indirect forcing. Nature 503, 67–71. doi: 10.1038/nature12674
Centurioni, L. R., Turton, J., Lumpkin, R., Braasch, L., Brassington, G., Chao, Y., et al. (2019). Global in-situ observations of essential climate and ocean variables at the air–sea interface. Front. Mar. Sci. doi: 10.3389/fmars.2019.00419
Choquer, M. (2014). Bark EUROPA: the OceanoScientific system onboard the three-master. Mariners Weather Log 58, 4–8.
Compo, G. P., Whitaker, J. S., Sardeshmukh, P. D., Matsui, N., Allan, R. J., Yin, X., et al. (2011). The twentieth century reanalysis project. Q. J. R. Meteorol. Soc. 137, 1–28. doi: 10.1002/qj.776
Corfield, R. (2003). The Silent Landscape: The Scientific Voyage of HMS Challenger. Washington, DC: Joseph Henry Press.
Cronin, M. F., Gentemann, C. L., Edson, J., Ueki, I., Bourassa, M., Brown, S., et al. (2019). Air-sea fluxes with a focus on heat and momentum. Front. Mar. Sci. 6:430. doi: 10.3389/fmars.2019.00430
Cummings, J. A. (2011). “Ocean data quality control,” in Operational Oceanography in the 21st Century, eds A. Schiller and G. B. Brassington (Dordrecht: Springer), 91–121. doi: 10.1007/978-94-007-0332-2_4
da Silva, A. M., Young, C. C., and Levitus, S. (1994). Atlas of Surface Marine Data 1994, volume 1: Algorithms and Procedures. NOAA Atlas NESDIS 6. Silver Spring, MD: NESDIS.
Delcroix, T., Alory, G., Cravatte, S., Corrège, T., and McPhaden, M. (2011). A gridded sea surface salinity data set for the tropical Pacific with sample applications (1950–2008). Deep Sea Res. 58, 38–48. doi: 10.1016/j.dsr.2010.11.002
Duce, R. A., Liss, P. S., Merrill, J. T., Atlas, E. L., Buat-Menard, P., Hicks, B. B., et al. (1991). The atmospheric input of trace species to the world ocean. Glob. Biogeochem. Cycles 5, 193–259. doi: 10.1029/91gb01778
Fletcher, J. (2008). Meteorological Observations from Ships. Seaways. 7–10. The Nautical Institute, Available at: http://sot.jcommops.org/vos/documents/seaways-vos-200804.pdf (accessed July 22, 2019).
Freeman, E., Woodruff, S. D., Worley, S. J., Lubker, S. J., Kent, E. C., Angel, W. E., et al. (2017). ICOADS Release 3.0: a major update to the historical marine climate record. Int. J. Climatol. 37, 2211–2232. doi: 10.1002/joc.4775
Gaillard, F., Diverres, D., Jacquin, S., Gouriou, Y., Grelet, J., Le Menn, M., et al. (2015). Sea surface temperature and salinity from French research vessels, 2001–2013. Sci. Data 2:150054. doi: 10.1038/sdata.2015.54
Galloway, J. N., Knap, A. H., and Church, T. M. (1983). The composition of western Atlantic precipitation using shipboard collectors. J. Geophys. Res. 88, 10859–10864. doi: 10.1029/JC088iC15p10859
Gelaro, R., McCarty, W., Suárez, M. J., Todling, R., Molod, A., Takacs, L., et al. (2017). MERRA-2 Overview: the modern-era retrospective analysis for research and applications, version 2 (MERRA-2). J. Clim. 30, 5419–5454. doi: 10.1175/JCLI-D-16-0758.1
German, C. R., Jukuba, M. V., Kinsey, J. C., Partan, J., Suman, S., Belani, A., et al. (2012). “A long term vision for long-range ship-free deep ocean operations: persistent presence through coordination of autonomous surface vehicles and autonomous underwater vehicles,” in Proceedings of the 2012 IEEE/OES Autonomous Underwater Vehicles (AUV), Southampton, doi: 10.1109/AUV.2012.6380753
Geyer, B., and Rockel, B. (2013). coastDat-2 COSMO-CLM Atmospheric Reconstruction. Hamburg: World Data Center for Climate, doi: 10.1594/WDCC/coastDat-2_COSMO-CLM
Global Climate Observing System [GCOS] (2016). The Global Observing System for Climate: Implementation Needs. GCOS-200, GOOS-214, World Meteorological Organization. Available at: https://unfccc.int/sites/default/files/gcos_ip_10oct2016.pdf (accessed July 22, 2018).
Global Ocean Observing System [GOOS] (2018). Essential Ocean Variables. Available at: http://www.goosocean.org/index.php?option=com_content&view=article&id=14&Itemid=114 (accessed 19 September 2018)Google Scholar
Goni, G., Sprintall, J., Bringas, F., Cheng, L., Cirano, M., Dong, S., et al. (2019). More than 50 years of successful continuous temperature section measurements by the global eXpendable BathyThermograph (XBT) network, its integrability, societal benefits, and future. Front. Mar. Sci. doi: 10.3389/fmars.2019.00452
Greene, C. H., Meyer-Gutbrod, E. L., McGarry, L. P., Hufnagle, L. C., Chu, D., McClatchie, S., et al. (2014). A wave glider approach to fisheries acoustics: transforming how we monitor the nation’s commercial fisheries in the 21st century. Oceanography 27, 168–174.
Guichoux, Y., Lennon, M., and Thomas, N. (2016). “Sea surface currents calculation using vessel tracking data,” in Proceedings of the Maritime Knowledge Discovery and Anomaly Detection Workshop, (Ispra: Joint Research Centre),
Holthus, P. (2018). “The role of the world ocean council and the ocean business community in global ocean governance,” in The IMLI Treatise on Global Ocean Governance: Volume I: UN and Global Ocean Governance, ed. D. Kritsiotis (London: International Maritime Organization).
Ingleby, B. (2010). Factors affecting ship and buoy data quality: a data assimilation perspective. J. Atmos. Ocean. Technol. 27, 1476–1489. doi: 10.1175/2010JTECHA1421.1
International Maritime Organization [IMO] (2002). Safety of Life at Sea, Chapter V. Available at: http://www.imo.org/en/OurWork/facilitation/documents/solas%20v%20on%20safety%20of%20navigation.pdf (accessed July 22, 2018).
International Maritime Organization [IMO] (2018). Participation in the WMO Voluntary Observing Ship Scheme, MSC.1 Circular 1293. Available at: http://sot.jcommops.org/vos/documents/msc_1293.pdf (accessed July 22, 2018).
Jackson, D. L., and Wick, G. A. (2016). “Development of a 28-year (1987–2014) climatology of single and multi-sensor satellite-based retrievals of near-surface humidity and temperature,” in Proceedings of the 20th Conference on air–sea Interactions, Madison, WI.
JCOMM (2002). JCOMM Ship Observation Team, First Session, National Reports. JCOMM Technical Report No. 17, WMO/TD-No. 1121. Available at: https://library.wmo.int/pmb_ged/wmo-td_1121_en.pdf (accessed July 24, 2018).
JCOMM (2010). Third Session of the JCOMM Expert Team on Marine Climatology. JCOMM Meeting Report No. 70. Geneva: World Meteorological Organization.
Jessup, A. T., and Branch, R. (2008). Integrated ocean skin and bulk temperature measurements using the calibrated infrared in situ measurement system (CIRIMS) and through-hull ports. J. Atmos. Ocean Technol. 25, 579–597. doi: 10.1175/2007jtecho479.1
Jickells, T. D., Buitenhuis, E., Altieri, K., Baker, A. R., Capone, D., Duce, R. A., et al. (2017). A re-evaluation of the magnitude and impacts of anthropogenic nitrogen inputs on the ocean. Glob. Biogeochem. Cycles 31, 289–305. doi: 10.1002/2016GB00558
Jones, R. W., Renfrew, I. A., Orr, A., Webber, B. G. M., Holland, D. M., and Lazzara, M. A. (2016). Evaluation of four global reanalysis products using in situ observations in the Amundsen Sea Embayment, Antarctica. J. Geophys. Res. Atmos. 121, 6240–6257. doi: 10.1002/2015JD024680
Kawai, Y., and Wada, A. (2007). Diurnal sea surface temperature variation and its impact on the atmosphere and ocean: a review. J. Oceanogr. 63, 721–744. doi: 10.1007/s10872-007-0063-0
Keim, B. (2011). Transcending Time: Great Long-Term Datasets. Wired.com 10.17.11. Available at: https://www.wired.com/2011/10/long-term-datasets/ (accessed July 31, 2018).
Kent, E. C., Ball, G., Berry, D. I., Fletcher, J., Hall, A., North, S., et al. (2010). “The Voluntary Observing Ship (VOS) Scheme,” in Proceedings of the “OceanObs’09: Sustained ocean observations and information for society”, Venice, eds J. Hall, D. E. Harrison, and D. Stammer (Venice: ESA Publication), 21–25. doi: 10.5270/OceanObs09.cwp.48
Kent, E. C., Kennedy, J. J., Smith, T. M., Hirahara, S., Huang, B., Kaplan, A., et al. (2017). A call for new approaches to quantifying biases in observations of sea–surface temperature. BAMS 98, 1601–1616. doi: 10.1175/BAMS-D-15-00251.1
Kent, E. C., Rayner, N. A., Berry, D. I., Eastman, R., Grigorieva, V. G., Huang, B., et al. (2019). Observing requirements for long-term climate records at the ocean surface. Front. Mar. Sci. 6:441. doi: 10.3389/fmars.2019.00441
Kent, E. C., Rayner, N. A., Berry, D. I., Saunby, M., Moat, B. I., Kennedy, J. J., et al. (2013). Global analysis of night marine air temperature and its uncertainty since 1880, the HadNMAT2 Dataset. J. Geophys. Res. Atmos. 118, 1281–1298. doi: 10.1002/jgrd.50152
Kent, E. C., Woodruff, S. D., and Berry, D. I. (2007). Metadata from WMO Publication No. 47 and an assessment of voluntary observing ship observation heights in ICOADS. J. Atmos. Ocean Technol. 24, 214–234. doi: 10.1175/JTECH1949.1
Keynes, R. D. (2012). The Beagle Record: Selections from the Original Pictorial Records and Written Accounts of the Voyage of HMS Beagle. Cambridge: Cambridge University Press.
Klepp, C. (2015). The oceanic shipboard precipitation measurement network for surface validation—OceanRAIN. Atmos. Res. 163, 74–90. doi: 10.1016/j.atmosres.2014.12.014
Kolodziejczyk, N., Diverres, D., Jacquin, S., Gouriou, Y., Grelet, J., Le Menn, M., et al. (2015a). Sea Surface Salinity from French RESearcH Vessels: Delayed Mode Dataset, Annual Release. France: SEANOE, doi: 10.17882/39475
Kolodziejczyk, N., Reverdin, G., Boutin, J., and Hernandez, O. (2015b). Observation of the surface horizontal thermohaline variability at meso- to submesoscales in the North-Eastern Subtropical Atlantic Ocean. J. Geophys. Res. Oceans 120, 2588–2600. doi: 10.1002/2014JC010455
Kramp, M., Gaillard, F., Blouch, P., and Fietzek, P. (2010). Scientific data acquisition by ocean-going sailing yachts: the OceanoScientific program. Revue de L’electricite et de L’electronique 10, 52–60.
Kramp, M., and Rusciano, E. (2016). Sailing and science: 27 days to Cape Horn with surface drifters and TurboWin. Mariners Weather Log 60, 4–7.
Laloyaux, P., de Boisseson, E., Balmaseda, M., Bidlot, J.-R., Broennimann, S., Buizza, R., et al. (2018). CERA-20C: a coupled reanalysis of the twentieth century. J. Adv. Model. Earth Syst. 10, 1172–1195. doi: 10.1029/2018MS001273
Le Quéré, C., Andrew, R. M., Friedlingstein, P., Sitch, S., Pongratz, J., Manning, A. C., et al. (2018). Global carbon budget 2017. Earth Syst. Sci. Data 10, 405–448. doi: 10.5194/essd-10-405-2018
Lee, K., Tong, L. T., Millero, F. J., Sabine, C. L., Dickson, A. G., Goyet, C., et al. (2006). Global relationships of total alkalinity with salinity and temperature in surface waters of the world’s oceans. Geophys. Res. Lett. 33:L19605. doi: 10.1029/2006GL027207
Lenain, L., and Melville, W. K. (2014). Autonomous surface vehicle measurements of the ocean’s response to tropical cyclone Freda. J. Atmos. Ocean. Technol. 31, 2169–2190. doi: 10.1175/JTECH-D-14-00012.1
Liman, J., Schröder, M., Fennig, K., Andersson, A., and Hollmann, R. (2018). Uncertainty characterization of HOAPS 3.3 latent heat-flux-related parameters. Atmos. Meas. Tech. 11, 1793–1815. doi: 10.5194/amt-11-1793-2018
Mallory, (1855). Origin of the Wind and Current Chart and Sailing Directions. Report, 32 Congress, The Senate of the United States, Rep. Com. No 443, 29 January 1855. Available at: https://books.google.co.uk/books?id=WacFAAAAQAAJ&printsec=frontcover&source=gbs_ge_summary_r&cad=0#v=onepage&q&f=false (accessed July 22, 2018).
Martino, M., Hamilton, D., Baker, A. R., Jickells, T. D., Bromley, T., Nojiri, Y., et al. (2014). Western pacific atmospheric nutrient deposition fluxes, their impact on surface ocean productivity. Glob. Biogeochem. Cycles 28, 712–728. doi: 10.1002/2013gb004794
Maury, M. F. (1854). “Maritime conference held at brussels for devising a uniform system of meteorological observations at sea, August and September, 1853,” in Explanations and Sailing Directions to Accompany the Wind and Current Charts, 6th Edn, eds E. C. J. Biddle (Philadelphia, PA: Read Books Design), 54–96.
McBean, G. A., Phillips, D. J., and Mathieson, J. R. (1986). An intercomparison of two rawinsonde systems. Atmos. Ocean 24, 42–51. doi: 10.1080/07055900.1986.9649239
McClain, C. R. (2009). A decade of satellite ocean color observations. Annu. Rev. Mar. Sci. 1, 19–42. doi: 10.1146/annurev.marine.010908.163650
McPhaden, M. J., Busalacchi, A. J., Cheney, R., Donguy, J. R., Gage, K. S., Halpern, D., et al. (1998). The tropical ocean-global atmosphere observing system: a decade of progress. J. Geophys. Res. 103, 14169–14240. doi: 10.1029/97JC02906
Monteiro, P. M. S., Gregor, L., Lévy, M., Maener, S., Sabine, C. L., and Swart, S. (2015). Seasonal-scale robotics experiment reveals the contribution made by fine scale dynamics to the uncertainties and biases in the mean seasonal CO2 flux in the Southern Ocean. Geophys. Res. Lett. 42, 8507–8514. doi: 10.1002/2015GL066009
Naderi, F., Freilich, M. H., and Long, D. G. (1991). Spaceborne radar measurement of wind velocity over the ocean: an overview of the NSCAT scatterometer system. Proc. IEEE 79, 850–866. doi: 10.1109/5.90163
Nara, H., Tanimoto, H., Nojiri, Y., Mukai, H., Machida, T., and Tohjima, Y. (2011). Onboard measurement system of atmospheric carbon monoxide in the Pacific by voluntary observing ships. Atmos. Meas. Tech. 4, 2495–2507. doi: 10.5194/amt-4-2495-2011
Nara, H., Tanimoto, H., Tohjima, Y., Mukai, H., Nojiri, Y., and Machida, T. (2014). Emissions of methane from offshore oil and gas platforms in Southeast Asia. Sci. Rep. 4:6503. doi: 10.1038/srep06503
Ogle, S. E., Tamsitt, V., Josey, S. A., Gille, S. T., Cerovečki, I., Talley, L. D., et al. (2018). Episodic southern ocean heat loss and its mixed layer impacts revealed by the farthest south multiyear surface flux mooring. Geophys. Res. Lett. 45, 5002–5010. doi: 10.1029/2017GL076909
Olsen, A., Key, R. M., van Heuven, S., Lauvset, S. K., Velo, A., Lin, X., et al. (2016). The global ocean data analysis project version 2—an internally consistent data product for the world ocean. Earth Syst. Sci. Data 8, 297–323. doi: 10.5194/essd-8-297-2016
Pazan, S. E., and Niiler, P. (2004). New global drifter data set available. EOS Trans. Am.Geophys. Union 85:17. doi: 10.1029/2004EO020007
Perlwitz, J. P., Perez Garcia-Pando, C., and Miller, R. L. (2015). Predicting the mineral composition of dust aerosols—part 2: model evaluation and identification of key processes with observations. Atmos. Chem. Phys. 15, 11629–11652. doi: 10.5194/acp-15-11629-2015
Petersen, W. (2014). FerryBox systems: state-of-the-art in Europe and future development. J. Mar. Syst. 140(Part A), 4–12. doi: 10.1016/j.jmarsys.2014.07.003
Pfeil, B., Olsen, A., Bakker, D. C. E., Hankin, S., Koyuk, H., Kozyr, A., et al. (2013). A uniform, quality controlled Surface Ocean CO2 Atlas (SOCAT). Earth Syst. Sci. Data 5, 125–143. doi: 10.5194/essd-5-125-2013
Pilar, P., Guedes Soares, C., and Carretero, J. C. (2008). A 44-year wave hindcast for the North East Atlantic European coast. Coast. Eng. 55, 861–871. doi: 10.1016/j.coastaleng.2008.02.027
Pinardi, N., Stander, J., Legler, D., O’Brien, K., Boyer, T., Cuff, T., et al. (2019). Marine monitoring to services: the IOC of UNESCO and WMO experience. Front. Mar. Sci. doi: 10.3389/fmars.2019.00410
Poli, P., Hersbach, H., Dee, D. P., Berrisford, P., Simmons, A. J., Vitart, F., et al. (2016). ERA-20C: an atmospheric reanalysis of the twentieth century. J. Clim. 29, 4083–4097. doi: 10.1175/JCLI-D-15-0556.1
Powell, C. F., Baker, A. R., Jickells, T. D., Bange, H. W., Chance, R. J., and Yodle, C. (2015). Estimation of the atmospheric flux of nutrients and trace metals to the eastern tropical North Atlantic Ocean. J. Atmos. Sci. 72, 4029–4045. doi: 10.1175/jas-d-15-0011.1
Quinn, P. K., and Bates, T. S. (2005). Regional aerosol properties: comparisons of boundary layer measurements from ACE 1, ACE 2, Aerosols99, INDOEX, ACE Asia, TARFOX, and NEAQS. J. Geophys. Res. 110:D14202. doi: 10.1029/2004JD004755
Reverdin, G., Morisset, S., Bellenger, H., Boutin, J., Martin, N., Blouch, P., et al. (2013). Near-sea surface temperature stratification from SVP drifters. J. Atmos. Ocean Technol. 30, 1867–1883. doi: 10.1175/JTECH-D-12-00182.1
Richardson, P. L. (1980). Benjamin franklin and timothy Folger’s first printed chart of the gulf stream. Science 207, 643–645. doi: 10.1126/science.207.4431.643
Richardson, P. L., and Walsh, D. (1986). Mapping climatological seasonal variations of surface currents in the tropical Atlantic using ship drifts. J. Geophys. Res. 91, 10537–10550.
Riser, S. C., Freeland, H. J., Roemmich, D., Wijffels, S., Troisi, A., Belbeoch, M., et al. (2016). Fifteen years of ocean observations with the global Argo array. Nat. Clim. Chang. 6, 145–153. doi: 10.1038/nclimate2872
Roemmich, D., Johnson, G., Riser, S., Davis, R., Gilson, J., Owens, W., et al. (2009). The Argo program: observing the global ocean with profiling floats. Oceanography 22, 34–43. doi: 10.5670/oceanog.2009.36
Rossby, T. (2011). OceanScope: A Proposed Partnership Between the Maritime Industries and the Ocean Observing Community to Monitor the Global Ocean Water Column. Report of SCOR/IAPSO Working Group. Paris: SCOR.
Rudnick, D. L., Davis, R. E., Eriksen, C. C., Fratantoni, D. M., and Perry, M. J. (2004). Underwater gliders for ocean research. Mar. Technol. Soc. J. 38, 73–84.
Saha, S., Moorthi, S., Pan, H., Wu, X., Wang, J., Nadiga, S., et al. (2010). The NCEP climate forecast system reanalysis. Bull. Am. Meteor. Soc. 91, 1015–1058. doi: 10.1175/2010BAMS3001.1
Salat, J., Umbert, M., Ballabrera-Poy, J., Fernández, P., Salvador, K., and Martínez, J. (2013). The contribution of the Barcelona World Race to improved ocean surface information. A validation of the SMOS remotely sensed salinity. Contrib. Sci. 9, 89–100. doi: 10.2436/20.7010.01.167
Schmidt, K. M., Swart, S., Reason, C., and Nicholson, S. (2017). Evaluation of satellite and reanalysis wind products with in situ wave glider wind observations in the Southern Ocean. J. Atmos. Ocean. Technol. 34, 2551–2568. doi: 10.1175/JTECH-D-17-0079.1
Send, U., Weller, R. A., Wallace, D., Chavez, F., Lampitt, R., Dickey, T., et al. (2010). “OceanSITES,” in Proceedings of OceanObs’09: Sustained Ocean Observations and Information for Society, Vol. 2, eds J. Hall, D. E. Harrison, and D. Stammer (Noordwijk: European Space Agency), 913–922.
Shangguan, Q., Shu, H., Li, P., Lin, K., Byrne, R. H., Li, Q., et al. (2019). Automated spectrophotometric determination of carbonate ion concentration in seawater using a portable syringe pump based analyzer. Mar. Chem. 209, 120–127. doi: 10.1016/j.marchem.2019.01.007
Sholkovitz, E. R., and Sedwick, P. N. (2006). Open-ocean deployment of a buoy-mounted aerosol sampler on the Bermuda Testbed Mooring: aerosol iron and sea salt over the Sargasso Sea. Deep Sea Res. 53, 547–560. doi: 10.1016/j.dsr.2005.12.002
Smith, S. R., Bourassa, M. A., Bradley, E. F., Cosca, C., Fairall, C. W., Goni, G. J., et al. (2010). “Automated underway oceanic and atmospheric measurements from ships,” in Proceedings of the “OceanObs’09: Sustained Ocean Observations and Information for Society, Venice, eds J. Hall, D. E. Harrison, and D. Stammer (Venice: ESA Publication), 21–25. doi: 10.5270/OceanObs09.cwp.82
Smith, S. R., Briggs, K., Bourassa, M. A., Elya, J., and Paver, C. (2018). Shipboard automated meteorological and oceanographic system data archive: 2005–2017. Geosci. Data J. 5, 73–86. doi: 10.1002/gdj3.59
Smith, S. R., Briggs, K., Lopez, N., and Kourafalou, V. (2016a). Numerical model evaluation using automated underway ship observations. J. Atmos. Ocean. Technol. 33, 409–428. doi: 10.1175/JTECH-D-15-0052.1
Smith, S. R., Lopez, N., and Bourassa, M. A. (2016b). SAMOS air–sea fluxes: 2005–2014. Geosci. Data J. 3, 9–19. doi: 10.1002/gdj3.34
Smith, S. R., Legler, D. M., and Verzone, K. V. (2001). Quantifying uncertainties in NCEP reanalyses using high quality research vessel observations. J. Clim. 14, 4062–4072. doi: 10.1175/1520-0442(2001)014<4062:quinru>2.0.co;2
Stern, H., and Davidson, N. E. (2015). Trends in the skill of weather prediction at lead times of 1–14 days. Q. J. R. Meteorol. Soc. 141, 2726–2736. doi: 10.1002/qj.2559
Storto, A., Masina, S., and Navarra, A. (2016). Evaluation of the CMCC eddy-permitting global ocean physical reanalysis system (C-GLORS, 1982–2012) and its assimilation components. Q. J. R. Meteorol. Soc. 142, 738–758. doi: 10.1002/qj.2673
Swart, S., Gille, S. T., Delille, B., Josey, S., Mazloff, M., Newman, L., et al. (2019). Constraining southern ocean air–sea fluxes through enhanced observations. Front. Mar. Sci. 6:421. doi: 10.3389/fmars.2019.00421
Swart, S., Zietsman, J. J., Coetzee, J., Goslett, D. G., Hoek, A., Needham, D., et al. (2016). Ocean robotics in support of fisheries research and management. Afr. J. Mar. Sci. 38, 525–538. doi: 10.2989/1814232X.2016.1251971
Talley, L. D., Feely, R. A., Sloyan, B. M., Wanninkhof, R., Baringer, M. O., Bullister, J. L., et al. (2016). Changes in ocean heat, carbon content, and ventilation: a review of the first decade of GO-SHIP Global Repeat Hydrography. Annu. Rev. Mar. Sci. 8, 185–215. doi: 10.1146/annurev-marine-052915-100829
Terray, L., Corre, L., Cravatte, S., Delcroix, T., Reverdin, G., and Ribes, A. (2012). Near-surface salinity as nature’s rain gauge to detect human influence on the tropical water cycle. J. Clim. 2, 958–977. doi: 10.1175/JCLI-D-10-05025.1
Thomson, J., and Girton, J. (2017). Sustained measurements of Southern Ocean air–sea coupling from a wave glider autonomous surface vehicle. Oceanography 30, 104–109. doi: 10.5670/oceanog.2017.228
Thorne, P. W., Diamond, H. J., Goodison, B., Harrigan, S., Hausfather, Z., Ingleby, N. B., et al. (2018). Towards a global land surface climate fiducial reference measurements network. Int. J. Climatol. 38, 2760–2774. doi: 10.1002/joc.5458
Tomczak, M. (1995). Salinity variability in the surface layer of the tropical western Pacific Ocean. J. Geophys. Res. 100, 20499–20515. doi: 10.1029/95JC01544
United States Coast Guard [USCG] (2017). Marine Board’s Report, Steam Ship El Faro (O.N. 561732), sinking and loss of the vessel with 33 persons missing and presumed deceased northeast of Acklins and Crooked Island, Bahamas on October 1, 2015. Available at: https://media.defense.gov/2017/Oct/01/2001820187/-1/-1/0/FINAL%20PDF%20ROI%2024%20SEP%2017.PDF (accessed July 24, 2018).
von Schuckmann, K., Le Traon, P.-Y., Smith, N., Pascual, A., Brasseur, P., Fennel, K., et al. (2018). Copernicus marine service ocean state report. J. Oper. Oceanogr. 11, S1–S142. doi: 10.1080/1755876X.2018.1489208
Wanninkhof, R., Pickers, P. A., Omar, A. M., Sutton, A. J., Murata, A., Olsen, A., et al. (2019). A surface ocean CO2 reference network, SOCONET and associated marine boundary layer CO2 measurements. Front. Mar. Sci. 6:400. doi: 10.3389/fmars.2019.00400
Watson, A. J., Schuster, U., Bakker, D. C. E., Bates, N. R., Corbiere, A., Gonzalez-Davila, M., et al. (2009). Tracking the variable North Atlantic sink for atmospheric CO2. Science 326, 1391–1393. doi: 10.1126/science.1177394
Weller, R. A., Bradley, E. F., Edson, J. B., Fairall, C. W., Brooks, I., Yelland, M. J., et al. (2008). Sensors for physical fluxes at the sea surface: energy, heat, water, salt. Ocean Sci. 4, 247–263. doi: 10.5194/os-4-247-2008
WMO (1995). “Resolution 40 (Cg-XII): WMO policy and practice for the exchange of meteorological and related data and products including guidelines on relationships in commercial activities,” in Proceedings of the Twelfth World Meteorological Congress, (Geneva: WMO).
Woodruff, S. D., Diaz, H. F., Worley, S. J., Reynolds, R. W., and Lubker, S. J. (2005). Early ship observational data and ICOADS. Clim. Change 73, 169–194. doi: 10.1007/s10584-005-3456-3
Woodruff, S. D., Worley, S. J., Lubker, S. J., Ji, Z., Freeman, E. J., Berry, D. I., et al. (2011). ICOADS Release 2.5: extensions and enhancements to the surface marine meteorological archive. Int. J. Climatol. 31, 951–967. doi: 10.1002/joc.2103
Wunsch, C. (1978). The North Atlantic general circulation west of 50∘W determined by inverse methods. Rev. Geophys. 16, 583–620. doi: 10.1029/RG016i004p00583
Yokouchi, Y., Nojiri, Y., Toom-Sauntry, D., Fraser, P., Inuzuka, Y., Tanimoto, H., et al. (2012). Long-term variation of atmospheric methyl iodide and its link to global environmental change. Geophys. Res. Lett. 39:L23805. doi: 10.1029/2012GL053695
Appendix
Discipline-specific terminology and a range of organizations, projects, and programs are identified in the manuscript using acronyms. Table A1 lists the acronyms and provides universal resource locaters (when available) to provide the reader with easy access to more information associated with each acronym.
Table A1. Definitions and universal resource locators (when applicable) for acronyms used in this manuscript.
Keywords: ships, observations, meteorology, physical oceanography, biogeochemistry, data management, climatology
Citation: Smith SR, Alory G, Andersson A, Asher W, Baker A, Berry DI, Drushka K, Figurskey D, Freeman E, Holthus P, Jickells T, Kleta H, Kent EC, Kolodziejczyk N, Kramp M, Loh Z, Poli P, Schuster U, Steventon E, Swart S, Tarasova O, de la Villéon LP and Vinogradova-Shiffer N (2019) Ship-Based Contributions to Global Ocean, Weather, and Climate Observing Systems. Front. Mar. Sci. 6:434. doi: 10.3389/fmars.2019.00434
Received: 09 November 2018; Accepted: 05 July 2019;
Published: 02 August 2019.
Edited by:
Minhan Dai, Xiamen University, ChinaReviewed by:
Andrea Storto, NATO Centre for Maritime Research and Experimentation, ItalySophie E. Cravatte, Institut de Recherche pour le Développement (IRD), France
Wilhelm Petersen, Institute of Coastal Research, Helmholtz-Zentrum Geesthacht, Germany
Copyright © 2019 Smith, Alory, Andersson, Asher, Baker, Berry, Drushka, Figurskey, Freeman, Holthus, Jickells, Kleta, Kent, Kolodziejczyk, Kramp, Loh, Poli, Schuster, Steventon, Swart, Tarasova, de la Villéon and Vinogradova-Shiffer. This is an open-access article distributed under the terms of the Creative Commons Attribution License (CC BY). The use, distribution or reproduction in other forums is permitted, provided the original author(s) and the copyright owner(s) are credited and that the original publication in this journal is cited, in accordance with accepted academic practice. No use, distribution or reproduction is permitted which does not comply with these terms.
*Correspondence: Shawn R. Smith, smith@coaps.fsu.edu