Filtering the NPP-VIIRS Nighttime Light Data for Improved Detection of Settlements in Africa


1
State Key Laboratory of Remote Sensing Science, Aerospace Information Research Institute, Chinese Academy of Sciences, Beijing 100101, China
2
University of Chinese Academy of Sciences, Beijing 100049, China
3
Department of Geoscience and Remote Sensing, Delft University of Technology, 2628 CN Delft, The Netherlands
4
Key Laboratory for Geographical Process Analysis & Simulation of Hubei Province, College of Urban and Environmental Sciences, Central China Normal University, Wuhan 430079, China
*
Author to whom correspondence should be addressed.
Remote Sens. 2019, 11(24), 3002; https://doi.org/10.3390/rs11243002
Submission received: 1 November 2019
/
Revised: 27 November 2019
/
Accepted: 5 December 2019
/
Published: 13 December 2019
Abstract
:Observing and understanding changes in Africa is a hotspot in global ecological environmental research since the early 1970s. As possible causes of environmental degradation, frequent droughts and human activities attracted wide attention. Remote sensing of nighttime light provides an effective way to map human activities and assess their intensity. To identify settlements more effectively, this study focused on nighttime light in the northern Equatorial Africa and Sahel settlements to propose a new method, namely, the patches filtering method (PFM) to identify nighttime lights related to settlements from the National Polar-orbiting Partnership Visible Infrared Imaging Radiometer Suite (NPP-VIIRS) monthly nighttime light data by separating signal components induced by biomass burning, thereby generating a new annual image in 2016. The results show that PFM is useful for improving the quality of NPP-VIIRS monthly nighttime light data. Settlement lights were effectively separated from biomass burning lights, in addition to capturing the seasonality of biomass burning. We show that the new 2016 nighttime light image can very effectively identify even small settlements, notwithstanding their fragmentation and unstable power supply. We compared the image with earlier NPP-VIIRS annual nighttime light data from the National Oceanic and Atmospheric Administration (NOAA) National Center for Environmental Information (NCEI) for 2016 and the Sentinel-2 prototype Land Cover 20 m 2016 map of Africa released by the European Space Agency (ESA-S2-AFRICA-LC20). We found that the new annual nighttime light data performed best among the three datasets in capturing settlements, with a high recognition rate of 61.8%, and absolute superiority for settlements of 2.5 square kilometers or less. This shows that the method separates biomass burning signals very effectively, while retaining the relatively stable, although dim, lights of small settlements. The new 2016 annual image demonstrates good performance in identifying human settlements in sparsely populated areas toward a better understanding of human activities.
1. Introduction
Nighttime light is a good indicator of human activity [1,2,3]. Satellite-borne imaging radiometers capture accurate nighttime light data, thus providing the opportunity to study the nighttime light quantitatively in large areas [4]. Such data enable multiple applications, e.g., estimation of socioeconomic indicators [5,6,7,8,9], urbanization monitoring [10,11,12], fishery detection [13,14], detection of gas flares [15,16], impact evaluation of sudden events [17,18,19], and epidemiological research [20,21,22,23]. Nighttime light induced by human beings is mainly generated by electric lighting [24,25]. According to the Energy Progress Report 2019 [26], about 840 million people in the world, mostly concentrated in sub-Saharan Africa, do not have access to electricity. Low power penetration affects the northern Equatorial Africa and Sahel region, where power cuts occur frequently [25,27,28]. The electricity deficit is one of the main problems in the development of this region. Reasons can be sub-optimal electricity infrastructure, nonscheduled black-outs, and relatively low demand induced by high costs of electricity [25,29]. This may limit the application of nighttime light data to detect human settlements in developing regions like northern Equatorial Africa and Sahel. Furthermore, the settlements in Africa are often small and sparsely scattered. In these areas, the nighttime light used to be ignored due to the weak brightness, and even land-use and land-cover maps, based on the classification of multi-spectral satellite images at the high spatial resolution, are often less accurate than in other parts of the world. The aim of this study was to propose a better way to extract information about human activities in northern Equatorial Africa and Sahel from the National Polar-orbiting Partnership Visible Infrared Imaging Radiometer Suite (NPP-VIIRS) monthly nighttime light data.
The visible near-infrared (VNIR) image data acquired by the Defense Meteorological Satellite Program Operational Linescan System (DMSP-OLS) are widely used to capture stable nighttime light [30]. More recent data acquired by the National Polar-orbiting Partnership Visible Infrared Imaging Radiometer Suite (NPP-VIIRS) were applied for the same purpose [31]. The DMSP-OLS nighttime stable light data span the period from 1992 to 2013, and it remains an essential element of current and future observation records as the longest surviving nighttime light data in the world. On the other hand, the applicability of the data is affected by the coarse spatial resolution (about 2.7 km), the lack of on-board calibration, the strong saturation effect, and the dataset being no longer released past 2013 [15,32,33,34]. Compared to DMSP-OLS, NPP-VIIRS has the advantages of higher spatial resolution (about 742 m) and on-board calibration, and it is not affected by saturation and has a higher dim light sensitivity [19,35,36,37,38].
NPP-VIIRS nighttime light data include daily, monthly, and annual data products. The daily data, which are the original NPP-VIIRS data, are not filtered for sunlight, moonlight, stray light, lightning, clouds, high-energy particles (HEPs), etc. They are often used to detect fisheries and to assess sudden events. The monthly dataset, available from 2012, is filtered for sunlight, moonlight, stray light, lightning, clouds, and high-energy particles (HEPs), but is still affected by background noise and biomass burning. NPP-VIIRS annual data are produced by the National Oceanic and Atmospheric Administration (NOAA) National Center for Environmental Information (NCEI). After removing the influence of sunlight, moonlight, and other factors from the daily data, the largest and the smallest radiance values within a year are removed as outliers. The outlier removal does not stop until the change in standard deviation in each iteration is less than 1% [31]. After background noise removal and averaging the processed daily data, the annual NPP-VIIRS nighttime light data are obtained [31]. This method to generate the annual nighttime light data product, based on a huge amount of daily data, is complex and computationally heavy for large areas. In the past, for a long time, only the 2015 annual data were released, while the 2016 annual image was published by the NCEI in June 2019. For studies on human activities over a longer time scale, the two years of data are far from enough. More importantly, the data retain only persistent nighttime lights by eliminating noise and almost all unstable nighttime lights, including some anthropic lights in developing regions affected by unreliable power supply. By contrast, the monthly data, where most types of noise were filtered out, retain weak nighttime light from small settlements and intermittent nighttime lights in the regions with unreliable power supply. Thus, monthly data might be further processed to obtain annual images to better capture small or power-starved settlements.
Earlier studies on the detection and characterization of human settlements using nighttime light data relied on the estimation of an optimal threshold on radiance according to reference data [39,40,41], on using ancillary data [12,42,43], and on change detection [44]. These methods often rely on other data, and they focus on the urban areas in developed countries (e.g., cities) rather than small settlements in developing regions. In addition, these methods can hardly be applied to NPP-VIIRS monthly data due to the frequent occurrence of biomass burning. Therefore, we propose a new method to filter NPP-VIIRS monthly nighttime light data for improving the detection of small and sparsely scattered settlements in the northern Equatorial Africa and Sahel region.
In the application of NPP-VIIRS monthly nighttime light data, the biggest obstacle to obtain images that only retain information about settlements comes from biomass burning [31]. Some scientists thought that biomass burning might have impacted the ecology of the African savanna for millions of years since human beings started using wood for cooking [45]. Biomass burning plays various roles in daily life, economy, and agriculture [45,46,47,48]. Biomass burning is, therefore, also due to human activities, but not necessarily associated with permanent settlements.
Biomass burning emits light at night, which can be captured by sensors; thus, it cannot be visually distinguished in a direct manner from the light related to settlements in nighttime light data. The biomass burning signal is usually separated from the settlement signal by the “masking” or by the “threshold” filtering method. The latter is applied by estimating a threshold radiance due to biomass burning and removing the values below the threshold [40]. Since the biomass burning nighttime radiance often exceeds 2 × 10⁻⁹ W∙cm−2∙sr−1, the threshold value must be higher than that. It should be noted that the nighttime light radiance of many small settlements might be less than 2 × 10⁻⁹ W∙cm−2∙sr−1, especially in developing regions; thus, the “threshold” method inevitably filters out useful information on nighttime light related to human settlements. In some studies, nighttime light from biomass burning was removed with the help of masks generated from DMSP-OLS stable images [19,36,37,40]. As mentioned above, DMSP-OLS data are no longer available after 2013. Although there are still studies using DMSP images to filter NPP-VIIRS monthly images, this approach carries some risk since the release of DMSP-OLS was discontinued, i.e., no concurrent DMSP-OLS and NPP-VIIRS data are available anymore. Moreover, the lower spatial and radiometric resolution of DMSP data limits the application of this method. When studies target a small area, e.g., a city, the selection of filtering methods for monthly data is not critical, and the biomass burning light can even be removed manually. However, for vast areas, especially where there are many unpopulated areas and settlements of very different sizes, both methods can filter out much light from small settlements or out of the DMSP masks. Therefore, it is necessary to apply a better filter to monthly data. In addition, more than half of biomass burnings take place in savanna, with 46% of worldwide biomass burning events occurring in Africa to manage savanna in the belt 20° north (N) to 25° south (S) [46]. Therefore, accurate and efficient filtering is critical to the studies on nighttime light in Africa.
The objective of this study was to provide a new method (i.e., the patches filtering method, PFM) for filtering NPP-VIIRS monthly nighttime light data to improve the ability to identify small settlements, including small and scattered ones, which required the separation of stable nighttime lights associated with settlements from unstable nighttime lights due to biomass burning. In this study, we developed the patches filtering method (i.e., PFM), a new method to separate unstable nighttime light induced by biomass burning from stable nighttime light in NPP-VIIRS monthly nighttime light data. The method we propose regards connected pixels groups as objects defined by the morphological characteristics of settlement light and biomass burning light in the nighttime light images. Biomass burning light is separated from settlement light taking into account the relatively short duration of biomass burning events. The method is demonstrated by generating a new 2016 annual image to better capture anthropic information.
2. Study Area and Data
2.1. Study Area
The northern Equatorial Africa and Sahel region is a developing region with large differences in size and scale, where settlements are sparse and scattered, with an unstable and unreliable power supply. The region is ideal to evaluate the effectiveness of PFM in identifying settlement nighttime light. If the PFM method can be used successfully in this region, i.e., the new annual image generated by applying PFM provides reliable information on settlements, then the method can also be applied in other parts of Africa and in developing regions around the world.
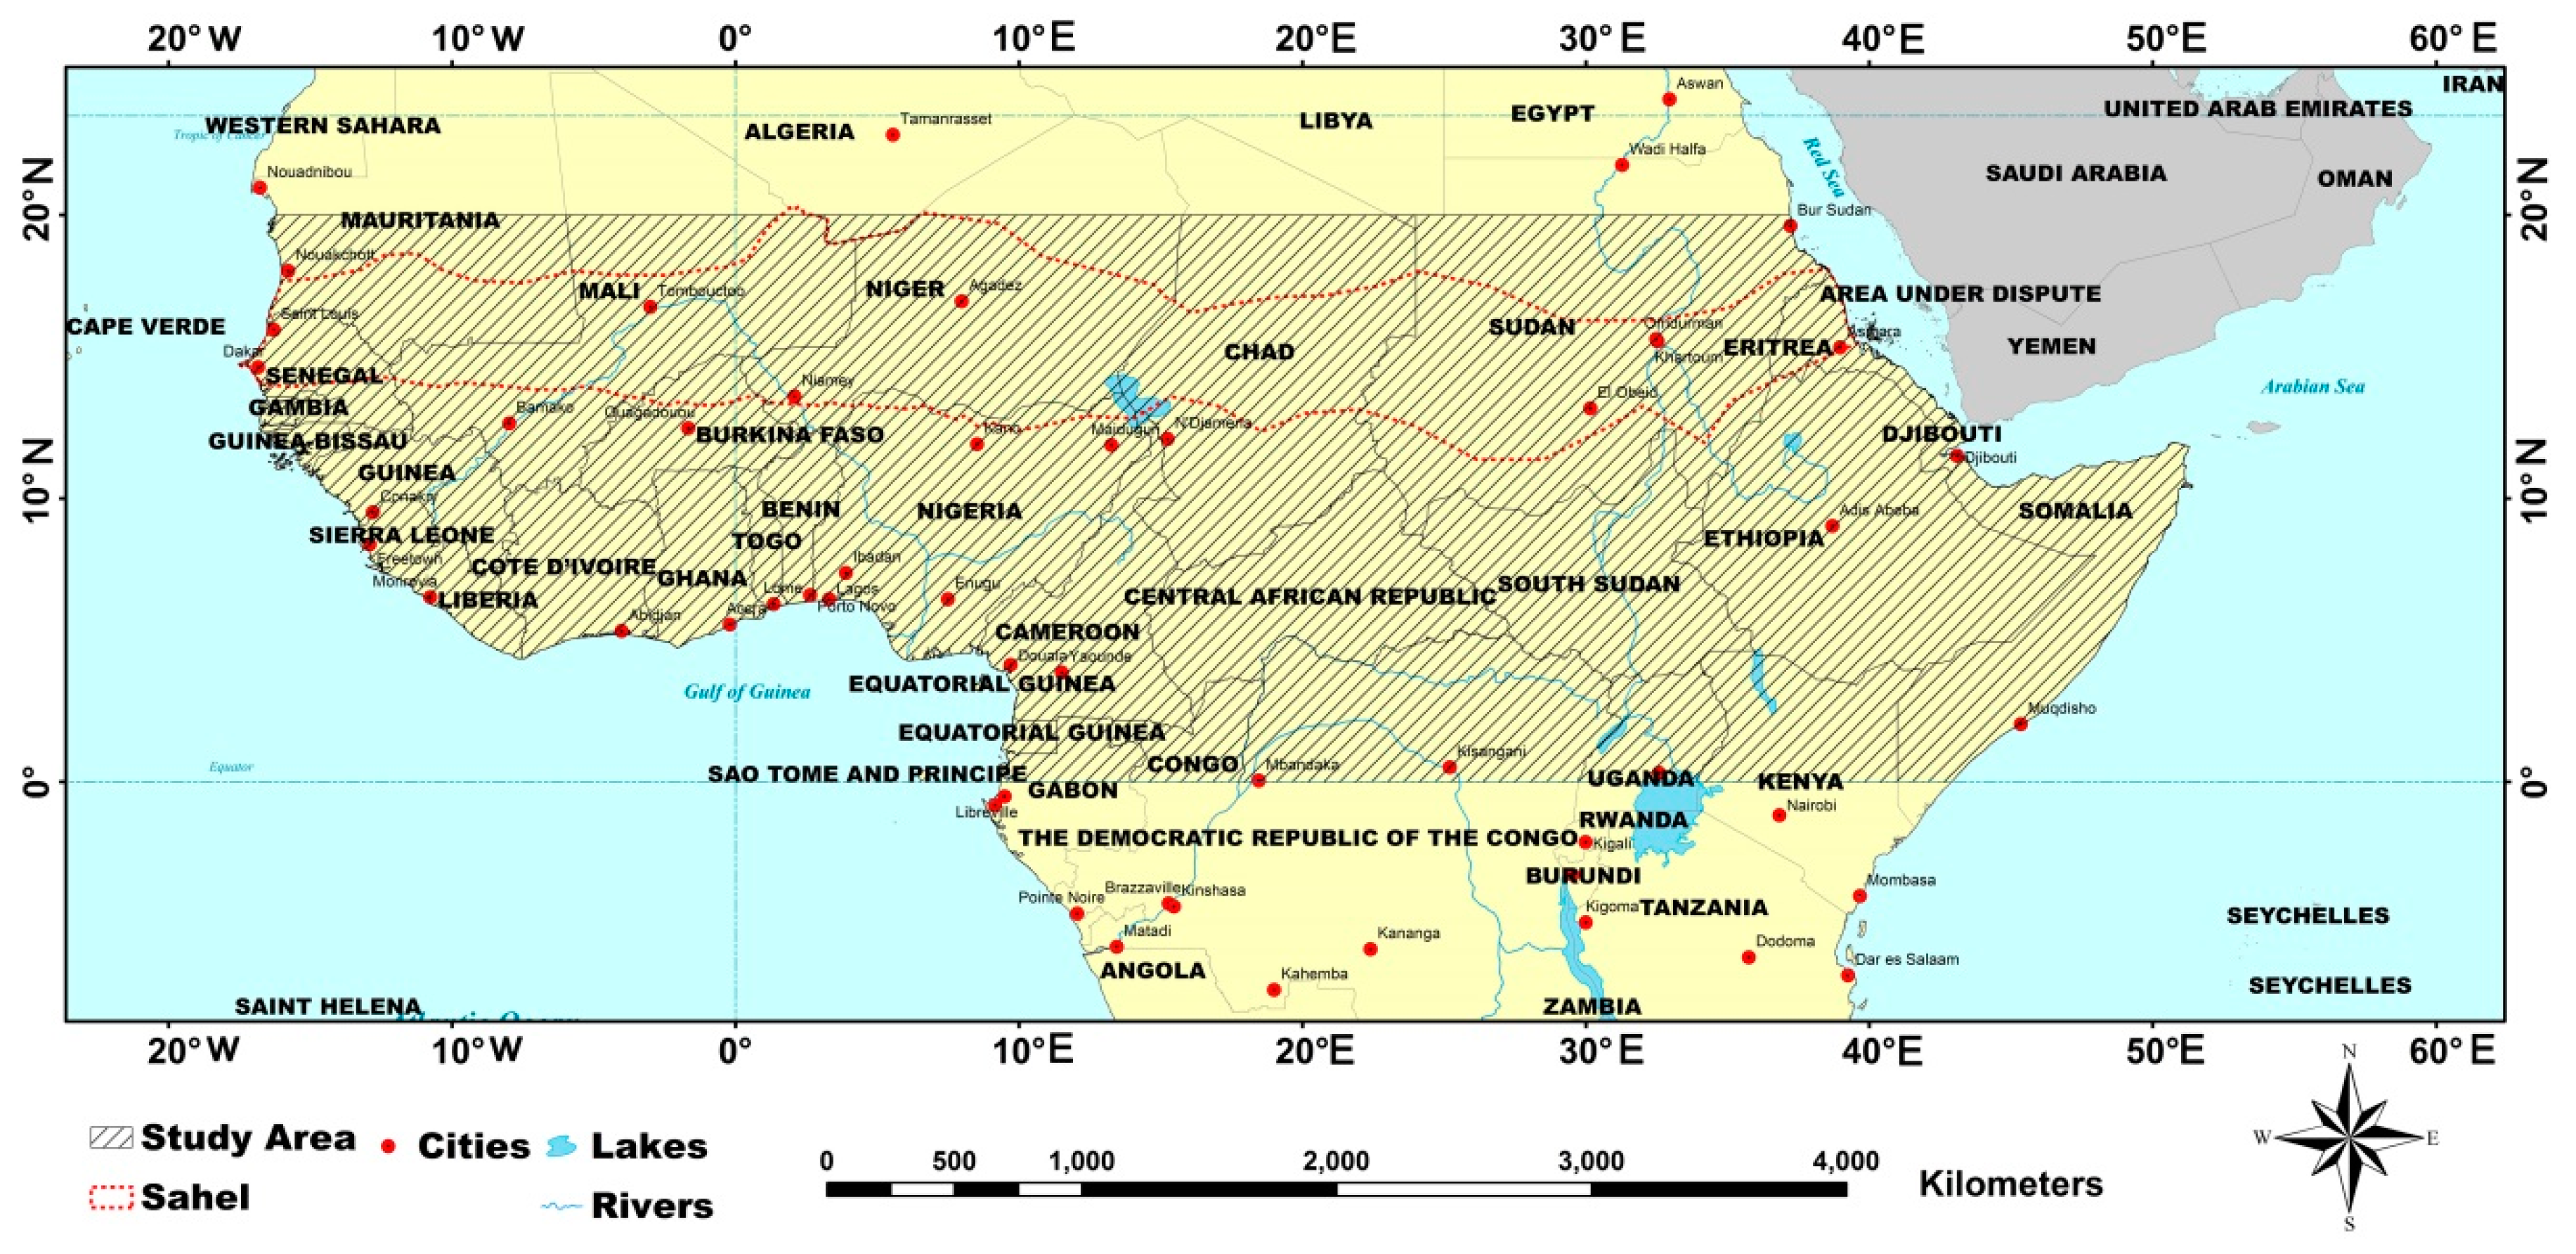
The northern Equatorial Africa and Sahel region is located to the south of the Sahara Desert and adjoins the equator further south. It stretches from the east coast of the Atlantic Ocean to the west coast of the Red Sea for a total of 3800 km, and it covers northern Senegal, southern Mauritania, central Mali, northern Burkina Faso, the extreme south of Algeria, Niger, Nigeria, central Chad, central and southern Sudan, South Sudan, Eritrea, Cameroon, Central African Republic, Ethiopia, etc. The northern Equatorial Africa and Sahel is an N–S eco-climatic transition belt with rainfall from about 100 mm to 1200 mm per year from north to south. In recent decades, the northern Equatorial Africa and Sahel region, where environmental changes are becoming increasingly apparent, was a hotspot of global ecosystem research [48,49,50]. In addition to being affected by natural factors such as inter-annual variability of rainfall, the impact of human activities was one of the critical causes of environmental degradation [51,52,53]. With the dramatic increase in population, infrastructure, and urbanization, the impact of human activities in this area is becoming more and more significant. The situation increases the urgency of research on human activities in the northern Equatorial Africa and Sahel region [54,55,56].
The study area is the northern Equatorial Africa and Sahel region, located between the equator and 20 °N (Figure 1). The study area includes settlements of very different sizes, and it is suitable and broad enough to evaluate the performance of the new approach (i.e., PFM).
2.2. Data Sources
2.2.1. Nighttime Light Image Data
The NPP satellite was launched in October 2011 to gather information about weather and climate. It carries five sensors, including VIIRS, which is the core payload. The VIIRS sensor acquires radiometric data in 22 spectral bands in the range from 0.412 to 12.01 μm, including five high-spatial-resolution bands (375 m at nadir), sixteen moderate-spatial-resolution bands (742 m at nadir), and a day/night band (DNB) (spatial resolution 742 m) where the nighttime light is observed [57]. The specifications of the NPP-VIIRS monthly nighttime light data are shown in Table 1. The nominal (pre-flight) radiometric performance, namely, the minimum detectable radiance (Table 1), was exceeded after developing a stray-light correction using on-orbit calibration data [58].
NPP-VIIRS (L1B data product, calibrated top-of-atmosphere radiance) monthly nighttime light data from January 2015 to December 2017 were the main data in this study (available online: https://www.ngdc.noaa.gov/eog/viirs/download_dnb_composites.html) [59]. The NPP-VIIRS 2016 annual nighttime light image from the NCEI was taken as a reference to evaluate the new annual image and its capability to identify the settlements in the study area (available online: https://www.ngdc.noaa.gov/eog/viirs/download_dnb_composites.html).
2.2.2. Auxiliary Data
Three auxiliary datasets were applied in this study to evaluate the new annual nighttime light image generated in this study, including the Sentinel-2 prototype Land Cover 20 m 2016 map of Africa released by the European Space Agency (ESA-S2-AFRICA-LC20), the global land-cover and land-use reference data derived from the Geo-Wiki crowdsourcing platform [60], and high-resolution Google Earth images.
The ESA-S2-AFRICA-LC20 data were generated from Sentinel-2A observations from December 2015 to December 2016. ESA-S2-AFRICA-LC20 data represent the first land-use dataset at such a high resolution of 20 m in 2016 for Africa [61]. It is available online at http://2016africalandcover20m.esrin.esa.int/.
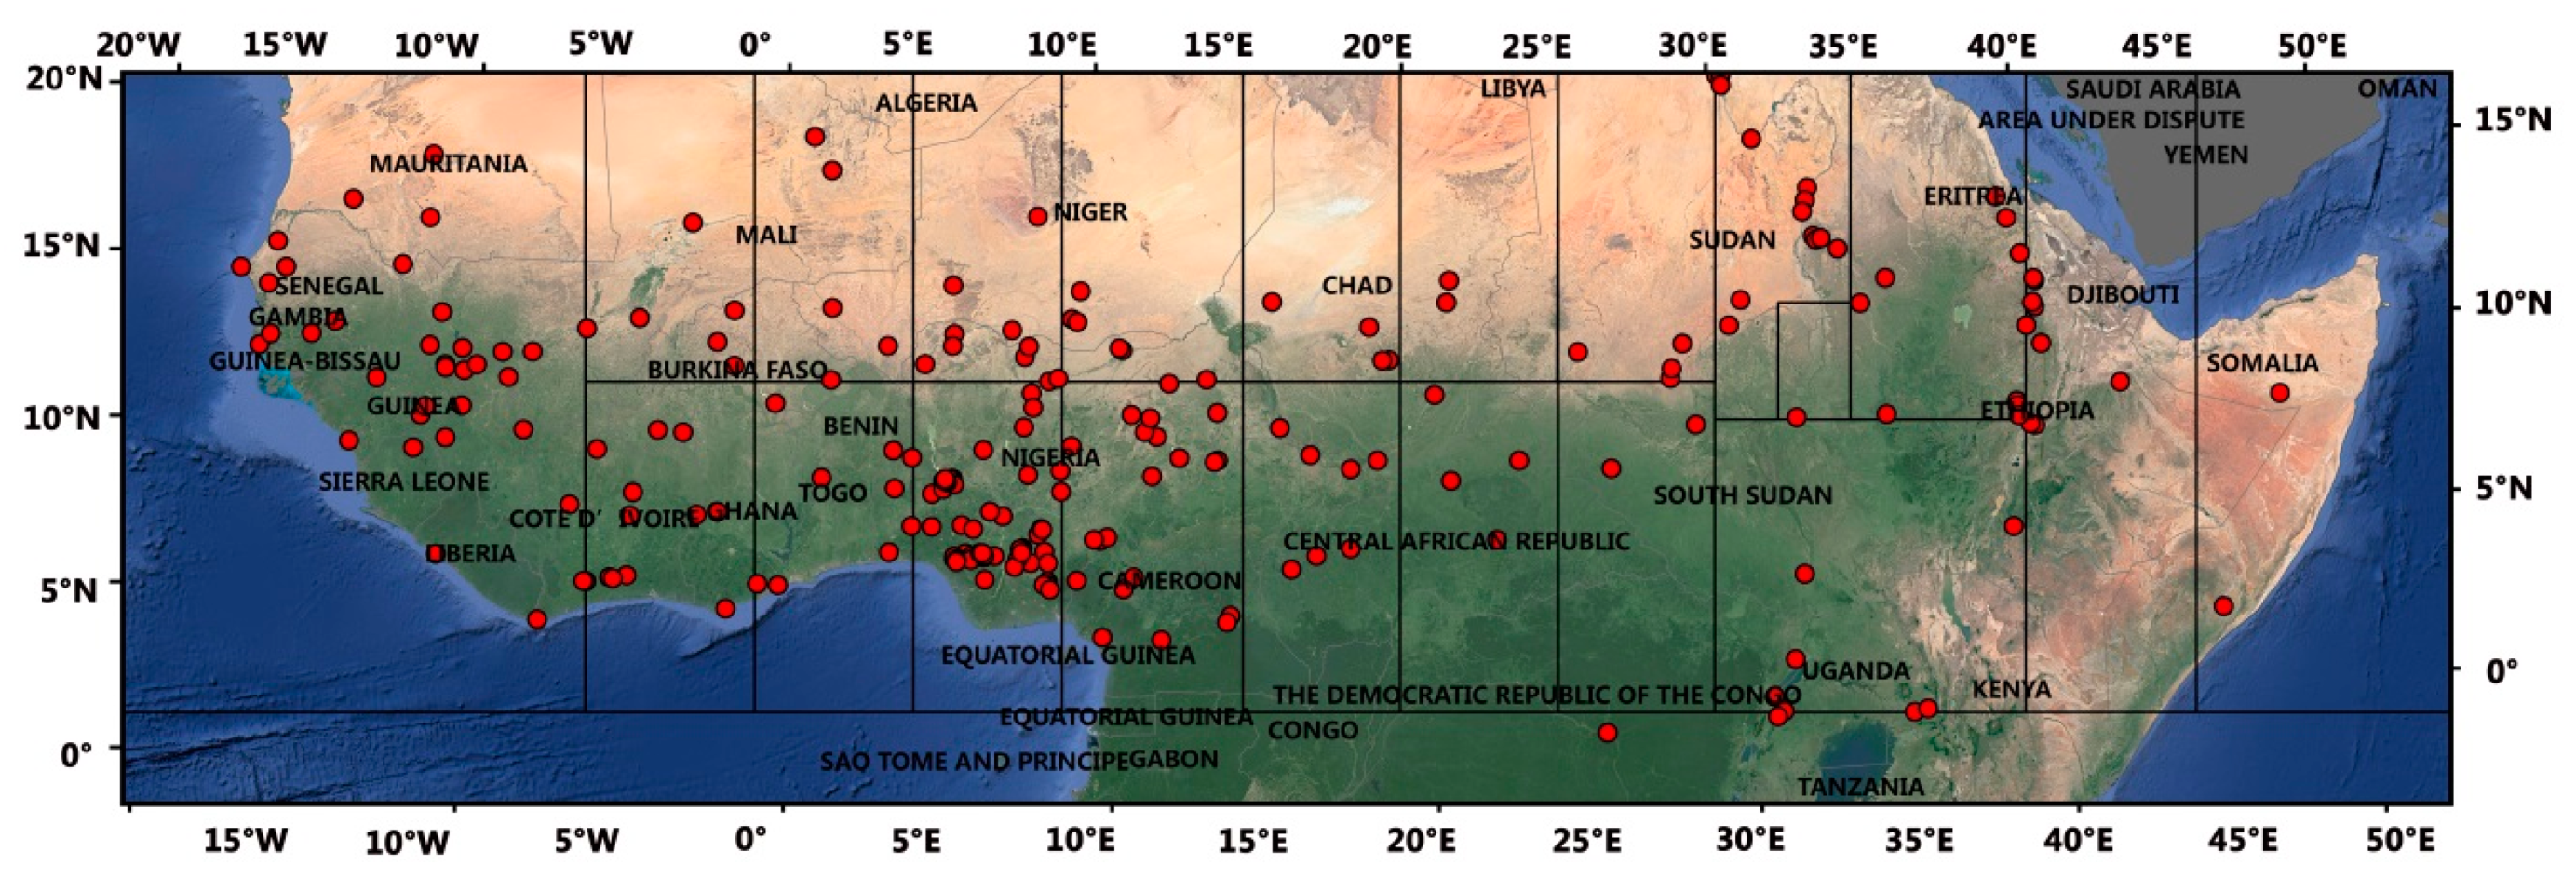
The global land-cover and land-use reference data derived from the Geo-Wiki (http://geo-wiki.org/) crowdsourcing platform provide information on reference data that can be used to train a classifier [60]. This dataset was deemed optimal to support the interpretation of high- to medium-resolution satellite image data. Over 100,000 unique locations were sampled globally for 10 types of land cover and land use, including urban areas. To evaluate the capability of the new annual nighttime light image to identify anthropic light related to settlements, we increased from 40 to 225 the number of reference settlements evenly throughout the study area and measured their areas with the help of high-resolution Google Earth images during the data preparation phase (Figure 2). The reference settlements were grouped according to the size classes in Table 2.
3. Methodology
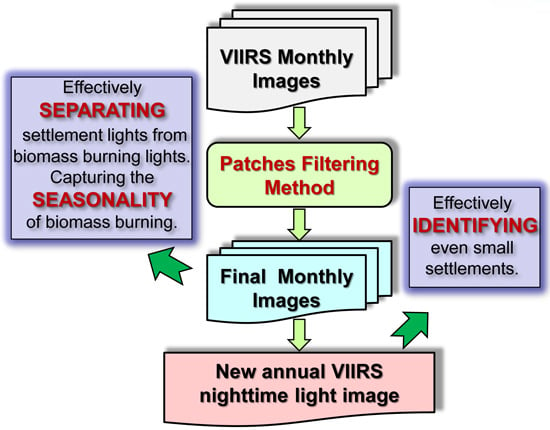
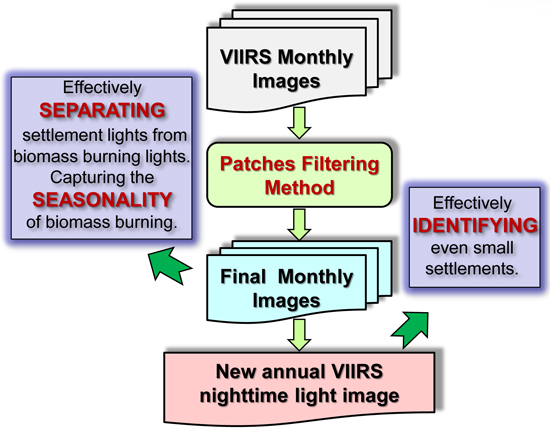
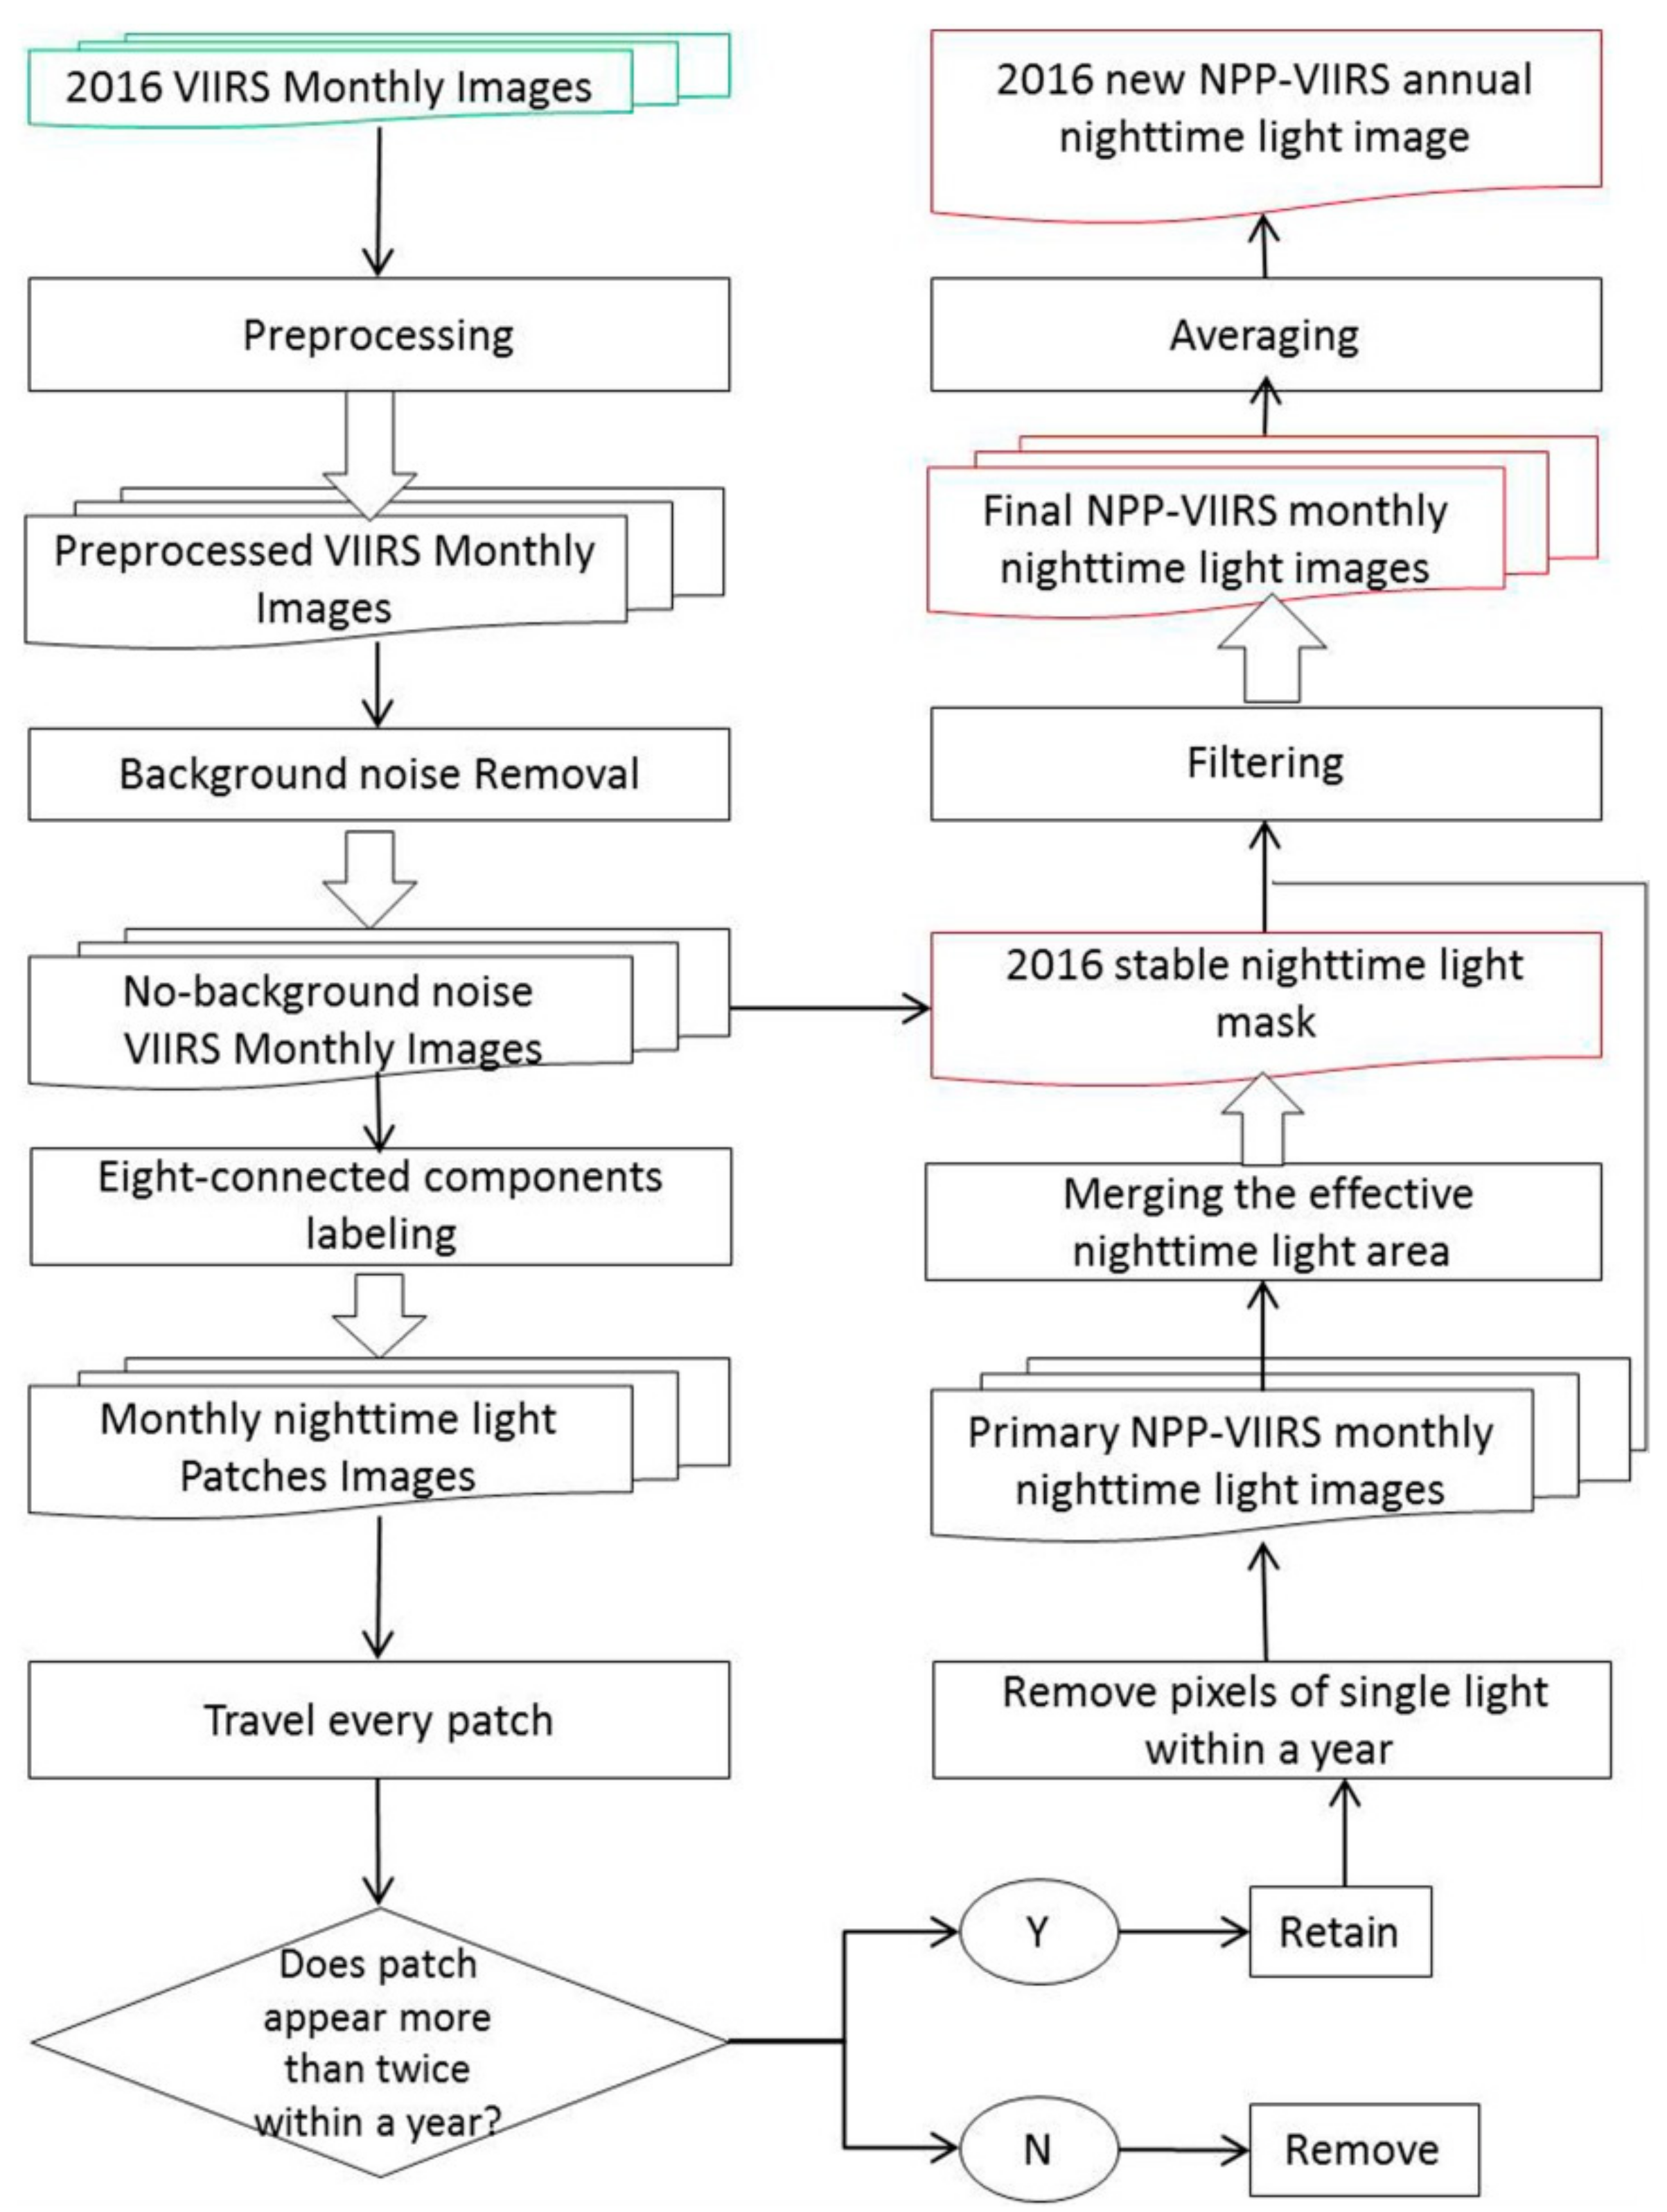
Although the effects of sunlight, moonlight, clouds, high-energy particles (HEPs), and stray light were removed, the NPP-VIIRS monthly nighttime light data are still subject to the effects of the background noise and biomass burning. These nighttime light signals interfere with information on settlements in the nighttime light images. To filter out the noise and identify the signal related to biomass burning, we propose the PFM method in this study (see Figure 3). The new 2016 annual nighttime light image was generated to improve the capability of existing nighttime light products to identify human settlements in the northern Equatorial Africa and Sahel.
3.1. Preprocessing
In this study, all of the datasets were re-projected to WGS_1984_Lambert_Azimuthal_Equal_Area and clipped to the study area. The raster images were resampled to the spatial resolution of 500 m.
3.2. Background Noise Removal
The nighttime light associated with settlements and biomass burning appears in images in the form of patches. Scattered background noise appears throughout the monthly images and should be removed, but the weaker signal associated with either settlements or biomass burning is assessed as being noise when applying a threshold to observed radiance. This hinders the separation of the settlement and biomass burning signal components. Generally, the background noise is removed by setting the value in the areas (background) of radiance smaller than the threshold to zero. The threshold is estimated by sampling radiance in a lake, bare land, and any other areas without illumination. Because the background noise values are different from region to region, especially in a broad study area like northern Equatorial Africa and Sahel, different thresholds should be set in different regions, instead of merely setting the same higher threshold everywhere. Accordingly, a spatially variable threshold was estimated by partitioning the entire study area into 22 latitude-longitude grids, and then sampling each grid (Figure 2). By sampling areas without artificial light sources, different thresholds were obtained for each region, distributed in the range 0.2 to 0.4 × 10⁻⁹ W∙cm−2∙sr−1 (average 0.29 × 10⁻⁹ W∙cm−2∙sr−1, standard deviation 0.12). These thresholds were consistent with current estimates of the minimum detectable radiance (see Table 1). We generated corrected monthly image data with no background noise by setting pixel values smaller than the corresponding threshold to zero.
3.3. Noise Patches Filtering
Like the nocturnal light induced by settlements or gas flares, biomass burning appears as patches in nighttime light satellite images, and the luminance decreases from the center to the edge of each patch. Generally, the nighttime light patches related to settlements are relatively stable [30,31]. Instead, the duration of biomass burning event is much shorter than that of settlement light, and the location changes very frequently within a year. Thus, the biomass burning signal can be distinguished from settlements by exploiting these features.
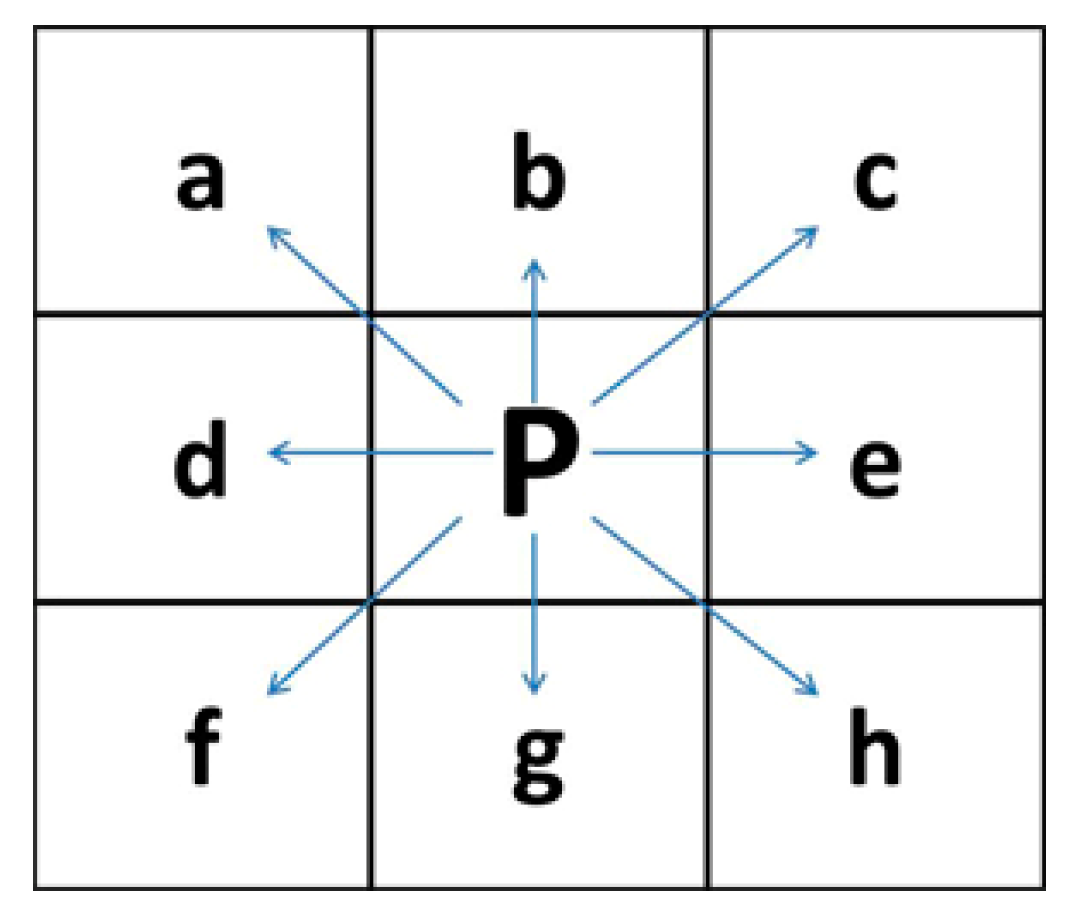
To filter out the biomass burning signals, the nighttime light patches related to settlements were extracted by applying the so-called eight-connected component labeling method [62]. In digital image processing, nighttime light patches larger than a pixel can be detected and delineated as connected objects, which can be recognized, e.g., by using the eight-connected component labeling method. For a pixel P where nighttime light radiance, i.e., spectrally integrated radiance > 0, is detected (Figure 4), the procedure evaluates the neighbors on the top, bottom, left, right, top left, top right, bottom left, and bottom right adjacent pixels and takes P as the seed of a new patch. Then, the adjacent pixels are evaluated and merged with the seed if radiance > 0. The patch grows until no additional adjacent pixel is assessed as lighted. Next, the procedure is repeated for the other pixels. Lighted pixels without neighbors are retained as patches. This leads to identifying patches in the monthly nighttime light images.
We propose the persistence ratio (PR) as a metric of the persistence of nighttime light pixels within a year. The pixels of effective nighttime light radiance (i.e., spectrally integrated radiance > 0) appearing more than twice in the monthly images within a year are called recurrent pixels in this study. PR is expressed by the proportion of recurrent pixels in a patch as follows:
In each nighttime light patch, is the number of recurrent pixels, and is the number of pixels in the patch. The size of nighttime light patches of settlements and gas flares changes through a year; thus, we randomly selected 100 patches for our experiment to evaluate this metric and set the PR threshold at 40%. We concluded that this threshold performs well to distinguish the stable, human-induced patches from the biomass burning lights with rapid change. With a PR greater than 40%, the patches were identified and retained as “persistent”, i.e., related to human settlements or gas flares, while the patches with a PR less than 40% were filtered out, i.e., as related to biomass burning. This led to generating the primary NPP-VIIRS monthly nighttime light images.
Although biomass burning events seldom occur inside settlements or gas flares, the biomass burning signal may be detected in some large patches due to the coarse spatial resolution when a biomass burning event is very close to settlements and gas flares. This implies a risk of removing signals related to stable light during the filtering process. To mitigate this risk, we generated a stable nighttime light mask by merging the nighttime light patches detected in the primary monthly nighttime light images of the antecedent months. By applying the mask, only the nighttime light in the mask was preserved in the no-background noise monthly images to generate the final NPP-VIIRS monthly nighttime light images.
Finally, a new NPP-VIIRS annual nighttime light image was produced by averaging the pixel radiance in the final monthly nighttime light images within the same year. These are our new data products on nighttime light.
3.4. Assessment of the Capability of Nighttime Light Images to Capture Settlements
The NPP-VIIRS annual nighttime light data (from the NCEI) only retain sustained and steady nocturnal light, i.e., mainly in cities or perennial gas flares. Some information on small settlements or with unstable power supply might be removed by mistake in this image product. In fact, even though the duration of nocturnal light in settlements with unstable power is not constant throughout a year, it is longer than that induced by biomass burning and sufficiently long to be extracted from monthly data within a year. Therefore, taking nighttime light patches as objects, the PFM method was used to refine the separation of settlement and biomass burning signal components in the monthly data, and the new, further improved, annual images were obtained.
In order to compare the ability of the new annual image with the NCEI annual image to capture settlements, we defined and applied the nighttime light response index (NLRI), which represents the proportion of nighttime light pixels in settlement patches identified in the land-cover map data from ESA-S2-AFRICA-LC20. NLRI is defined as follows:
where is the number of pixels with spectrally integrated radiance > 0 within the settlements identified in the ESA-S2-AFRICA-LC20 map, and is the total number of NPP-VIIRS pixels of settlements in the ESA-S2-AFRICA-LC20 map. With a value between zero and one, a higher NLRI denotes a better performance in identifying settlements in the nighttime light image, and vice versa, assuming the ESA-S2-AFRICA-LC20 map as a reference.
To evaluate the capability of the new annual nighttime light image to identify settlements of different sizes, we grouped settlements in the ESA-S2-AFRICA-LC20 map into five size classes according to Table 2. Then, we calculated the NLRI for each class by applying the eight-connected component labeling method to extract settlement patches from ESA-S2-AFRICA-LC20. As a further reference, we applied high-resolution Google Earth images to assess whether the new annual image performed better than the NCEI and whether the smaller settlements were identified correctly.
To better evaluate the capability of the two annual nighttime light images and the ESA-S2-AFRICA-LC20 data to detect signals related to settlements, we adopted the method of reference verification, and then compared the locations of the reference settlements with (a) settlements mapped in the ESA-S2-AFRICA-LC20 map, (b) settlements identified in the NCEI NPP-VIIRS nighttime light image, and (c) settlements identified in our new NPP-VIIRS image.
4. Results
4.1. Denoising Performance
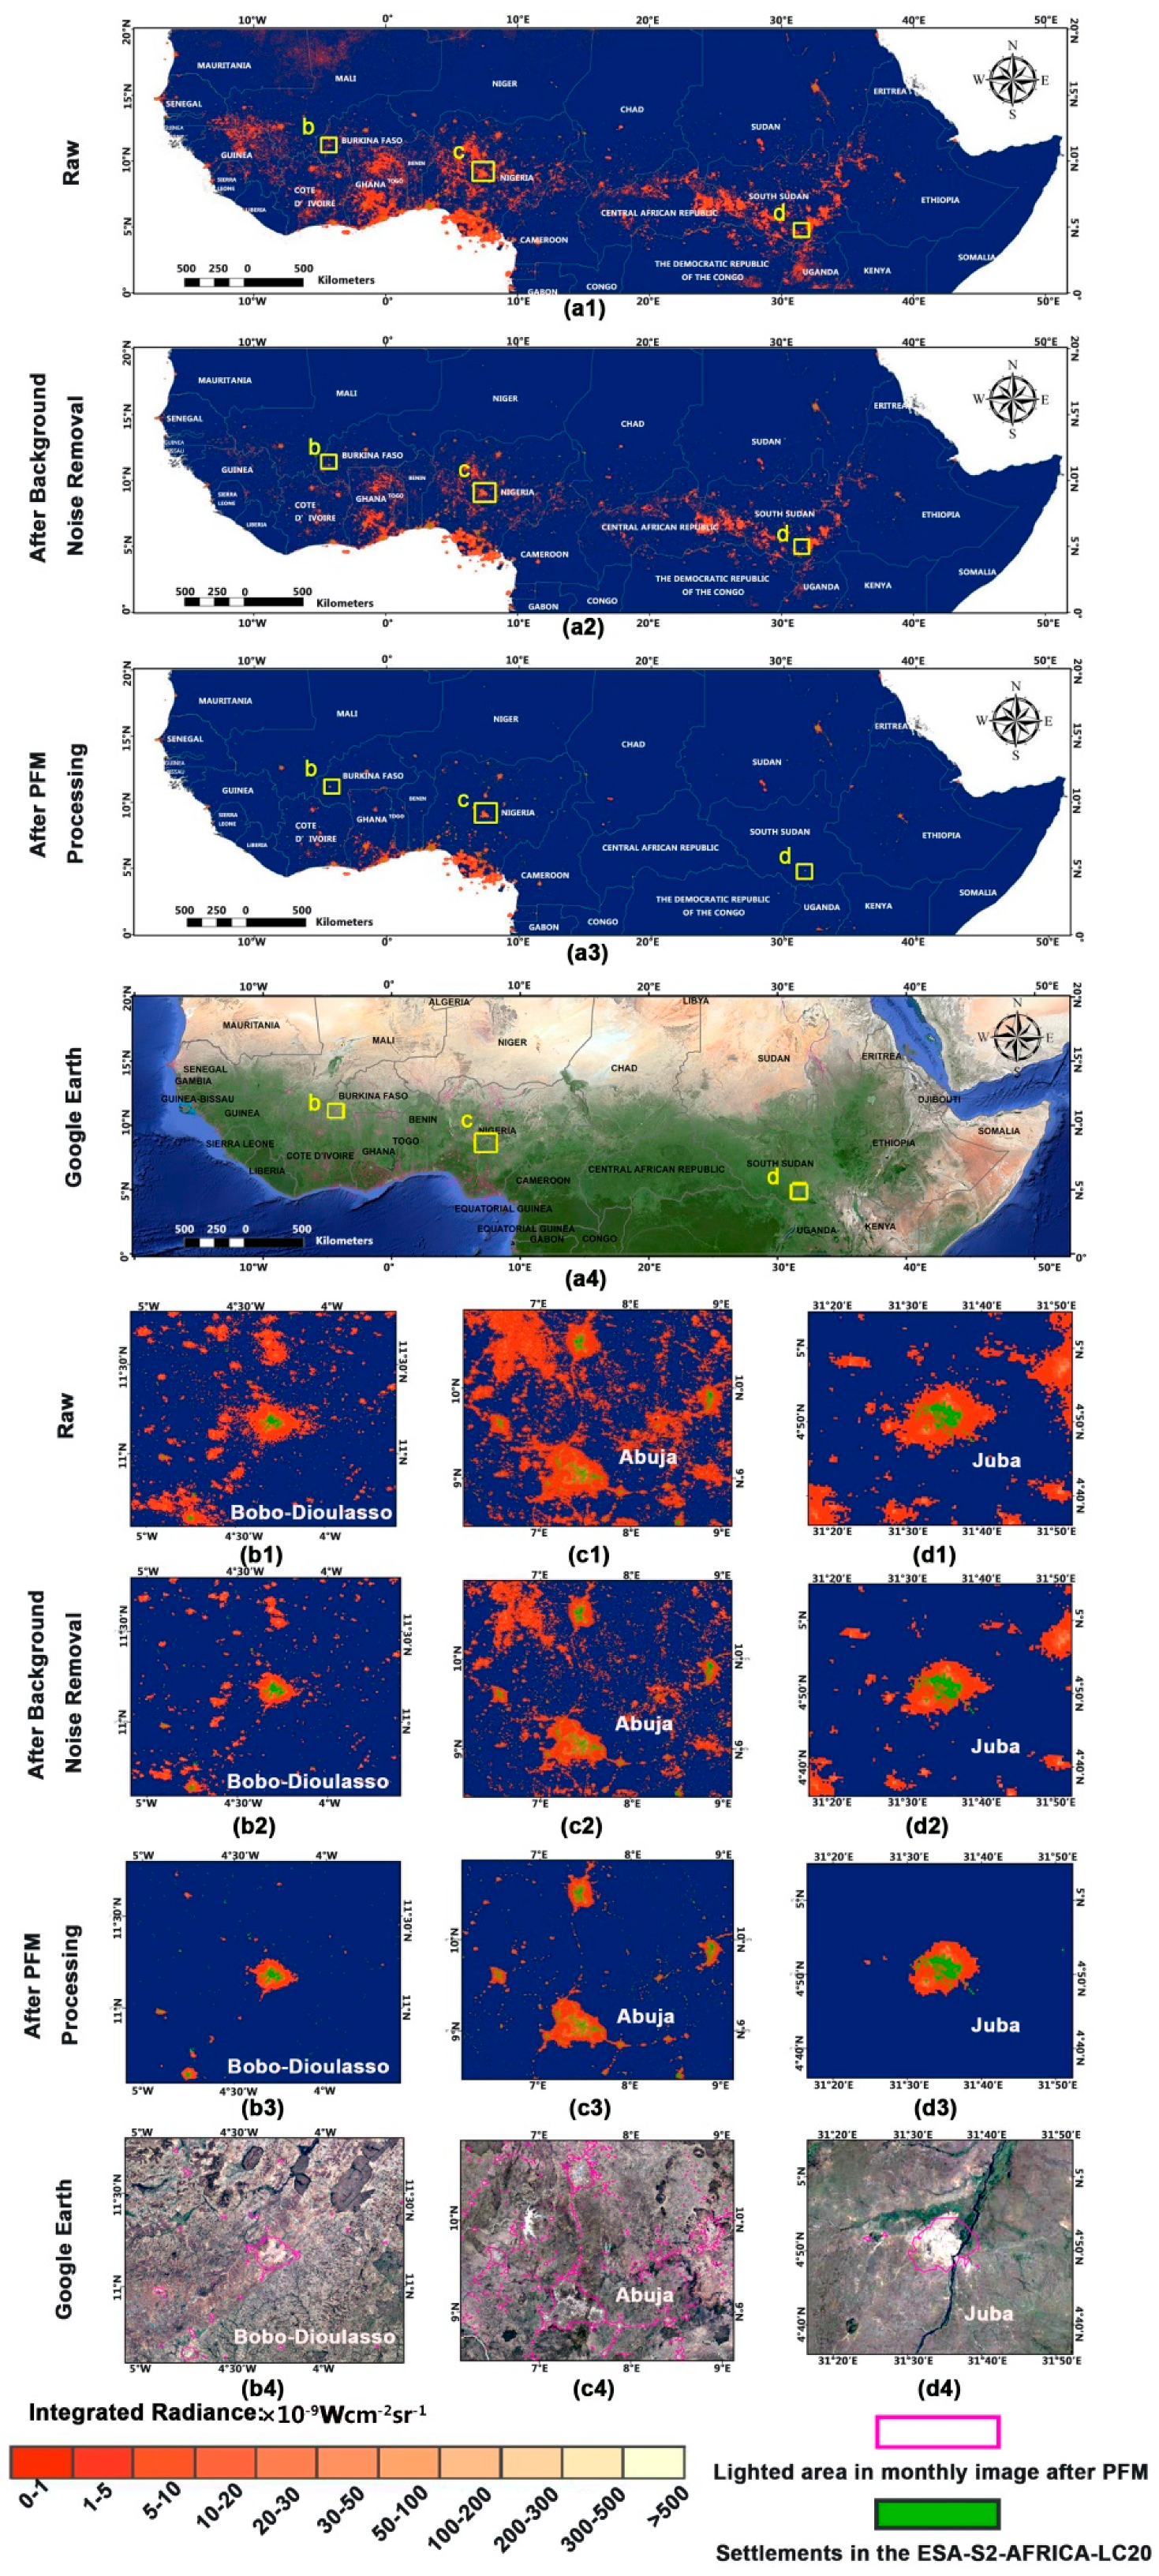
The performance of the PFM method was evaluated by comparing nighttime light patches identified in the NPP-VIIRS nighttime light monthly image in January 2016 with settlements identified in the ESA-S2-AFRICA-LC20 map (Figure 5). More precisely, we evaluated the NPP-VIIRS image (Figure 5(a1)), the image after removal of background noise (Figure 5(a2)), and the image after PFM processing (Figure 5(a3)). We also evaluated the three image products by selecting three urban areas in Bobo-Dioulasso (Burkina Faso), Abuja (Nigeria), and Juba (South Sudan) (Figure 5(b1–3), (c1–3), and (d1–3)). The Google Earth images (Figure 5(a4), (b4), (c4), and (d4)) and the settlements in the ESA-S2-AFRICA-LC20 map are displayed to illustrate where settlements are. As can be seen from Figure 5(a1), (b1), (c1), and (d1), dim lights are scattered in the NPP-VIIRS monthly images, including unlikely locations such as the Sahara Desert around Mauritania (Figure 5(a1)). After background noise removal, only the signal of biomass burning was left in the monthly images. We can see a big difference between the images before and after applying PFM. The processed images (Figure 5(a3), (b3), (c3), and (d3)) are notably cleaner than the raw ones (Figure 5(a2), (b2), (c2), and (d2)). The good denoising performance is more apparent in the three urban areas of Juba, Abuja, and Bobo-Dioulasso (Figure 5(b2–3), (c2–3), and (d2–3)). With the help of the PFM, only patches related to settlements and roads were retained and highlighted.
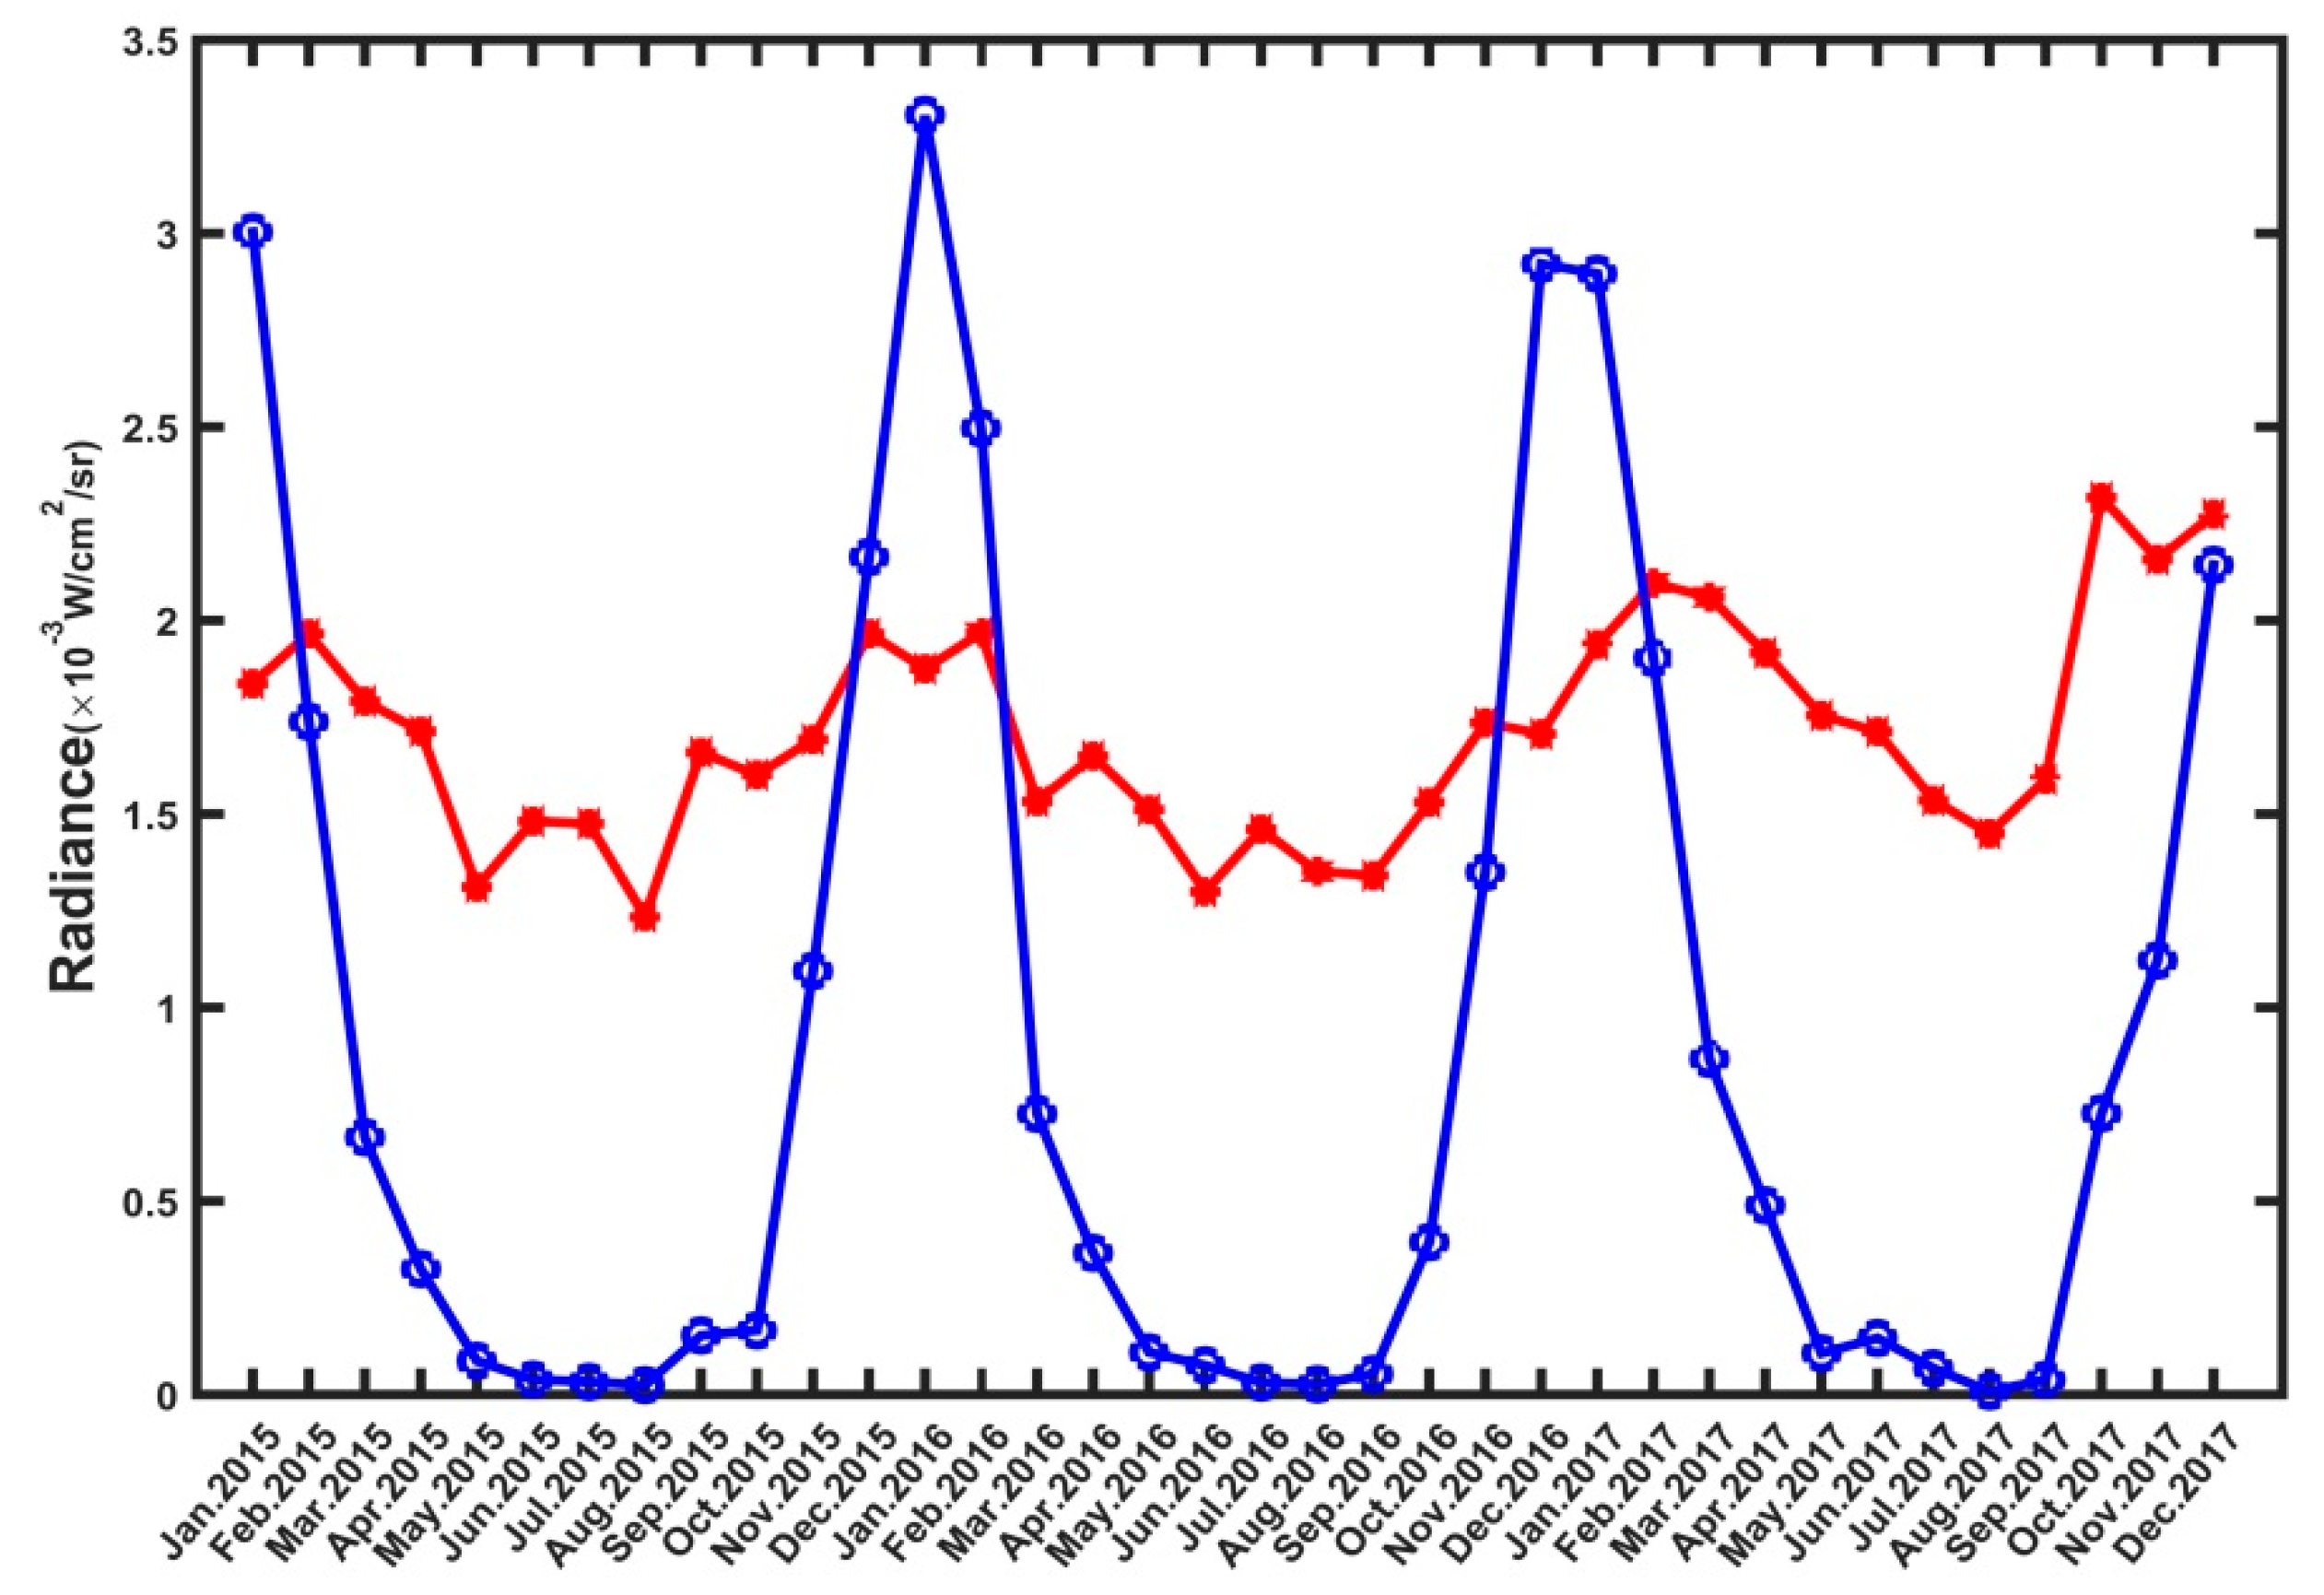
In an effort to further study the performance of PFM, we compared the monthly time series of total spectrally integrated radiance calculated with the monthly NPP-VIIRS nighttime light images, after removal of background noise and with the final monthly images, with the difference being the signal due to biomass burning (Figure 6). The total radiance was calculated as follows:
where TNL is the total radiance within the study area, is the radiance of the i-th pixel, and refers to the total number of the pixels in the study area. We did not consider nighttime light pixels with a maximum radiance higher than 3 × 10⁻⁷ W∙cm−2∙sr−1, most likely gas flares [19]. The main concern was that the fluctuations in the high value of brightness would interfere with the results. We found that the monthly total nighttime light of the removed biomass burning patches had a clear seasonality with a large yearly amplitude. The signals due to biomass burning reached their peak in winter (January and December) and their trough in summer (July and August). After PFM processing, the monthly total nighttime lights in the final NPP-VIIRS monthly images were relatively stable and had no periodic component due to biomass burning. This result provides evidence that the PFM can correctly identify the signal associated with settlements.
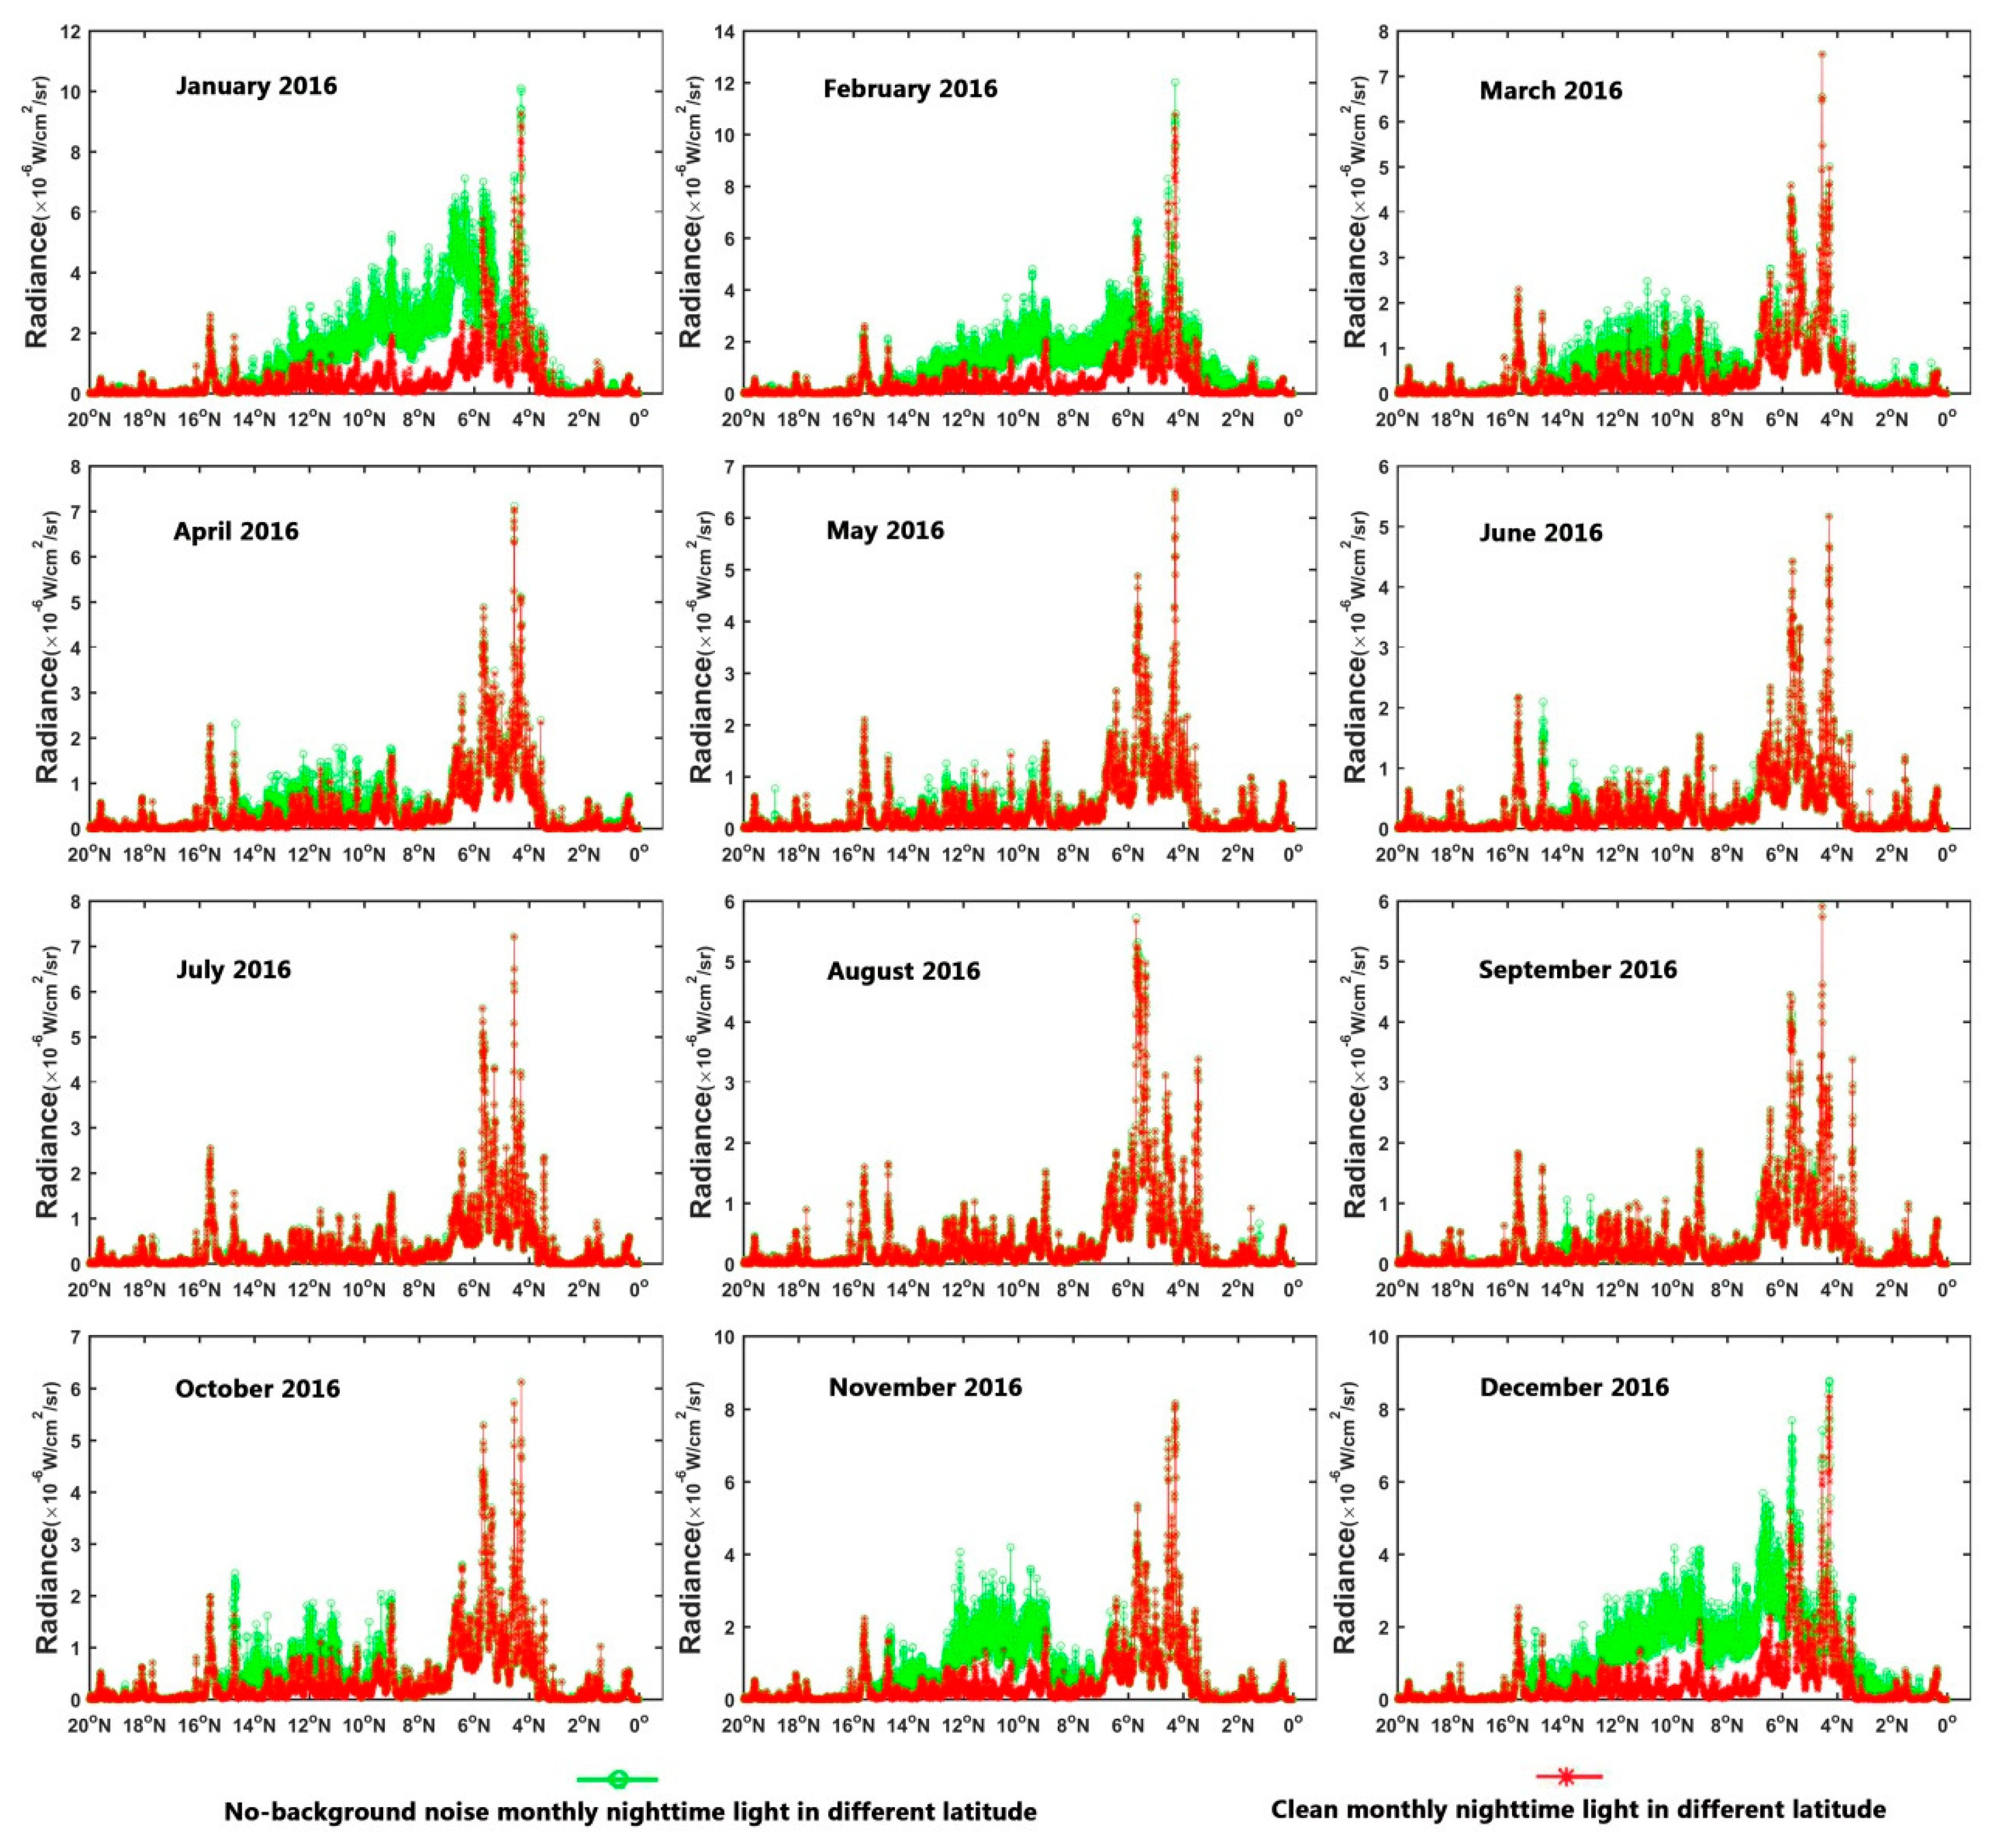
The difference between lights related to settlements and the lights due to biomass burning was further illustrated by the 2016 monthly nighttime light radiance latitudinal distributions of the two signal components in the study area (Figure 7). The radiance values in Figure 7 were obtained by calculating, within each 500-m latitude belt, the total radiance of all patches before and after applying PFM. Biomass burning was extensive and with high intensity in winter and weakest in summer. By analyzing the winter images, we observed that biomass burning occurred mainly below 15 °N. During the dry season (from October to May in the study area), the peak intensity of biomass burning moved southward from 12 °N (in October) to 6 °N (January), and came back to 12 °N in the last months of the dry season. At other times, biomass burning intensity was significantly lower than that in the dry season (winter), and there was no obvious spatial pattern.
4.2. Quantitative Evaluation of the Capability of Nighttime Light Images to Capture Settlements
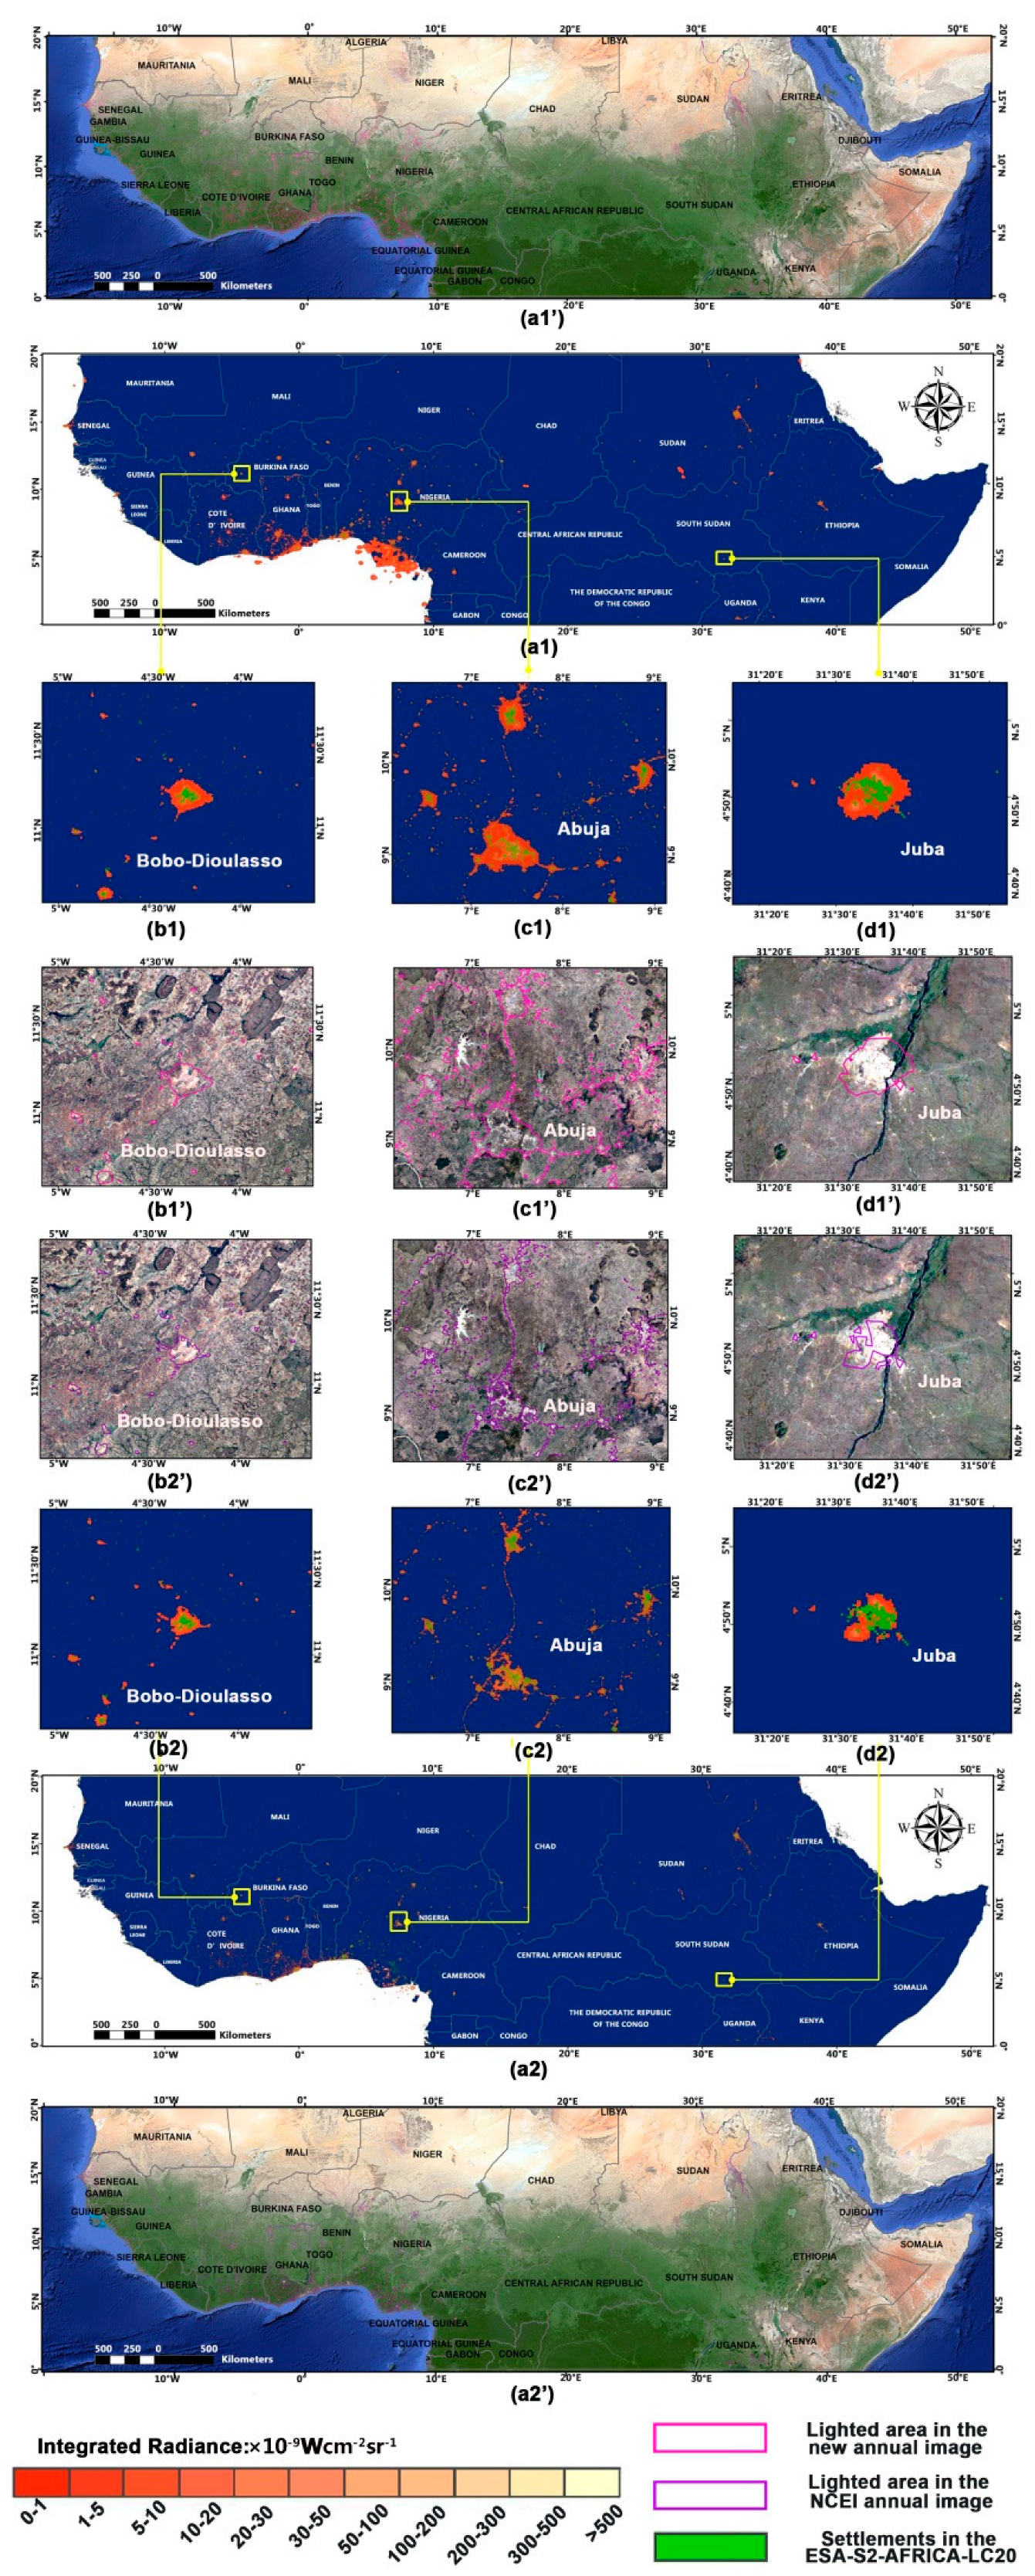
The annual nighttime light image (Figure 8(a1)) and the image from the NCEI (Figure 8(a2)) showed rather different patterns, especially when comparing specific urban areas, i.e., Bobo-Dioulasso (Figure 8(b1,2)), Abuja (Figure 8(c1,2)), and Juba (Figure 8(d1,2)). The nighttime lights were clearer in the annual nighttime light image (Figure 8(a1)) than in the NCEI image (Figure 8(a2)). Overall, with regard to the urban areas, the nighttime light from biomass burning was removed correctly and big cities were captured correctly in both images. Roads were clearly visible in both images around Abuja (Figure 8(c1,2)) by reference to the Google Earth images (Figure 8(c1’,2’)), which implies a similar performance in detecting roads. As for Abuja, the NCEI annual image performed better in delineating big cities (Figure 8(c1,2)). On the other hand, other smaller-size settlements were captured better by the new image than by the NCEI image. Good examples are the areas surrounding the capital of South Sudan Juba and Nigeria Abuja (Figure 8(c1,2), (c1’,2’), (d1,2) and (d1’,2’)). In other words, the new nighttime light image seems more capable than the annual NCEI image in detecting small settlements. To provide further evidence, we applied the NLRI metric.
The NLRIs of the new NPP-VIIRS annual nighttime light image and the NCEI NPP-VIIRS annual nighttime light image in 2016 were calculated separately for the settlement classes listed in Table 2. The NLRI decreased with settlement size reduction, both for the new and the NCEI annual images (Table 3), i.e., as expected, larger settlements were easier to detect by measuring nighttime light. On the other hand, the NLRI was higher for the new annual nighttime light image than for the NCEI image for all settlement classes.
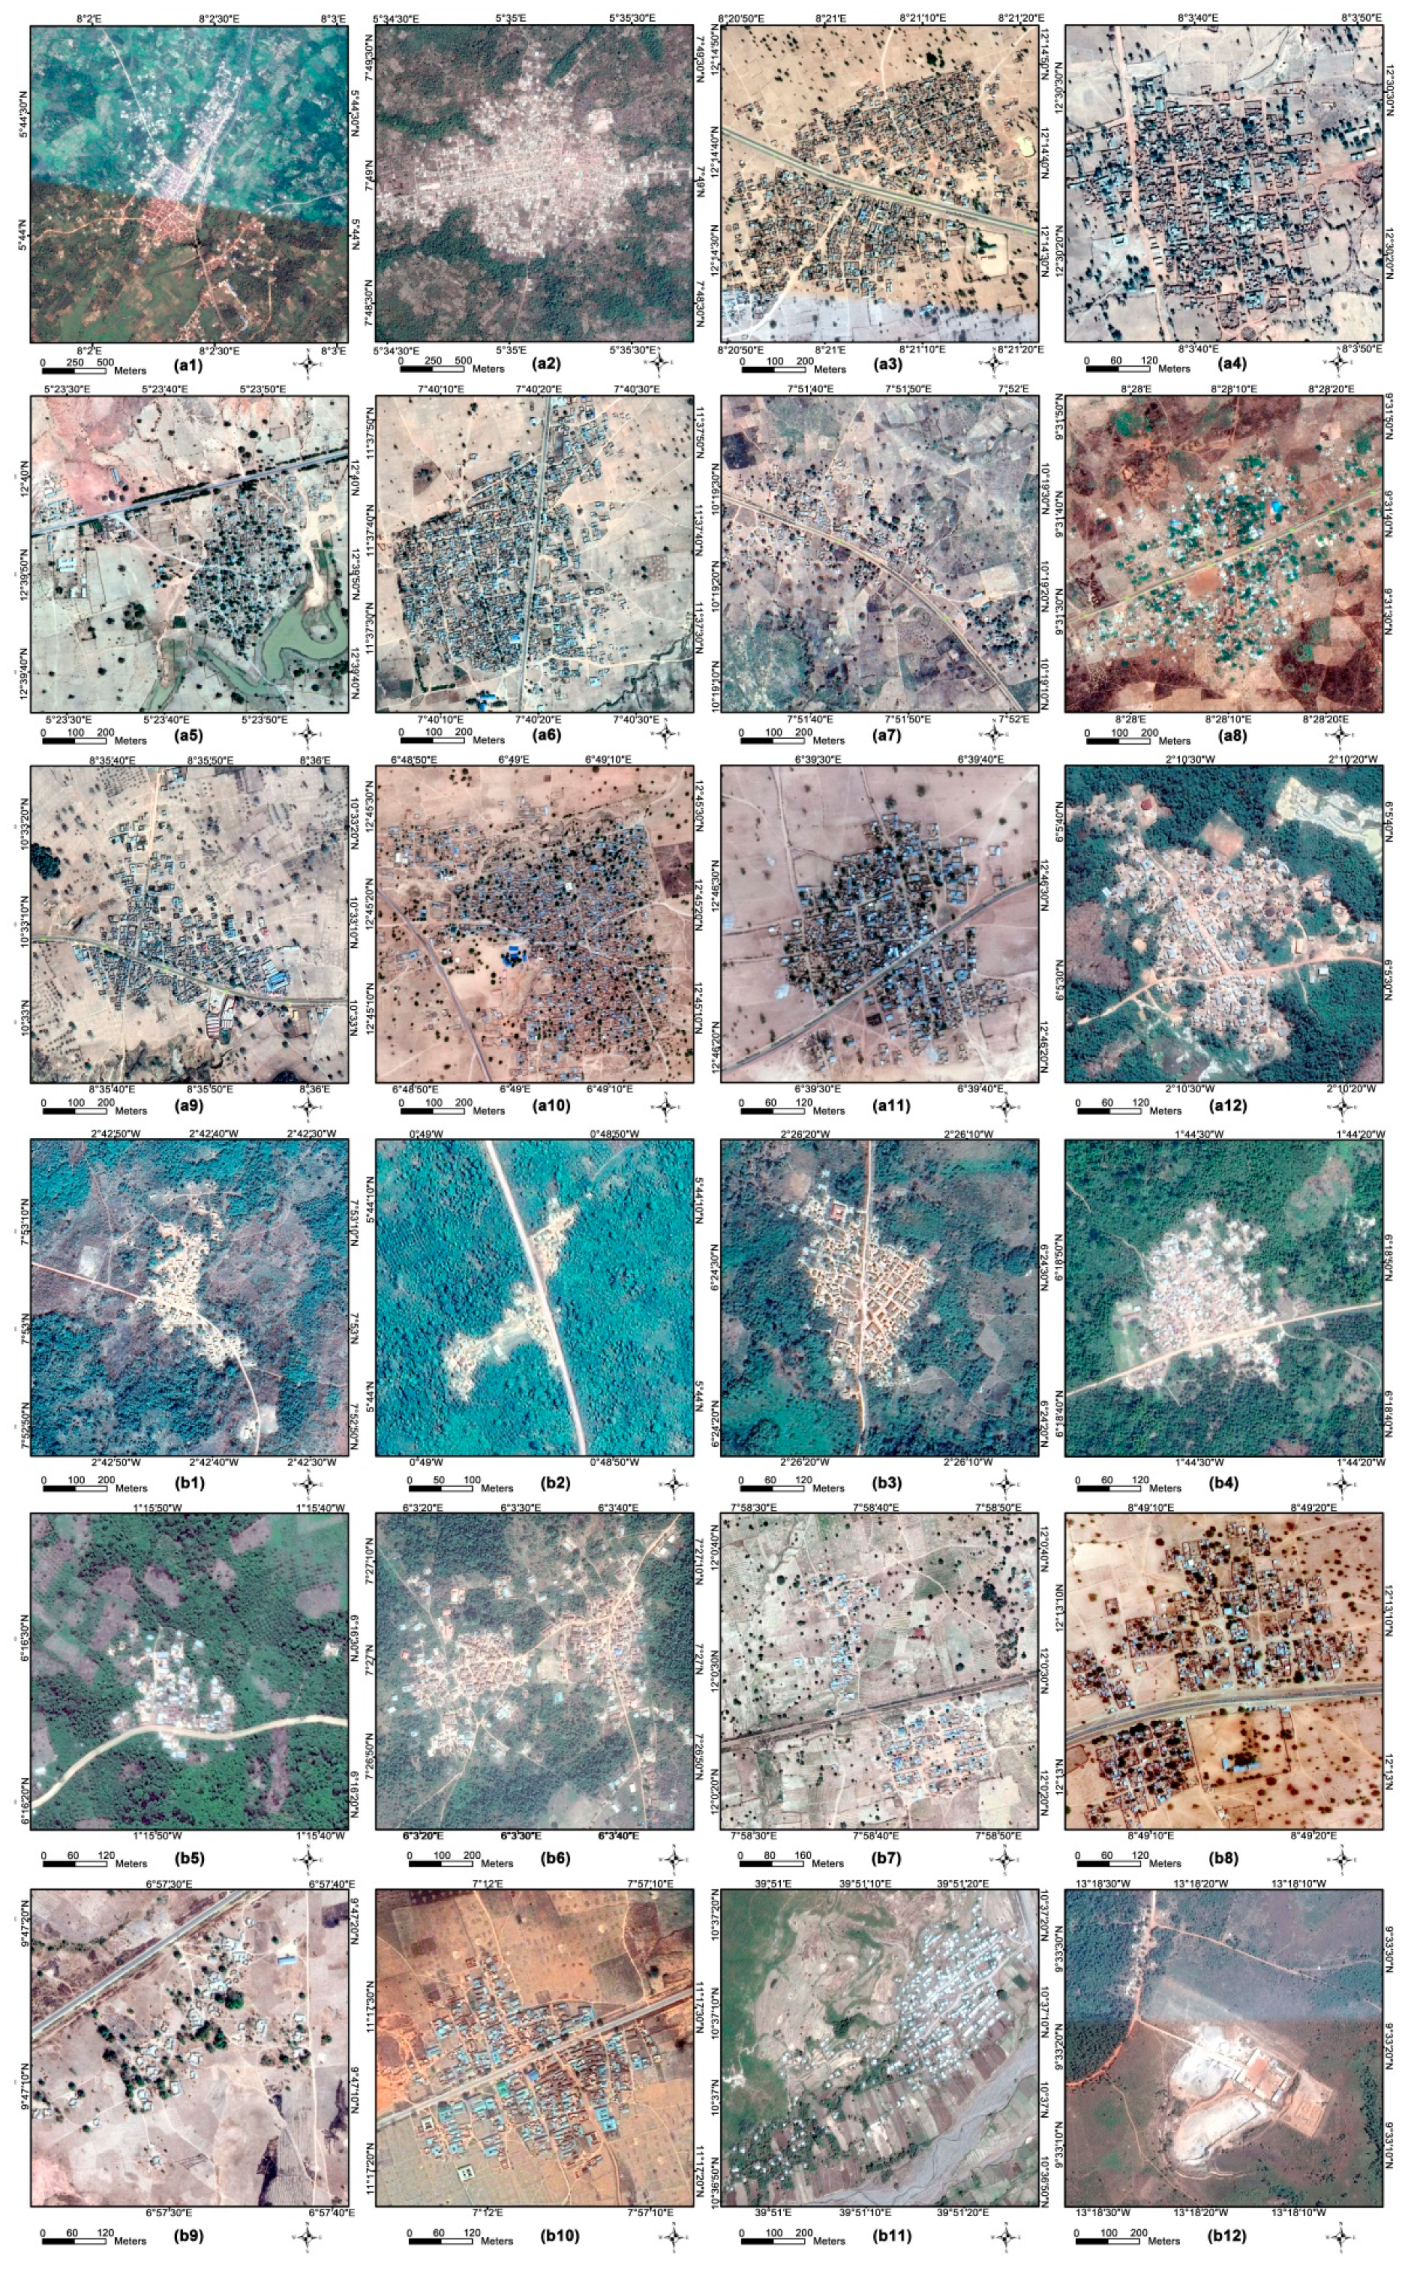
To verify that the newly identified settlements, i.e., the ones not detected by the NPP-VIIRS annual nighttime light NCEI image, were correct, high-resolution Google Earth images were applied (Figure 9). Compared with the NCEI image, there were 9538 newly detected nighttime light patches in the new NPP-VIIRS annual nighttime light image. We extracted 100 patches among them by means of systematic sampling [63], and we located them in the high-resolution Google Earth images. It turned out that 76 of the 100 samples were identified correctly as settlements on Google Earth images. Among them, there were 52 sample patches that were not mapped by the ESA-S2-AFRICA-LC20 map. All of the settlements shown in Figure 9 were bright in our NPP-VIIRS annual nighttime light image, whereas, in the NCEI annual image, they were dark. Among them, the objects in Figure 9(a1–12) were classified as settlements, while those in Figure 9(b1–12) fell into other classes, such as bare soil in the ESA-S2-AFRICA-LC20 map. In addition, night-work factories could also be identified in the new annual image (see Figure 9(b12)). We can, thus, conclude that the new annual image shows significant progress over the NCEI annual image in capturing settlements, thus confirming the result of the NLRI values. We also found that the new image could identify some settlements that could not be recognized by a land-cover map at 20-m spatial resolution.
With the method of reference verification, we checked whether the 225 reference location data in the study area were classified as settlements in the ESA-S2-AFRICA-LC20 map and as bright patches in the two annual nighttime light images. We found that 56.9% of the 225 reference settlements were correctly identified in ESA-S2-AFRICA-LC20 data, and the lowest recognition rate of 54.2% was in the NCEI annual image from 2016, while our new annual nighttime light image performed best by correctly identifying 61.8%.
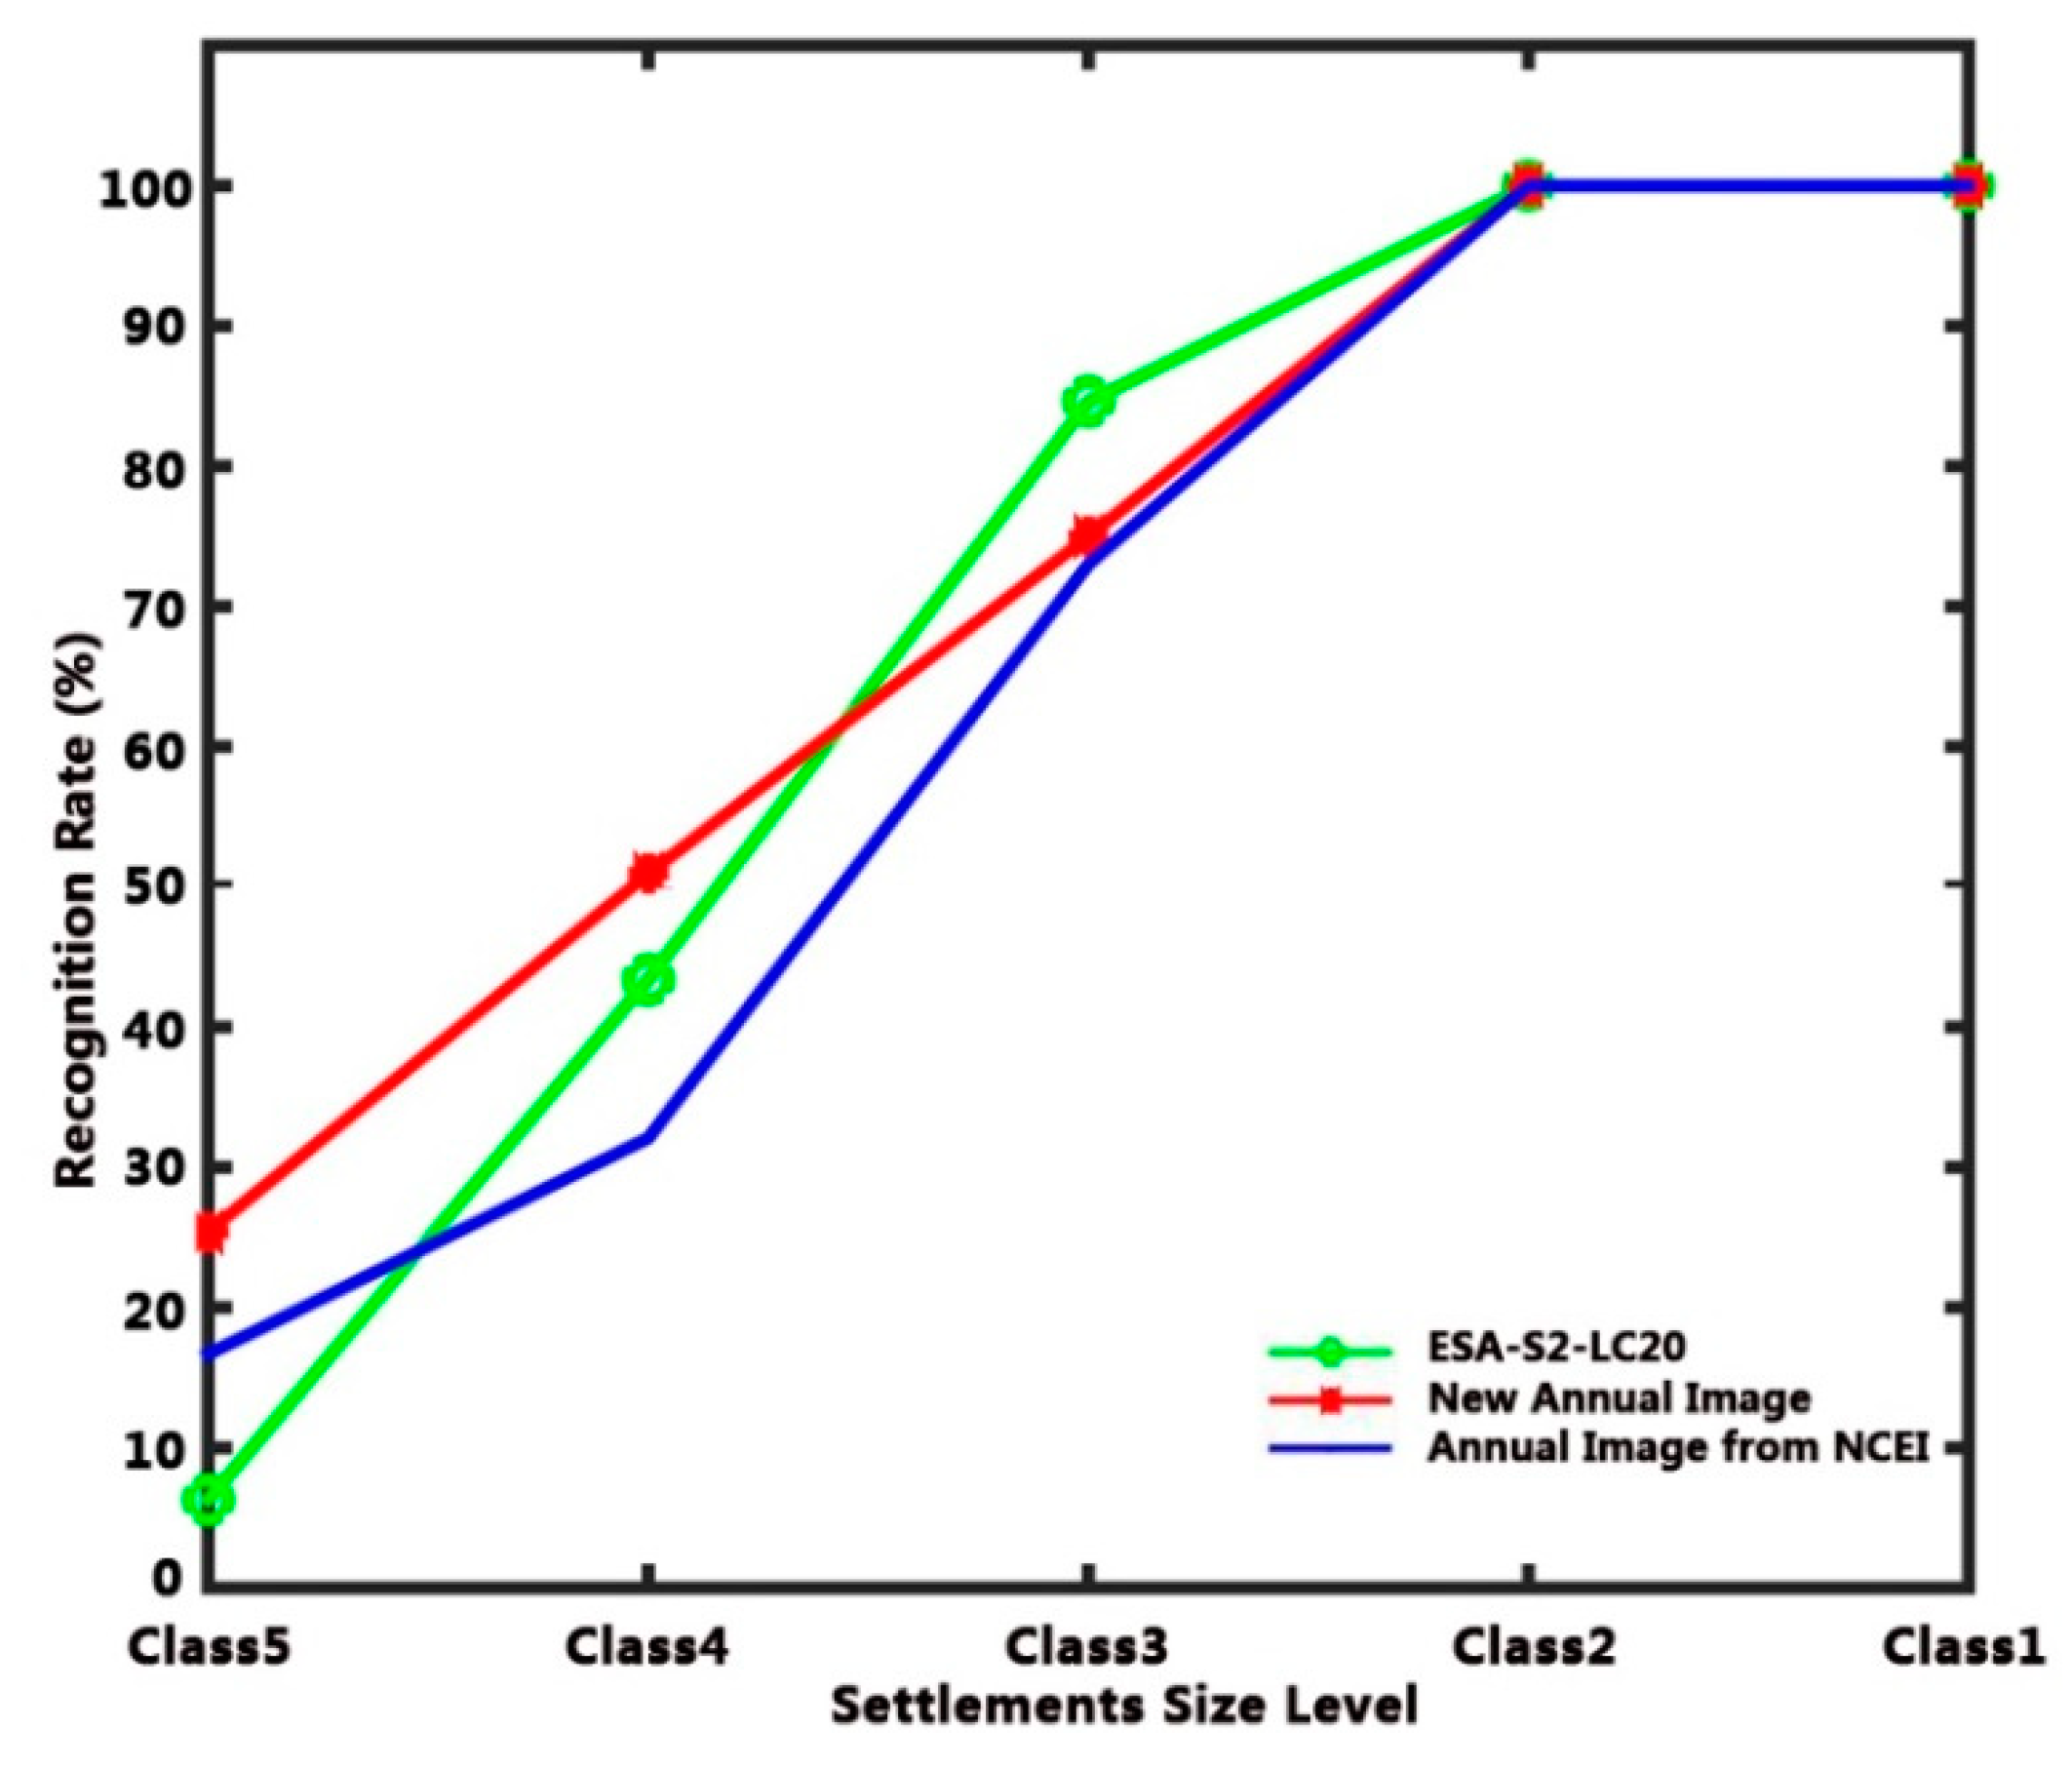
The recognition rates were then calculated for each size class in Table 2 (Figure 10). The recognition rate increased with settlement size for all three datasets. When the area increased to 25 km2, the recognition rate was close to 100% for Class 2 and Class 1 settlements, i.e., with sizes of 25 km2 or larger. The new annual nighttime light image performed best with a recognition rate of 25.4% in Class 5 and 50.9% in Class 4, while ESA-S2-AFRICA-LC20 data had the highest recognition rate of 84.6% for settlements with an area between 2.5 km2 and 25 km2 (Class 3). The NCEI data performance was intermediate for the settlements in Class 5 and worst for Class 4 and Class 3 among the three datasets.
5. Discussion
The purpose of this research was to propose and demonstrate a new filtering methodology for NPP-VIIRS monthly nighttime light images and to generate an annual nighttime light image that can capture more anthropic information than the existing NPP-VIIRS annual nighttime light images from the NCEI. Actually, the PFM method did eliminate background noise and identified biomass burning signals in the monthly nighttime light images without relying on other data. The monthly time series of total spectrally integrated radiance calculated with the final monthly images correctly identified biomass burning patches with a large yearly amplitude of emitted light. The biomass burning signal reached its peak in winter and its trough in summer (Figure 6). This finding is in agreement with the results of previous studies [45,47,48]. Biomass burning usually occurs in dry seasons (usually from December to March in the Northern Hemisphere and from June to September in the Southern Hemisphere), and very little (less than 5%) occurs in wet seasons [45,64,65]. The study area is located between 20 °N and the equator. The rainy season is from June to September, and the dry season is from October to May. Biomass burning events covered the whole dry season for frequent agricultural activities. It is a simple way to control weeds, brush, pest, snakes, litter accumulation on range and croplands, and fuel accumulation in forests [45,46,47,48]. It is also widely applied to expand arable lands by clearing forests and to prepare the land for cultivation in a shifting cultivation farming system [45,46,47,48]. It is also an effective way to return the nutrients, stored in dry plants accumulated in dry seasons, to the range and crop lands soil for promoting the regrowth of vegetation [45]. Biomass burning events peak in late December and early January [47,48]. A large proportion of biomass burning took place within the equator and 15 °N (see Figure 7), because of the domination of savanna fires in Africa [45]. The area consists of the Sudan savanna and the Guinea savanna. With annual precipitation between 600 and 1200 mm, the Sudan savanna is a broad belt stretching from the west to east, bordering the Sahel to the north. The Guinea savanna lies immediately south of the Sudan savanna. Although far smaller in size, the Guinea savanna is much wetter than the Sudan savanna with average annual rainfall between 1200 and 2200 mm. It can also be seen from Figure 7 that the peak intensity of biomass burning shifted from the mid-latitude position (12 °N) in October, the beginning of the dry season, to lower latitude until it reached about 6 °N in January, and then moved northward to return to the initial latitude (12 °N) in May. There are two main reasons behind this phenomenon, namely, the regimes of biomass burning that rely on rhythms of wetting and drying. An area must be wet enough to grow plants and dry enough for ignition [66]. This is the climatic basis for biomass burning. A large accumulation of dry biomass, providing more “natural fuel”, allows local farmers to use fire more widely and the inferno to spread much faster [48,64,67,68]. At the beginning of the dry season, “dryness” is the main factor affecting biomass burning; thus, the peak tends to occur in drier areas like the Sudan savanna. When it came to the middle of the dry season, even the wetter Guinea savanna was dry enough for drier plants to ignite, and the peak moved southward where more biomass was accumulated because of the abundance of rain.
We compared the new NPP-VIIRS annual nighttime light image generated in this study by applying PFM to the NCEI NPP-VIIRS annual nighttime light image. The annual image based on the monthly images filtered by PFM could identify more patches related to settlement than the NCEI image. At the same time, we also found that the new image can identify some settlements that are not captured by the ESA-S2-AFRICA-LC20 map at such a high resolution as 20 m. Further, the settlements extracted from the global land-cover and land-use (LULC) reference data derived from the Geo-Wiki crowdsourcing platform and high-resolution Google Earth data were used as reference data to investigate the capability of (a) the ESA-S2-AFRICA-LC20 map, (b) our new NPP-VIIRS annual nighttime light image data, and (c) the NCEI 2016 NPP-VIIRS annual nighttime light image data to capture information on settlements. We found that the new annual nighttime light image performed best in identifying settlements under 2.5 km2, and the ESA-S2-AFRICA-LC20 map had better performance for the settlements between 2.5 km2 and 25 km2, while, for the settlements larger than 25 km2, the recognition rates of the three approaches reached 100%.
The NCEI annual image was obtained by removing the outliers (maximum and minimum pixel values) of the daily NPP-VIIRS nighttime light images in 2016 and retaining the pixel values that stabilized the standard deviation within 1% [31]. This phenomenon, i.e., the larger spatial extent of lighted area in big cities, is referred to as the “diffusion effect” (or “blooming”) [69]. Although this filter weakens the diffusion effect of nighttime light in some big cities, it is often at the cost of losing nighttime lights in small or adjacent settlements. It is inevitable to remove the nocturnal light of smaller settlements or the urban areas deviating from the city center as outliers. However, the truth is that the diffusion effect still exists even if brightness in the NCEI annual image weakened to some extent. For the study on urban morphology and urbanization, this problem still has to be dealt with. The accuracy of land classification, even when using high-quality, high-spatial-resolution data, such as for the ESA-S2-AFRICA-LC20 map, is still limited by factors such as shadows, mixed pixels, and mapping accuracy, especially for the land-cover type “small settlement” [70]. The original NPP-VIIRS monthly nighttime light data still contain lights related to small settlement areas. Some of them were too small to be correctly classified in LULC data, and some were excluded as outliers in NCEI images because the lights were too dim or not stable. After background noise removal, PFM treated nighttime light patches in the monthly image as objects, eliminated the patches that appeared briefly within a year, and kept the patches appearing more than twice within 12 months, no matter how dim the lights were. The results did prove that the new annual nighttime light image, processed by the PFM, performed better than the other two image datasets in detecting settlements. To some extent, the new annual nighttime light data make up for the deficiency of LULC data in capturing information on settlements.
As an important indicator of human activity information, nighttime light in the northern Equatorial Africa and Sahel region is much dimmer than that in developed regions. Improving the capability of nighttime light data becomes very relevant in this field [71,72,73]. PFM is not only a simple and feasible method to filter NPP-VIIRS monthly nighttime light data without relying on other data, but it also improves the capability to capture anthropic information effectively. PFM is applicable to other regions and might be beneficial to observe and understand migration and urbanization in other developing regions. The present study could also lead to further research on human activities in developing regions. In addition, PFM can also be used as a method to separate the biomass burning signal component from the nighttime light related to settlements.
6. Conclusions
We applied PFM, which was proposed in this study, to filter the NPP-VIIRS nighttime light monthly data and generated a new NPP-VIIRS annual nighttime light image of the northern Equatorial Africa and Sahel region. The results show that PFM is an effective method for stable light identification in NPP-VIIRS monthly nighttime light data, and the new annual image data achieved an excellent performance in identifying settlements. The filtering by PFM separated the settlement and biomass burning signal components, capturing the seasonal cycles of African biomass burning. The new annual image can capture more settlements than the NCEI data. This statement is supported by the evaluation against high-resolution Google Earth images. We also found that the new annual image can detect some new settlements that were not classified correctly in ESA-S2-AFRICA-LC20 data. With the help of the global land-cover and land-use reference data derived from the Geo-Wiki crowdsourcing platform and high-resolution Google Earth data, we probed further and found out that it was possible to identify settlements with an area larger than 25 km2 with all three data sources, while a smaller settlement size led to a worse identification performance. Both nighttime light images performed better than ESA-S2-AFRICA-LC20 data in identifying small settlements, i.e., smaller than 0.25 km2. The new annual nighttime light image filtered by PFM did best in the settlements under 2.5 km2, while ESA-S2-AFRICA-LC20 data did best for settlements between 2.5 km2 and 25 km2 in size. Overall, the new annual nighttime light image was still the best data source to retrieve information on settlements with a recognition rate of 61.8%, the highest among the three datasets.
This study provided an effective way to separate signal components in NPP-VIIRS nighttime light monthly image data, and the annual NPP-VIIRS nighttime light image improved the performance of existing nighttime light satellite data to capture settlements. This research also provided support to extract more accurate information about human activities by combining land-use and land-cover data with nighttime light data. This study promotes the application of nighttime light data in developing regions like the northern Equatorial Africa and Sahel region, and it could lead to the development of research on human activities in developing countries or regions. This research also provided more accurate information on human activities by combining land-use and land-cover data with nighttime light data.
Author Contributions
This study was designed and completed through collaboration among all the authors: X.Y., L.J., M.M., J.Z., Q.C. Conceptualization, X.Y., L.J., and M.M.; methodology, X.Y. and J.Z.; software, X.Y. and Q.C.; investigation, X.Y.; resources, L.J.; writing—original draft preparation, X.Y.; writing—review and editing, L.J., M.M., and Q.C.; visualization, X.Y.; supervision, L.J.
Funding
This study was jointly supported by the National Natural Science Foundation of China project (Grant No. 41661144022), the Strategic Priority Research Program of the Chinese Academy of Sciences (Grant No. XDA19030203), and the MOST High Level Foreign Expert program (Grant No. G20190161018).
Acknowledgments
We are grateful for the data provided by the NOAA National Center for Environmental Information (NCEI) and the European Space Agency (ESA). We are also grateful to the Observatory of the Sahara and Sahel (OSS) for assistance with survey research about human activities in the Sahel region. We are also immensely grateful to Christopher D. Elvidge for kindly answering our related questions about the processing of the annual NPP-VIIRS average image from the NCEI. Finally, we wish to express our appreciation to our colleagues Kun Wang, Chaolei Zheng, Guangcheng Hu, Min Jiang, Beatrice Barnieh, and Yelong Zeng who provided their expertise that greatly assisted our research.
Conflicts of Interest
The authors declare no conflicts of interest.
References
- Ghosh, T.; Anderson, S.J.; Elvidge, C.D.; Sutton, P.C. Using nighttime satellite imagery as a proxy measure of human well-being. Sustainability 2013, 5, 4988–5019. [Google Scholar] [CrossRef] [Green Version]
- Cauwels, P.; Pestalozzi, N.; Sornette, D. Dynamics and spatial distribution of global nighttime lights. EPJ Data Sci. 2014, 3, 2. [Google Scholar] [CrossRef] [Green Version]
- Li, D.; Zhao, X.; Li, X. Remote sensing of human beings—A perspective from nighttime light. Geo-Spat. Inf. Sci. 2016, 19, 69–79. [Google Scholar] [CrossRef] [Green Version]
- Croft, T. Nighttime images of the earth from space. Sci. Am. 1978, 239, 86–101. [Google Scholar] [CrossRef]
- Doll, C.N.H.; Muller, J.P.; Elvidge, C.D. Night-time imagery as a tool for global mapping of socioeconomic parameters and greenhouse gas emissions. Ambio 2000, 29, 157–162. [Google Scholar] [CrossRef]
- Doll, C.N.H.; Pachauri, S. Estimating rural populations without access to electricity in developing countries through night-time light satellite imagery. Energy Policy 2010, 38, 5661–5670. [Google Scholar] [CrossRef]
- Doll, C.N.H.; Muller, J.P.; Morley, J.G. Mapping regional economic activity from night-time light satellite imagery. Ecol. Econ. 2006, 57, 75–92. [Google Scholar] [CrossRef]
- Chen, X.; Nordhaus, W.D. Using luminosity data as a proxy for economic statistics. Proc. Natl. Acad. Sci. USA 2011, 108, 8589–8594. [Google Scholar] [CrossRef] [Green Version]
- Li, F.; Wei, A.; Mi, X.; Sun, G. An approach of GDP spatialization in Hebei province using NPP-VIIRS nighttime light data. J. Xinyang Norm. Univ. 2016, 29, 152–156. [Google Scholar]
- Frolking, S.; Milliman, T.; Seto, K.C.; Friedl, M.A. A global fingerprint of macro-scale changes in urban structure from 1999 to 2009. Environ. Res. Lett. 2013, 8, 024004. [Google Scholar] [CrossRef]
- Xu, T.; Ma, T.; Zhou, C.; Zhou, Y. Characterizing spatio-temporal dynamics of urbanization in China using time series of DMSP/OLS night light data. Remote Sens. 2014, 6, 7708–7731. [Google Scholar] [CrossRef] [Green Version]
- Sharma, R.C.; Tateishi, R.; Hara, K.; Gharechelou, S.; Iizuka, K. Global mapping of urban built-up areas of year 2014 by combining MODIS multispectral data with VIIRS nighttime light data. Int. J. Digit. Earth 2016, 9, 1004–1020. [Google Scholar] [CrossRef]
- Cho, K.; Ito, R.; Shimoda, H.; Sakata, T. Technical note and cover fishing fleet lights and sea surface temperature distribution observed by DMSP/OLS sensor. Int. J. Remote Sens. 1999, 20, 3–9. [Google Scholar] [CrossRef]
- Guo, G.; Fan, W.; Xue, J.; Zhang, S.; Zhang, H.; Tang, F.; Cheng, T. Identification for operating pelagic light-fishing vessels based on NPP/VIIRS low light imaging data. Trans. Chin. Soc. Agric. Eng. 2017, 33, 245–251. [Google Scholar]
- Elvidge, C.D.; Ziskin, D.; Baugh, K.E.; Tuttle, B.T.; Ghosh, T.; Pack, D.W.; Erwin, E.H.; Zhizhin, M. A fifteen year record of global natural gas flaring derived from satellite data. Energies 2009, 2, 595–622. [Google Scholar] [CrossRef]
- Elvidge, C.D.; Zhizhin, M.; Baugh, K.; Hsu, F.; Ghosh, T. Methods for global survey of natural gas flaring from visible infrared imaging radiometer suite data. Energies 2016, 9, 14. [Google Scholar] [CrossRef]
- Ceola, S.; Laio, F.; Montanari, A. Satellite nighttime lights reveal increasing human exposure to floods worldwide. Geophys. Res. Lett. 2014, 41, 7184–7190. [Google Scholar] [CrossRef]
- Bennie, J.; Davies, T.W.; Duffy, J.P.; Inger, R.; Gaston, K.J. Contrasting trends in light pollution across Europe based on satellite observed night time lights. Sci. Rep. 2014, 4, 3789. [Google Scholar] [CrossRef] [Green Version]
- Jiang, W.; He, G.; Long, T.; Liu, H. Ongoing conflict makes Yemen dark: from the perspective of nighttime light. Remote Sens. 2017, 9, 798. [Google Scholar] [CrossRef] [Green Version]
- Kloog, I.; Haim, A.; Stevens, R.G.; Barchana, M.; Portnov, B.A. Light at night co-distributes with incident breast but not lung cancer in the female population of Israel. Chronobiol. Int. 2008, 25, 65–81. [Google Scholar] [CrossRef]
- Escobar, L.E.; Peterson, A.T.; Papeş, M.; Favi, M.; Yung, V.; Restif, O.; Qiao, H.; Medina-Vogel, G. Ecological approaches in veterinary epidemiology: Mapping the risk of bat-borne rabies using vegetation indices and night-time light satellite imagery. Vet. Res. 2015, 46, 92. [Google Scholar] [CrossRef] [Green Version]
- Keiser, J.; Utzinger, J.; De Castro, M.C.; Smith, T.A.; Tanner, M.; Singer, B.H. Urbanization in sub-saharan Africa and implication for malaria control. Am. J. Trop. Med. Hyg. 2004, 71, 118–127. [Google Scholar] [CrossRef] [PubMed]
- Bharti, N.; Tatem, A.J.; Ferrari, M.J.; Grais, R.F.; Djibo, A.; Grenfell, B.T. Explaining seasonal fluctuations of measles in Niger using nighttime lights imagery. Science 2011, 334, 1424–1427. [Google Scholar] [CrossRef] [PubMed] [Green Version]
- Mveyange, A. Night Lights and Regional Income Inequality in Africa; WIDER Working Paper Series No.2015/085; United Nations University World Institute for Development Economic Research (UNU-WIDER): Helsinki, Finland, 2015. [Google Scholar]
- Min, B.; Gaba, K.M.; Sarr, O.F.; Agalassou, A. Detection of rural electrification in Africa using DMSP-OLS night lights imagery. Int. J. Remote Sens. 2013, 34, 8118–8141. [Google Scholar] [CrossRef]
- International Energy Agency; International Renewable Energy Agency; United Nations Statistics Division; World Bank; World Health Organization. Tracking SDG7: The Energy Progress Report 2019; World Bank: Washington, DC, USA, 2019. [Google Scholar]
- Mawhood, R. The Senegalese Rural Electrification Action Plan: ‘A Good Practice’ Model for Increasing Private Sector Participation in Sub-saharan Rural Electrification. Master’s Thesis, Imperial College London, London, UK, 2012. [Google Scholar]
- African Development Bank Grop African Development Bank to Reach 29.3 Million Africans with Electricity by 2020. Available online: https://www.afdb.org/en/news-and-events/african-development-bank-to-reach-29-3-million-africans-with-electricity-by-2020-17806/ (accessed on 22 May 2018).
- Oyuk, A.; Penar, P.H.; Howard, B. Off-grid or‘off-on’: lack of access, unreliable electricity supply still plague majority of Africans. Afrobarometer 2016, 75. Available online: http://afrobarometer.org/sites/default/files/publications/Dispatches/ab_r6_dispatchno75_electricity_in_africa_eng1.pdf (accessed on 20 April 2018).
- Baugh, K.; Elvidge, C.D.; Ghosh, T.; Ziskin, D. Development of a 2009 stable lights product using DMSP-OLS data. Proc. Asia-Pac. Adv. Netw. 2010, 30, 114–130. [Google Scholar] [CrossRef]
- Elvidge, C.D.; Baugh, K.; Zhizhin, M.; Hsu, F.C.; Ghosh, T. VIIRS night-time lights. Int. J. Remote Sens. 2017, 38, 5860–5879. [Google Scholar] [CrossRef]
- Ma, T.; Zhou, C.; Pei, T.; Haynie, S.; Fan, J. Quantitative estimation of urbanization dynamics using time series of DMSP/OLS nighttime light data: A comparative case study from China’s cities. Remote Sens. Environ. 2012, 124, 99–107. [Google Scholar] [CrossRef]
- Cao, Z.; Wu, Z.; Kuang, Y.; Huang, N. Correction of DMSP/OLS Night-time light images and its application in China. J. Geo-Inf. Sci. 2015, 17, 1092–1102. [Google Scholar]
- Elvidge, C.D.; Baugh, K.E.; Dietz, J.B.; Bland, T.; Sutton, P.C.; Kroehl, H.W. Radiance calibration of DMSP-OLS low-light imaging data of human settlements. Remote Sens. Environ. 1999, 68, 77–88. [Google Scholar] [CrossRef]
- Lee, T.E.; Miller, S.D.; Turk, F.J.; Schueler, C.; Julian, R.; Deyo, S.; Dills, P.; Wang, S. The NPOESS VIIRS day/night visible sensor. Bull. Am. Meteorol. Soc. 2006, 87, 191–199. [Google Scholar] [CrossRef]
- Li, X.; Xu, H.; Chen, X.; Li, C. Potential of NPP-VIIRS nighttime light imagery for modeling the regional economy of China. Remote Sens. 2013, 5, 3057–3081. [Google Scholar] [CrossRef] [Green Version]
- Li, X.; Zhang, R.; Huang, C.; Li, D. Detecting 2014 northern Iraq insurgency using night-time light imagery. Int. J. Remote Sens. 2015, 36, 3446–3458. [Google Scholar] [CrossRef]
- Ma, T.; Zhou, C.; Pei, T.; Haynie, S.; Fan, J. Responses of Suomi-NPP VIIRS-derived nighttime lights to socioeconomic activity in China’s cities. Remote Sens. Lett. 2014, 5, 165–174. [Google Scholar] [CrossRef]
- Shi, K.; Huang, C.; Yu, B.; Yin, B.; Huang, Y.; Wu, J. Evaluation of NPP-VIIRS night-time light composite data for extracting built-up urban areas. Remote Sens. Lett. 2014, 5, 358–366. [Google Scholar] [CrossRef]
- Jing, X.; Shao, X.; Cao, C.; Fu, X.; Yan, L. Comparison between the Suomi-NPP Day-Night Band and DMSP-OLS for correlating socio-economic variables at the provincial level in China. Remote Sens. 2016, 8, 17. [Google Scholar] [CrossRef] [Green Version]
- Chen, Z. A Multiscale Analysis on Urban Area and Spatial Structure Based on Nighttime Light Data. Ph.D. Thesis, East China Normal University, Shanghai, China, 2017. [Google Scholar]
- Guo, W.; Lu, D.; Wu, Y.; Zhang, J. Mapping impervious surface distribution with integration of SNNP VIIRS-DNB and MODIS NDVI data. Remote Sens. 2015, 7, 12459–12477. [Google Scholar] [CrossRef] [Green Version]
- Ma, T.; Xu, T.; Huang, L.; Zhou, A. A human settlement composite index (HSCI) derived from nighttime luminosity associated with imperviousness and vegetation indexes. Remote Sens. 2018, 10, 455. [Google Scholar] [CrossRef] [Green Version]
- Imhoff, M.L.; Lawrence, W.T.; Stutzer, D.C.; Elvidge, C.D. A technique for using composite DMSP/OLS “city lights” satellite data to map urban area. Remote Sens. Environ. 1997, 61, 361–370. [Google Scholar] [CrossRef]
- Andreae, M.O. Biomass burning—Its history, use, and distribution and its impact on environmental quality and global climate. In Proceedings of the Chapman Conf on Global Biomass Burning: Atmospheric, Climatic and Biospheric Implications, Williamsburg, VA, USA, 19–23 March 1990; Levine, J., Ed.; MIT Press: Cambridge, MA, USA, 1991; pp. 3–21. [Google Scholar]
- Hao, W.M.; Liu, M.H. Spatial and temporal distribution of tropical biomass burning. Glob. Biogeochem. Cycles 1994, 8, 495–503. [Google Scholar] [CrossRef]
- Laris, P.; Wardell, D.A. Good, bad or ‘necessary evil’? Reinterpreting the colonial burning experiments in the savanna landscapes of West Africa. Geogr. J. 2007, 172, 271–290. [Google Scholar] [CrossRef]
- Behnke, R.H.; Mortimore, M. The End of Desertification? Springer: Berlin/Heidelberg, Germany, 2016; Available online: https://link.springer.com/content/pdf/10.1007%2F978-3-642-16014-1.pdf (accessed on 23 October 2019).
- Van Beusekom, M.M. From underpopulation to overpopulation: French perceptions of population, environment, and agricultural development in French Soudan (Mali), 1900–1960. Environ. Hist. 1999, 4, 198–219. [Google Scholar] [CrossRef]
- Dawelbait, M.; Morari, F. Monitoring desertification in a Savannah region in Sudan using Landsat images and spectral mixture analysis. J. Arid Environ. 2012, 80, 45–55. [Google Scholar] [CrossRef]
- He, Y.; Yao, Y.; Tang, H.; Chen, Y.; Chen, Z.; Yang, P.; Yu, S. An overview on progress of land use and land cover change dynamics. Chinese Agric. Sci. Bull. 2013, 29, 190–195. [Google Scholar]
- Mariano, D.A.; dos Santos, C.A.C.; Wardlow, B.D.; Anderson, M.C.; Schiltmeyer, A.V.; Tadesse, T.; Svoboda, M.D. Use of remote sensing indicators to assess effects of drought and human-induced land degradation on ecosystem health in Northeastern Brazil. Remote Sens. Environ. 2018, 213, 129–143. [Google Scholar] [CrossRef]
- Park, J.Y.; Bader, J.; Matei, D. Anthropogenic Mediterranean warming essential driver for present and future Sahel rainfall. Nat. Clim. Chang. 2016, 6, 941–945. [Google Scholar] [CrossRef]
- Mao, R.; Gong, D.; Fang, Q. Comparison analysis of environmental changes between Sahel and Agro-pastoral Zone in Northern China. Prog. Geogr. 2007, 26, 51–63. [Google Scholar]
- Hibbard, K.; Janetos, A.; van Vuuren, D.P.; Pongratz, J.; Rose, S.K.; Betts, R.; Herold, M.; Feddema, J.J. Research priorities in land use and land-cover change for the earth system and integrated assessment modelling. Int. J. Climatol. 2010, 30, 2118–2128. [Google Scholar] [CrossRef] [Green Version]
- Karlson, M.; Ostwald, M. Remote sensing of vegetation in the Sudano-Sahelian zone: a literature review from 1975 to 2014. J. Arid Environ. 2016, 124, 257–269. [Google Scholar] [CrossRef] [Green Version]
- Hillger, D.; Kopp, T. First-light imagery from Suomi NPP VIIRS. Bull. Am. Meteorol. Soc. 2013, 94, 1019–1029. [Google Scholar] [CrossRef]
- Liao, L.B.; Weiss, S.; Mills, S.; Hauss, B. Suomi NPP VIIRS Day-Night Band on-orbit performance. J. Geophys. Res. Atmos. 2013, 118, 12705–12718. [Google Scholar] [CrossRef]
- NASA Visible Infrared Imaging Radiometer Suite Level-1B Product User Guide. 2018. Available online: http://ladsweb.modaps.eosdis.nasa.gov/missions-and-measurements/viirs/NASA_VIIRS_L1B_UG_May_2018.pdf (accessed on 30 October 2019).
- Fritz, S.; See, L.; Perger, C.; McCallum, I.; Schill, C.; Schepaschenko, D.; Duerauer, M.; Karner, M.; Dresel, C.; Laso-Bayas, J.C.; et al. A global dataset of crowdsourced land cover and land use reference data. Sci. Data 2017, 4, 170075. [Google Scholar] [CrossRef] [PubMed] [Green Version]
- Lesiv, M.; Fritz, S.; McCallum, I.; Tsendbazar, N.; Herold, M.; Pekel, J.-F.; Buchhorn, M.; Smets, B.; Van De Kerchove, R. Evaluation of ESA CCI Prototype Land Cover Map at 20 m; IIASA Working Paper Series, WP-17-021; International Institute for Applied Systems Analysis: Laxenburg, Austria, 2017. [Google Scholar]
- Shapiro, L.G. Connected component labeling and adjacency graph construction. Mach. Intell. Pattern Recognit. 1996, 19, 1–30. [Google Scholar]
- Yates, F.; Sc, D. Systematic sampling. Philos. Trans. R. Soc. Lond. Ser. A Math. Phys. Sci. 1948, 241, 345–377. [Google Scholar] [CrossRef]
- Govender, N.; Trollope, W.S.W.; Van Wilgen, B.W. The effect of fire season, fire frequency, rainfall and management on fire intensity in savanna vegetation in South Africa. J. Appl. Ecol. 2006, 43, 748–758. [Google Scholar] [CrossRef]
- Archibald, S.; Staver, A.C.; Levin, S.A. Evolution of human-driven fire regimes in Africa. Proc. Natl. Acad. Sci. USA 2012, 109, 847–852. [Google Scholar] [CrossRef] [Green Version]
- Pyne, S. How Plants Use Fire (and Are Used by It). Available online: https://www.pbs.org/wgbh/nova/fire/plants.html (accessed on 23 August 2019).
- Crutzen, P.J.; Andreae, M.O. Biomass burning in the tropics: impact on atmospheric chemistry and biogeochemical cycles. Science 1990, 250, 1669–1678. [Google Scholar] [CrossRef]
- Kershaw, A.P.; Bush, M.B.; Hope, G.S.; Goldammer, J.G.; Sanford, R. The Contribution of Humans to Past Biomass Burning in the Tropics; Springer: Berlin/Heidelberg, Germany, 1997. [Google Scholar]
- Small, C.; Pozzi, F.; Elvidge, C.D. Spatial analysis of global urban extent from DMSP-OLS night lights. Remote Sens. Environ. 2005, 96, 277–291. [Google Scholar] [CrossRef]
- Xu, Y.; Yu, L.; Feng, D.; Peng, D.; Li, C.; Huang, X.; Lu, H.; Gong, P. Comparisons of three recent moderate resolution African land cover datasets: CGLS-LC100, ESA-S2-LC20, and FROM-GLC-Africa30. Int. J. Remote Sens. 2019, 40, 6185–6202. [Google Scholar] [CrossRef]
- Xie, M.; Jean, N.; Burke, M.; Lobell, D.; Ermon, S. Transfer learning from deep features for remote sensing and poverty mapping. In Proceedings of the Thirtieth AAAI Conference on Artificial Intelligence, Phoenix, AZ, USA, 12–17 February 2016; pp. 3929–3935. [Google Scholar]
- Chai, B.; Seto, K.C. Conceptualizing and characterizing micro-urbanization: a new perspective applied to Africa. Landsc. Urban Plan. 2019, 190, 103595. [Google Scholar] [CrossRef]
- Falchetta, G.; Pachauri, S.; Parkinson, S.; Byers, E. A high-resolution gridded dataset to assess electrification in sub-saharan Africa. Sci. Data 2019, 6, 110. [Google Scholar] [CrossRef] [PubMed]
Figure 1.
Study area (shown with black slant lines). The dotted red line delineates the Sahel region defined by mean annual rainfall between 100 mm in the north and around 600 mm in the south.
Figure 1.
Study area (shown with black slant lines). The dotted red line delineates the Sahel region defined by mean annual rainfall between 100 mm in the north and around 600 mm in the south.

Figure 2.
Locations of reference settlements (red dots) data in the study area collected from the global land-cover and land-use reference data and high-resolution Google Earth images; 22 regions were used for background noise removal.
Figure 2.
Locations of reference settlements (red dots) data in the study area collected from the global land-cover and land-use reference data and high-resolution Google Earth images; 22 regions were used for background noise removal.

Figure 3.
Workflow to filter the National Polar-orbiting Partnership Visible Infrared Imaging Radiometer Suite (NPP-VIIRS) nighttime light monthly data and generate the new 2016 annual nighttime light image.
Figure 3.
Workflow to filter the National Polar-orbiting Partnership Visible Infrared Imaging Radiometer Suite (NPP-VIIRS) nighttime light monthly data and generate the new 2016 annual nighttime light image.

Figure 4.
Schematic diagram of eight-connected component labeling method. For any pixel P where radiance > 0, a–h are the eight adjacent pixels of P (as the arrows show, i.e., top left, top, top right, left, right, bottom left, bottom, and bottom right). Any pixel in the patch of more than one pixel must be connected with at least one other neighbor pixel.

Figure 5.
Nighttime light images in the northern Equatorial Africa and Sahel region in January 2016 before and after background noise removal and patches filtering method (PFM) processing: (a1–4) the original NPP-VIIRS monthly image, the image after background noise removal, the image after PFM processing, and the Google Earth maps, respectively, marked by lighted area in the NPP-VIIRS monthly image after PFM processing; (b1–3), (c1–3), and (d1–3) original image, image after background noise removal, and image after PFM processing for urban areas of Bobo-Dioulasso in Burkina Faso, Abuja in Nigeria, and Juba in South Sudan, respectively. (b4), (c4), and (d4) Google Earth maps marked by lighted area after PFM processing in the three cities. The legend denotes the nighttime light radiance (10−9 W∙cm−2∙sr−1) and settlements in the Sentinel-2 prototype Land Cover 20 m 2016 map of Africa released by the European Space Agency (ESA-S2-AFRICA-LC20), as well as the lighted areas after PFM processing.

Figure 6.
Monthly time series of total settlement-related nighttime lights (red line) and signals due to biomass burning (blue line) during the period from January 2015 to December 2017.
Figure 6.
Monthly time series of total settlement-related nighttime lights (red line) and signals due to biomass burning (blue line) during the period from January 2015 to December 2017.

Figure 7.
Monthly nighttime light radiance distribution in the study area of biomass burning (difference before and after PFM) and settlement nighttime light (after PFM) during 2016: NPP-VIIRS monthly nighttime light images with biomass burning signal (green) and final monthly nighttime light image (red).

Figure 8.
New annual NPP-VIIRS nighttime light image (a1) and the National Center for Environmental Information (NCEI) annual NPP-VIIRS nighttime light image (a2) in 2016. (b1,2), (c1,2), and (d1,2) Pairs of pictures in the urban areas around Bobo-Dioulasso, Abuja, and Juba, respectively. (a1′,2′), (b1′,2′), (c1′,2′), and (d1′,2′) Pairs of Google Earth maps marked by lighted areas in the new annual NPP-VIIRS image or the annual image from the NCEI in the study area and around Bobo-Dioulasso, Abuja, and Juba, respectively. The legend denotes the radiance due to nighttime lights and settlements mapped in ESA-S2-AFRICA-LC20.

Figure 9.
High-resolution Google Earth images (a1–12 and b1–12) of the sample settlements that can be identified using the new NPP-VIIRS annual nighttime light image but not the NCEI image in northern Equatorial Africa and Sahel in 2016: (a1–12) man-made features in ESA-S2-AFRICA-LC20 map; (b1–12) sites related to human activities while identified as other types (such as bare land) in the ESA-S2-AFRICA-LC20 map.

Figure 10.
Comparison of settlement recognition rates for (green) ESA-S2-AFRICA-LC20 data, (red) the new synthesized NPP-VIIRS annual nighttime light data, and (blue) the NPP-VIIRS annual nighttime light data from the NCEI in 2016.
Figure 10.
Comparison of settlement recognition rates for (green) ESA-S2-AFRICA-LC20 data, (red) the new synthesized NPP-VIIRS annual nighttime light data, and (blue) the NPP-VIIRS annual nighttime light data from the NCEI in 2016.


Table 1.
National Polar-orbiting Partnership Visible Infrared Imaging Radiometer Suite (NPP-VIIRS) day/night band (DNB) specifications. NCEI—National Center for Environmental Information.
Table 1.
National Polar-orbiting Partnership Visible Infrared Imaging Radiometer Suite (NPP-VIIRS) day/night band (DNB) specifications. NCEI—National Center for Environmental Information.
| Parameters | NPP-VIIRS |
|---|---|
| Operator | The Earth Observation Group (EOG) at NOAA/NCEI |
| Orbit | Polar orbit satellite |
| Swath width | 3040 km |
| Spatial resolution (m) | 742 m (across full scan) |
| Field of view | 112.56° |
| Spectral coverage | 0.5–0.9 μm |
| Spectrally integrated radiance | W∙cm−2∙sr−1 |
| Dynamic range Minimum detectable radiance | 3 × 10⁻⁹ W∙cm−2∙sr−1 to 0.02 W∙cm−2∙sr−1 0.2 × 10⁻⁹ W∙cm−2∙sr−1 [58] |
Table 2.
Reference settlement classification.
| Scale | Settlements | Size (km2) | Reference Settlement Number |
|---|---|---|---|
| Class1 | Big cities | ≥125 | 20 |
| Class2 | Mid-sized cities | 25–125 | 37 |
| Class3 | Small cities | 2.5–25 | 52 |
| Class4 | Rural settlements | 0.25–2.5 | 53 |
| Class5 | Scattered settlements | 0.25 | 63 |
Table 3.
Nighttime light response indices (NLRIs) of the new NPP-VIIRS annual nighttime light image and the NCEI NPP-VIIRS annual nighttime light image at different settlement sizes.
Table 3.
Nighttime light response indices (NLRIs) of the new NPP-VIIRS annual nighttime light image and the NCEI NPP-VIIRS annual nighttime light image at different settlement sizes.
| Scale | NLRI New Annual Image | NLRI NCEI Annual Image |
|---|---|---|
| Class1 | 1 | 0.9548 |
| Class2 | 0.9965 | 0.8813 |
| Class3 | 0.9037 | 0.7873 |
| Class4 | 0.6818 | 0.5435 |
| Class5 | 0.3432 | 0.2501 |
| Study area | 0.7303 | 0.6247 |
© 2019 by the authors. Licensee MDPI, Basel, Switzerland. This article is an open access article distributed under the terms and conditions of the Creative Commons Attribution (CC BY) license (http://creativecommons.org/licenses/by/4.0/).
Share and Cite
MDPI and ACS Style
Yuan, X.; Jia, L.; Menenti, M.; Zhou, J.; Chen, Q. Filtering the NPP-VIIRS Nighttime Light Data for Improved Detection of Settlements in Africa. Remote Sens. 2019, 11, 3002. https://doi.org/10.3390/rs11243002
AMA Style
Yuan X, Jia L, Menenti M, Zhou J, Chen Q. Filtering the NPP-VIIRS Nighttime Light Data for Improved Detection of Settlements in Africa. Remote Sensing. 2019; 11(24):3002. https://doi.org/10.3390/rs11243002
Chicago/Turabian StyleYuan, Xiaotian, Li Jia, Massimo Menenti, Jie Zhou, and Qiting Chen. 2019. "Filtering the NPP-VIIRS Nighttime Light Data for Improved Detection of Settlements in Africa" Remote Sensing 11, no. 24: 3002. https://doi.org/10.3390/rs11243002
Note that from the first issue of 2016, this journal uses article numbers instead of page numbers. See further details here.