

Abstract
In 2018, Solar Cycle 24 entered a deep solar minimum. During this period, we collected night sky brightness data at Cosmic Campground International Dark Sky Sanctuary (CCIDSS) in the USA (2018 September 4–2019 January 4) and at Aotea/Great Barrier Island International Dark Sky Sanctuary (AGBIIDSS) in New Zealand (2018 March 26–August 31. These sites have artificial-light-pollution-free natural night skies. The equipment employed are identical Unihedron SQM-LU-DL meters, used as single-channel differential photometers, to scan the sky as Earth rotates on its axis. We have developed new analysis techniques which select those data points which are uninfluenced by Sun, Moon, or clouds to follow brightness changes at selected points on the celestial sphere and to measure the brightness of the airglow above its quiescent level. The 2018 natural night sky was measured to change in brightness by approximately 0.9 mag arcsec−2 at both locations. Preliminary results indicate the modulations of the light curves (brightness versus R.A.) we observed are related in complex ways to elements of space weather conditions in the near-Earth environment. In particular, episodes of increased night sky brightness are observed to be contemporaneous with geomagnetic activity, increases in mean solar wind speed, and some solar proton/electron fluence events. Charged particles in the solar wind take days to reach near-Earth environment after a coronal hole is observed to be facing in our direction. Use of this information could make it possible to predict increases in Earth's natural night sky brightness several days in advance. What we have learned during this solar minimum leads us to search for other solar driven changes in night sky brightness as the Sun begins to move into solar maximum conditions.
Export citation and abstract BibTeX RIS
1. Introduction
The natural night sky is animated with its own sources of illumination. This fact has been largely overshadowed by the important effort to prevent unwise artificial nighttime lighting from blinding humans to the wonders of the universe.
There is a developing body of literature detailing the effects of artificial-light pollution on humans and ecology. Hänel et al. (2018) provide an extensive review of instruments and methods employed to measure the night sky. Their stated goal is to be a reference for interested parties in the health, ecology, and other research fields who have no experience in measuring and interpreting night sky brightness data. Tables 2 and 3 in their paper provide a summary of both natural and human caused sources of night sky brightness. They also provide an overview of measurements which can be made by single channel, imaging, and spectrophotometric instruments. No attempt is made to describe changes in the natural night sky over time.
Cinzano et al. (2001) produced "The first World Atlas of the artificial night sky brightness" which depicts in graphic detail the shocking way humans have obliterated the possibility to view the natural night sky for many of our planet's residents. Falchi et al. (2016) provide a significant improvement to the Cinzano et al. (2001) Atlas, a graphic visualization tool, and access to measures of light pollution worldwide.
The Sky Quality Meter (SQM) manufactured by Unihedron of Canada plays a prominent role in the light pollution monitoring effort. To date there have been more than 13,700 Unihedron SQM meters sold worldwide. Most of them are used to provide calibrated measures of the brightness of the night sky. These data have proved valuable in understanding the extent of human caused light pollution.
Duriscoe (2013) models sources of natural night sky brightness to characterize the effects of human caused light pollution at national parks and other remote locations. The detailed natural night sky model, described in this reference, indicates the natural night sky ranges from dark (Bortle 1, 21.7 to 22.0 mag arcsec−2) to one with moderate light pollution (Bortle 4, 20.4–21.3 mag arcsec−2) without human intervention. By subtracting this natural night sky model from calibrated all sky mosaic images Duriscoe (2013) is able to accurately locate and measure sources of artificial-light pollution.
There are additional references to the fact that the natural night sky is not a dark vault of constant brightness as is idealized by Bortle (2001). Pilachowski et al. (1989) obtained data on 12 nights at Kitt Peak National Observatory during and following a solar minimum in 1986, 1987, and 1988. Krisciunas (1997) produced a database of single-channel photometric measurements of the natural night sky on Maunakea over a whole solar cycle. His yearly averages ranged from 21.906 to 21.287 mag arcsec−2. He indicates that the scatter in the individual data points is real and dominated by short term variations on timescales of tens of minutes.
Benn & Ellison (2007) measured the night sky brightness from 427 scientifically calibrated CCD images taken with the Isaac Newton and Jacobus Kapteyn Telescopes on La Palma on 63 nights, 1987–1996. They find the night sky is brighter at low ecliptic latitude (0.4 mag) as well as at solar maximum (0.4 mag) when compared with high galactic latitudes and solar minimum conditions, respectively.
Patat (2003, 2008) measured the night sky brightness at Cerro Paranal in Chile during 650 nights, 2001–2006, using more than 10,000 VLT-FORS1 archival images. His data reveal significant seasonal as well as solar activity induced night sky brightness variations (21.02 < V < 22.30).
Neugent & Massey (2010) published new absolute spectrophotometry of the Kitt Peak night sky obtained in 2009–2010 during a deep solar minimum. By combining these data with previously published measurements they were able to conclude that the night sky over Kitt Peak had remained relatively constant over a 20 yr period. However, their zenith measurements 2009 October 17.3 UT, at an R.A. = 1h17m28s, was V = 21.51 mag arcsec−2 while on 2010 June 14.3 UT, at an R.A. = 17h12m41s, was V = 22.36 mag arcsec−2 document that the natural night sky goes through significant changes in brightness.
An SQM-LU-DL, pointed at the zenith, in a natural night sky location, records the sum total of the flux of photons from celestial sources, as well as emission from terrestrial atmosphere (airglow). The SQM-LU-DL has a lens which establishes its 20° full width at half maximum (FWHM) field of view and independently logs up to a million readings (Tekatch 2019). The rotation of Earth on its axis causes natural night sky sources to pass overhead in a parade of illuminated patterns. The celestial sources include stars, scattered starlight, diffuse light from galaxies and nebulae, as well as the Zodiacal light produced by sunlight scattered off dust in the solar system. Leinert et al. (1998) provides a tabulated catalog of sources of diffuse night sky brightness.
The spectral response of the SQM-LU-DL is set by the TSL237 photodiode detector, Hoya CM-500 filter, and weather proof housing window combination. Sánchez de Miguel et al. (2017)'s Figure 4 presents both the measured and expected (from the components) spectral response. The SQM peak response is at approximately 527 nanometers with a FWHM of approximately 215 nanometers.
Figure 2, Hänel et al. (2018) provides a comparison of the spectral responses of the SQM, Photopic vision, Johnson V, DSLR G, and a reference light meter.
SQM-LU-DL instruments have been employed in a large number of sky brightness studies (see, Hänel et al. (2018)) to obtain absolute sky brightness photometry in the sense that the measurements made with one instrument are compared with those obtained with similar, calibrated, instruments.
The Physics of the SQM-LU-DL detector suggest that it is linear down to very low light levels. A solid state charge bucket internal to the TSL237 detector accumulates charge as photons enter it. When the bucket is full the device issues a pulse. To measure the incident photon flux, the average of the time between 8 pulses is determined and used to calculate the brightness in mag arcsec−2. If there is no incident light, dark current fills the well, and eventually (158.889 s for the CCIDSS detector) a pulse is issued. Since the rate at which the dark current fills the well depends on the temperature, it is necessary to correct for this phenomenon.
Cinzano (2005) measured linearity of an SQM by analyzing the residuals of a comparison with the IL1700 Research Radiometer illuminated by a LPLAB Variable Low-light Calibration Standard (Cinzano 2003). Over a range of surface brightness of magnitudes he concludes that the deviations from linearity are less than 2.6%. This limit is set by the stability of the standard source (1%) and the linearity of the reference radiometer (1%) which were employed to conduct the tests.
Pravettoni et al. (2016) used modified testing equipment in an ISO 17025 accredited laboratory to assess the performance of 16 Unihedron SQMs in weather proof housings. These authors's linearity tests covered the urban light pollution range from 6 to 19 mag arcsec−2, yielding standard deviations from linear regressions ranging from 0.11 to 0.14 mag arcsec−2. The accompanying graphs indicate the largest deviations they measured occurred between 6 and 13 mag arcsec−2. These limits may not be at all applicable to differential photometry in the 22–20 mag arcsec−2 levels of illumination commonly found in the natural night sky. Also, Sánchez de Miguel et al. (2017) found that slight alignment errors in the optics of an SQM effects its angular response compared with other identical appearing instruments.
The Unihedron SQM-LU-DL detector (TAOS TSL237S) has a dark current which is temperature dependent. The SQM-LU-DL's internal software corrects for this phenomenon by using the temperature measured right behind the detector to correct the observed light flux.
Schnitt et al. (2013) tested a pair of SQM-LU meters, one inside and the other outside of a Unihedron weather proof housing. Both units were placed in the same laboratory temperature controlled chamber. This experiment found that the SQM-LU radiance measures remained with 7% of its initial value over a range from −15°C to 35°C with rates of temperature change from −33°C hr−1 to +70°C hr−1. The 7%, they obtained, should be regarded as an upper limit for the accuracy of the temperature correction of the detector since shifts in the optical alignment could not be ruled out as a significant source of error in this laboratory experiment. It is not clear, what if any, significant, potential detector temperature correction errors bias our measurements. Sources of error in the Schnitt et al. (2013)'s laboratory experiments and the fact that the temperatures and temperature rates of change encountered in the field were much smaller than the Schnitt et al. (2013) laboratory setup suggest that any actual temperature compensation errors are likely to be substantially less than the 7% laboratory result.
Barentine et al. (2018) report that in the field three SQM-L meters agreed with each other to on the order of 0.1 mag (10%). Unihedron, the manufacturer, states an accuracy of ±10% for an SQM-LU-DL when it is used to perform absolute photometry but adds that differential photometric measurements made with the same meter are significantly better than this figure (A. Tekatch 2018, private communication).
This paper presents new methods of analyzing SQM data in which the device is used to make single-channel differential photometric measurements of selected locations on the celestial sphere. These techniques are employed to process data from Cosmic Campground International Dark Sky Sanctuary (CCIDSS), under a special use permit from the Gila National Forest, Glenwood Ranger District in New Mexico, and Aotea/Great Barrier Island International Dark Sky Sanctuary (AGBIIDSS) in New Zealand.
Cosmic Campground is a 3.5 acre site in the Gila National Forest of western New Mexico, USA, managed by the United States Forest Service. In 2016 January it was accredited as the second International Dark Sky Sanctuary by the International Dark Sky Association recognizing the fact that CCIDSS is located in an exceptionally dark area with no permanent artificial lighting. The nearest significant source of light is more than 65 km away.
Aotea/Great Barrier Island is located about 100 km from Auckland, New Zealand. In 2017 June, it was accredited as the third International Dark Sky Sanctuary by the International Dark Sky Association recognizing the fact that AGBIIDSS has retained essentially all of its natural nighttime darkness due to the fact that nearly 60% of its 265 km2 is managed by New Zealand Department of Conservation as a nature reserve, the total absence of utility electricity on the island, and minimal development pressure from its small population of 939 persons.
The International Dark Sky Sanctuary status enjoyed by CCIDSS and AGBIIDSS are a testament to the pristine quality of their night skies and nocturnal environment. This status has been certified by making night sky brightness SQM measurements.
The data used for this project gathered from CCIDSS and AGBIIDSS are that of natural night skies free of artificial-light pollution.
2. SQM-LU-DL Performance
The measurements reported in this paper are made with SQM-LU-DL, narrow field of view, solar (CCIDSS) or battery (AGBIIDSS) powered, sky-quality meters, in weather proof housings, manufactured by Unihedron. This equipment was installed at the AGBIIDSS 2017 July 17 at 149 Sanhills Road, Medlands, on Ateoa/Great Barrier Island in Aukland, New Zealand. The instrument package, installed at the CCIDSS on 2018 July 27 was designed and built to be weather proof, varmint/bug resistant, and safe for unattended operation in a public location. A secure port 2 feet above ground allows access via USB to download data. This arrangement has the advantage of preserving the alignment of the meter inside the weather proof housing since it remains in place during the data read out process.
At both locations the instrument is pointed at zenith. As Earth rotates on its axis, each meter scans a strip of constant decl. returning to the same point on the celestial sphere 4 minutes earlier each day. These facts are employed to use the SQM-LU-DL as a single-channel differential photometer to measure changes in brightness, of the same place on the celestial sphere, with the same instrument.
For the AGBIIDSS data set, 2018 March 26–August 31, the average temperature was 11.21°C (standard deviation = 3.14°C, median = 10.30°C). The average nightly delta T (twilight to twilight) was 1.47°C and average slope was −0.32°C hr−1.
For the CCIDSS data set, 2018 September 4–2019 January 4, the average temperature was 3.34°C (standard deviation = 6.82°C, median = 1.90°C). The average nightly delta T was 7.42°C (twilight to twilight) with average slope −0.77°C hr−1.
The SQM-LU-DL Serial Number 4074, installed at the CCIDSS was calibrated at Unihedron on 2018 April 23 and had a light calibration offset of 19.94 mag arcsec−2. Anthony Tekatch of Unihedron, extensively retested this unit 2018 July. The first calibration light offset was 0.01 mag brighter than in April, however, the subsequent July retesting repeatedly produced exactly the same light calibration offset of 19.94 mag arcsec−2 previously obtained. The "light calibration offset" is a value that makes the SQM deliver the reference value (8.71 mag arcsec−2) when a reference light source (of 8.71 mag arcsec−2) is used. Tekatch's tests indicate that the instrument's zero-point is very stable.
To further test this unit, Tekatch placed it in Unihedron's dark room illuminated by a test lamp placed at a low stable setting. This test has 6272 data points, which are plotted in Figure 1. Tekatch reports outlying points 21.45 mag arcsec−2 (27 points in total of these brightest outliers) and 21.49 mag arcsec−2 (3 points total of these darkest outliers) (currently unexplained), but it is quite difficult for him to exclude all possible extraneous light sources. For more than 6 hr the readings were stable between 21.47 and 21.48 mag arcsec−2.
The cloud detection method, introduced later in this paper, requires the SQM-LU-DL data, fitted to straight line segments, (mag arcsec−2 versus time) have a Chi-Squared of less than 0.009 for a period of at least 1.5 hr. Anything smaller than the 0.009 value rejects the rising Milky Way (See Figures 14(a) and (b)). These results along with those of Cinzano (2005) imply that the differential photometry of an SQM between adjacent sky positions is likely to be significantly better than 0.03 mag arcsec−2. These results are consistent with the 0.02–0.05 mag arcsec−2 experienced by other SQM users in the field (J. C. Barentine 2019, private communication).
3. SQM-LU-DL Raw Data
Typically, the SQM-LU-DL at the CCIDSS and AGBIIDSS are programmed to record a sky measurement every 5 minutes for the portion of the day/night cycle during which the Sun is more than about 5° below the horizon (sky fainter than 10.0 mag arcsec−2). Unihedron provides a complete software package to program the device as well as to download and visualize the data. Unattended, the SQM-LU-DL can record such data for months. Each recorded data set consists of a header followed by individual data points. Each data point consists of UT date and time, local date and time, temperature in Celsius, battery voltage, the recorded mag arcsec−2, and a reference tag.
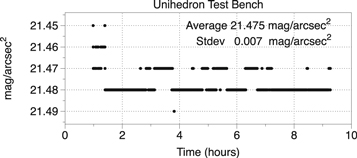
Figure 1. Plot of the recorded brightness vs. time in hours for the SQM-LU-DL stability test performed by Anthony Tekatch of Unihedron.
Download figure:
Standard image High-resolution imageExamples of sky brightness versus time data are shown in Figures 2 through 6 for the nights of 2018 September 10, 8, 2018 August 12, 10, and 2018 April 11. On clear nights the data trace is smooth and the passage of the Milky Way and Zodiacal Light overhead can be easily seen (Figure 2). Figure 3 shows that under a natural night sky the passage of clouds causes dips in brightness. Figure 4 shows the passage of an intense band of thunder storms followed by a clear sky. Figure 5 shows an initially clear night during which clouds and fog moved in causing dips in brightness. Figure 6 shows a mostly clear night punctuated by a occasional tiny clouds. In the absence of moonlight clouds cause dips in brightness while Moon illuminated clouds cause increases in night sky brightness measurements.
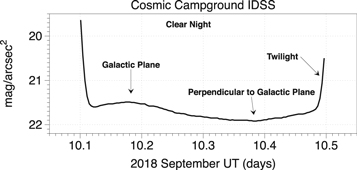
Figure 2. This data trace is a plot of the natural night sky brightness in mag arcsec−2 vs. time in UT days produced by the SQM-LU-DL on a clear, moonless night. It is composed of 115 individual data points.
Download figure:
Standard image High-resolution image
Figure 3. This data trace is a plot of the natural night sky brightness in mag arcsec−2 vs. time in UT days produced by the SQM-LU-DL on a moonless night. It is composed of 118 individual data points. Under a natural night sky, clouds produce dips in night sky brightness.
Download figure:
Standard image High-resolution image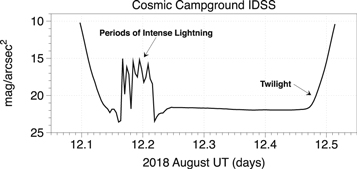
Figure 4. This plot of SQM-LU-DL data (mag arcsec−2 vs. UT days), composed of 121 individual data points, was obtained on one of the nights of the 2018 Perseid Meteor Shower. The intense band of thunder and lightning storms moving through the Cosmic Campground IDSS followed by clearing was witnessed by scores of meteor watchers.
Download figure:
Standard image High-resolution image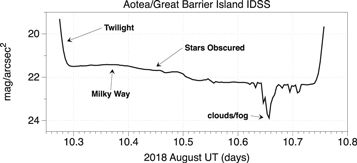
Figure 5. This plot of SQM-LU-DL data (mag arcsec−2 vs. UT days), composed of 140 individual data points, was obtained on a moonless night. The light curve of the Milky Way and Zodiacal light was recorded the first part of the night before clouds moved in for the remainder of the night. Clouds and fog cause dips in the recorded brightness at a natural night sky location.
Download figure:
Standard image High-resolution image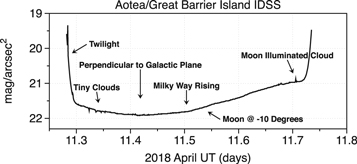
Figure 6. This plot of SQM-LU-DL data (mag arcsec−2 vs. UT days) contains 653 one minute measurements. It indicates the presence of a few very tiny clouds in an otherwise excellent sky which yielded acceptable data as the Milky Way and the Moon began to rise. The last part of the night was mostly clear but moonlit. The sharpness of the cloud spikes in the plot indicate that the clouds were likely smaller than the 20° FWHM of the SQM-LU-DL.
Download figure:
Standard image High-resolution image4. SQM-LU-DL Data Analysis
An SQM-LU-DL, pointed at the zenith, under a natural night sky, records the sum total of the flux of photons from celestial sources as well as emission from the terrestrial atmosphere. The rotation of Earth on its axis cause the celestial sources to pass overhead in a parade of illuminated patterns. Celestial sources include planets, stars, scattered starlight, diffuse light from galaxies and nebulae, as well as the Zodiacal light produced by sunlight scattered by interplanetary dust in the solar system. Terrestrial sources include airglow produced by solar photoionization and recombination, cosmic ray induced light flashes, and other processes.
The purpose of the data analysis software written in FORTRAN is to select those data points from SQM-LU-DL's data stream obtained when the Sun is more than 18° below the horizon (formulae, Schlyter 2019), the Moon is more than 10° below the horizon (formulae Meeus 1991), and the sky is free of clouds.
The 10° Moon limit is necessitated by large changes in lunar brightness as the Moon passes through its phases every month. On photometric nights, at the Cosmic Campground IDSS measurements show that if the Moon is less than 74% illuminated it provides negligible light at zenith when it is 10° or more below the horizon. The situation changes rapidly when the Moon approaches the horizon. For example, a 19% illuminated Moon, 5° below the horizon, increases the zenith sky brightness by 0.02 mag arcsec−2. The Moon's zenith illumination, when it is still below the horizon, could be effected by moisture and/or dust in the atmosphere so it is better to be conservative in selecting a value for this parameter.
The program calculates the LST of each point on the celestial sphere. These values are used to sort the data into 48 bins of  hr in R.A. Each of these bins represents approximately 1/3 of the detector's pixel. This binning preserves the achievable resolution of celestial objects as they pass overhead and allows sky brightness statistics to be calculated for each location on the celestial sphere.
The Fredericksburg Solar A and K Indices (NOAA 2019) are appended to each data point. They provide a measure of geomagnetic activity when the data point was obtained.
For each data point the program performs a linear least squares fit to the SQM brightness versus time data for 45 minutes on either side of each measurement. The resulting Chi-Squared, measures the smoothness of the curve. Clouds produce ragged traces and the photometric natural night sky produces a very smooth curve. A Chi-Squared of less than 0.009 rejects clouds but not the rising Milky Way. See Figures 14(a) and (b) for plots of Chi-Squared versus time on clear nights. Episodes of cloudy weather are rejected by analyzing the smoothness and shape of the data traces and by consulting weather records.
The cloud detection algorithm works well to select valid points from clear skies and to reject data from skies with non-homogeneous clouds. It is less effective at rejecting data obtained through thin, extremely smooth layers of clouds, dust, or haze, which could absorb perhaps 10% or less of the incoming light. To address these conditions weather data and inspection of nightly data traces are employed. Nights of fog and/or thick clouds with readings fainter than 22.3 mag arcsec−2 can be rejected since as we will show, in the next section, to date, the faintest natural night skies, measured under clear photometric conditions, are brighter than 22 mag arcsec−2. We continue to try to measure the faint natural night sky brightness limit.
The data points for which the Sun is more than 18° below the horizon, the Moon is more than 10° below the horizon, and there are no clouds as indicated by the smoothness of the SQM data versus time are written to a csv file.
Figures 7 and 8 present data obtained on partly cloudy nights. Short segments of these data traces were flagged as "clear" by the software. The nights data viewed in total and weather records called these data into question and the whole night was rejected. This procedure was repeated on other problematic nights.
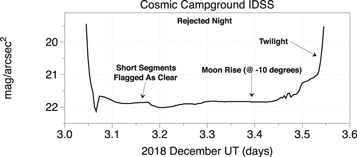
Figure 7. Plot of sky brightness vs. UT on a night where short segments of data were flagged as "clear" by the software. The irregularity of the trace suggest it is likely that clouds were present and the whole night was rejected.
Download figure:
Standard image High-resolution image
Figure 8. Plot of sky brightness vs. UT on a night where short segments of data points were flagged as "clear" by the software. The deep dips in sky brightness near 2018 April 8.41 UT are the signature of clouds and fog on a moonless night. The irregularity of the trace indicates it is likely clouds were present and the whole night was rejected.
Download figure:
Standard image High-resolution image5. Results
Unavoidable gaps in the data caused by the Sun, Moon, and clouds complicate the analysis.
It should be emphasized that in this research project, the SQM-LU-DL is used as a single-channel differential photometer to determine temporal brightness changes in the same place on the celestial sphere with the same instrument. The SQM-LU-DL is much more accurate in this mode compared with the one in which it is used to make absolute calibrated photometric measurements of the night sky.
5.1. Night Sky Light Curves
The 1,231 AGBIIDSS data points obtained on portions of 40 nights from March 26 through 2018 August 31 are shown in Figure 9. Unfortunately, bad weather during 2018 September, October, and November rendered useless the data obtained during this time.
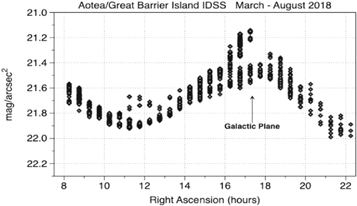
Figure 9. Plot of night sky brightness vs. position (R.A.) on the celestial sphere produces a light curve as the plane of the Milky Way and varying amounts of Zodiacal light pass through the detector's field of view. As we will subsequently show, the vertical distribution of points of this light curve are contemporaneous with changes in space weather conditions in the near-Earth environment. In particular, the slope (brightness vs. time) of the brightest points (R.A. between 16 and 17.5 hr) is contemporaneous with rapid changes in the solar wind superimposed on the light from the rising Milky Way.
Download figure:
Standard image High-resolution imageThe CCIDSS 3,555 data points obtained on all or portions of 63 nights from 2018 September 4 to 2019 January 4 are shown in Figure 10. Unfortunately, bad weather during 2018 July and August rendered useless the data obtained during this time.
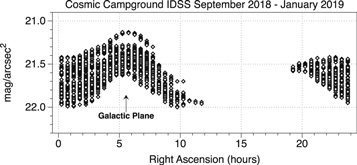
Figure 10. Plot of night sky brightness vs. position (R.A.) on the celestial sphere produces a light curve as the plane of the Milky Way and increased amounts of Zodiacal light pass through the detector's field of view. There is a larger vertical brightness distribution of points in Figure 10 compared with Figure 9. During the data collection period for Figure 10 the Sun repeatedly pointed a large canyon shaped coronal hole in our direction (Phillips 2019). This geometry bathed the Earth in streams of high speed charged particles in the solar wind at approximately 25 day intervals as the Sun rotated on its axis.
Download figure:
Standard image High-resolution imageA striking feature of Figures 9 and 10 is the smooth, well defined, curve of the lowest night sky brightness points versus R.A. The data points along these curves of minimum brightness versus R.A. are likely to represent the sum of the photon flux from celestial sources and airglow, when the Sun is in a quiescent state. Figures 11 and 12 present these data for each binned location on the celestial sphere. These data provide a baseline for measuring changes in the natural night sky.
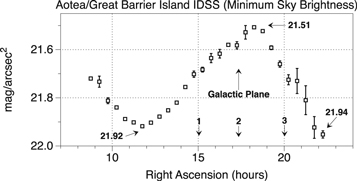
Figure 11. Plot of the minimum brightness at each location on the Celestial Sphere (brightness vs. R.A.). The minimum natural night sky brightness at each point on the Celestial Sphere occurs when the Sun is in a quiescent state and is dominated by the distribution of stars in the Milky Way and contributions from the Zodiacal light. The numbers 1, 2, 3 represent the approximate times of the SQM-LU-DL's directions of view as depicted in Figure 13. For these minimum brightness points the average Ap is 8.91 (stdev = 3.69).
Download figure:
Standard image High-resolution image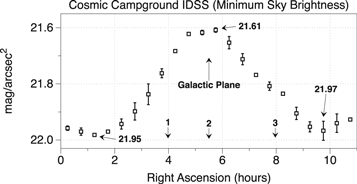
Figure 12. Plot of the minimum brightness at each location on the Celestial Sphere (brightness vs. R.A.). The minimum natural night sky brightness at each point on the Celestial Sphere occurs when the Sun is in a quiescent state and is dominated by the distribution of stars in the Milky Way and contributions from the Zodiacal light. The numbers 1, 2, 3 represent the approximate times of the SQM-LU-DL's directions of view as depicted in Figure 13. For these minimum brightness points the average Ap is 5.49 (stdev = 2.52).
Download figure:
Standard image High-resolution imageDuring 2018 the natural night sky was measured to range in brightness from 21.99 to 21.13 mag arcsec−2 at Cosmic Campground International Dark Sky Sanctuary and from 21.99 to 21.14 mag arcsec−2 at Aotea/Great Barrier Island International Dark Sky Sanctuary. The accuracy of brightest measurements at both locations is set by each instrument's calibration while the faintest measurements should be regarded as upper limits. The darkest readings reported were selected using weather forecast information and the smoothness of the nightly light curves to verify photometric conditions.
The data in Figures 11 and 12 permit one to measure changes in airglow above its quiescent value.
On Figure 13 the circles labeled 1, 2, and 3 are meant to depict the detector's smoothly advancing direction of view on the celestial sphere as Earth rotates on its axis. At both the CCIDSS and AGBIIDSS at position (and time) 1 the signal is increasing with contributions from both the Milky Way and the Zodiacal light. Position (and time) 2 represents the detector's field of view crossing the galactic plane. Position 3 (and time) represents the point at which the combined signal from the Milky Way and the Zodiacal light is declining. The shapes of light curves in Figures 11 and 12 are produced by contributions from both the Milky Way and the Zodiacal Light. This result illustrates the sensitivity of our detectors and analysis techniques.
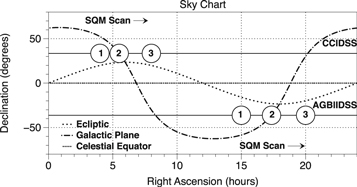
Figure 13. As Earth rotates, the SQM-LU-DL pointed at the zenith, scans the sky in a strip of decl. The round circle indicates the SQM-LU-DL's twenty degree FWHM field of view. The groups of circles are set for the latitudes of the Cosmic Campground IDSS and the Atoea/Great Barrier Island IDSS, respectively.
Download figure:
Standard image High-resolution imageA second feature of Figures 9 and 10 is the large range of brightnesses measured at each sky position on the Celestial Sphere. These data were taken while the Sun was approaching a deep minimum in the solar cycle. Published data suggests during a solar minimum night sky brightness should be between 0.40 and 0.65 mag arcsec−2 fainter than at solar maximum (Benn & Ellison 2007) (Krisciunas 1997). This phenomenon is likely the result of changes in solar daytime photoionization (followed by nighttime recombination) over the course of a solar cycle. The variation in night sky brightness over a complete solar cycle is documented by Krisciunas (1997) in his Figure 1, which plots yearly averages versus time. However, in the same paper, Figure 5, shows rapid changes in night sky brightness on a timescale of hours.
To begin to investigate the sources of sky brightness changes revealed in Figure 10 at Cosmic Campground IDSS, two consecutive exceptionally clear nights 2018 September 8–10 were identified. Figures 14(a), and (b) are plots of the Chi-Squared for the two nights from the cloud detection algorithm. These two plots show that on clear nights the SQM-LU-DL delivers an exceptionally low noise signal. Figures 15(a) and (b) are the light curves obtained on the two nights. The shape of the light curves on both nights is very similar. The sky brightness on the two nights begin to diverge due to a steady increase in the airglow which is contemporaneous with an approaching geomagnetic disturbance.
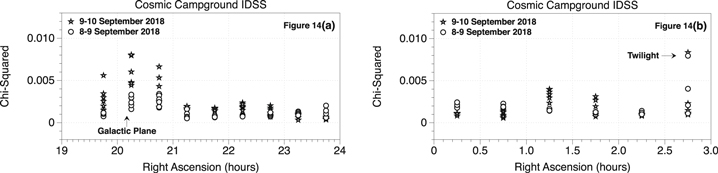
Figure 14. (a) and (b) The Chi-Squared values obtained from the cloud detection algorithm are plotted vs. R.A. in hours. The Chi-Squared for each data point is obtained by a linear least squares fit to the SQM-LU-DL data for 45 minutes on either side of each data point. Figures 14(a) and (b) confirm that these two nights were of exceptional quality and data generated by the SQM-LU-DL on a clear night has low noise.
Download figure:
Standard image High-resolution image
Figure 15. (a) and (b) On two consecutive exceptionally clear nights, the night sky brightness data are plotted vs. R.A. in hours. These data reveal the airglow on the second night is becoming steadily brighter. This increase in airglow brightness is contemporaneous with an increased geomagnetic field disturbance as indicated by the Potsdam Ap value (GFZ 2019) The next night, 2018 September 10–11, there was a G1 Class Geomagnetic storm with a Potsdam Ap of 35. It appears, we are seeing the natural night sky brighten at the beginning of a geomagnetic storm. It is hard to imagine these data being produced by an instrumental effect.
Download figure:
Standard image High-resolution image5.2. Night Sky Brightness And Geomagnetic Events
The purpose of this section is to investigate night sky brightness increases which are contemporaneous with geomagnetic events.
During solar minimum photoionization in Earth's atmosphere may be reduced, however, holes in the solar corona produce intense bursts of charged particles. When this enhanced solar wind interacts with Earth's magnetic field it produces geomagnetic disturbances, storms and auroras. The Space Weather Prediction Center (NOAA 2019) archives geomagnetic and solar data. These records include Fredericksburg daily mid-latitude and planetary A and K indices going back to 1994. Additionally, the the Potsdam Indices of Global Geomagnetic Activity (GFZ 2019) is a valuable source of geomagnetic data.
The Ap Index (scale 0–400) is a linear scale while the Kp Index (scale 0–9) is a quasi-logarithmic scale. "Ap is defined as the earliest occurring maximum 24 hr value obtained by computing an 8-point running average of successive 3 hr ap indices during a geomagnetic storm event without regard to the starting and ending times of the UT-day. It is uniquely associated with the storm event." (Allen 2004).
For 2018 the average daily difference between the Fredericksburg Ap and the Potsdam Ap is 1.02 (stdev = 1.22) indicating good agreement between these two sources. Alvestad (2019a, 2019b) maintains the "Solar Terrestrial Activity Report" which contains a compilation of current and archival solar and geomagnetic data in a very valuable format.
In the plots to follow the GEOS data (NOAA 2019), Solar and Heliospheric Observatory (SOHO)/DSCOVR data (Alvestad 2019b), Potsdam Ap data (GFZ 2019) are compared with SQM-LU-DL data from Cosmic Campground IDSS and Aotea/Great Barrier Island IDSS.
Data recorded at Cosmic Campground IDSS, in the fall of 2018, revealed that increases in night sky brightness are contemporaneous with increases in geomagnetic activity. Figures 16(a) and (b) were created to explore this observation. Episodes of increased night sky brightness are contemporaneous with disturbances in Earth's magnetic field.
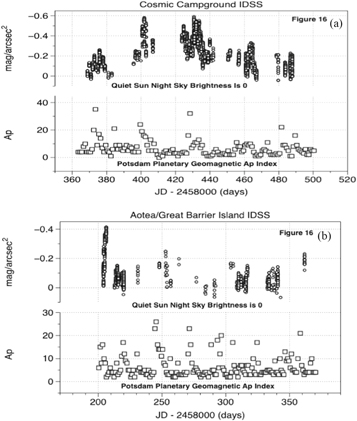
Figure 16. (a) and (b) The change in brightness of the night sky, relative to quiescent Sun brightness levels of Figures 11 and 12, and the Potsdam Geomagnetic Ap Index (GFZ 2019) are plotted vs. Julian Date. It appears that night sky brightness increases are contemporaneous with geomagnetic activity, however, the natural night sky brightness is not in a simple cause and effect relationship with the Ap Index of geomagnetic activity. It appears likely both the natural night sky brightness and the Ap Index of geomagnetic activity are driven by complex interactions with the solar wind.
Download figure:
Standard image High-resolution imageFigures 17(a)–(c) show individual night sky brightening and the contemporaneous geomagnetic disturbances at Cosmic Campground IDSS.

Figure 17. (a) The natural night sky brightness measurements at Cosmic Campground IDSS are plotted vs. their positions on the Celestial Sphere. This is a geomagnetic event (G2 geomagnetic storm see Phillips 2019) which was contemporaneous with a sky brightening episode at Cosmic Campground in 2018 September. The maximum night sky brightness occurred 3 days after the peak of the geomagnetic event. The Ap values are a measure of the disturbance of the Earth's magnetic field compared with quiet conditions (Ap = 0). The Minimum Sky (Quiet Sun) values are from Figure 12. (b) The natural night sky brightness measurements at Cosmic Campground IDSS are plotted vs. their positions on the Celestial Sphere. This is a geomagnetic event (see Phillips 2019) which was contemporaneous with a sky brightening episode at Cosmic Campground in 2018 October. The maximum night sky brightness occurred 3 days after the peak of the geomagnetic event. The Ap values are a measure of the disturbance of Earth's magnetic field compared with quiet conditions (Ap = 0). The Minimum Sky (Quiet Sun) values are from Figure 12. (c) The natural night sky brightness measurements at Cosmic Campground IDSS are plotted vs. their positions on the Celestial Sphere during a time when Earth's magnetic field was very agitated. The Minimum Sky (Quiet Sun) values are from Figure 12. The maximum night sky brightness occurred 4 days after the peak of the primary geomagnetic event. Class G1 and Class G2 Geomagnetic Storms occurred 2018 November 3–4 as Earth entered a high speed stream in the solar wind (see archive, Phillips 2019). After a lull, Earth entered another high speed solar wind stream sparking Auroras over Norway, 2018 November 10. The Ap values are a measure of the disturbance of Earth's magnetic field compared with quiet conditions (Ap = 0). The data presented in Figure 17(c) are a bit confusing in their complexity. This figure is included in the discussion to leave the reader with the impression the interactions of the solar wind and Earth which create space weather are far from simple.
Download figure:
Standard image High-resolution imageIt is interesting to note the maximum increase in night sky brightness occurs after the peak of the geomagnetic event.
Figures 18(a) and (b) show two of the individual night sky brightening events and the contemporaneous geomagnetic disturbances observed at Aotea/Great Barrier Island IDSS. A third such event at JD 2458361.3 days had too little data to plot as an event (see Figures 21(c) and (d)). The data do not reveal a simple cause and effect relationship between increases in night sky brightness and space weather conditions. See Section 6.
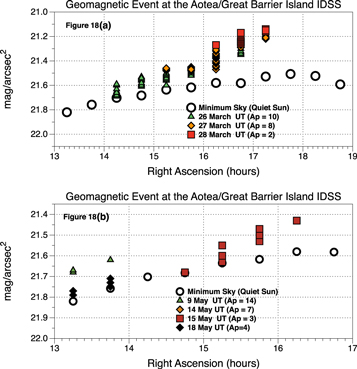
Figure 18. (a) The night sky brightness measurements at the Aotea/Great Barrier Island IDSS are plotted vs. their positions on the Celestial Sphere. The Ap values are a measure of the disturbance of Earth's magnetic field compared with quiet conditions (Ap = 0). The Minimum Sky (Quiet Sun) values are from Figure 11. On 2018 March 23 UT Earth entered a stream in the solar wind. During the ensuing geomagnetic event, Ap reached its maximum value (Ap = 16) on 2018 March 25 UT. The maximum night sky brightness occurred 3 days after the peak of the geomagnetic event. (b) The night sky brightness measurements at the Aotea/Great Barrier Island IDSS are plotted vs. their positions on the Celestial Sphere. The Minimum Sky (Quiet Sun) values are from Figure 11. The Ap values are a measure of the disturbance of Earth's magnetic field compared with quiet conditions (Ap = 0). On 5 May 2018 UT Earth entered a stream in the solar wind. During the ensuing geomagnetic event, Ap reached its maximum value (Ap = 26) on 2018 May 6 UT. Earth exited the stream 2018 May 11 UT at which time the Ap = 14. Unfortunately it was cloudy during much of this time. The maximum night sky brightness occurred 8 days after the peak of the geomagnetic event and 3 days after the Earth exited the stream in the solar wind.
Download figure:
Standard image High-resolution image5.3. Night Sky Brightness And Solar Activity
Figures 19(a)–(d) are presented to explore the relationship between elements of space weather and night sky brightness.
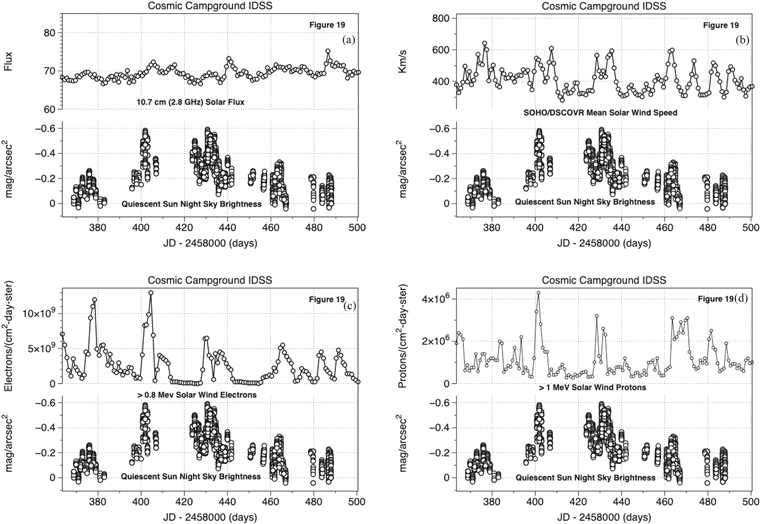
Figure 19. (a) During this period night sky brightness changes appear to be uncorrelated with the 10.7 cm (2.8 GHz) solar flux. (b) During this period night sky brightness increases appear to be contemporaneous with increases in SOHO/DSCOVR mean speed of the solar wind. (c) During this period the greatest night sky brightness increases appear to be contemporaneous with increases in GEOS fluence of solar wind electrons. (d) During this period the greatest increases in night sky brightness appear to be contemporaneous with large increases in GEOS fluence of solar wind protons.
Download figure:
Standard image High-resolution imageFigure 19(a) is a plot of the 10.7 cm (2.8 GHz) solar flux and night sky brightness measurements at Cosmic Campground IDSS relative to quiescent solar values of Figure 12. The 2018 natural night sky had brightening events even though the 10.7 cm solar flux was at a low steady level.
Figure 19(b) is a plot of the SOHO/DSCOVR mean solar wind speed and night sky brightness measurements at the Cosmic Campground IDSS. The brightness values plotted are relative to quiescent solar values of Figure 12. Brightening of the natural night sky is contemporaneous with Earth entering a stream in the solar wind.
Figure 19(c) is a plot of solar electron fluence and night sky brightness measurements at Cosmic Campground IDSS. Brightness increases plotted are relative to quiescent solar values of Figure 12. The largest increases in night sky brightness are contemporaneous with bursts of solar wind electrons at 1 au.
Figure 19(d) is a plot of the solar proton fluence and night sky brightness measurements at Cosmic Campground IDSS. Brightness increases plotted are relative to quiescent solar values of Figure 12. The largest increases in night sky brightness are contemporaneous with bursts of solar wind protons at 1 au.
Figures 20(a)–(f) explore individual contemporaneous increases in night sky brightness and GEOS solar proton fluence, and SOHO/DSCOVR mean solar wind speed at both Cosmic Campground IDSS and Aotea/Great Barrier Island IDSS.
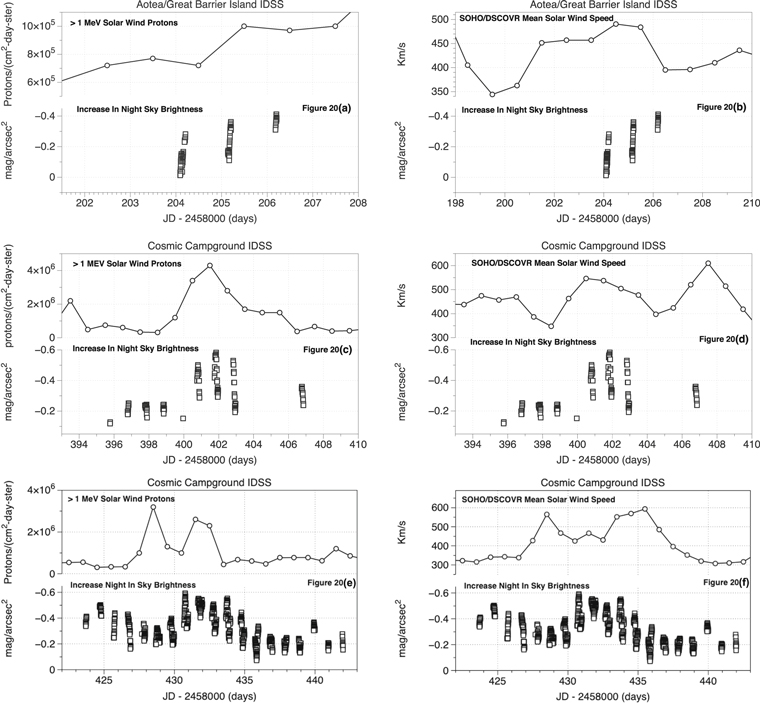
Figure 20. (a) In the upper panel GEOS Daily Proton Fluence data are plotted vs. Julian Date. The 2018 March AGBIIDSS night sky brightness relative to quiescent solar values of Figure 11 are plotted vs. Julian Date in the lower panel (see Figure 18(a) for the contemporaneous geomagnetic event). (b) SOHO/DSCOVR mean solar wind speeds are plotted vs. Julian Date in the upper panel. The 2018 March AGBIIDSS night sky brightness relative to quiescent solar values of Figure 11 are plotted vs. Julian Date in the lower panel. (see Figure 18(a) for the contemporaneous geomagnetic event). (c) In the upper panel GEOS Daily Proton Fluence are plotted vs. Julian Date. 2018 October CCIDSS night sky brightness relative to quiescent solar values of Figure 12 are plotted vs. Julian Date in the lower panel (see Figure 17(b) for the contemporaneous geomagnetic event). (d) In the upper panel SOHO/DSCOVR mean solar wind speeds are plotted vs. Julian Date. 2018 October CCIDSS night sky brightness relative to quiescent solar values of Figure 12 are plotted vs. Julian Date in the lower panel (see Figure 17(b) for the contemporaneous geomagnetic event). (e) In the upper panel the GEOS Daily Proton Fluence data are plotted vs. Julian Date. 2018 November CCIDSS night sky brightness relative to quiescent solar values of Figure 12 are plotted vs. Julian Date in the lower panel. (see Figure 17(c) for the contemporaneous geomagnetic events). (f) In the upper panel SOHO/DSCOVR mean solar wind speeds are plotted vs. Julian Date. 2018 November CCIDSS night sky brightness relative to quiescent solar values of Figure 12 are plotted vs. Julian Date in the lower panel (see Figure 17(c) for the contemporaneous geomagnetic event).
Download figure:
Standard image High-resolution imageThe data for Figures 20(a) and (b) were obtained at Aotea/Great Barrier Island IDSS in 2018 late March. The night sky brightening event was contemporaneous with only minor changes in SOHO/DSCOVR mean solar wind speed, GEOS solar proton fluence, and geomagnetic disturbances (see also Figures 21(c) and (d).
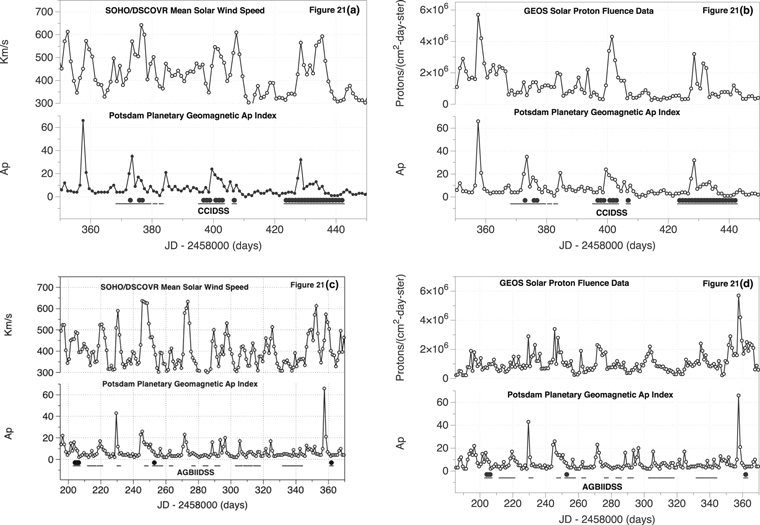
Figure 21. (a) SOHO/DSCOVR mean solar wind speed and Potsdam Ap index plotted vs. Julian Date. Above the Julian Date (JD -2458000) axis, the—symbols indicate coverage times and the • symbols indicate times when the sky brightness exceeded 0.2 mag arcsec−2 above quiescent levels of Figure 12 at CCIDSS. Night sky brightness increases are contemporaneous with Earth being in minor streams in the solar wind and with minor disturbances in Earth's magnetic field. (b) GEOS Solar Proton Fluence and the Potsdam Ap index plotted vs. Julian Date. Above the Julian Date (JD -2458000) axis, the—symbols indicate coverage times and the • symbols indicate times when the sky brightness exceeded 0.2 mag arcsec−2 above quiescent levels of Figure 12 at the CCIDSS. Night sky brightness increases are contemporaneous with minor disturbances in Earth's magnetic field. Note that increases in night sky brightness and Ap values are not always contemporaneous with increases in solar proton fluence. (c) SOHO/DSCOVR mean solar wind speed and Potsdam Ap index plotted vs. Julian Date. Above the Julian Date (JD—2458000) axis, the—symbols indicate coverage times and the • symbols indicate the times when the sky brightness exceeded 0.2 mag arcsec−2 above quiescent levels of Figure 11 at the AGBIIDSS. Night sky brightness increases are contemporaneous with Earth being in minor streams in the solar wind and with minor disturbances in Earth's magnetic field. (d) GEOS Solar Proton Fluence and Potsdam Ap index plotted vs. Julian Date. Above the Julian Date (JD—2458000) axis, the—symbols indicate coverage and the • symbols are when the sky brightness exceeded 0.2 mag arcsec−2 above quiescent levels of Figure 11 at the AGBIIDSS. Night sky brightness increases are contemporaneous with minor disturbances in Earth's magnetic field. Note increases in night sky brightness and Ap values are not always contemporaneous with increases in solar proton fluence.
Download figure:
Standard image High-resolution image
Data presented Figures 20(c) and (d) represent a relatively simple situation in which Earth enters and exits a stream in the solar wind. Data were obtained in 2018 October at Cosmic Campground IDSS.
2018 November Earth entered a series of solar wind streams of varying intensities. Figure 17(c) shows a very unstable period in Earth's magnetic field. During this period Earth entered a minor stream in the solar wind; had a lull in geomagnetic activity; experienced G1 and G2 Geomagnetic Storms; and experienced a lull in geomagnetic activity followed by an explosion in polar auroras. The data ends with Earth's exit from the series of streams in the solar wind. This sequence of events is described by the spaceweather.com archives Phillips (2019). These data show that Earth's interaction with the solar wind can be very complicated (see also Figures 17(c), 20(e) and (f)).
5.4. Summary Plots
Figures 21(a)–(d) summarize SOHO/DSCOVR mean solar wind speed data, GEOS Proton Fluence data, Ap Geomagnetic Index, and periods of increased night sky brightness at Cosmic Campground IDSS and Aotea/Great Barrier Island IDSS.
Figures 21(a) and (b) show three events at Cosmic Campground IDSS when the night sky brightened by more than 0.2 mag arcsec−2 above quiescent levels of Figure 12. In all three, a night sky brightness increase event was contemporaneous with a geomagnetic event and occurred as Earth entered a stream in the solar wind. Increases in night sky brightness and Ap values are not always contemporaneous with increases in solar proton fluence. At Julian Date 2458373.49 days there was an Ap = 35 geomagnetic storm and a contemporaneous increase in night sky brightness, however, the solar proton fluence remained at a relatively constant level (see Figure 21(b)).
Figures 21(c) and (d) show three events at Aotea/Great Barrier Island IDSS when the night sky brightened by more than 0.2 mag arcsec−2 above quiescent levels of Figure 11. In all three, a night sky brightness increase event was contemporaneous with a geomagnetic event and occurred as Earth entered a stream in the solar wind. The largest night sky brightness event occurred at Julian Date 2458206.2 days with only a small increase in solar proton fluence (see Figure 21(d)).
6. Discussion
Despite our instrument's dusk to dawn coverage every night, the observations were, unavoidably, interrupted by the Sun, Moon, and clouds. In fact, clear astronomical dark conditions accounted for only 10.1% of the total number of possible 5 minute time intervals at Cosmic Campground IDSS (2018 September 4–2019 January 4) and for only 2.7% of the possible 5 minute time intervals at Aotea/Great Barrier Island IDSS (2018 March 26–August 31). Thus, our data must be regarded as a small sample of the Space Weather's interaction with near-Earth environment.
Borovsky (2018) states in his abstract "It is well known that the time variations of the diverse solar wind variables at 1 au (e.g., solar wind speed, density, proton temperature, electron temperature, magnetic field strength, specific entropy, heavy-ion charge-state densities, and electron strahl intensity) are highly intercorrelated with each other. In correlation studies of the driving of the Earth's magnetosphere-ionosphere-thermosphere system by the solar wind, these solar wind intercorrelations make determining cause and effect very difficult." Kutiev et al. (2013) analyzes the complexities of the interactions between solar wind and Earth's upper atmosphere. The work of these and many other authors make it no surprise that in this paper we are confined to categorizing night sky brightness events as contemporaneous with, rather than being in a simple cause and effect relationship with geomagnetic events and elements of the solar wind.
Section 5.1 contains SQM-LU-DL light curves of the night sky, their accuracy on photometric nights, and how they are used to measure changes in the night sky brightness.
In Section 5.2 we present observations of individual geomagnetic and contemporaneous night sky brightness events. In every case the maximum in night sky brightness occurs approximately 3 or more days after the peak of the geomagnetic event.
Section 5.3 explores the night sky brightness events which are contemporaneous with changes in the solar activity.
Figure 19(a) shows the 10.7 cm Solar Flux is low and at a relatively constant level during a period when there were significant night sky brightness variations. Figure 4 of Walker (1988) and Figure 1 of Pilachowski et al. (1989) show a significant correlation between 10.7 cm solar flux and night sky brightness measurements when the 10.7 cm flux is above the level we encountered. Figure 3 of Krisciunas et al. (2007) shows during a solar minimum the 10.7 cm solar flux is at a relatively low value compared with near solar maximum with night sky brightness changes near the solar minimum. Figure 19(a) is in agreement with these observations. It would appear different physical processes are at work in creating night sky brightness variations during solar maximums and solar minimums, respectively.
Figures 19(b)–(d) show night sky brightness increases are contemporaneous with increases in solar wind speed, as well as, some solar wind proton and/or electron fluence events.
Section 5.4 contains summary Figures 21(a)–(d). These plots compare SOHO/DSCOVR mean solar wind speeds, GEOS Solar Proton Fluence, and Potsdam Ap Indexes with the night sky brightness increases of more than 0.2 mag arcsec−2 above quiescent values of Figures 11 and 12.
Figures 21(a) and (c) show streams of increased mean speed in the solar wind as observed by the SOHO/DSCOVR satellite. Earth's entry into these enhanced flows appears to be contemporaneous with increases in the Ap index and with brightness increase night sky events.
The greatest increases in night sky brightness are contemporaneous with large increases in solar proton and electron fluence as shown in Figures 19(c) and (d). However, geomagnetic disturbances and night sky brightness events are not always contemporaneous with increases in solar proton fluence (see Figures 21(b) and (d)). These observations indicate several different physical processes may be involved in night sky brightness events.
Cosmic Campground IDSS and Aotea/Great Barrier Island IDSS each experienced three night sky brightness events during which the night sky brightened by more than 0.2 mag arcsec−2 above quiescent values of Figures 11 and 12. For all six of these, the maximum night sky brightness occurred 3 to 8 days after the time of greatest of geomagnetic activity.
(See Figures 21(a)–(d)).
7. Conclusions
The natural night sky is never without light. It is a constantly changing kaleidoscope of celestial and atmospheric sources of illumination. The unique result of this paper is these statements are true even in deep solar minimum conditions. In particular, in 2018, as Solar Cycle 24 entered a deep solar minimum, the natural night sky was measured to range in brightness from 21.99 to 21.13 mag arcsec−2 at Cosmic Campground IDSS and from 21.99 to 21.14 mag arcsec−2 at Aotea/Great Barrier Island IDSS. The measurements show the natural night sky goes through Bortle Scale 1–4 (Bortle 2001) without human intervention. The brightest readings at both locations were contemporaneous with Earth being in an energetic stream in the solar wind blowing from a coronal hole in the Sun's atmosphere and with Earth's magnetic field being in a disturbed state (i.e., minor G1-G2 Geomagnetic Storms predicted to be possible).
The 2018 natural night sky had brightening events even though the 10.7 cm solar flux was at a low steady level.
It is likely both changes in the brightness of natural night sky and disturbances in Earth's magnetic field are driven by variations in the solar wind. In particular, there appears to be a relationship between the mean speed of the solar wind and the brightness of the natural night sky. The largest increases in night sky brightness are contemporaneous with pulses in solar proton and electron fluence. Some lesser night sky brightness events seem uncorrelated with these phenomena. These observations suggest there may be several different physical processes producing night sky brightness events. With more research, it may be possible to identify them as the temporal length of our database increases.
Charged particles in the solar wind take days to reach near-Earth environment after a coronal hole is observed to be facing in our direction. Use of this information could make it possible to predict increases in Earth's natural night sky brightness several days in advance. Scientists could benefit by incorporating these predictions into observing schedules.
Some rapid changes in natural night sky brightness could be a result of the Russell & McPherron (1973) effect which comes about when the solar wind opens cracks in Earth's magnetic field allowing charged particles to enter the upper atmosphere.
What we have learned during this solar minimum leads us to search for other solar driven changes in night sky brightness as the Sun begins to move into solar maximum conditions.
Additionally, it should be emphasized there will be unexpected changes in the natural night sky when Earth is impacted by a significant coronal mass ejection.
The raw data produced by an SQM-LU-DL demonstrates a stable instrument capable of making accurate differential photometric measurements within several hundredths of a magnitude.
The techniques introduced in this paper provide a powerful tool to relate simple, single pixel, photometric measurements of the natural night sky to solar wind changes and geometric activity. The results provide insight into the correlation between changes in the Sun and Earth's responses to them.
Appreciation is expressed to the referee whose suggestions have substantially improved this paper. Anthony Tekatch, Eric Christensen, and John Barentine provided information, encouragement, editing suggestions, and advice. In addition to content contributions, Patricia A. Grauer is responsible for editing changes which make the document coherent. The program DataGraph for macOS by Visual Data Tools, Inc. was used to make the figures in this paper.
CCIDSS
Two friends, businessmen, took their after dinner wine out on the patio while the wives cleaned up. They sat in darkness looking at the natural night sky. Robert Robinson gestured toward the natural night sky of Catron County and remarked to Bill McCabe, "Too bad we cannot use that to help the economy." Bill McCabe's online search for "dark skies," later that night, became the genesis of what is today the Cosmic Campground International Dark Sky Sanctuary.
Retired Glenwood District Ranger Pat Morrison identified the natural night sky at the Cosmic Campground IDSS and started the process to make it a part of the Gila National Forest. Bill McCabe was a relentless advocate for an astronomy campground. Craig Wentz was a member of the crew who installed the SQM-LU-DL at the Cosmic Campground. This project would not be possible without Erick Stemmerman, Adam Mendonca, Bob Shanks, John Baumberger, and other Gila National Forest employees who facilitated the data collection process.
AGBIIDSS
Special thanks to Justin LeGrice and Mark Durling for assistance with the setup and operation of the data collection equipment. The natural night sky of Aotea Great Barrier Island is located within Auckland, New Zealand's largest city hosting over a third of the countries population, and remains protected thanks to the continued commitment of the Aotea Great Barrier Island Local Board, Auckland Council and the residents of Aotea Great Barrier Island.