Pilot Measurement of Illuminance in the Context of Light Pollution Performed with an Unmanned Aerial Vehicle


Institute of Electrical Power Engineering, Lodz University of Technology, 90-924 Lodz, Poland
Remote Sens. 2020, 12(13), 2124; https://doi.org/10.3390/rs12132124
Submission received: 16 June 2020
/
Revised: 29 June 2020
/
Accepted: 29 June 2020
/
Published: 2 July 2020
(This article belongs to the Section Environmental Remote Sensing)
Abstract
:This article presents the methodology and results of pilot field illuminance measurements using an unmanned aerial vehicle (UAV). The main goal of the study was to quantify the luminous flux emitted in the upper hemisphere (toward the sky) based on obtained measurement data. The luminous flux emitted toward the sky is the source of undesirable light pollution. For test purposes, a height-adjustable mobile park lantern was constructed, at the top of which any type of luminaire can be installed. In the pilot measurements, two real opal sphere-type luminaires were considered. The lantern was situated in an open area located away from a large city agglomeration. To determine the unusable luminous flux, illuminance was measured, placing the necessary measuring equipment on board a UAV. The measurements were supplemented with the registration of illuminance on the ground upon which the lantern was installed. Based on these data, the useful luminous flux was calculated. The findings show that UAVs may be successfully used for the assessment of the influence of lighting on the light pollution effect.
1. Introduction
The consequence of the progress of urbanization, evidenced, amongst others, by the intensive use of light at night time, is the increase in the effect of light pollution. This phenomenon is indicated in the literature as an environmental nuisance that impacts humans [1,2,3,4,5,6,7,8], flora and fauna [9,10,11,12,13,14] and astronomy [15].
Various methods for assessing the impact of electric lighting on the effect of light pollution are presented in the literature. As one of the effects of light pollution is the increase in night sky illuminance, this illuminance can be evaluated by analyzing sky images captured with a digital camera and fisheye lens [16]. Another less costly method is the measurement of night sky illuminance with a sky quality meter (SQM) [17,18,19]. Besides SQM, illuminance meters have been used in some research [20] to measure land illuminance. A popular evaluation method is the analysis of satellite images of the earth’s surface at night [21,22]; however, a drawback of this method is that images, when the area is covered with clouds, cannot be used. Based on satellite images, changes in light emissions can be globally assessed. To locally analyze artificial lighting, which is a source of light pollution, some authors assessed this phenomenon using the results obtained during night flight research [23]. Unfortunately, airplane-based research is expensive, which limits their widespread use. To determine the impact of a specific lighting installation on the effect of light pollution, a single lighting luminaire or a given object (e.g., large-area light advertising), drones, and air balloons may be used. The characteristics of the measuring apparatus used for monitoring light pollution from drones or air balloons were reported [24], as well as a wide review of optical sensors used to detect light emission in terms of light pollution [25]. The concept of measuring the distribution of light emitted by a football field using unnamed aerial vehicles (UAVs) was presented [26,27]. The studies showed that UAVs provide the opportunity to measure light emitted towards the sky.
Lamp posts are one of the many sources of light pollution. The emission of luminous flux toward the sky adds to the increase in night sky illuminance. However, the illuminance level is dependent on many factors outside of the spectrum of illuminance, such as the degree of pollution, fog, or the presence of clouds [28,29,30]. Due to the complexity of the problem, the studies were focused on lamp posts as a source of light-generating light pollution.
When assessing the impact of a luminaire on the effect of light pollution, three essential elements should be considered: method of light distribution by the luminaire [31], spectral characteristics of the emitted radiation [32], and reflexive properties of the substrate [33,34] on which the light is installed. To assess light pollution by a specific luminaire, a simulation [35,36] can be performed using computer software that enhances the process projection of outdoor light. Calculations require a file with the photometric data of a luminaire. Most files with photometric data of luminaires can be downloaded from the website of the producer of a given fixture. Otherwise, laboratory measurements can be performed on the basis of which a file with photometric data can be generated [37] and subsequently implemented in software. The software permits fixing the reflexive properties with the help of the total reflection coefficient. However, the calculation process (performed by the software enhancing the projection process of outdoor light) does not consider the spectral radiation distribution emitted by the luminaire together with the spectral substrate reflection coefficient (the characteristics of spectral reflection coefficient are constant). The effect of the luminous flux reflection emitted by the luminaire off the substrate (which shows reflection-selective features, e.g., grass) produces a change in spectral radiation distribution. Each reflexive surface, which should be treated as secondary light sources, has its own characteristics of luminous flux distribution. Therefore, mirroring real conditions when using computer software is problematic. Considering the spectral radiation distribution emitted by the luminaire and the reflexive properties of the substrate is essential when analyzing light pollution. The preparation time to record the measurements and a testing pre-phase required slightly more than one year.
To consider actual conditions when assessing the impact of park-type luminaires on light pollution, in this study, the first pilot measurements in Poland were recorded with the use of a UAV, which is commonly called a drone. In scientific areas, drones have been mainly used for capturing images to assess environmental conditions [38], analyze changes in climate impact [39], detect fire [40], quantify natural stock [41], evaluate air quality, [42] and monitor hazardous areas [43]. However, the number of works reporting the results of photometric measurements is limited. The results of experimental studies in relation to road luminaires were described [44], where a small helicopter equipped with a visual luminance meter was applied. These studies were conducted in Italy and were supported by the Agenzia Nazionale per le Nuove Tecnologie (ENEA). In turn, the authors of the paper [45] have proposed a concept of light pollution measurement using unmanned aerial vehicles. Based on a series of photos taken above the highway, city square, and tennis court, luminance was determined using image processing tools for each pixel. To the author’s knowledge, no measurements have been carried out for individual decorative park luminaires that emit light in both the upper and lower half-spaces. In order to determine the value of the luminous flux emitted towards the sky by a real park luminaire, taking into account real conditions, the author attempted to carry out field measurements using UVA.
2. Materials and Methods
A vast assortment of manufactured and used luminaires is available. Luminaire producers of outdoor light offer a wide variety of ideas with new designs of high esthetic value. When browsing the choice of electric lighting installation solutions used for green areas (squares, parks, etc.), a popular type of luminaire is the opal sphere type. These can be observed along roads with low traffic volume, car parks, sidewalks, and bicycle paths [46]. One characteristic feature of this type of luminaire is a large emission of radiation with upper hemispherical luminous flux (in the direction of the sky), which significantly influences the increase in the light pollution effect.
The literature on light pollution often recommends covering the luminaires to limit the luminous flux emitted directly toward the sky. This suggestion was answered by the producers of luminaires covering the upper surface of the lampshade. The popularity of this type of luminaire is mainly due to the low price and their applicability to almost any type of light source. This is why the opal sphere type was selected in the pilot measurement.
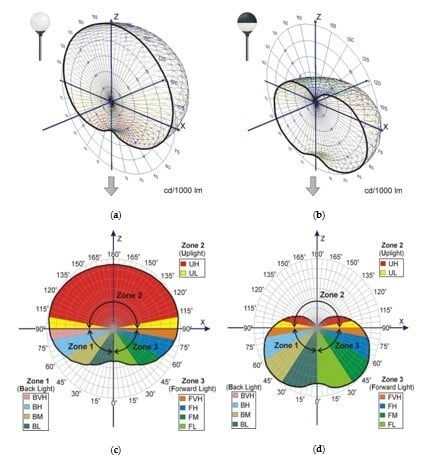
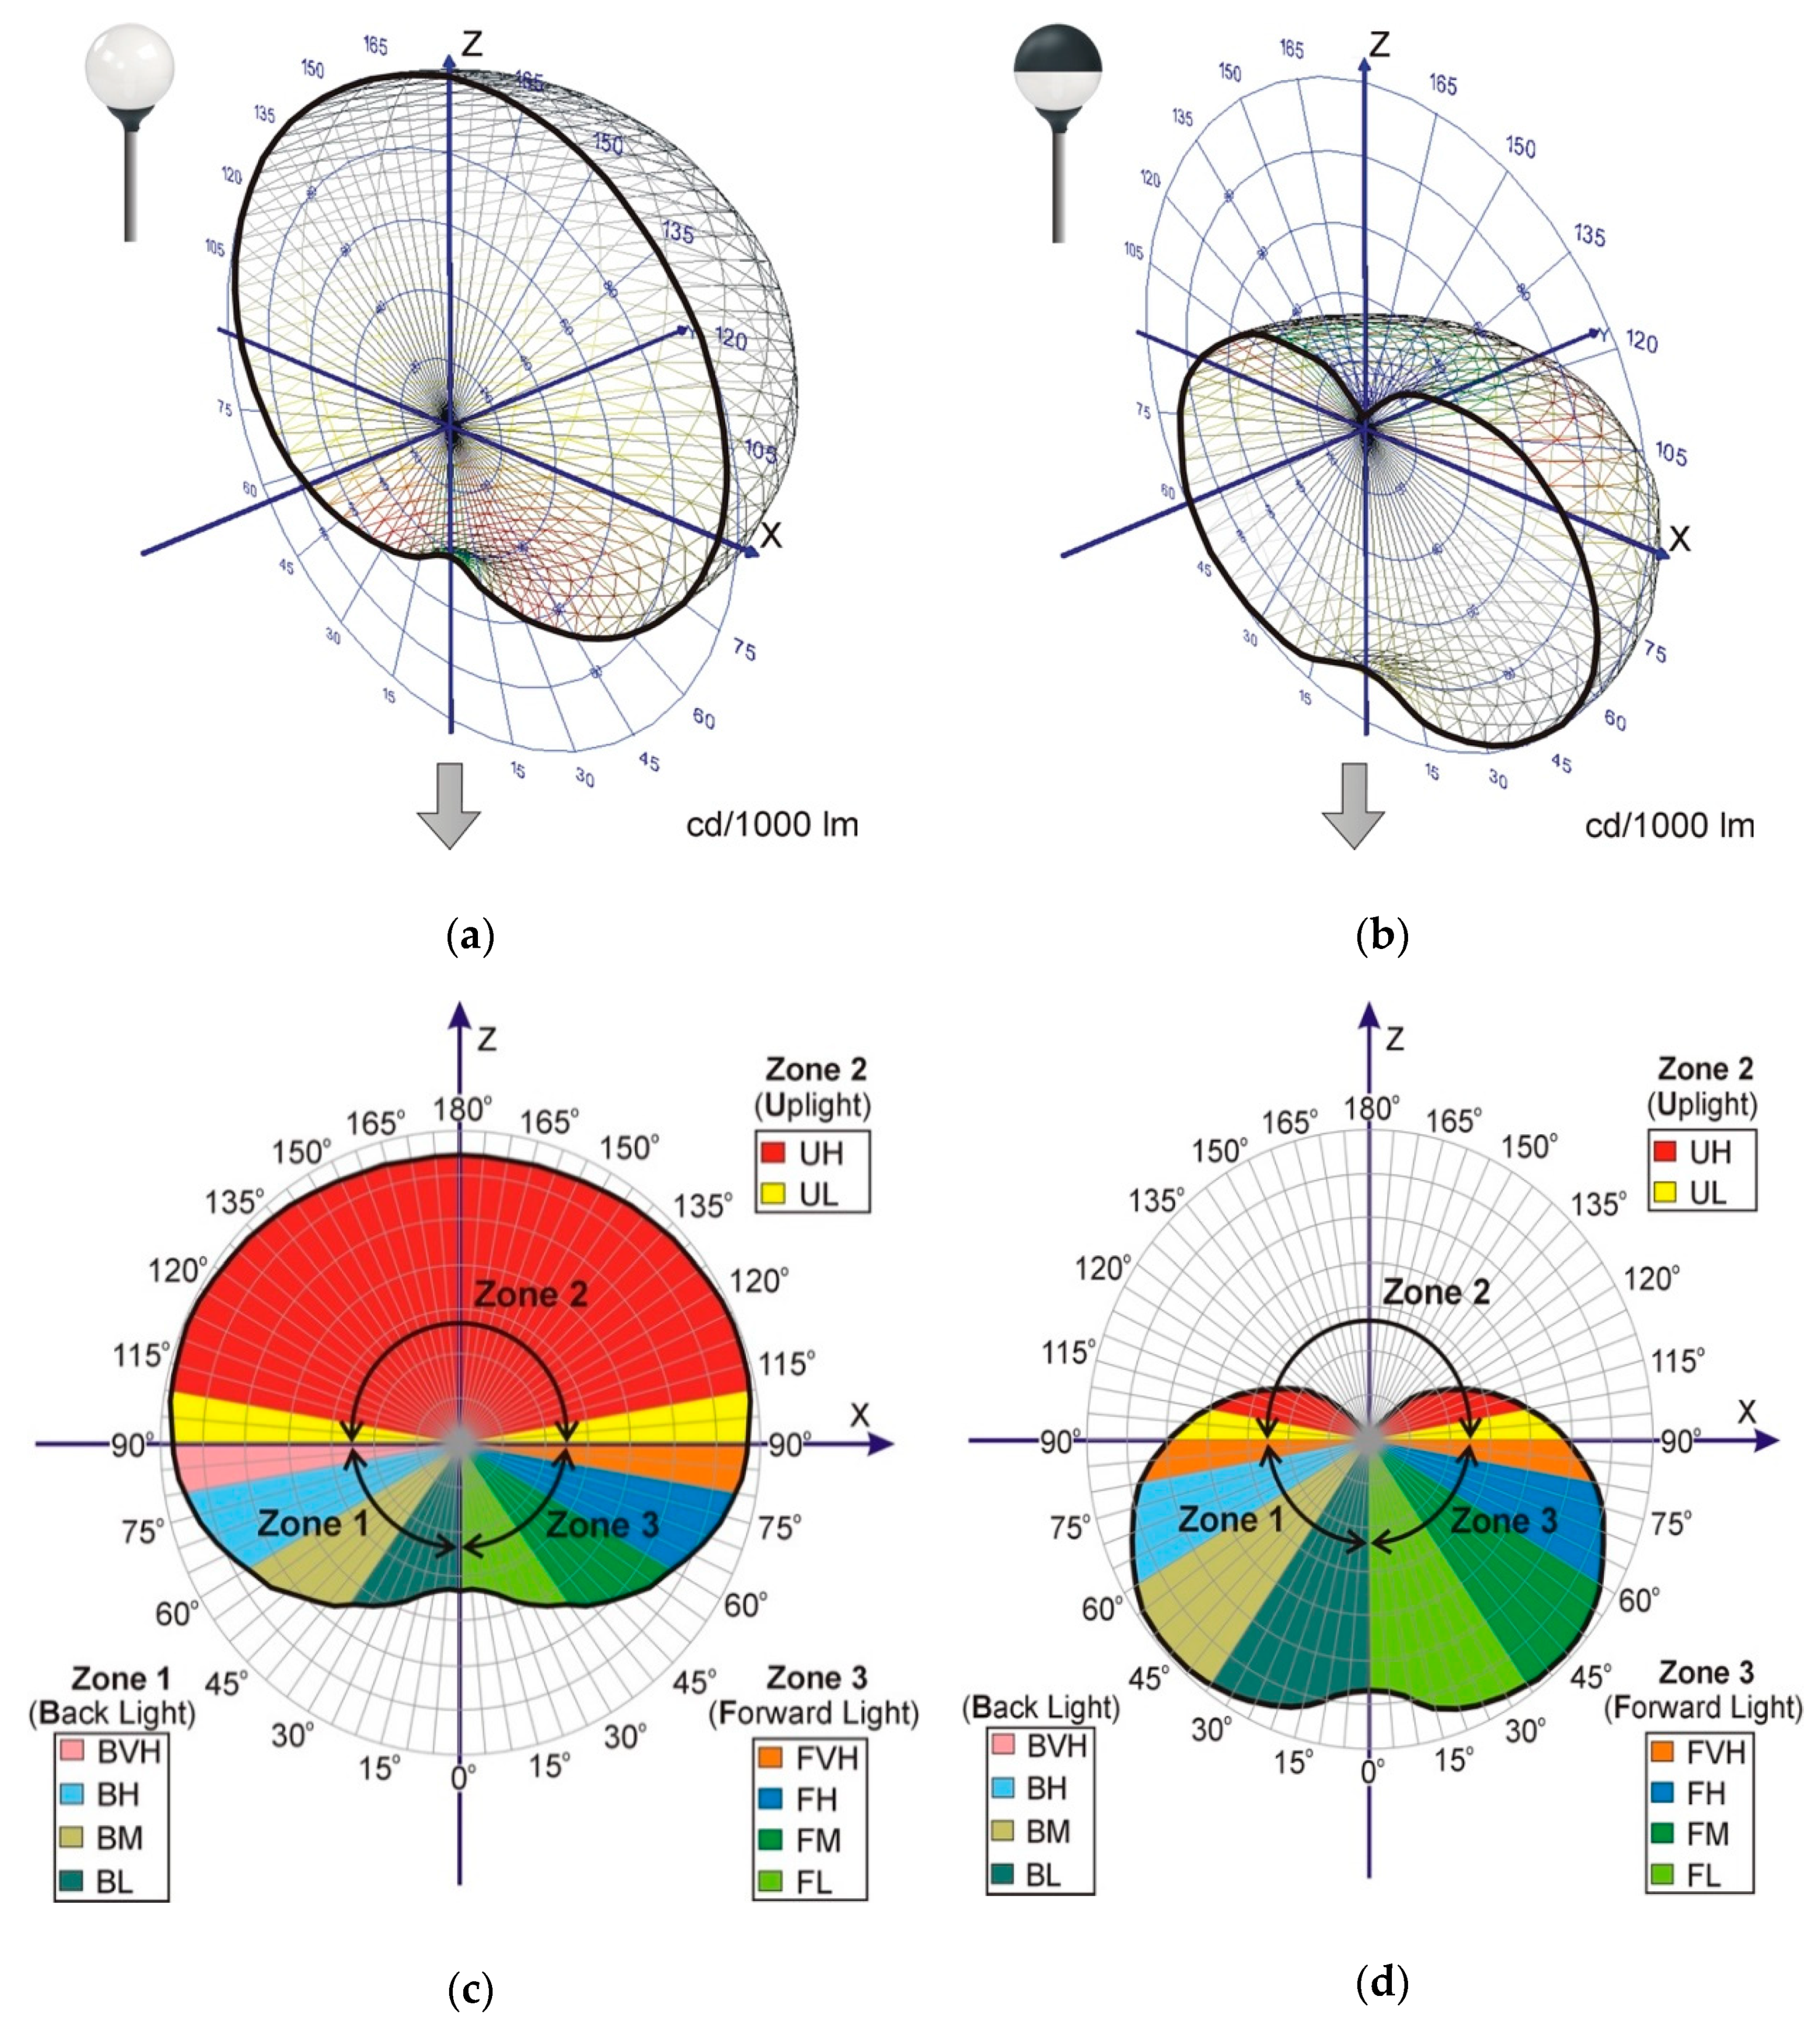
Laboratory measurements were recorded for two opal sphere luminaires for which a photometric solid was determined. The obtained measurement results are graphically visualized in Figure 1. The photometric body includes the basic set of information on the photometric properties of the luminaire [47,48], fully representing the photometric properties. For an opal-sphere-type luminaire, photometric solids symmetrically and rotationally represent the forms (Figure 1a). In this context, a photometric solid may be represented as a profiled curve in the flat system (Figure 1b). Flat-pollution-wise, a commonly used luminaire criterion is linked to the division of luminous flux of the luminaire into the upper and lower hemispheres. A measure limiting the light emission into the upper hemisphere is the upward light output ratio (ULOR) ULOR that describes the percentage of the total luminous flux produced by a light source (or sources, if there are more than one in a luminaire) emitted into the higher hemisphere [49]. For lower light pollution, the ULOR should be as low as possible (preferably 0). Usually, manufacturers provide information on the ULOR value in the luminaire specifications. However, this indicator does not always provide information on the percentage of luminous flux emitted in the upper half of the space. The indicator that provides information on the percentage of luminous flux emitted above the horizon line by the luminaire is the upward light ratio (ULR), also known as upper flux fraction (UFF). Thus, ULOR and ULR are two different indicators. However, the ULOR value may be equal to that of the ULR. This situation occurs, e.g., in the case where the luminaires do not emit any light at all above the horizon (in this case, ULOR = ULR = 0%).
In external conditions, due to the need to illuminate horizontal surfaces (ground) and the increasingly urgent need to protect the environment against light pollution, luminaires that emit luminous flux toward the ground should be used. The parameters describing the percentage of luminous flux emitted in the lower half-space are downward light output ratio (DLOR) and downward flux fraction (DFF). The former is the quotient of the luminous flux of the luminaire sent to the lower half-space to the total luminous flux of the light source; the latter provides information on the percentage of the total luminous flux emitted by the luminaire emitted below the horizon. From the viewpoint of energy efficiency, an important parameter describing luminaire efficiency is the light output ratio (LOR). This parameter indicates what percentage of the luminous flux generated by the light source leaves the luminaire.
A more precise classification of the luminaire on the basis of percentage share of the luminous flux in particular angle zones is the backlight, uplight, glare (BUG) classification. This system was devised by the Illuminating Engineering Society (IES) [50] and is promoted by The International Dark-Sky Association (IDA). Generally, the BUG system divides the photometric solids of the luminaire into three zones. The bottom left-hand quarter of the photometric solid (zone 1, Figure 1) is marked with the letter B (backlight). The upper part of the photometric solid (zone 2, Figure 1), radiation emitted in the upper hemisphere, is responsible for sky glow and is marked with the letter U (uplight). The bottom right-hand quarter (zone 3) is marked with the letter G (glare); however, the marking of zone 3 starts with the letter F (front). Each of the above-mentioned zones is further divided into sub-zones. Zones 1 and 3 include sub-zones marked as low (L), mid (M), high (H), and very high (VH). Zone 2 includes sub-zones low (L) and high (H).
Based on the method of light distribution by the luminaire, determining the value of the luminous flux emitted in the direction of the sky is impossible. Factors such as the location of the luminaire (presence of buildings, trees, etc.) are very important for this issue.
The BUG classification considers the total luminous flux (in lumens) in particular angle zones. For each of B, U, and G, the classification system provides scores in the range of 0 to 5. The more the total luminous flux is emitted from a given area, the larger the number. The boundary values of luminous flux in particular sub-zones on the basis of which BUG classification is set are shown in TM-15-11 [50].
Table 1 provides results of the calculations of the parameters and indicators based on the measurements recorded for opal-sphere-type luminaires equipped with a light source of 7700 lm.
As exhibited in Table 1, covering the opal shade with black paint (luminaire No. 2) decreases the luminous flux emission into the upper hemisphere FL. In the case of zone 2 (uplight), the result is a decrease in the luminaire class from U5 to U3, which is beneficial for decreasing light pollution. Unfortunately, covering the upper hemisphere of the luminaire shade also considerably limits the total luminous flux of the luminaire. In other words, with this solution (luminaire No. 2), some of the luminous flux produced by the light source is lost (absorbed by the shade), which consequently lowers the luminaire efficiency by 50.5% (from 80.6% to 30.1%).
The material of the luminaire lampshade provides diffusion properties. Covering the upper half of the lampshade with black paint does not eliminate the emission of luminous flux to the upper half-space (above the horizon). Thus, the lower half of the lens participates in the emission of light above the horizon, as confirmed by the curve of light presented in Figure 1d. The situation is similar to the case of the upper part of the lampshade, which also participates in the emission of light in the lower half-space. Covering it with an impermeable paint limits the emission of light toward the ground.
3. Subject and the Scope of the Research
Two opal-sphere-type luminaires were subjected to experimental tests, the photometric properties of which are given in Figure 1 and Table 1. The luminaire was assumed as being installed at a height of 4 m, typical for park lamps. The scope of the research included recording the illuminance on a virtual measuring grid placed directly on the ground and on the grid (parallel to the ground) located at a height of 14 m from the ground. To implement the project, a number of partial tasks were performed, which included:
- Selecting a drone model suitable for the intended purpose from a wide range of sellers;
- Choosing a wireless data transmission technique and developing a recording method;
- Construction of a portable park lantern;
- Finding a suitable place to record field measurements;
- Recording measurements;
- Performing the analysis of results obtained from measurements.
3.1. Task 1: Selection of the UAV Model
For measuring the illuminance from the air, it was decided to use a UAV, the selection of which would affect the measurements. Due to the constantly growing number of drones, UAVs can be classified according to various criteria (e.g., mass, payload, range, speed, engine types, etc.). In general, in terms of use, drones can be divided into two main groups: military drones and civilian drones [51]. For obvious reasons, attention was focused on civilian drones. Finally, a UAV (model Matrice 600 PRO, company SZ DJI Technology Co., Ltd., Shenzhen, China) with a take-off weight of 15.5 kg was selected. After deducting the drone’s own weight including batteries (9.5 kg), it can be equipped with a load of up to 6 kg. As the selected drone is one of the largest units available on the market (wingspan after UAV spread close to 1.7 m), it was necessary to acquire piloting skills. Before flying in the field, many hours were spent on a dedicated flight simulator. Flying along the planned route is not possible without specialized (paid) software. Unfortunately, at least several such programs are available, not all of which are suitable for field measurements. Choosing the right software was difficult because the modest description prevented the determining of the scope of its possibilities. The UAV distributor recommends an application on a smartphone for its operation. The application name is Itchi. Unfortunately, the app does not allow the precise planning of a flight route. The geographical coordinates are entered manually. In turn, the UAV manufacturer recommends its own DJI GS PRO software. Unfortunately, the version of the software offered is only available for Apple equipment. Since this kind of equipment was not available to the author, it was decided to use UgCS software (company SPH Engineering, Riga, Latvia), which was suitable for the UAV model that was used in the experiment.
3.2. Task 2: Wireless Data Transmission and Recording
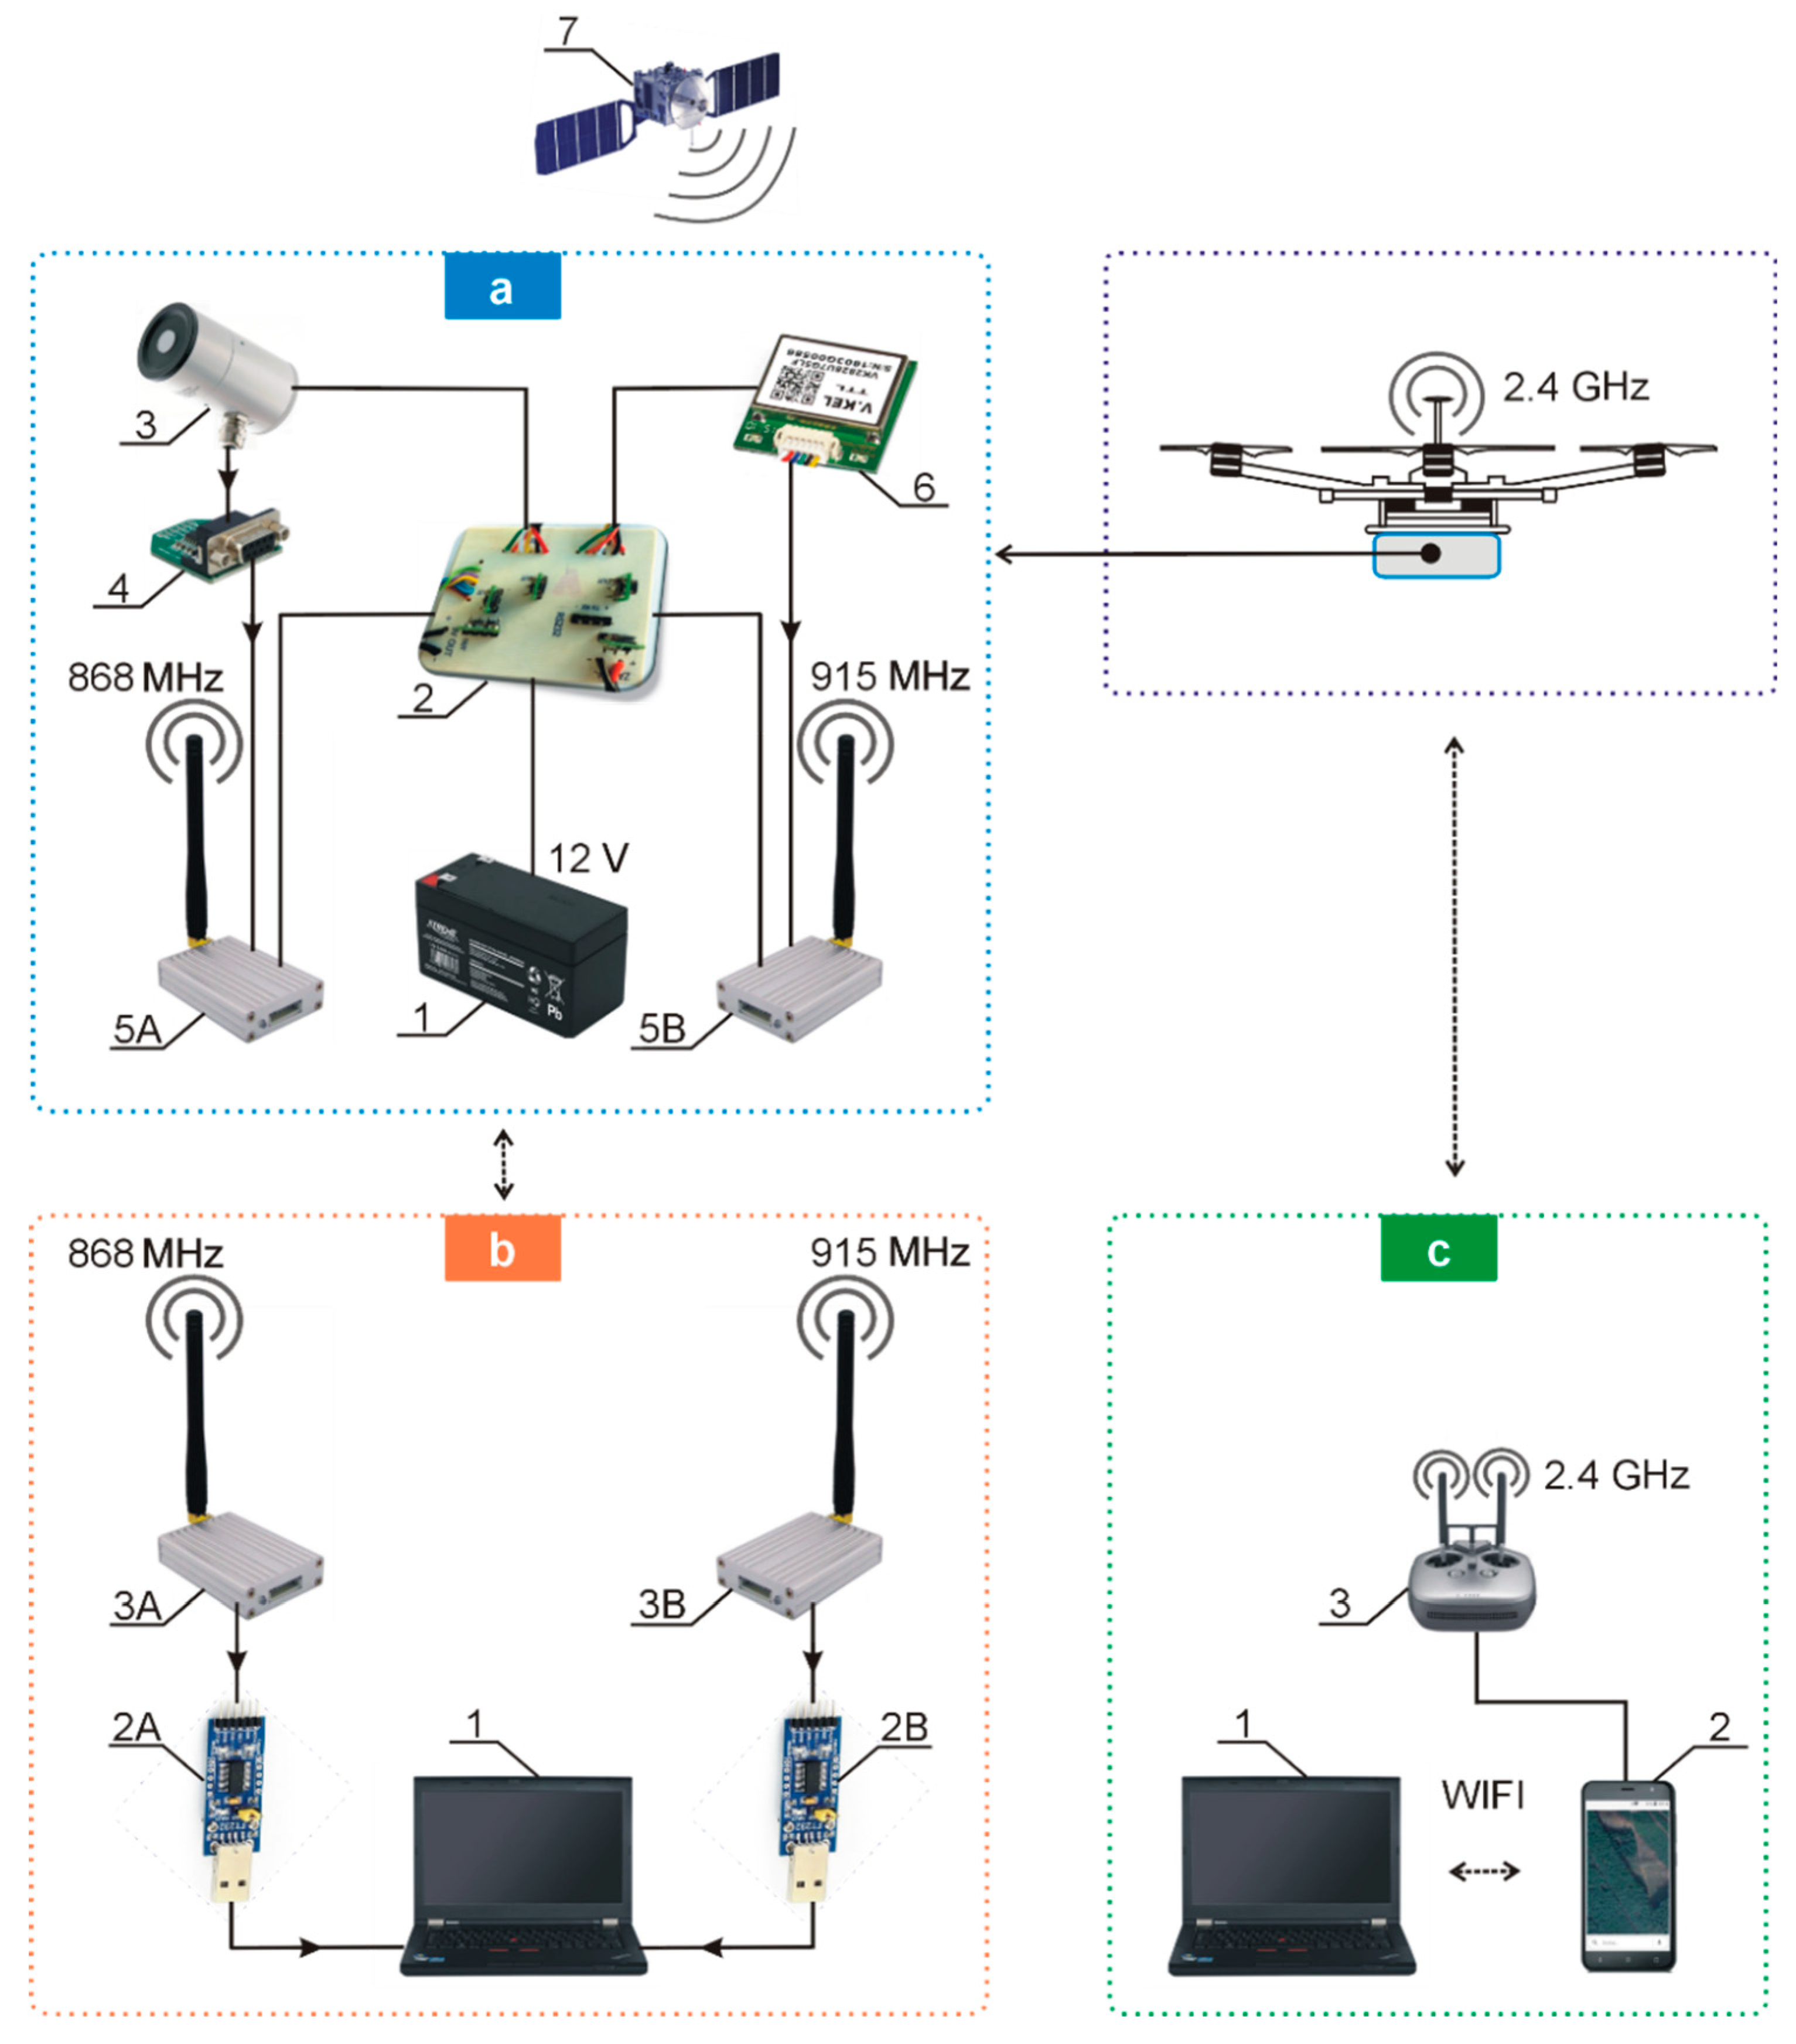
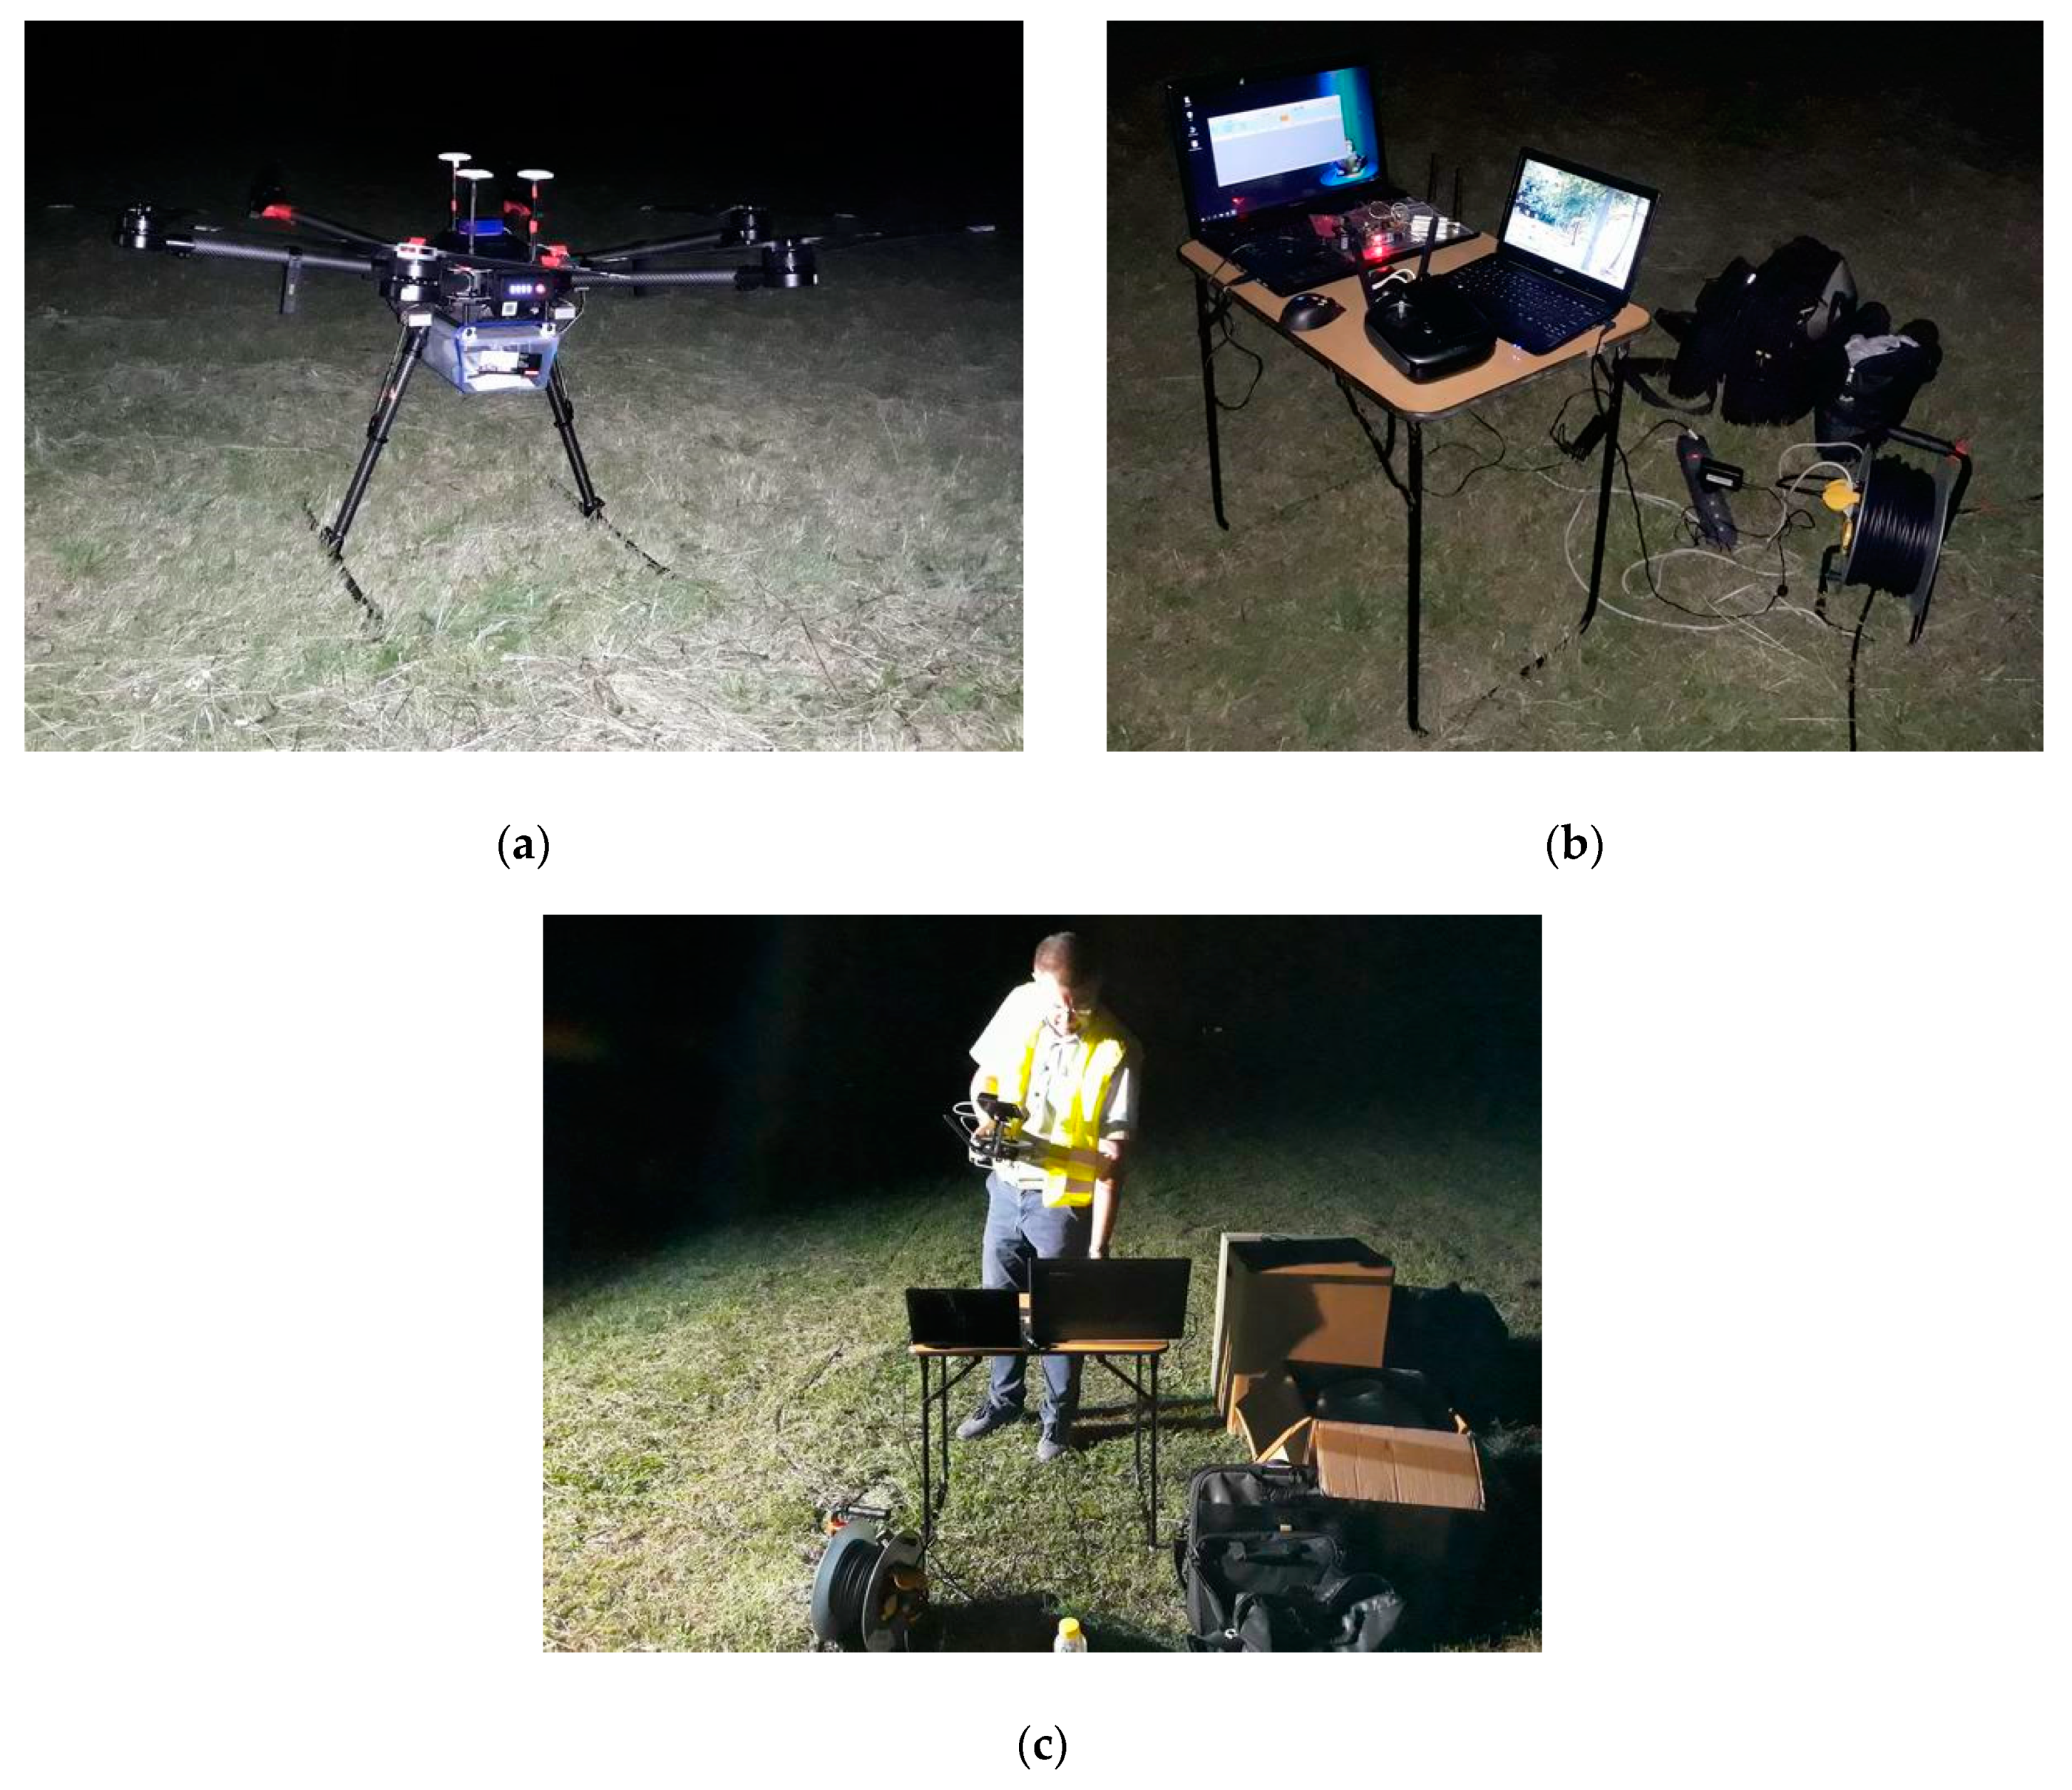
For ground measurements, a cable was used for communication. When recording measurements from the air, the data recorded by the illuminance meter was sent to the ground. Ready-made solutions on the market for simultaneous registration of an illuminance meter together with its geographical location are not available on the market. A plastic box was attached to the drone’s construction, in which all the necessary measuring equipment was placed together with the power source (Figure 2, block A). The weight of the entire load was 1.3 kg. All equipment placed on the drone deck was powered by an additional battery (12 V, 1.2 Ah). An illuminance meter was placed in a box attached to the drone. The photometric head of the illuminance meter was placed in a hole cut out in a central place in the bottom of the box so that the photosensitive surface was directed toward the ground. To send the recorded illuminance values to a computer located on the ground, a radio transmitter was connected to the illuminance meter via an RS232/UART (Recommended Standard 232/Uuniversal Asynchronous Receiver-Transmitter) converter. Along with sending the measured illuminance value, the information had to be sent about the current location of the UAV. For this purpose (except for the illuminance meter), a GPS (Global Positioning System) receiver cooperating with the transmitter was installed. Data from the equipment attached to the drone (recorded value of illuminance together with the current location of the drone) was transmitted to the computer on the ground using radio communication at the following 868 and 915 MHz. The computer communication with the equipment attached to the drone was purposefully selected. Due to the controller controlling the drone (Figure 2, block C) communicating via a frequency close to WiFi (2.4 GHz), to eliminate possible interference, the use of the WiFi module for the transmission of measurement data was abandoned. The transmitted data, i.e., the measured illuminance value and the current UAV location (geographical coordinates), were received by receivers connected to the PC via UART/USB converters (Figure 2, block B). The PC was equipped with proprietary software that allows for the saving of data to a disk from two sources: the illuminance meter and the GPS module. Data were in online mode so data transmission could be monitored in real-time, which simultaneously confirmed the proper operation of the entire measurement system onboard the UAV. In the absence of data transmission (as occurred once), the UAV was brought to the ground to locate and eliminate the defect in the measuring system. Figure 3 contains photos of the drone and drone flight operation station.
3.3. Task 3: Model of the Park Lamp Post
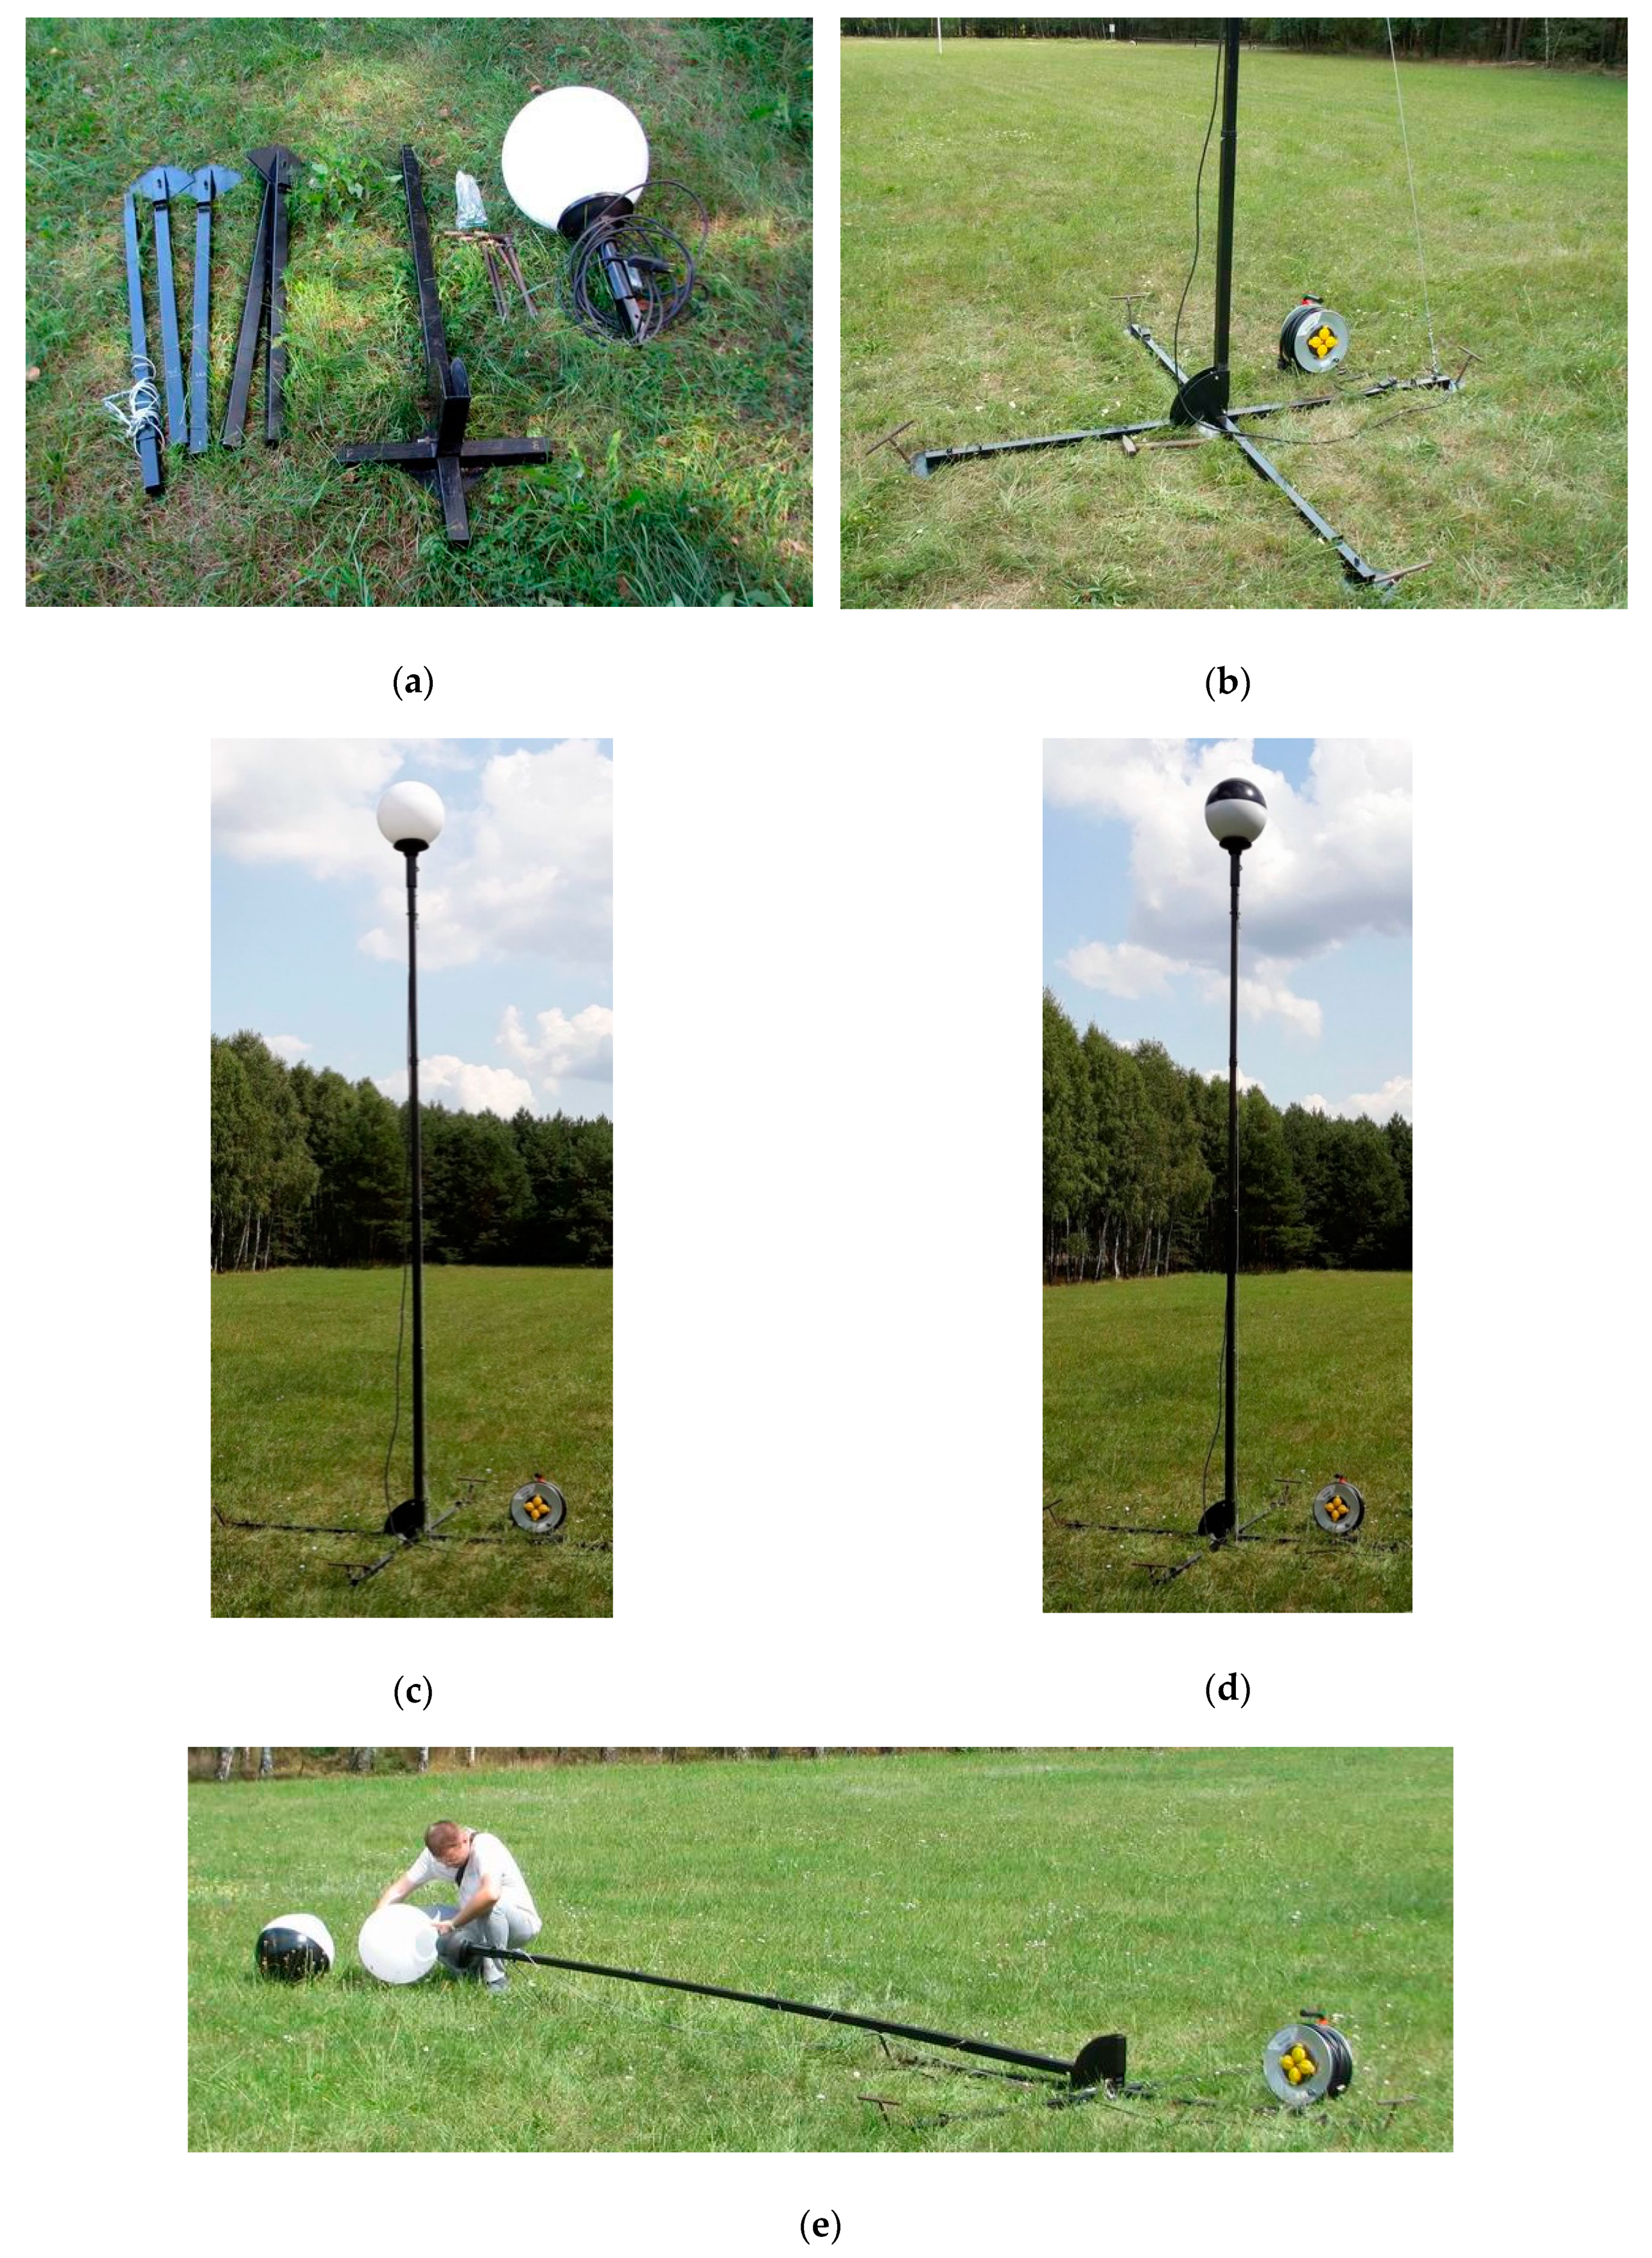
Park luminaires are typically installed at a height of 4 m. For this study, a supporting structure (a pole) was devised. To enable field experiments, the pole structure was designed so that it could be easily moved from place to place (using a passenger car). Thus, the longest dimension of the column components could not exceed 1 m (Figure 4a). The height of the supporting structure (a mast) can be freely adjusted (designed to achieve 4 m as standard (Figure 4c), but the height can be lower or higher). The support structure allows the installation on any park luminaire due to the replaceable insert at the top of the pole. Installing the lamp post began by assembling the base (Figure 4b); the anchors at the end were mounted into the ground. This solution prevents the lamp from tipping over. Then, after assembling the mast and installing the luminaire at its end (these activities were completed in a horizontal position (Figure 4d)), and the mast was raised to a vertical position.
3.4. Task 4: Finding a Suitable Location for Measurements
An important task (and contrary to appearances, not an easy one) was to find a suitable place to record field measurements. Due to the specificity of the studied phenomenon and the pilot nature of the research, an open area was sought, located away from any large agglomeration. The lack of near light sources (lighthouses) is important as they could affect the results of the measurements. A forest clearing (in the village) located away from any residential areas appeared to be a suitable location for field trials. The owner of the land was asked for permission to carry out the measurements. Since the measurements were recorded using a UAV, it was confirmed that UAV flights were permitted by law in the airspace in which flights were planned.
3.5. Task 5: Measurements
A number of field trials and tests were carried out before the measurements. The first trial (test) measurements were recorded during the day to verify the proper operation of the designed system for data transmission and recording. After positive test results were confirmed, the final measurements were planned. Due to the specificity of the measurements, they needed to be performed after dark. The day before the scheduled measurements, the weather forecast was checked to avoid poor weather conditions (i.e., strong gusty winds, storms, rains, etc.). The measurements were recorded during a holiday period (at the turn of July to August). The measurement methodology is described in more detail below.
3.6. Task 6: Formulation of Measurement Results
The last task was to formulate the results obtained from the measurements. To present measurement data in three-dimensional space, the geographical coordinates were transformed.
4. Methodology for Measuring Lighting Intensity
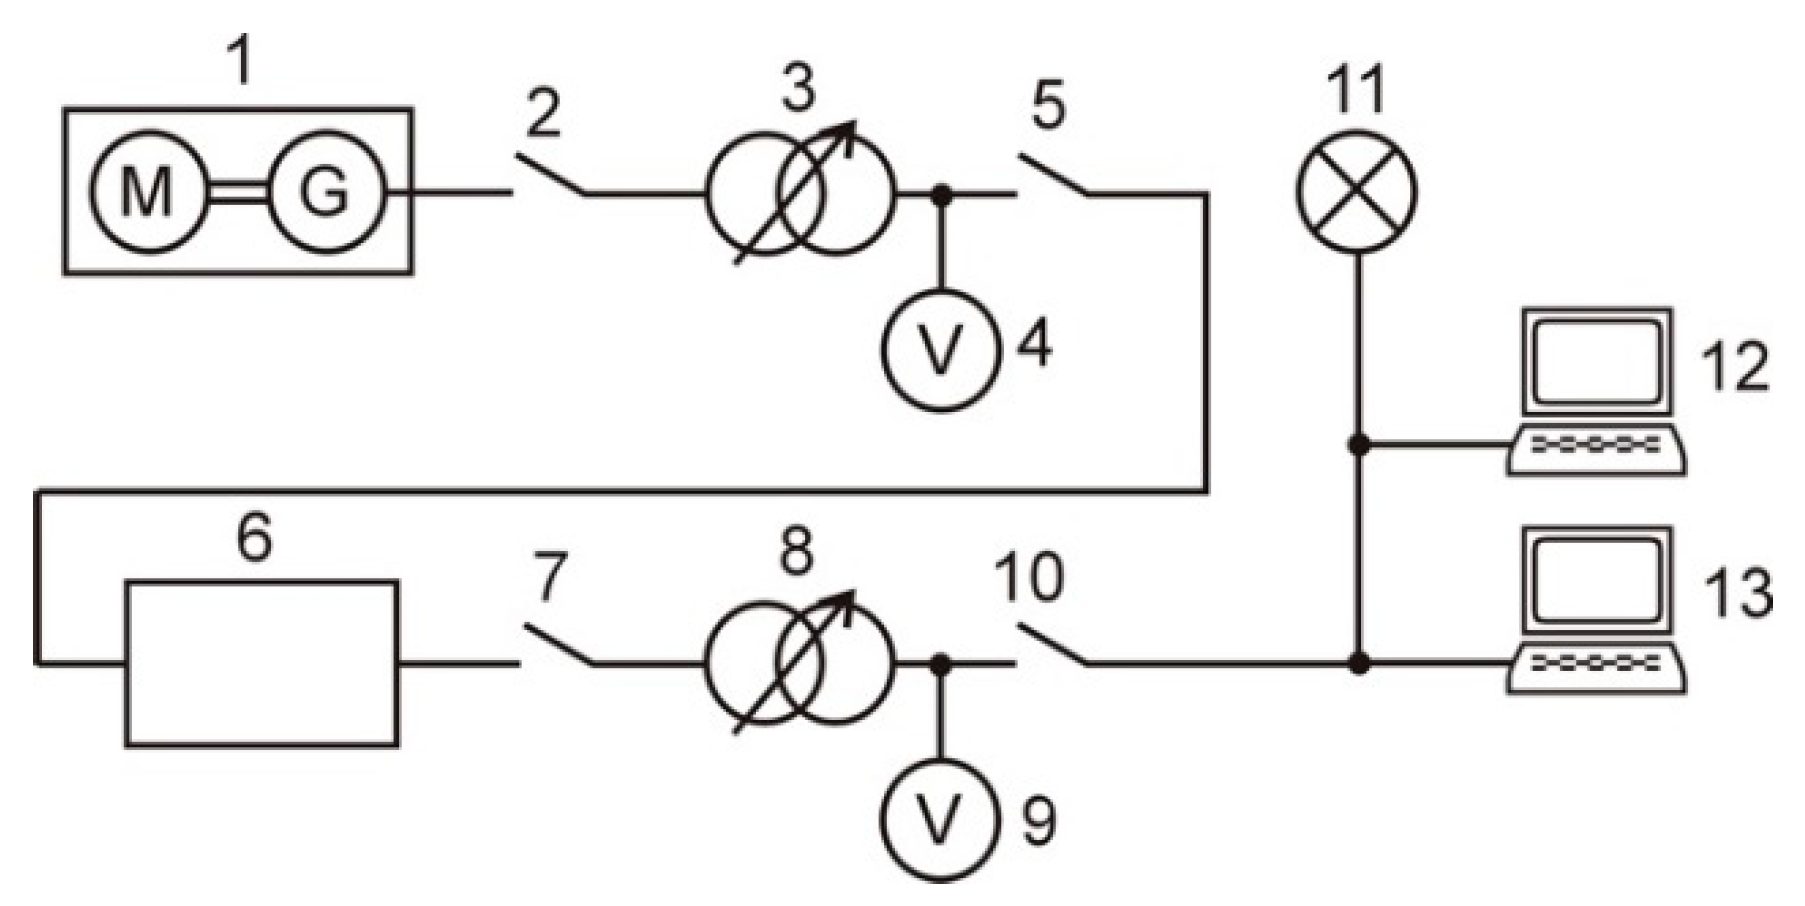
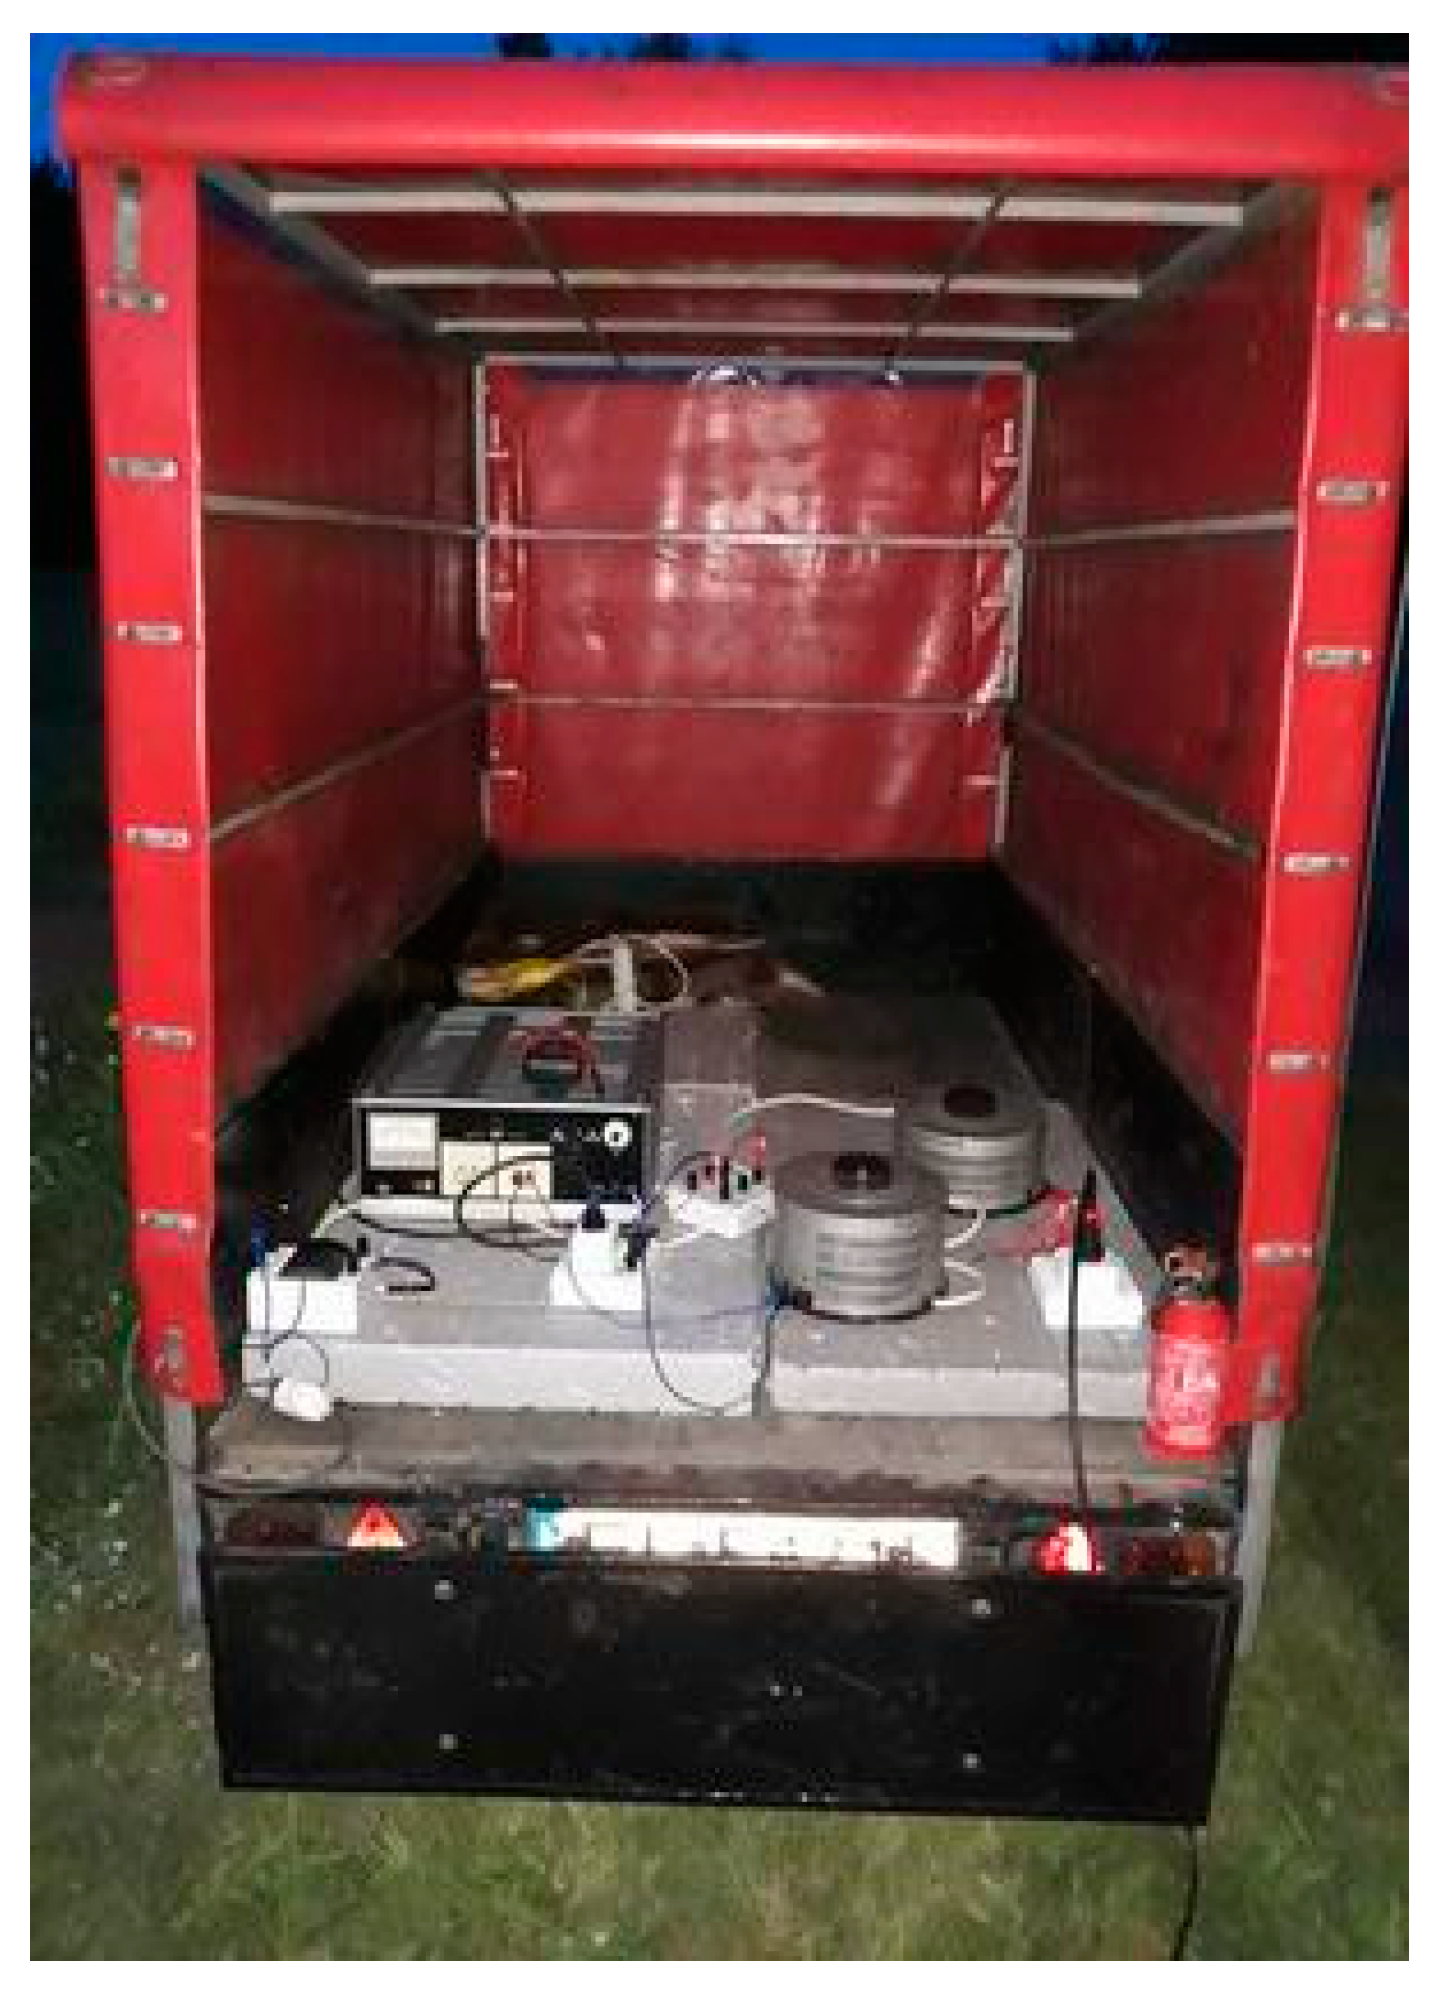
Before proceeding to measurements, a lamp post was set up in the forest clearing. Due to the location where the measurements were recorded, access to the power grid was not possible, so an alternative power source was used. For this purpose, a single-phase 6.5 kW generator was used. A schematic electric diagram of the power supply system is shown in Figure 5. The voltage from the generator via switch 1 (Figure 5) was fed to the autotransformer, which was adjusted to 220 V (the value was checked using voltmeter V1), and further to the voltage stabilizer, ensuring constant Root Mean Square (RMS) voltage with 0.1% accuracy. This type of voltage stabilizer is dedicated to research applications and especially for testing. The reduced value of the voltage supplied to the stabilizer results from (due to the date of production) being intended for an input voltage of 220 V. The output voltage was adjusted by another autotransformer to 230 V. Since the measurements were recorded at night, the cooling air formed dew on the grass, so the voltage stabilizer together with autotransformers, connectors, etc. were located on the trailer covered by a tarpaulin (Figure 6). To provide proper ventilation (and flue gas evacuation), the power generator was placed outside the trailer in the open air. The power supply for the luminaire and computers was distributed with reel extension cords (3 × 2.5 mm2). All devices (luminaire and PCs) were supplied with 230 V RMS voltage.
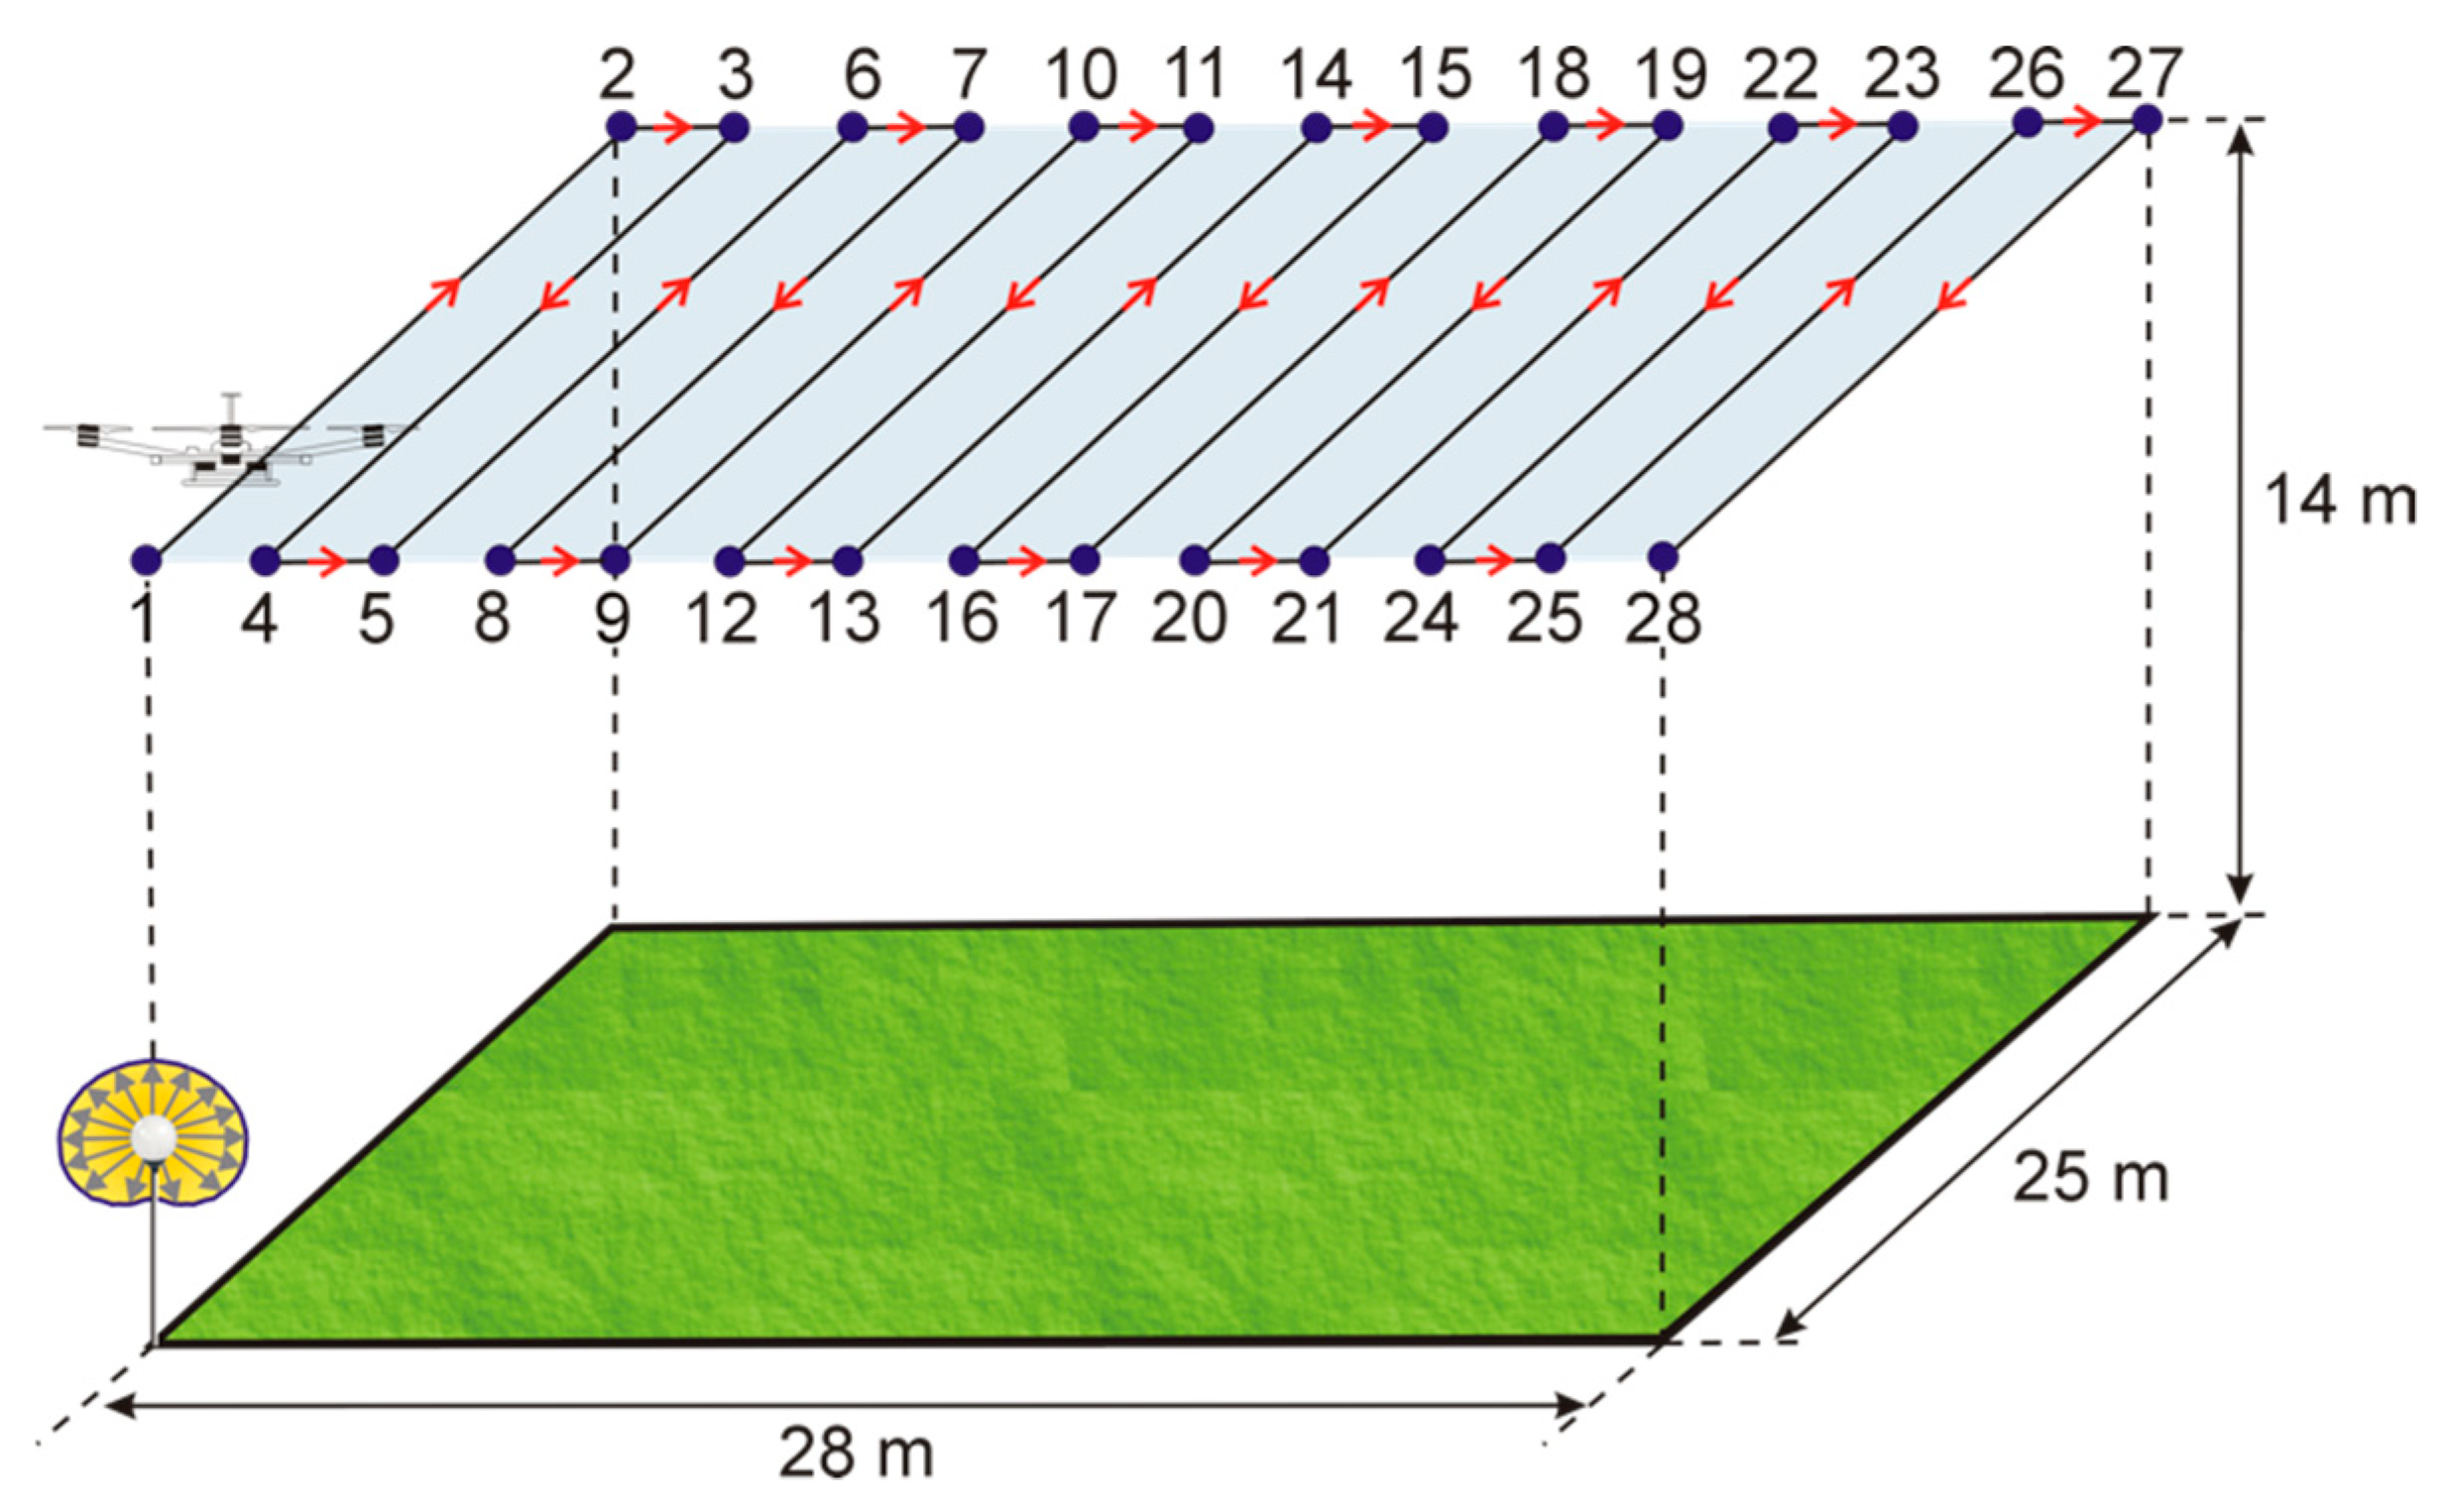
Before the illuminance measurements commenced, it was ensured that the lamp post was turned on about an hour earlier because from the moment of initiation of the electric discharge in the lamp to the moment of its full stabilization process, the luminous flux of the lamp changes. The stabilization time varies for individual light sources. In most cases, it does not exceed half an hour. However, according to the measuring practice, the stabilization process occasionally exceeds half an hour [52,53]. To record the illuminance, the illuminance meter capturing very low illuminance values and the computer was used. One of its measuring ranges is 0–50 lx, with a resolution of 0.001 lx. The accuracy class of the illuminance meter was “A” according to ISO/CIE 19476:2014 [54]. Considering the symmetries of the luminaire photometric solids, for measurements of illuminance (both from the air and on the ground), only one quadrant of the virtual measuring grid was used. Due to terrain restrictions (tall trees nearby), a 25 × 28 m grid was adopted (Figure 7).
As maintaining the planned route with manual UAV control would have been difficult, the flight was conducted in autonomous mode (the flight was controlled by a computer) along the pre-programmed route. For this purpose, specialized software was used to perform the flights. The computer software was designed so that the UAV operator can immediately take over remote control in the event of a dangerous situation. To define the exact flight path of the UAV, geographical coordinates of the point located above the luminaire were determined (point 1 in Figure 7). Then, the coordinates of the point located at the edge of the long side of the grid were determined. With the geographical coordinates of two points, the geographical azimuth (the angle between the north part of the meridian and the indicated horizontal direction) was determined. To determine the geographical coordinates, a Global Navigation Satellite Systems (GNSS) Real-Time Kinematic (RTK) receiver was used. These types of receivers are used in geodesy and enable precise reading of geographical coordinates (with an accuracy of 1–3 cm). Based on these data and with the use of the geographical calculator available on the Australian Government website (www.ga.gov.au), the coordinates of individual points on the calculation grid were determined, assuming the distances between points 2 and 25 m (Figure 7). Geographic coordinates with reference to 28 points (Figure 7) were fed into the computer software for flight planning by the UAV. After sending the programmed flight route from the computer to the smartphone (block C), the UAV began its flight. Simultaneously, data recordings sent from measuring equipment located on the UAV’s board was enabled on the second computer (block B) using the previously launched software. Two PCs (one in each block) were needed because the computer software designed for planning UAV flight routes uses communication ports for data reception. As a result, it was not possible to run the application that saved the measurement data. The UAV was flying at a speed of 0.5 m/s (the maximum UAV speed was 18 m/s). The set altitude of the flight was 14 m (10 m above the lamp post, which results from a previous recommendation [55]). The total flight duration from take-off to landing was about 16 min. An acceptable estimated flight time with a load of 1.3 kg, according to the manufacturer’s data, is <25 min, assuming that the drone battery pack is fully charged.
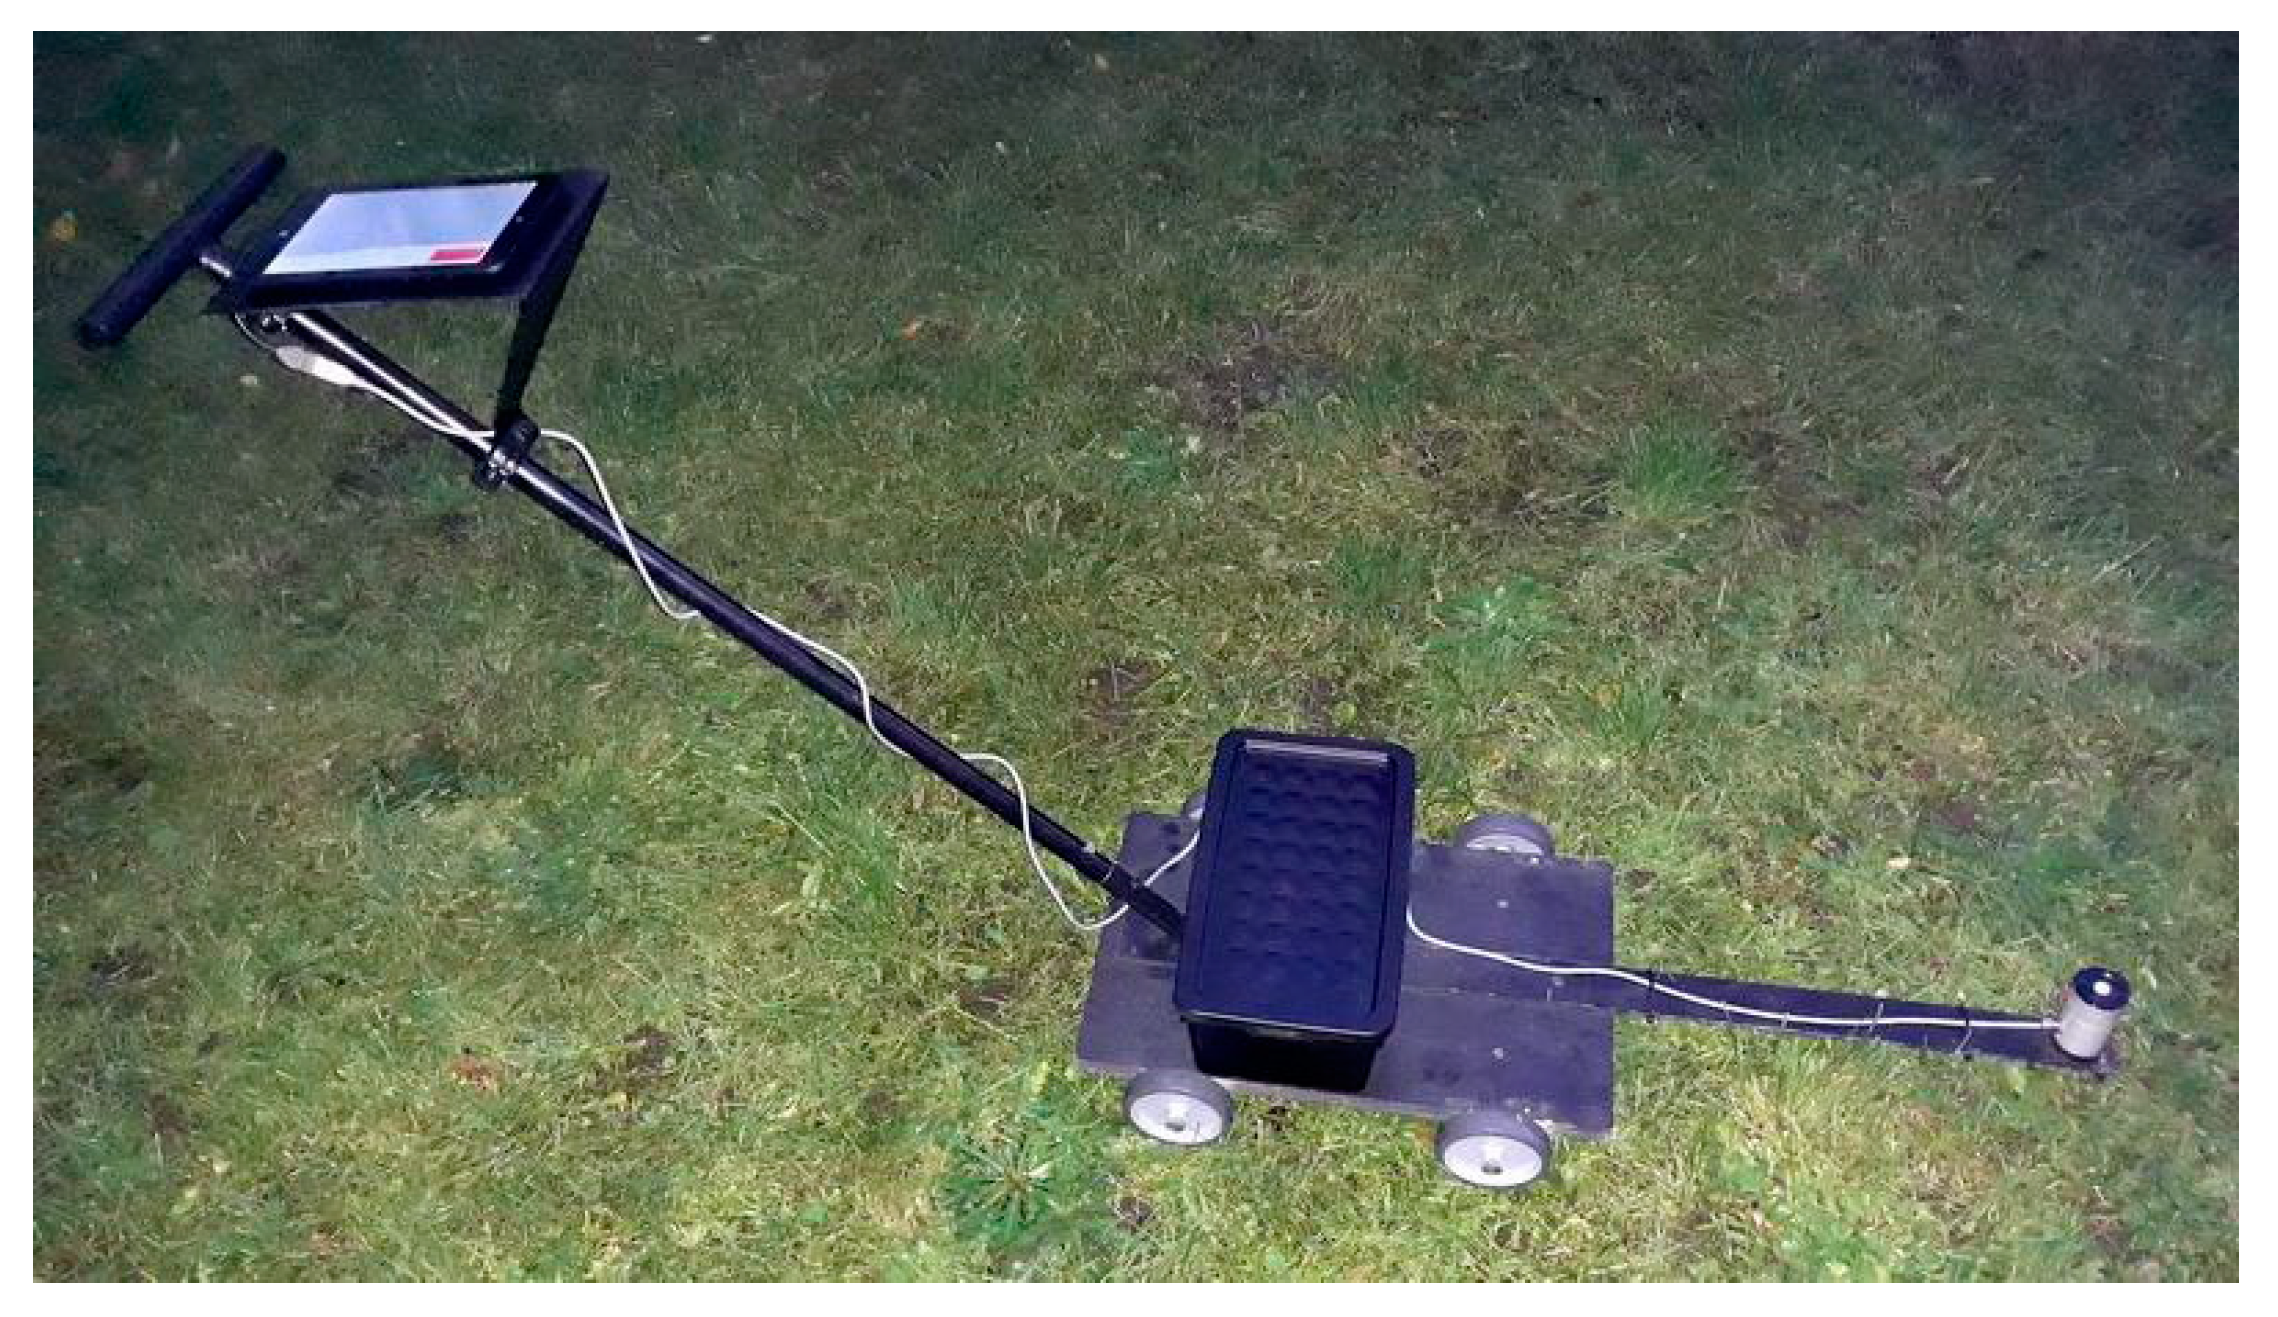
After measurements recorded by the UAV with reference to the lamp post with luminaire No. 1, measurements were also recorded on the ground. For this purpose, a trolley was constructed (Figure 8), which was equipped with an illuminance meter, 12 V battery, and distance recording and triggering device with a fixed step illuminance meter. Data from the illuminance meter were recorded on a tablet equipped with computer software. The route traveled by the cart corresponded to the UAV route, except that the UAV flew at a height of 14 m and the trolley was directly on the ground. The trolley, along with the necessary equipment, moved in straight lines between the individual points marked in Figure 5. The initial positions of the photometer head of the illuminance meter were set at the starting points numbered 2, 3, 6, 7, etc. The setting was verified by a reading from the RTK-type GNSS [56]. To keep the trolley moving along a straight line, a string of bright color was stretched between points 1 and 2, 3 and 4, 6 and 8, etc. To prevent the operator of the trolley from blocking the photosensitive surface with the light coming directly from the light sources, the trolley was moved from the outer to the inner edge of the virtual computational grid.
After completing the first part of measurements, luminaire No. 1 was replaced with luminaire No. 2. While waiting for the luminous flux of the luminaire to stabilize, the UAV battery set was replaced. About an hour after replacing the luminaire, measurements were resumed. The measurements were first recorded in air and then on the ground.
5. Visualization of Field Measurement Results
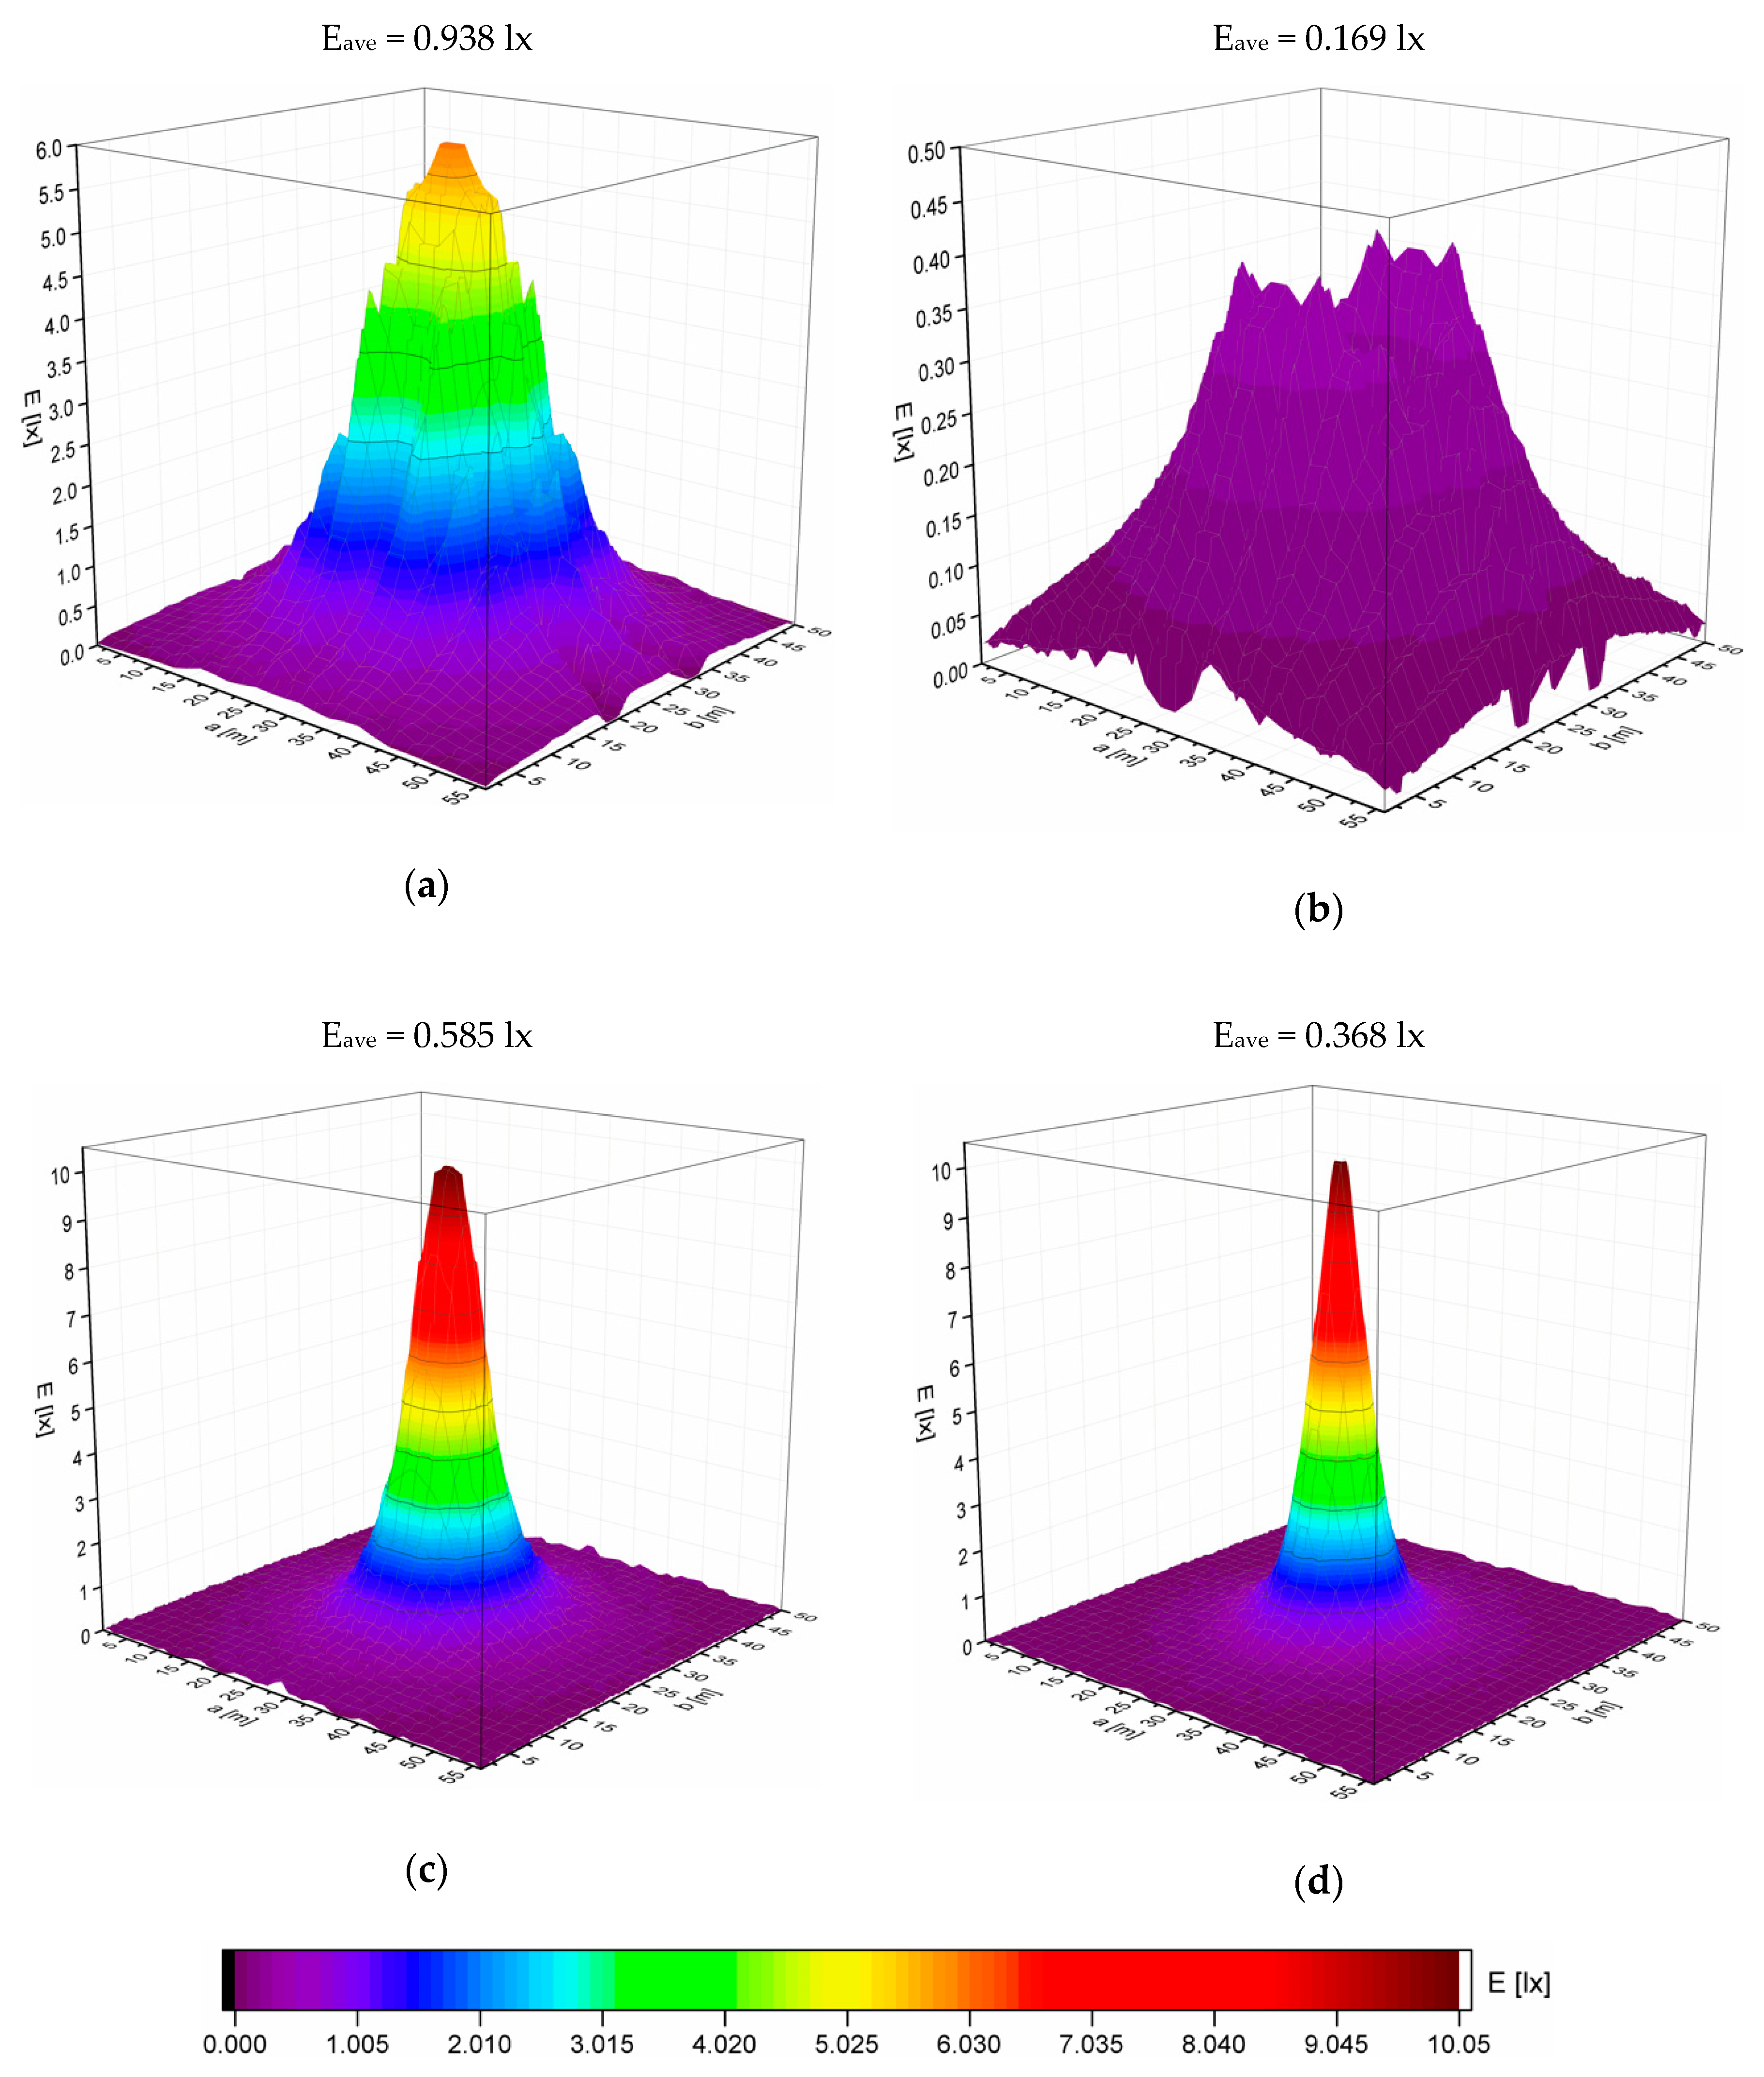
Illuminance is a parameter at a specific point. As, practically, no objects are points (all physical objects have specific dimensions), the lighting of the ground and the virtual grid located above the lamp post (at a height of 14 m from the ground) can be characterized by providing the distribution of illuminance at many points (Figure 9). Knowing the distribution of illuminance on two surfaces located above and below the lamp post, the luminous flux emitted in the upper hemisphere (toward the sky) and toward the ground can be calculated. The luminous flux sent into the upper hemisphere is irretrievably lost. In lighting technology, this is called useless luminous flux. To analyze the results obtained from the measurements, the illuminance distributions for both luminaires are provided in one drawing. One common color scale for all charts was adopted. Despite the measurements being recorded for only one-quarter of a surface measuring 28 × 25 m (Figure 5), the measurement results were visualized for the entire surface measuring 56 × 50 m (Figure 9). The average light intensity Eave was determined for each measurement grid, respectively:
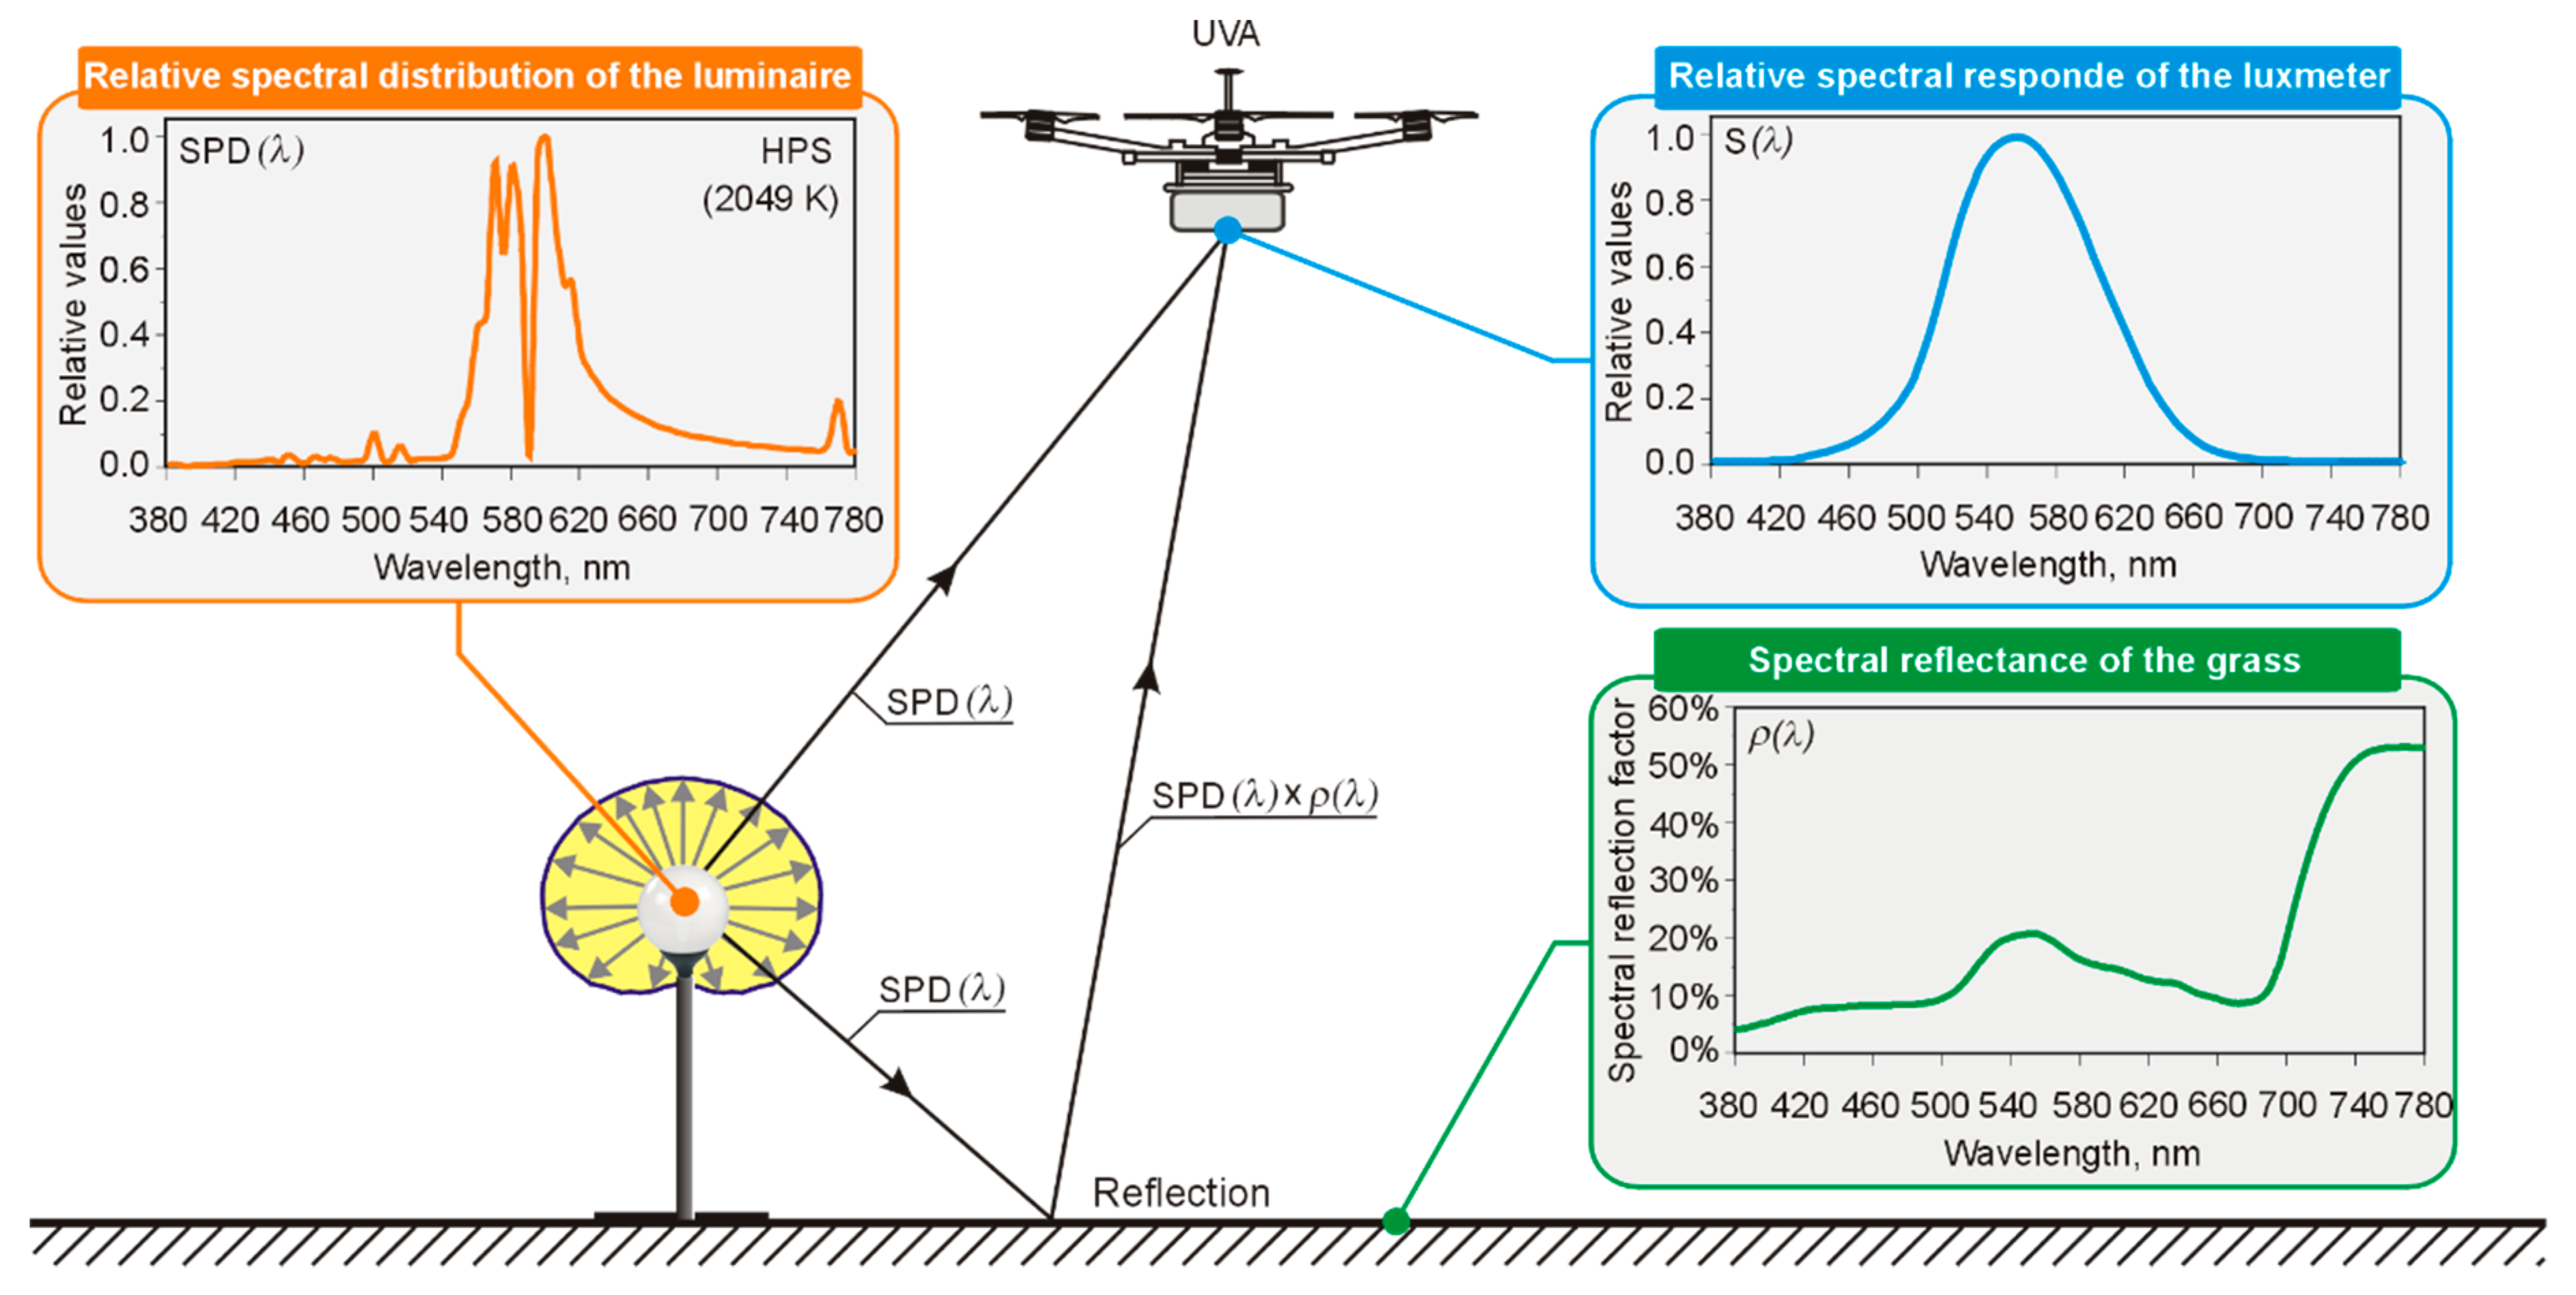
Having the average values of illuminances (Figure 9) and knowing the surface of the measuring grid (S = a × b), one can calculate the luminous flux that will be emitted towards the sky and the ground by individual luminaires respectively. It is worth to point out that the luminous flux emitted in the upper hemisphere (wasted luminous flux) is the sum of two components: the direct component (the luminous flux emitted directly into the upper hemisphere by the luminaire) and the intermediate component (the luminous flux reflected from the ground). The illuminance meter installed on the UAV records both illumination caused by radiation emitted directly by the luminaire and radiation reflected from the ground. The luminous flux emitted in the lower hemisphere (useful flux) is mainly the effect of radiation emitted by the installed luminaire. In the case of city centers, artificial radiation directed towards the ground after reflection from the atmosphere and clouds will have some share in the generation of illumination on the ground. An illustrative presentation of the individual components of radiation registered by the luxmeter placed on the UAV deck is given in Figure 10. Due to the fact that the spectral coefficient of reflection of the grass on the surface of which the portable lantern was installed is unknown, the data from the Jet Propulsion Laboratory (JPL) spectral library was used to plot this coefficient. These data are widely available on the National Aeronautics and Space Administration (NASA) website [33].
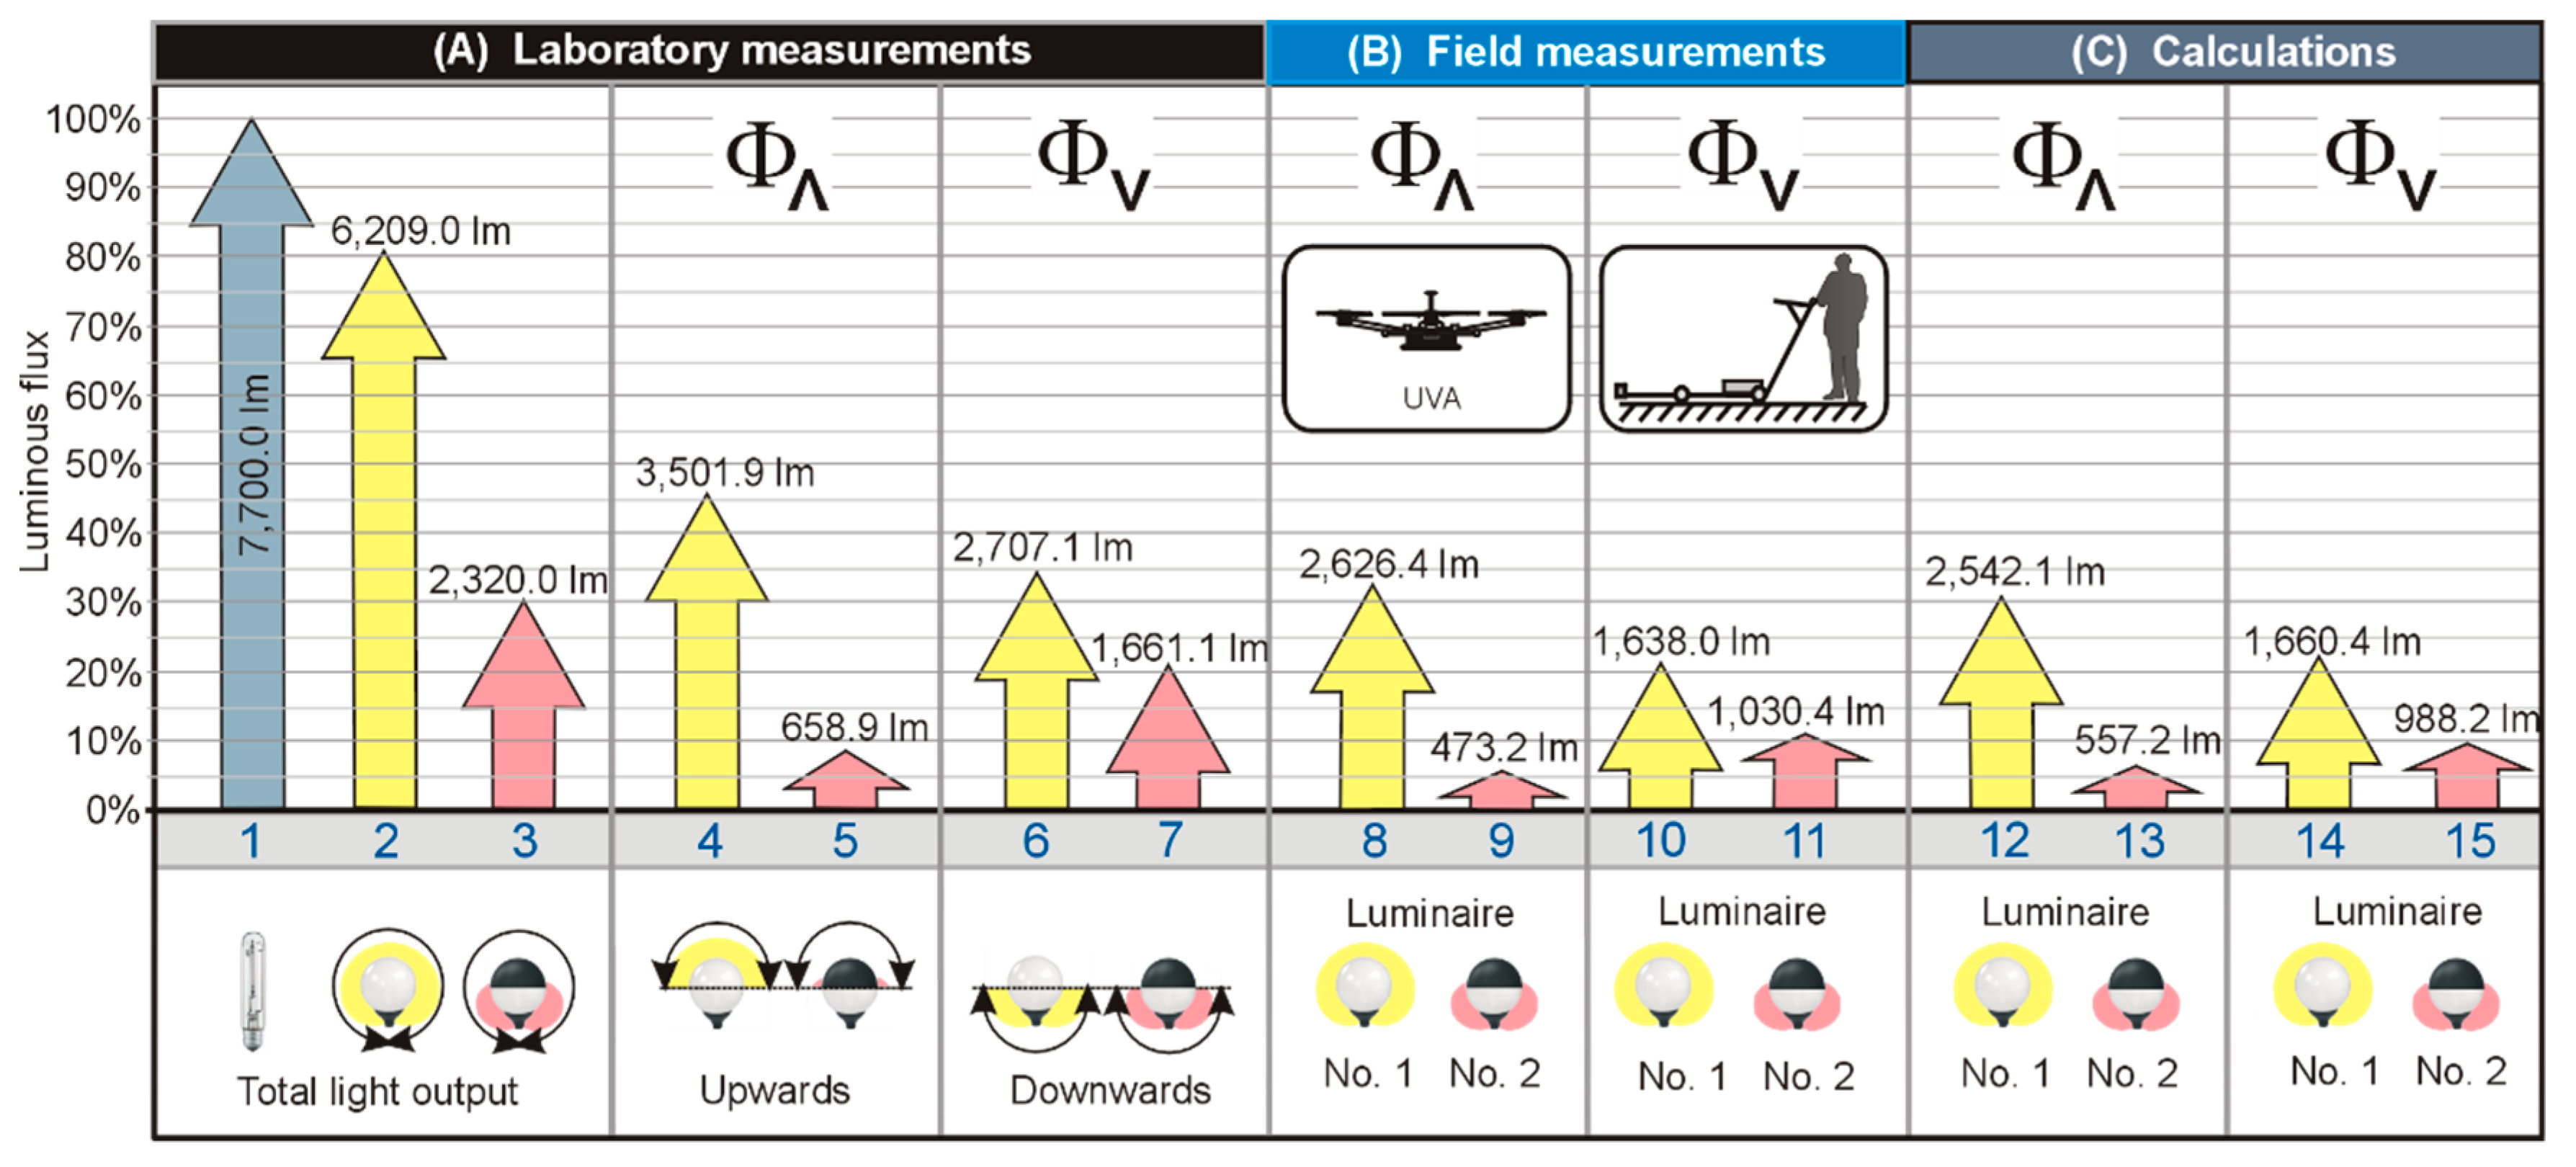
The luminous flux values resulting from laboratory measurements, field measurements as well as simulations are summarized in Figure 11. All luminous flux values were referred to the total luminous flux emitted by the light source (HPS high-pressure sodium lamp) with which both luminaires cooperated. In order to facilitate the analysis of the obtained data, the luminous flux values are additionally shown in Figure 11. The symbol ΦΛ indicates the luminous flux directed into the upper half-space, while ΦV into the lower half-space, respectively. For section “(A)” in Figure 11, the symbol ΦΛ stands for ULR and ΦV for DFF of the luminaire. In other sections, ΦΛ and ΦV indicate the luminous flux that goes to the computational grid, above the lantern and on the ground, respectively. The last section in Figure 11 (“(C) Calculations”) contains the results of calculations carried out in a computer program supporting the lighting design process. Due to the fact that the reflection properties of the ground in the DIALux program are characterized by the value of the total reflection coefficient (there is no way to enter the spectral reflection coefficient), a typical grass reflection coefficient of 16% was adopted.
The main task of park-type luminaire is to illuminate the ground. Therefore, it is important to effectively use the luminous flux generated by the luminaire. A measure of the efficiency of using the luminous flux emitted from a luminaire to illuminate the ground is the quotient of the useful luminous flux to the total luminous flux of the luminaire. In the case of the luminaire No. 1. this ratio is around 26%, while for the luminaire No. 2 is around 44%. However, the given values do not take into account the efficiency of the luminaires. After taking into account the LOR indicator, it will be possible to determine the efficiency of using the luminous flux generated by the light source. For luminaire No. 1, the value of lighting efficiency is around 21%, while for luminaire No. 2 it is around 13%. Hence, in the case of the luminaire No. 1, approximately 21% of the luminous flux of the light source is used to illuminate the ground, the remaining fraction (about 79%) is unused (part will be lost inside the luminaire and the rest is directed outside the illuminated area). In turn, for luminaire No. 2, this balance is even less optimistic because around 87% of the lamp’s luminous flux is not used to illuminate the ground.
The measurement results presented (Figure 11) relate to the new luminaires. It is worth noting that with the duration of luminaire exploitation, the luminous flux value will decrease. The reason for this will be, among others, the aging and soiling of the components of the luminaire. This will result in lowering the already low value of lighting efficiency.
6. Conclusions
Using the ULR (Upward Light Ratio) value for luminaires does not provide information about the luminous flux emitted to the sky. The ULR value does not take into account nearby objects (i.e., trees) and the reflection properties of the ground above which it is installed. The difference between the luminous flux of luminaire No. 1 sent in the upper half-space (3501.9 lm) and the value obtained from measurements carried out by UAV (2636.4 lm) is about 33%. In the case of luminaire No. 2, the difference is 39%. The differences between the results of simulations and measurements made using UAV are smaller and are 3% for luminaire No. 1 and 15% for luminaire No. 2, respectively. Bigger differences in the case of luminaire No. 2 result from the fact that the component reflected from the ground plays a larger share in the production of the luminous flux in the upper half-space. On this occasion, it is worth emphasizing one more time that both the spectral distribution of radiation of the luminaire illuminating the ground and the spectral reflection coefficient have a significant impact on the value of the reflected luminous flux. Based on the obtained measurement results and simulations, it can be stated that the ULR indicator of the luminaire recorded by luxmeter mounted on the UAV is lower, and that obtained from the simulations is higher.
The rapid development of light-emitting diodes, which are characterized by increasingly better photometric parameters than other light sources, means that they may be also installed in the opal sphere type luminaires. If we assume that instead of a high-pressure sodium lamp, an LED source with the same luminous flux and identical photometric body is installed, the results of simulations (carried out in the DIALux computer program) will not change, while the values recorded by the UAV luxmeter will change. The degree of these changes will depend on the spectral distribution of the luminaire radiation.
From the point of view of adverse impacts of the considered luminaires on the effect of light pollution, a more favorable solution is luminaire No. 2, for which the calculated (based on measurements using UAV) luminous flux value emitted towards the sky is lower by almost 82% compared to the value obtained for the luminaire No. 1. Unfortunately, in the case of luminaire No. 2, the luminous flux directed towards the ground will be about 37% lower than corresponding luminous flux concerning luminaire No. 1. Due to the fact that the main task of external luminaires is to illuminate the ground, in practice, the luminaires like luminaire No. 1 are more often used.
An important limitation of the conducted research is the lack of information on the spectral distribution of radiation emitted towards the sky. The measurements conducted with a luxmeter only allow the luminous flux to be determined. Due to the fact that the phenomenon of light pollution is also greatly influenced by the spectral characteristics of radiation (as noted in [57,58,59]), the author plans to consider this aspect in future studies by installing a spectrometer onboard the UAV.
Despite the advanced design and the possibility of fully autonomous flight control, commercially available UAVs are designed for installing small loads on board. This limits the possibility of installing measuring equipment of any weight. The measuring apparatus installed on the drone should be compact, light, and shock-resistant. Of course, the apparatus that meets these requirements is available. Therefore, financial resources remain the only barrier.
A number of problems had to be addressed when preparing for field measurements. Carrying out measurements using an unmanned aerial vehicle proved to be a complex research project. In order to carry out the work, individual subtasks were successfully completed. One could venture to say that the essence of conducting field measurements is to become free from simplifying assumptions. The recorded illuminance values of the meter installed on the UAV board take into account both the radiation (with specific spectral characteristics) emitted directly by the lamp post and reflected from the ground (with real reflective properties). The measurement results included in the article concern two luminaires equipped with a high-pressure sodium lamp. In the research that will follow, the author plans to take into account the impact of other types of light sources (including LED sources) installed in the luminaire on the value of the luminous flux emitted towards the sky. The advantage of the presented measurement concept is full mobility. Measurements can be carried out in different locations by installing the lamp post on different surfaces. Considering the data on the operating temperature range included in the UAV and illuminance meter specifications (−10 + 40 °C), measurements can be carried out at different times of the year, thus considering the seasonal change in the reflection properties of the substrate on which the lantern was installed.
Funding
This research received no external funding
Acknowledgments
The author would like to thank his family and friends who supported him in this complex logistics undertaking.
Conflicts of Interest
The author declares no conflict of interest.
References
- Fonken, L.K.; Nelson, R.J. The Effects of Light at Night on Circadian Clocks and Metabolism. Endocr. Rev. 2014, 35, 648–670. [Google Scholar] [CrossRef]
- Zubidat, A.E.; Haim, A. Artificial light-at-night—A novel lifestyle risk factor for metabolic disorder and cancer morbidity. J. Basic Clin. Physiol. Pharmacol. 2017, 28, 295–313. [Google Scholar] [CrossRef]
- Touitou, Y.; Reinberg, A.; Touitou, D. Association between light at night, melatonin secretion, sleep deprivation, and the internal clock: Health impacts and mechanisms of circadian disruption. Life Sci. 2017, 173, 94–106. [Google Scholar] [CrossRef]
- Russart, K.L.G.; Nelson, R.J. Light at night as an environmental endocrine disruptor. Physiol. Behav. 2018, 190, 82–89. [Google Scholar] [CrossRef] [PubMed]
- Haim, A.; Partnov, B.A. Light Pollution as a New Risk Factor for Human Breast and Prostate Cancers; Springer Science Business Media Dordrecht: Berlin, Germany, 2013. [Google Scholar]
- Romeo, S.; Viaggi, C.; Di Camillo, D.; Willis, A.W.; Lozzi, L.; Rocchi, C.; Capannolo, M.; Aloisi, G.; Vaglini, F.; Maccarone, R.; et al. Bright light exposure reduces TH-positive dopamine neurons: Implications of light pollution in Parkinson’s disease epidemiology. Sci. Rep. 2013, 3, 1–9. [Google Scholar] [CrossRef] [PubMed]
- Hu, C.; Jia, W. Linking MTNR1B variants to diabetes: The role of circadian rhythms. Diabetes 2016, 65, 1490–1492. [Google Scholar] [CrossRef] [PubMed] [Green Version]
- Stevens, R.G.; Zhu, Y. Electric light, particularly at night, disrupts human circadian rhythmicity: Is 24 a problem? Philosoph. Trans. R. Soc. B Biol. Sci. 2015, 370, 1–9. [Google Scholar] [CrossRef] [Green Version]
- Dominoni, D.M. The effects of light pollution on biological rhythms of birds: An integrated, mechanistic perspective. J. Ornithol. 2015, 156, 409–418. [Google Scholar] [CrossRef]
- Stone, E.L.; Jones, G.; Harris, S. Street Lighting Disturbs Commuting Bats. Curr. Biol. 2009, 19, 1123–1127. [Google Scholar] [CrossRef] [Green Version]
- Kempenaers, B.; Borgström, P.; Loës, P.; Schlicht, E.; Valcu, M. Artificial Night Lighting Affects Dawn Song, Extra-Pair Siring Success, and Lay Date in Songbirds. Curr. Biol. 2010, 20, 1735–1739. [Google Scholar] [CrossRef] [Green Version]
- Hölker, F.; Wolter, C.; Perkin, E.K.; Tockner, K. Light pollution as a biodiversity threat. Trends Ecol. Evol. 2010, 25, 681–682. [Google Scholar]
- Raap, T.; Pinxten, R.; Eens, M. Light pollution disrupts sleep in free-living animals. Sci. Rep. 2015, 5, 1–8. [Google Scholar] [CrossRef] [PubMed] [Green Version]
- Chepesiuk, R. Missing the Dark: Health Effects of Light Pollution. Environ. Health Perspect. 2009, 117, 20–27. [Google Scholar] [CrossRef] [Green Version]
- Narisada, K.; Schreuder, D. Light Pollution Handbook. Astrophysics and Space Science Library; Springer: Berlin/Heidelberg, Germany, 2004. [Google Scholar]
- Jechow, A.; Ribas, S.J.; Domingo, R.C.; Hölker, F.; Kolláth, Z.; Kybaba, C.C.M. Tracking the dynamics of skyglow with differential photometry using a digital camera with fisheye lens. J. Quant. Spectrosc. Radiat. Transf. 2018, 209, 212–223. [Google Scholar] [CrossRef] [Green Version]
- Sukma, M.; Pramudya, Y.; Muchlas, O. Night sky brightness measurement during the March 2018 Earth Hour in Yogyakarta. In Proceedings of the 10th Southeast Asia Astronomy Network, Lampung, Sumatera, Indonesia, 18–21 October 2018; Volume 1231. [Google Scholar] [CrossRef]
- Posch, T.; Binder, F.; Puschnig, J. Systematic measurements of the night sky brightness at 26 locations in Eastern Austria. J. Quant. Spectrosc. Radiat. Transf. 2018, 211, 144–165. [Google Scholar] [CrossRef] [Green Version]
- Pun, C.S.J.; So, C.W. Night-sky brightness monitoring in Hong Kong. A city-wide light pollution assessment. Environ. Monit. Assess 2012, 184, 2537–2557. [Google Scholar] [CrossRef] [PubMed] [Green Version]
- Ściężor, T. Light pollution as an environmental hazard. Tech. Trans. 2019, 8, 129–142. [Google Scholar] [CrossRef] [Green Version]
- Cinzano, P.; Falchi, F.; Elvidge, C.D.; Baugh, K.E. The artificial night sky brightness mapped from DMSP satellite Operational Linescan System measurements. Monthly Not. R. Astron. Soc. 2000, 318, 641–657. [Google Scholar] [CrossRef] [Green Version]
- Jiang, W.; He, G.; Long, T.; Guo, H.; Yin, R.; Leng, W.; Liu, H.; Wang, G. Potentiality of Using Luojia 1-01 Nighttime Light Imagery to Investigate Artificial Light Pollution. Sensors 2018, 18, 2900. [Google Scholar] [CrossRef] [Green Version]
- Kuechly, H.U.; Kyba, C.C.; Ruhtz, T.; Lindemann, C.; Wolter, C.; Fischer, J.; Holker, F. Aerial survey and spatial analysis of sources of light pollution in Berlin, Germany. Remote Sens. Environ. 2012, 126, 35–50. [Google Scholar] [CrossRef]
- Fiorentin, P.; Bettanini, C.; Lorenzini, E.; Aboudan, A.; Colombatti, G.; Ortolani, S.; Bertlo, A. MINLU: An instrumental suite for monitoring light pollution from drones or airballoons. In Proceedings of the 2018 5th IEEE International Workshop on Metrology for AeroSpace, MetroAeroSpace, Rome, Italy, 20–22 June 2018; pp. 274–278. [Google Scholar] [CrossRef]
- Levin, N.; Kyba, C.C.; Zhang, Q.; Sanchez de Miguel, A.; Roman, M.O.; Li, X.; Partnov, B.A.; Molthan, A.L.; Jechow, A.; Miller, S.D.; et al. Remote Sens. of night lights: A review and an outlook for the future. Remote Sens. Environ. 2020, 237, 1–33. [Google Scholar] [CrossRef]
- Sielachowska, M.; Tyniecki, D.; Zajkowski, M. The Measurement Method of Light Distribution Emitted from Sports Facilities Using Unmanned Aerial Vehicles. In Proceedings of the 2018 7th Lighting Conference of the Visegrad Countries, LUMEN V4, Trebic, Czech Republic, 18–20 September 2018. [Google Scholar]
- Sielachowska, M.; Tyniecki, D.; Zajkowski, M. The Concept of Measuring Luminous Flux Distribution Emitted from Sports Facilities Using Unmanned Aerial Vehicles. In International Workshop on Modeling Social Media; Springer: Cham, Switzerland, 2018. [Google Scholar]
- Kyba, C.C.M.; Ruhtz, T.; Fischer, J.; Holker, F. Cloud Coverage Acts as an Amplifier for Ecological Light Pollution in Urban Ecosystems. PLoS ONE 2011, 6, e17307. [Google Scholar] [CrossRef] [PubMed] [Green Version]
- Aubé, M.; Kocifaj, M.; Zamorano, J.; Solano Lamphar, H.A.; Sanchez de Miguel, A. The spectral amplification effect of clouds to the night sky radiance in Madrid. J. Quant. Spectrosc. Radiat. Transf. 2016, 181, 11–23. [Google Scholar] [CrossRef]
- Kyba, C.C.M.; Tong, K.P.; Bennie, J.; Birriel, I.; Birriel, J.J.; Cool, A.; Danielsen, A.; Davies, T.W.; den Outer, P.N.; Edwards, W. Worldwide variations in artificial skyglow. Sci. Rep. 2015, 5, 1–5. [Google Scholar] [CrossRef] [Green Version]
- Kardel, W.S. Rethinking how we light at night: Cutting light pollution for more sustainable nights. J. Green Build. 2012, 7, 3–15. [Google Scholar] [CrossRef]
- Luginbuhl, C.B.; Boley, P.A.; Davis, D.R. The impact of light source spectral power distribution on sky glow. J. Quant. Spectrosc. Radiat. Transf. 2014, 139, 21–26. [Google Scholar] [CrossRef] [Green Version]
- Available online: http://asterweb.jpl.nasa.gov (accessed on 1 March 2020).
- Artiola, J.F.; Pepper, I.L.; Brusseau, M.L. (Eds.) Environmental Monitoring and Characterization; Elsevier: Amsterdam, The Netherlands, 2004. [Google Scholar]
- Skarżyński, K. Methods of calculation of floodlighting utilisation factor at the design stage. Light Eng. 2018, 26, 144–152. [Google Scholar] [CrossRef]
- Pracki, P.; Skarżyńśki, K. A Multi-Criteria Assessment Procedure for Outdoor Lighting at the Design Stage. Sustainability 2020, 12, 1330. [Google Scholar] [CrossRef] [Green Version]
- Zalewski, S. Digital recording of photometric data for multisource luminaires. Przeglad Elektrotechniczny 2012, 88, 220–222. [Google Scholar]
- D’Oleire-Oltmanns, S.; Marzolff, I.; Peter, K.D.; Ries, J.B. Unmanned Aerial Vehicle (UAV) for Monitoring Soil Erosion in Morocco. Remote Sens. 2012, 4, 3390–3416. [Google Scholar] [CrossRef] [Green Version]
- Immerzeel, W.W.; Kraaijenbrink, P.D.A.; Shea, J.M.; Shrestha, A.B.; Pellicciotti, F.; Bierkens, M.F.P.; De Jong, S.M. High-resolution monitoring of Himalayan glacier dynamics usingunmanned aerial vehicles. Remote Sens. Environ. 2014, 150, 93–103. [Google Scholar] [CrossRef]
- Yuan, C.; Liu, Z.; Zhang, Y. UAV-based Forest Fire Detection and Tracking Using Image Processing Techniques. In Proceedings of the 2015 International Conference on Unmanned Aircraft Systems (ICUAS), Denver, CO, USA, 9–12 June 2015; pp. 639–643. [Google Scholar] [CrossRef]
- Röder, M.; Latifi, H.; Hill, S.; Wild, J.; Svoboda, M.; Brůna, J.; Macek, M.; Nováková, M.H.; Gülch, E.; Heurich, M. Application of optical unmanned aerial vehicle-based imagery for the inventory of natural regeneration and standing deadwood in post-disturbed spruce forests. Int. J. Remote Sens. 2018, 39, 288–309. [Google Scholar] [CrossRef]
- Haas, P.Y.; Balistreri, C.; Pontelandolfo, P.; Triscone, G.; Pekoz, H.; Pignatiello, A. Development of an unmanned aerial vehicle UAV for air quality measurement in urban areas. In Proceedings of the 32nd AIAA Applied Aerodynamics Conference, Atlanta, GA, USA, 16–20 June 2014. [Google Scholar]
- Towler, J.; Krawiec, B.; Kochersberger, K. Radiation Mapping in Post-Disaster Environments Using an Autonomous Helicopter. Remote Sens. 2012, 4, 1995–2015. [Google Scholar] [CrossRef] [Green Version]
- Iacomussu, P.; Rossi, G.; Soardo, P. Sustainable Environmental Compatibility of Road Lighting Assured through the Minimization of Energy Consumptions an Instrumented Drone Measures the Upward Spill Light a Report of the Italian NC to CIE Divisions 4 and 5-Paris; Istituto Nazionale di Ricerca Metrologica: Torino, Italy, 2013. [Google Scholar]
- Bouroussis, C.A.; Topalis, F.V. Assessment of outdoor lighting installations and their impact on light pollution using unmanned aircraft systems—The concept of the drone-gonio-photometer. J. Quant. Spectrosc. Radiat. Transf. 2020, 253, 1–11. [Google Scholar] [CrossRef]
- Tabaka, P.; Rozga, P. Influence of a Light Source Installed in a Luminaire of Opal Sphere Type on the Effect of Light Pollution. Energies 2020, 13, 306. [Google Scholar] [CrossRef] [Green Version]
- The Measurement of Absolute Luminous Intensity Distributions, Photocopy ed.; CIE: 1987 Technical Report; CIE: Vienna, Austria, 2008.
- Light and Lighting—Measurement and Presentation of Photometric Data of Lamps and Luminaires—Part 1: Measurement and File Format; CEN—EN 13032-1; CEN: Brussel, Belgium, 2004.
- Light and Lighting—Measurement and Presentation of Photometric Data of Lamps and Luminaires—Part 2: Presentation of Data for Indoor and Outdoor Work Places; CEN-EN 13032-2; CEN: Brussel, Belgium, 2017.
- Luminaire Classification System for Outdoor Luminaires; IES TM-15-11; IESNA: New York, NY, USA, 2011.
- Valavanis, K.P.; Vachtesevanos, G.J. Handbook of Unmanned Aerial Vehicles; Springer: Dordrecht, The Netherlands, 2015. [Google Scholar]
- Tabaka, P. Analysis of properties of lightning-optical equivalents of traditional bulbs for dimming. Light Eng. 2015, 23, 79–86. [Google Scholar]
- Tabaka, P.; Rozga, P. Assessment of methods of marking LED sources with the power of equivalent light bulb. Bull. Polish Acad. Sci. Techn. Sci. 2017, 65, 883–890. [Google Scholar] [CrossRef] [Green Version]
- Characterization of the Performance of Illuminance Meters and Luminance Meters; ISO/CIE 19476; CIE: Vienna, Austria, 2014.
- Brons, J.A.; Bullough, J.D.; Rea, M.S. Outdoor site-lighting performance: A comprehensive and quantitative framework for assessing light pollution. Light. Res. Technol. 2008, 40, 201–204. [Google Scholar] [CrossRef]
- Roosevelt, C.H. Mapping site-level microtopography with RealTime Kinematic Global Navigation Satellite Systems (RTK GNSS) and Unmanned Aerial Vehicle Photogrammetry (UAVP). Open Archaeol. 2014, 1, 29–53. [Google Scholar] [CrossRef]
- Aubé, M.; Roby, J.; Kocifaj, M. Evaluating potential spectral impacts of various artificial lights on melatonin suppression, photosynthesis, and star visibility. PLoS ONE 2013, 8, 1–15. [Google Scholar] [CrossRef] [Green Version]
- de Miguel, A.S.; Kyba, C.C.; Aubé, M.; Zamorano, J.; Cardiel, N.; Tapia, C.; Bennie, J.; Gaston, K.J. Colour Remote Sens. of the impact of artificial light at night (I): The potential of the International Space Station and other DSLR-based platforms. Remote Sens. Environ. Remote Sens. Environ. 2019, 224, 92–103. [Google Scholar] [CrossRef]
- De Miguel, A.S.; Bará, S.; Aubé, M.; Cardiel, N.; Tapia, C.E.; Zamorano, J.; Gaston, K.J. Evaluating human photoreceptoral inputs from night-time lights using RGB imaging photometry. J. Imaging 2019, 5, 1–12. [Google Scholar]
Figure 1.
A graphic illustration of the opal-sphere-type luminaire with the method of light distribution: (a,b) a photometric solid, and (c,d) a luminosity graph with marked angle zones classified per the Backlight, Uplight, and Glare (BUG) classification system for outdoor luminaires.
Figure 1.
A graphic illustration of the opal-sphere-type luminaire with the method of light distribution: (a,b) a photometric solid, and (c,d) a luminosity graph with marked angle zones classified per the Backlight, Uplight, and Glare (BUG) classification system for outdoor luminaires.

Figure 2.
Explanatory wiring diagram of individual components: block (a) 1, battery; 2, printed circuit board with voltage converters installed; 3, illuminance meter; 4, RS232/UART adapter connecting the illuminance meter with the RS232 connector with the RF transmitter equipped with the URT connector; 5, transmitters; 6, GPS module; 7, satellite. Block (b) 1, PC computer; 2, UART/USB converter; 3, receivers. Block (c) 1, PC; 2, smartphone with software installed; 3, UAV controller.

Figure 3.
(a) Unmanned aerial vehicle (UAV) with a box attached to its construction (block A from Figure 2) equipped with the necessary equipment to make measurements; (b,c) drone’s flight control measurement data collection station (blocks B and C from Figure 2).

Figure 4.
(a) Lamp post components, (b) base, (c,d) complete lamp post, and (e) shade replacement.

Figure 5.
Diagram of the power supply system: 1, power generator; 2, 5, 7, 10, power connectors; 3, 8, autotransformer; 4, 9, voltmeter (multimeter); 6, voltage stabilizer; 11, light source installed in the luminaire (together with the necessary ignition system); 12, 13, PC.
Figure 5.
Diagram of the power supply system: 1, power generator; 2, 5, 7, 10, power connectors; 3, 8, autotransformer; 4, 9, voltmeter (multimeter); 6, voltage stabilizer; 11, light source installed in the luminaire (together with the necessary ignition system); 12, 13, PC.

Figure 6.
The trailer with the power system.

Figure 7.
The UAV route on the planned measuring grid.

Figure 8.
The trolley equipped in the illuminance meter to measure the illuminance on the ground.

Figure 9.
Visualization of the illuminance distribution when using: (a,c) oval ball, (b,d) oval ball half-covered with black paint, recorded values relate to measurements taken: (a,b) from the air using a UAV, (c,d) on the ground.
Figure 9.
Visualization of the illuminance distribution when using: (a,c) oval ball, (b,d) oval ball half-covered with black paint, recorded values relate to measurements taken: (a,b) from the air using a UAV, (c,d) on the ground.

Figure 10.
Illustrative visualization of the radiation that reaches the luxmeter placed on the deck of the UAV.
Figure 10.
Illustrative visualization of the radiation that reaches the luxmeter placed on the deck of the UAV.

Figure 11.
Graphical visualization of the luminous flux measured and calculated.


Table 1.
Zonal lumen summary for opal-sphere-type luminaires.
| Luminaire | No. 1 | No. 2 |
|---|---|---|
| Parameters/indexes | % | % |
| Total luminous flux | 100 | 100 |
| Downward Flux Fraction (DFF) | 43.6 | 71.6 |
| Upward Light Ratio (ULR); Upper Flux Fraction (UFF) | 56.4 | 28.4 |
| Upward Light Output Ratio (ULOR) | 45.5 | 8.6 |
| Downward Light Output Ratio (DLOR) | 35.1 | 21.5 |
| Light Output Ratio (LOR) | 80.6 | 30.1 |
| Absorbed in luminaire | 19.4 | 69.6 |
| Zone 1 (back light)/Zone 3 (forward light) | ||
| BVH/FVH (80°–90°) Back light very high/forward light very high | 4.6 | 5.3 |
| BH/FH (60°–80°) Back light high/forward light high | 7.9 | 11.5 |
| BM/FM (30°–60°) Back light mid/forward light mid | 7.3 | 14.1 |
| BL/FL (0°–30°) Back light low/forward light low | 2.0 | 4.9 |
| Zone 2 (Uplight) | ||
| UH (100°–180°) Uplight high | 46.9 | 9.0 |
| UL (90°–100°) Uplight low | 9.5 | 19.4 |
| BUG rating | B1 U5 G3 | B1 U3 G2 |
© 2020 by the author. Licensee MDPI, Basel, Switzerland. This article is an open access article distributed under the terms and conditions of the Creative Commons Attribution (CC BY) license (http://creativecommons.org/licenses/by/4.0/).
Share and Cite
MDPI and ACS Style
Tabaka, P. Pilot Measurement of Illuminance in the Context of Light Pollution Performed with an Unmanned Aerial Vehicle. Remote Sens. 2020, 12, 2124. https://doi.org/10.3390/rs12132124
AMA Style
Tabaka P. Pilot Measurement of Illuminance in the Context of Light Pollution Performed with an Unmanned Aerial Vehicle. Remote Sensing. 2020; 12(13):2124. https://doi.org/10.3390/rs12132124
Chicago/Turabian StyleTabaka, Przemyslaw. 2020. "Pilot Measurement of Illuminance in the Context of Light Pollution Performed with an Unmanned Aerial Vehicle" Remote Sensing 12, no. 13: 2124. https://doi.org/10.3390/rs12132124
Note that from the first issue of 2016, this journal uses article numbers instead of page numbers. See further details here.