Article

Radiometric Stability Monitoring of the Suomi NPP Visible Infrared Imaging Radiometer Suite (VIIRS) Reflective Solar Bands Using the Moon

1
Earth Resources Technology Inc., 5830 University Research Ct. #2672, College Park, MD 20740, USA
2
Department of Astronomy, University of Maryland, College Park, MD 20742, USA
3
NOAA/NESDIS/STAR, 5830 University Research Ct., College Park, MD 20740, USA
*
Author to whom correspondence should be addressed.
Remote Sens. 2016, 8(1), 15; https://doi.org/10.3390/rs8010015
Submission received: 20 October 2015 / Revised: 8 December 2015 / Accepted: 15 December 2015 / Published: 25 December 2015
(This article belongs to the Collection Visible Infrared Imaging Radiometers and Applications)

Abstract

:
The Suomi NPP (S-NPP) Visible Infrared Imaging Radiometer Suite (VIIRS) performs the scheduled lunar roll maneuver on a monthly basis. The lunar calibration coefficients and lunar F-factor are calculated by taking the ratio of the lunar observed radiance to the simulated radiance from the Miller and Turner (MT) lunar model. The lunar F-factor is also validated against that derived from the VIIRS Solar Diffuser (SD). The MT model-based lunar F-factors in general agree with SD F-factors. The Lunar Band Ratio (LBR) is also derived from two channel lunar radiances and is implemented in the National Oceanic and Atmospheric Administration (NOAA) Integrated Calibration and Validation System (ICVS) to monitor the VIIRS long-term radiometric performance. The lunar radiances at pixels are summed for each of the VIIRS Reflective Solar Bands (RSBs) and normalized by the reference band M11 which has the most stable SD-based calibration coefficient. LBRs agree with the SD based F-factor ratios within one percent. Based on analysis with these two independent lunar calibration methods, SD-based and LBR-based calibrations show a lifetime consistency. Thus, it is recommended that LBR be used for both VIIRS radiometric calibration and lifetime stability monitoring.

Graphical Abstract

1. Introduction

On 28 October 2011, the Suomi National Polar orbiting Partnership (Suomi NPP) satellite was successfully launched with the Visible Infrared Imaging Radiometer Suite (VIIRS) onboard [1,2,3]. VIIRS was designed to replace historical sensors such as the Defense Meteorological Satellite Program (DMSP) Operational Line-scanning System (OLS), NASA MODerate-resolution Imaging Spectroradiometer (MODIS), NOAA Polar-orbiting Operational Environment Satellite (POES) Advanced Very High Resolution Radiometer (AVHRR), and Sea-viewing Wide Field-of-view Sensor (SeaWiFS) on GeoEye’s SeaStar satellite to fulfill needs of civil, military and science communities [4]. It scans within a large viewing angle of 112.56 degrees at the nominal altitude of 829 km as a whiskbroom scanning radiometer so that the entire Earth can be observed twice daily. VIIRS has 22 spectral bands ranging from 0.412 μm to 12.01 μm and ca2n be further combined into the 14 Reflective Solar Bands (RSB), 7 Thermal Emissive Bands (TEB), and 1 Day Night Band (DNB). The spectral wavelengths from 0.41 µm to 12.01 µm can be observed with moderate resolution and is referred as M-bands whereas those from 0.64 µm to 11.45 µm is used for imaging capabilities, I-bands. DNB is located in the region between 0.5 µm and 0.9 µm. The nadir spatial resolution of M bands, I bands and DNB are 750 m, 375 m and 750 m, respectively. There are corresponding spectrally similar bands in M bands to those in I bands. The Relative Spectral Responses (RSR) in I2/M7 and I3/M10 band pairs are mostly overlapped, and the I bands provide a higher spatial resolution with similar radiometric responses. In addition, M1, M2, M3, M4, M5, M7, and M13 are designed with low and high gain settings (also known as dual gain) to support a wider dynamic range required for accurate ocean color and land/fire applications.
For monitoring and detection of long-term climate and Earth’s environmental changes, a stable radiometric calibration is required for on-orbit imaging sensors. The primary source of the VIIRS RSB band radiometric calibration is based on the Solar Diffuser (SD) and its degradation over time is measured by the Solar Diffuser Stability Monitor (SDSM). The calibration methodology and design of the SD and SDSM are adopted from the two MODIS sensors onboard NASA’s Terra and Aqua satellites. The required VIIRS radiometric calibration uncertainty is expected to be less than 2 percent in spectral reflectance unit at the typical radiance [4]. To meet this uncertainty requirement, the SDSM is designed to track the SD reflectance changes over time.
As an alternative light source for calibration, the moon has a long-term stability within the visible and shortwave infrared spectrum ranges. It is widely accepted that the radiometric property of the lunar surface is stable [5,6], however the lunar observations require some further processing for an absolute calibration source. The US Geological Survey (USGS) developed the Robotic Lunar Observatory (ROLO) model used in modeling lunar irradiance for Earth-observing remote sensing instruments covering wavelengths between 0.35 μm and 2.39 μm [6,7,8]. The ROLO model provides spectral irradiance of the moon considering the variations of the moon phase and libration angles at the sensor’s observation point and the Relative Spectral Response (RSR) of the sensor’s band pass filter. Recently, Miller and Turner developed a lunar spectral irradiance database covering 0.3 µm to 1.2 µm wavelength range particularly for DNB calibration of the S-NPP VIIRS [5]. Later, the wavelength coverage of this model was extended to up to 2.8 µm. The model is based on convolution of solar irradiance spectra and lunar phase-dependent lunar reflectance, and considers the seasonal changes in Sun/Earth/Moon geometry over seasons using a Look-Up-Table (LUT) approach. In addition, Cao et al. developed the Lunar Band Ratio (LBR) method which provides relative radiometric calibration without using a lunar irradiance model [9]. The LBR methodology was successfully implemented for the AVHRR sensor radiometric calibration used in climate change studies [9]. Despite the lunar observation complexity such as incomplete lunar collections, it was demonstrated that the LBR could be used as a scheme to perform lifetime calibration of the Normalized Difference Vegetation Index (NDVI) derived from the AVHRR observation with ±1 percent (one sigma) level of satiability. The trending results with LBR were also compared to and consistent with the method using high altitude bright cloud developed by Vermote and Kaufman, which was also used in the NASA’s Long-Term Data Record (LTDR) project [10].
In this study, two independent methods using a lunar irradiance model and LBR are applied to evaluate radiometric performance of S-NPP VIIRS RSB bands. Using the Miller and Turner (MT) model, the moon-based calibration coefficients (F-factors) are calculated and compared to the primary SD derived F-factors which have been used for generating NOAA’s VIIRS Science Data Record (SDR) products. The MT model provides source irradiances after correcting geometric parameters and it acts as a known illumination reference. The lunar F-factor plays an important role in validating the SD based trending results. The LBRs are calculated as the ratio between the sum of the valid pixel digital numbers (DN) and the reference band. The ratio approach factors out the geometric dependencies of the Moon-Earth and Sun-Moon distances significantly reducing seasonal variations. Finally, the radiometric calibration differences among the two lunar based calibration results and SD-based F-factor responses are compared and discussed over the VIIRS’ lifetime.

2. SD-Based Calibration and Selection of Reference Band

The VIIRS onboard calibrators include the SD, blackbody (BB) and space view (SV).The RSB calibration depends on SD and SV observations. When S-NPP satellite moves from the night side toward the day side of the Earth near the South Pole, the Sun illuminates the SD panel and the Sun view port of the SDSM through attenuation screens. Since the geometric orientation of the light source, i.e., azimuth and elevation of the Sun, changes for each VIIRS scan, an accurate estimation of the bidirectional reflectance distribution function (BRDF) of SD is necessary. The SD BRDF measurements were performed during the pre-launch testing and updated with the on-orbit yaw maneuver measurements. The BRDF is modified by the SD degradation due to the exposure of SD to sunlight over time. The SD degradation (H-factor) has been monitored by SDSM. The SDSM is a ratio radiometer that measures the rate of SD degradation by taking the ratio between Sun and SD view digital counts (DCs) with proper corrections of the SD and Sun attenuation screens at the time of observation. All the SD and SDSM related trending plots are routinely monitored and available at the NOAA Integrated Calibration Validation System (ICVS) webpage [11]. The details of H-factor are well documented in the VIIRS radiometric calibration algorithm theoretical basis document (ATBD) [4]. Figure 1 shows the ICVS version of the lifetime trending plot of SD degradation.
Figure 1. Visible Infrared Imaging Radiometer Suite Solar Diffuser (VIIRS SD) degradation over time as revealed by H factor monitored by Solar Diffuser Stability Monitor (SDSM). In the legend, “det” means SDSM detectors and the detector center wavelength are listed below the detector number. (from ICVS webpage on 30 September 2015 [11]).
Remotesensing 08 00015 g001
Once the H-factor is determined, the RSB calibration coefficients (F-factors) can be calculated using the ratios between the estimated and measured radiance at the time of the SD observations as shown in Equation (1).
F = cos ( θ i n c ) [ E s u n τ s d s H ( t ) B R D F ¯ ] R V S S D c 0 + c 1 d n S D + c 2 d n S D 2
The “ d n S D ” is the offset corrected SD DN, and “ R V S S D ” is response versus scan function at the angle of SD observation, “ c 0 , 1 , 2 ” are the detectors and electronics temperature dependent calibration coefficients, θinc is solar incident angle to the SD screen, “Esun” is solar irradiance, τsds is screen transmittance function, “BRDF” is the BRDF function out of on-orbit yaw maneuvers, and “H(t)” is SD degradation over time. The H-factors are applied to corresponding VIIRS bands according to the SDSM detector center wavelengths at the SD observation angle. Figure 2 shows the ICVS version of F-factors and they are averaged over the Half Angle Mirror (HAM) sides, gain states, and all the detectors in each band. The F-factors are quite stable over the lifetime of the VIIRS in the visible bands of M1 to M4. On the other hand, the NIR bands M5 to M10 show a gradual increase over time due to detector gain changes along with the S-NPP mirror contamination [2,3]. The SD degradation applied bands, M1~M7, I1 and I2, have a small drop in F factor near the end of each year due to the reduced number of data points (or mis-alignment). The oscillations in the H-factor are caused by the limitations in the definition of the SDSM and SD “sweet spot” [12]. The “sweet spot” is the predefined SDSM and SD geometric ranges that are defined in the Operational Algorithm Description (OAD) at Joint Polar Satellite System (JPSS) webpage [13]. Among all the RSB bands, the band M11 in Figure 2 shows the most stable F-factor response over the VIIRS lifetime. Band M11 has its center wavelength at 2.25 µm and is not affected by SD degradation (H-factor) effects. Therefore, the band M11 is selected as a reference band for calculating LBR in this study.
Figure 2. NOAA ICVS VIIRS F-factors averaged in Half Angle Mirror (HAM) sides, gain states and detectors for all the RSB bands.
Remotesensing 08 00015 g002

3. Lunar Calibration and Methodology

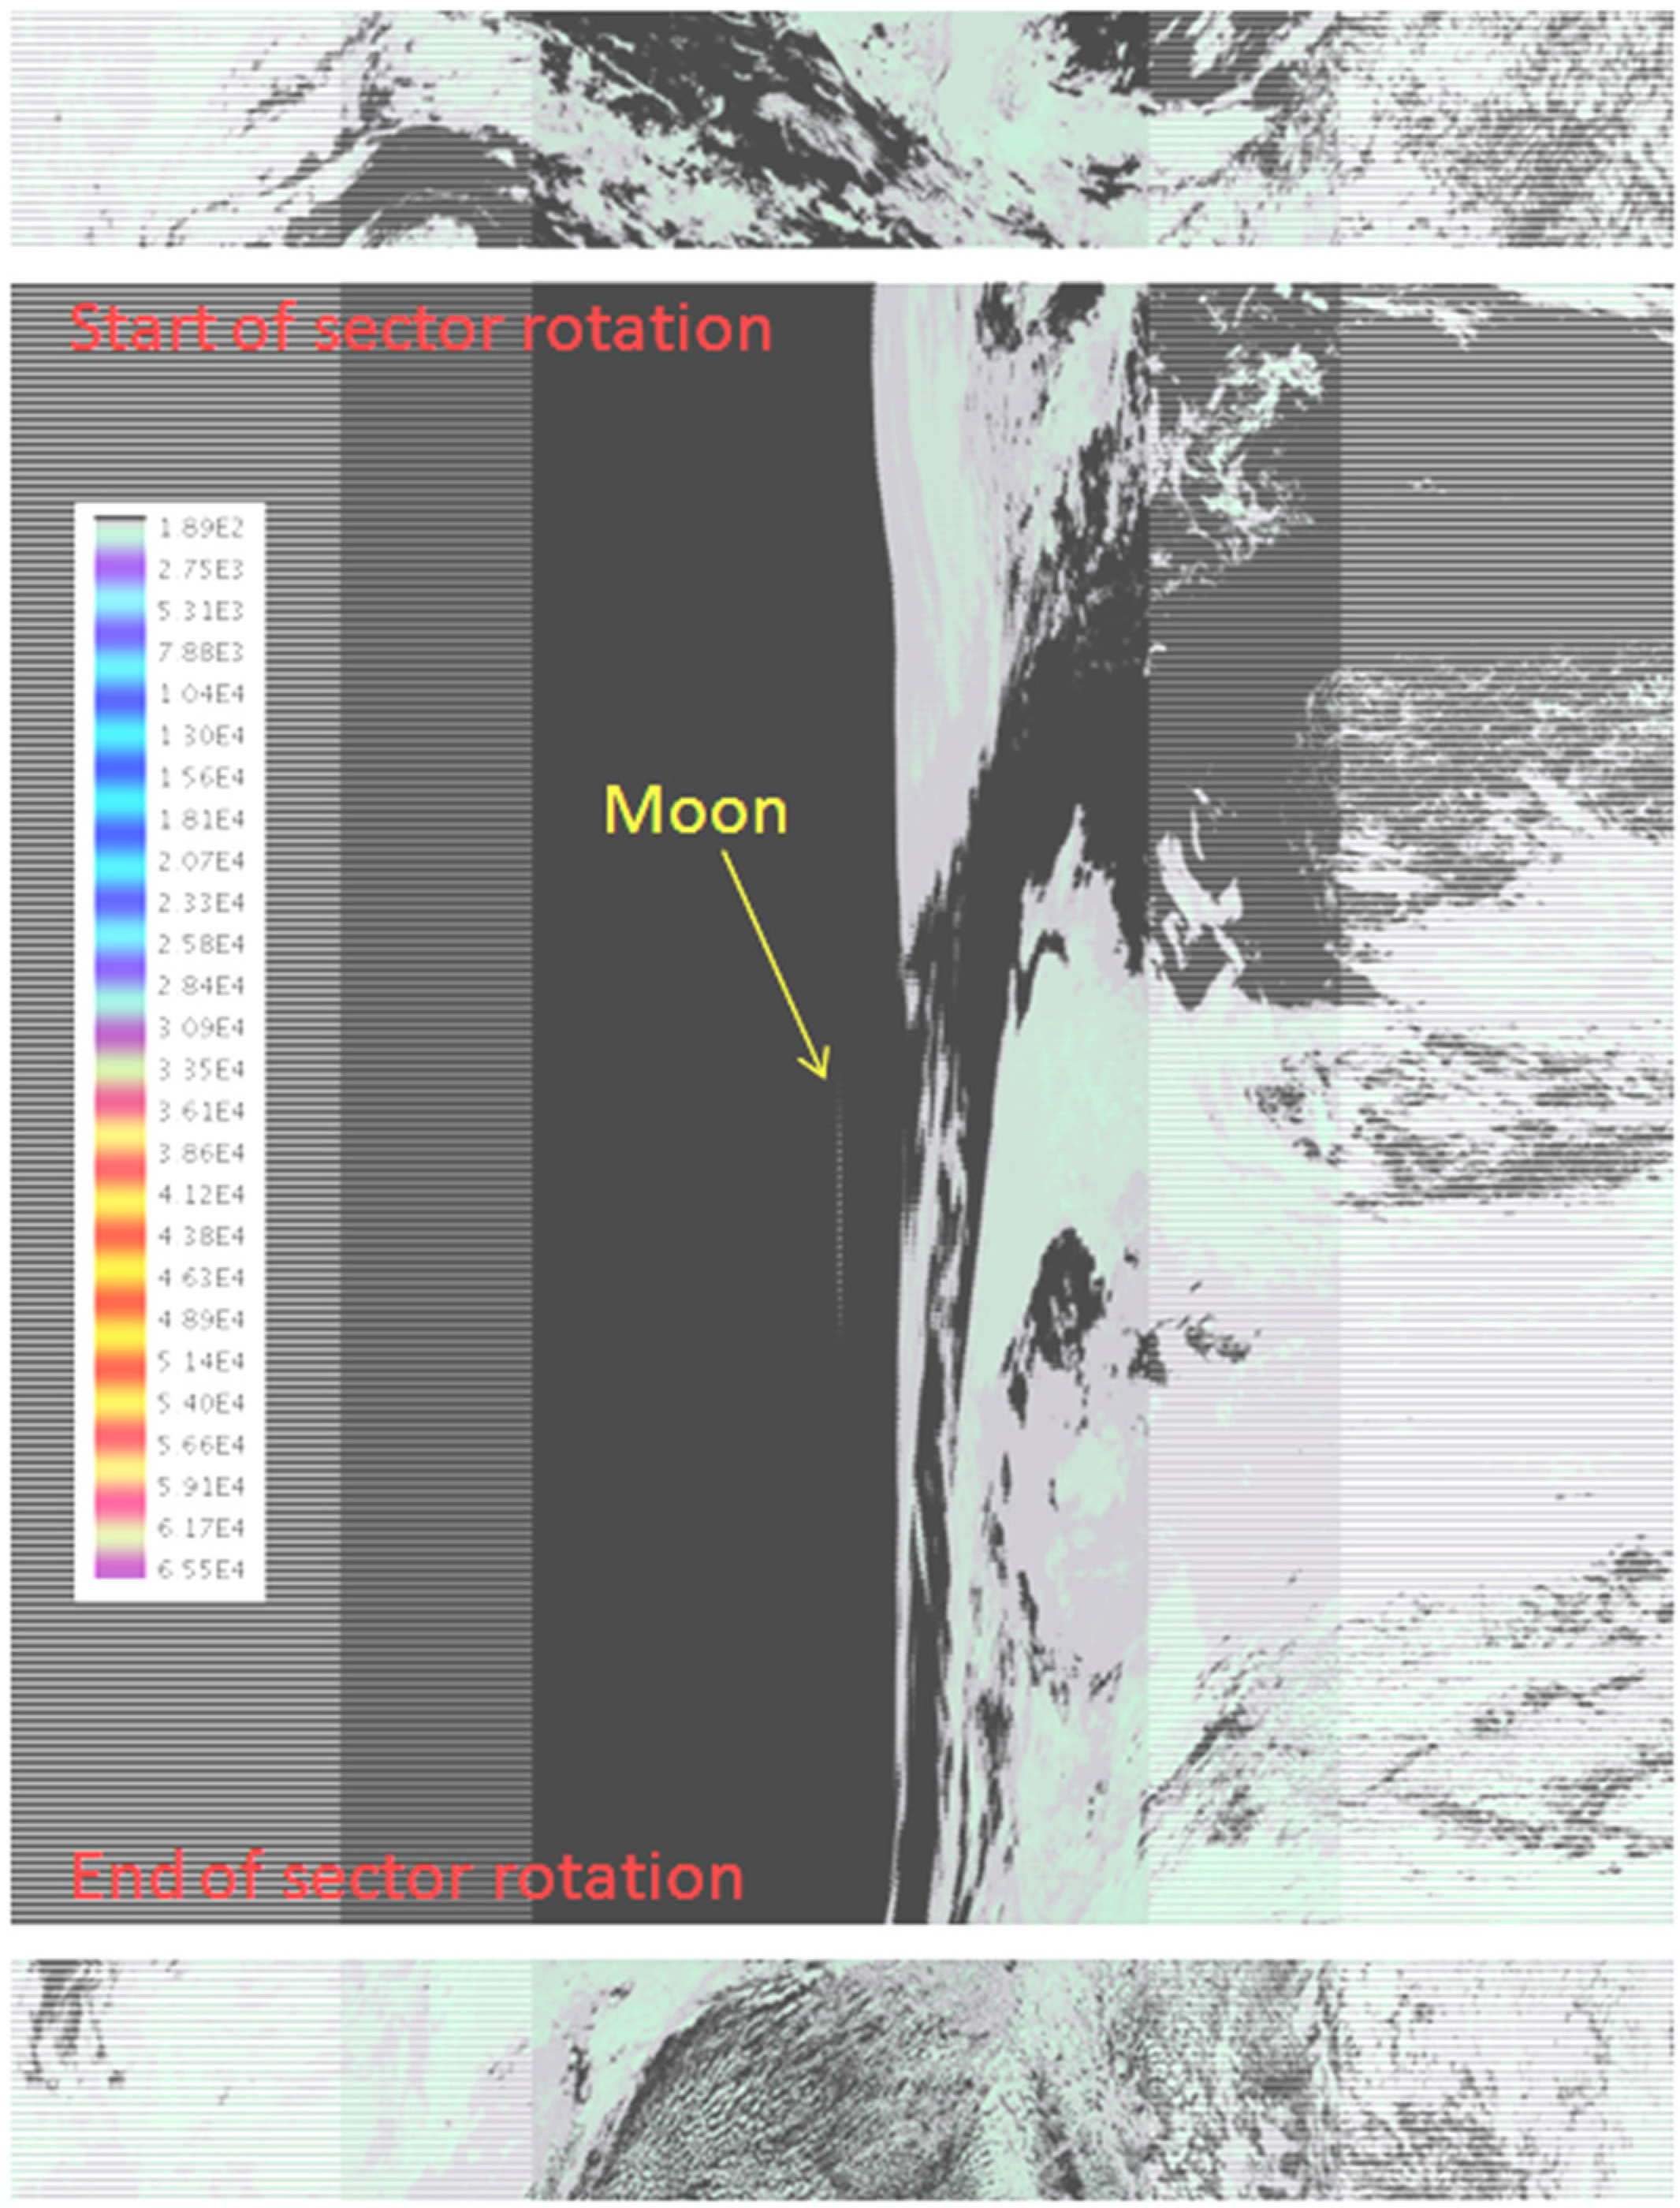
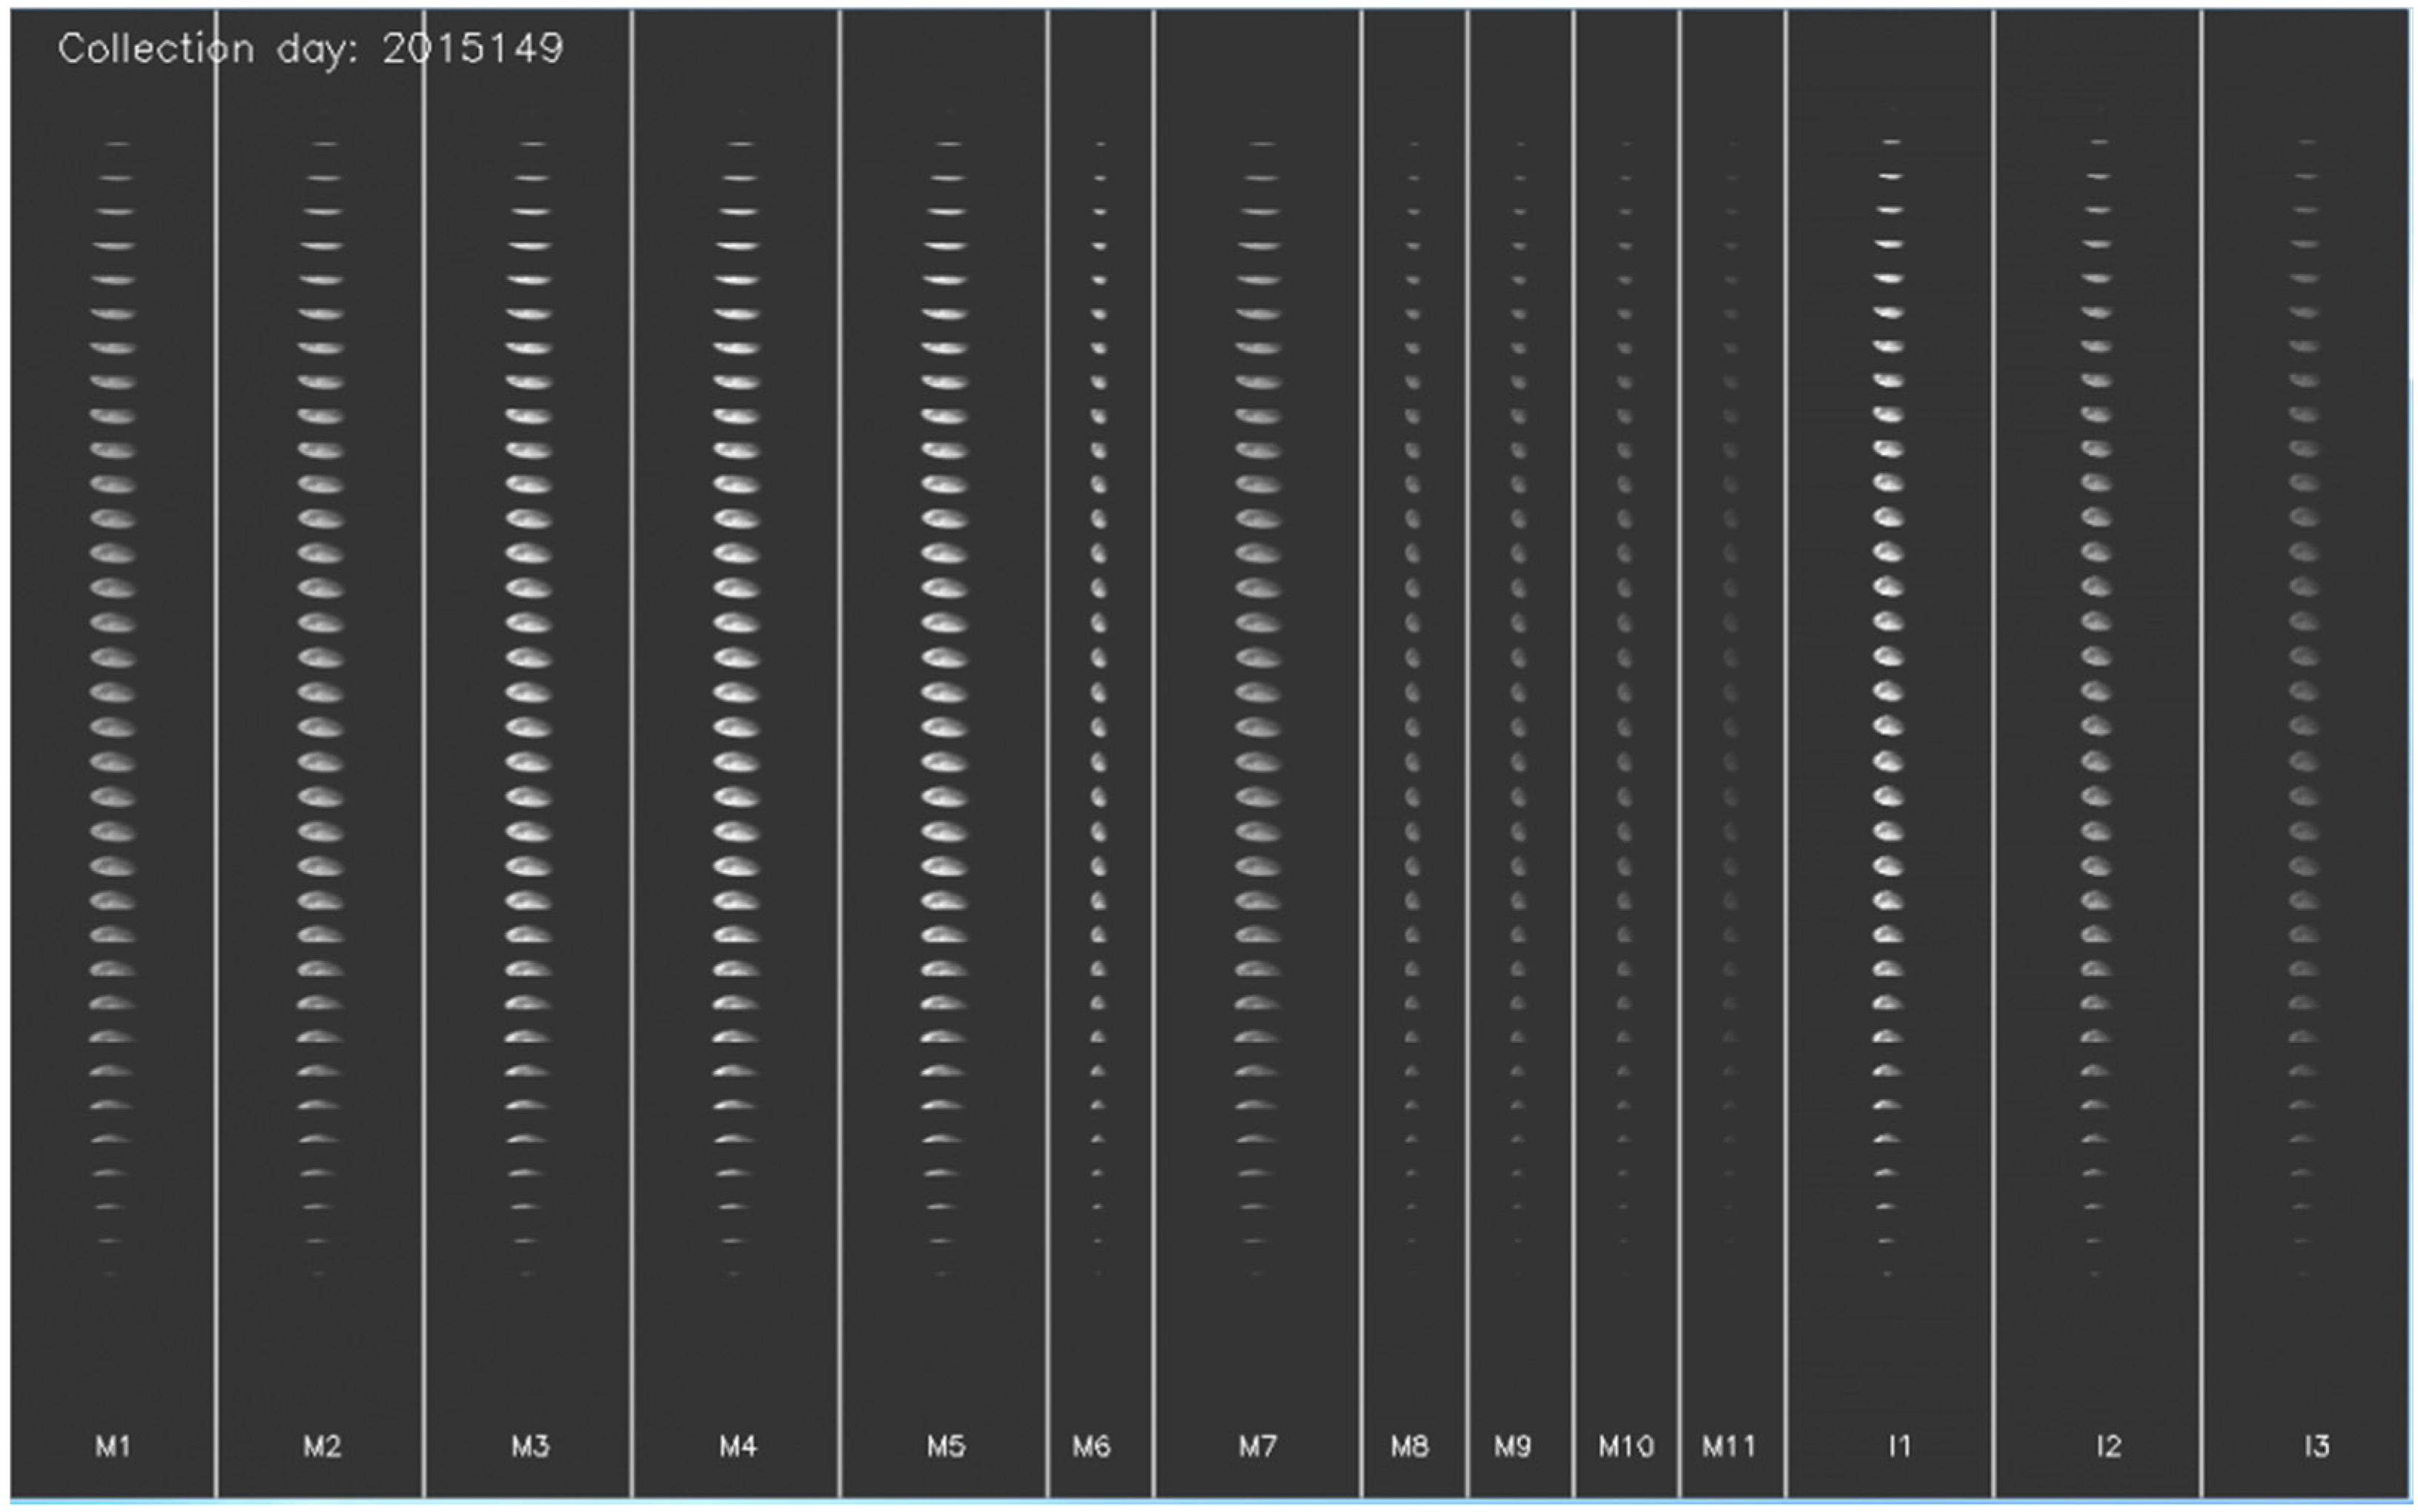
3.1. VIIRS Scheduled Lunar Collections

Similar to MODIS, VIIRS views the moon through the SV port from −66.10 to −65.25 degrees from the nadir before the start of the Earth View (EV) reading as shown in Figure 3 [2]. Since the Earth limb angle is located −62 degrees from the nadir for a sensor with 828 km altitude, the location of SV port is approximately 3 degrees above it [14]. The SV port provides 48 frames (or samples) in the scan direction for the M bands and 96 frames for the I bands. The frame means the sample in the scan direction. For the scheduled lunar collections, two major constraints of the VIIRS roll maneuver are the roll and lunar phase angles. During the maneuver, the roll angle along with the moon location was determined to place the moon at the center of SV frame. The sector rotation shifts the SV frame to the center of EV. The range of roll angle is limited between 0 and −14 degrees by the operational limits [15]. Because of the narrow SV viewing angle of 0.85 degrees, a spacecraft roll maneuver is required to cover the entire disk for the desired lunar phase angle of −51 degrees.
During the scheduled lunar data collection, a “sector rotation” is performed so that the VIIRS EV angle range is shifted to place the SV data at the center of the EV frame. By doing so, the data coverage of the 0.85 degrees of the SV port is expanded to the 112.56 degrees of the EV range. The other purpose of the sector rotation is that the EV data is corrected for the band-to-band sampling location differences in each band. This means that the sampling time difference of each band has been corrected so that the locations of the moon are aligned in all bands. Figure 4 shows the EV image of band M11 together with the start and end of the sector rotation of the scheduled lunar data collection on 29 May 2015. As expected, the multiple scans of the moon are located at the center of EV frame. Since the DN level of the moon is much lower than the bright EV scene and the fill values, a color map was chosen to visualize the moon acquisition in Figure 4. After the sector rotation, the SV DN values are not valid for the background offset determination and the offset levels need to be calculated using the dark space DN values on either sides of the moon. All of the scheduled lunar data collections of VIIRS used in this study are listed in Table 1. The actual lunar phase angles range between −52 and −50 degree, which greatly limits the uncertainty due to variations in phase angles.
Figure 3. A simplified schematic of VIIRS view versus scan angle [2].
Remotesensing 08 00015 g003
Figure 4. A scheduled lunar data collection for band M11 on 29 May 2015 with the sector rotation.
Remotesensing 08 00015 g004
Table 1. The scheduled moon data collection information for VIIRS.
DateTimePhase AngleDateTimePhase Angle
2 April 201223:05:32−51.2412 March 201401:12:08−51.05
2 May 201210:20:25−50.9210 April 201420:53:40−50.60
25 October 201206:58:38−51.0110 May 201413:13:21−50.91
23 November 201221:18:43−50.739 June 2014 *03:49:02−51.04
23 December 201215:01:16−50.904 October 2014 *17:29:33−50.80
21 February 201309:31:50−50.713 November 201401:08:00−50.52
23 March 201303:29:24−51.1531 December 201419:38:32−50.73
21 April 201319:48:16−50.8230 January 201508:22:39−51.16
14 October 201321:39:42−50.9430 March 201516:49:30−51.29
13 November 201306:58:03−50.6629 April 201512:29:48−50.43
12 December 201319:36:11−50.3929 March 201504:47:30−51.07
11 January 201410:00:10−51.3027 June 2015 *14:17:10−54.42
10 February 201405:34:37−51.03---
* The asterisks above the date denote that no roll maneuvers were required for the corresponding collections.

3.2. Lunar Irradiance Models

The amount of moonlight observed by satellite radiometers depends on Sun-Moon-Earth geometry, lunar phase (ranging from a new to full moon) and libration of the moon. In this paper, we use a top-of-atmosphere spectral lunar irradiance model developed by Miller and Turner (MT) to evaluate the spectral irradiance of moon derived from VIIRS observation [7]. This model was originally developed in preparation of calibrating nighttime low-light measurements from the Day-Night-Band (DNB) sensors of S-NPP VIIRS to enable quantitative nighttime multispectral applications [16]. The MT model uses solar source observations called Solar Radiation and Climate Experiment (SORCE), lunar spectral albedo data, and accounts for the time varying Sun/Earth/Moon geometry and lunar phase. It produces 1-nm resolution irradiance spectra over the interval from 0.3 μm to 2.8 µm for any given lunar phase. In this model, the scattering property of lunar surface is assumed to be Lambertian. The model has been benchmarked against lunar observations such as with SeaWiFs and MODIS-Aqua satellites and the ROLO lunar irradiance model [5].
As mentioned earlier, ROLO has been extensively used for as an alternative on-orbit radiometric calibration source. Recently, European Organization for the Exploitation of Meteorological Satellites (EUMETSAT) implemented a ROLO based lunar calibration tool for the Global Space-based Inter-Calibration System (GSICS) community [17]. The name of the tool is called GSICS Implementation of the ROLO model (GIRO) and it was successfully developed and validated among different agencies. We have also successfully implemented GIRO as well as MT model. Unfortunately detailed results from the GIRO model cannot be included this paper because the GIRO usage policy has not yet been finalized.

3.3. VIIRS Observed Lunar Irradiance and Lunar F-Factor

As shown in Figure 4, VIIRS lunar irradiance calculation starts with identifying the granules based on the collection time from Table 1. For all of the VIIRS RSB, the selected lunar scans are around the center of the raw EV images. The lunar data for irradiance calculation are selected to include lunar images with a sufficient number of dark pixels from either sides of the moon for dark offset calculation. The center frame number along the scan direction of the lunar scans used in this study is #3152 for dual gain M bands, #1600 for single gain M bands, and #3195 for I bands. Based on the moon frame number, offset values are calculated from dark pixels within two windows to the left and right of the moon along the scan direction. For the dual gain M bands, the chosen window width is 50 frames and the center of the two windows is located at frame #3077 and #3227, respectively. For the single gain M bands and I band, the same window locations are chosen corresponding to the different sampling frequencies. The scan-averaged DN offset-value calculated from the two windows is applied to derive offset-corrected lunar DN for each band (B), detector (D), HAM sides (H), Frame (F) and Scan (N) as shown in Equation (2). This offset-removed DN value is denoted as “dn”. For all of the scheduled lunar data collections, the gain state is at high gain because of the low radiance level of the moon.
dn ( B , D , H , F , N ) = lunar DN ( B , D , H , F , N ) DN ( B , D , H , N ) offset scan averaged
At aperture-lunar radiance is calculated based on Equation (3), once the background offset is removed from lunar data. The on-orbit “c” coefficients are calculated with simultaneous detector and focal plane temperature measurements (Tdet and Tele) for each B, D, and H. The “c” coefficients correct the combined thermal effects caused by the Analog Signal Processor (ASP) and Analog to Digital Converter (ADC) [4]. They are represented as the second order polynomial function of detector and focal plane temperatures considering the non-linear effect. The F-factor is interpolated and applied to Equation (3) at the time of lunar scan for each B, D, and H. Finally, the response versus scan angle (RVS) is applied which is very close to unity for the view angle near SV.
L pixel ( B , D , H , F , N ) = F ( B , D , H , N ) i = 0 2 c i ( B , D , H , F , N , T det , T e l e ) d n ( B , D , H , F , N ) i R V S ( θ s v , B , D )
Starting on 9 May 2014, the c 0 was set to zero and c 2 values were recalculated using the prelaunch test results [18]. The updated c coefficients reduced errors in data at low radiance level especially for the spectrally similar band pairs of I2/M7 and I3/M10. An in-depth study on the c coefficient update was reported and showed improved accuracy in radiance data measured over a Hawaiian ocean scene [19].
The observed lunar irradiance, E, is calculated by the summation of radiances of all pixels as shown in Equation (4).
E(B,D) = P i x e l Ω Pixel F Pixel L pixel
where B denotes band, D denotes detector, Ω Pixel is the solid angle and Fpixel is the oversampling factor of the corresponding pixel. The oversampling factor is defined as the number of times that the same lunar surface is viewed by the detector. By the nature of the lunar collection and sensor scanning process, the same detector may see the same lunar surface more than once. For lunar observation of MODIS, the oversampling factor ranged from 1.39 to 5.56 depending on the spatial overlaps between the scans and resolution of the band [20].
To avoid pixel-based solid angle calculation, the lunar irradiance calculation can be simplified with Equation (5) by introducing a new measurable parameter: the effective number of lunar pixels (Npixel).
E(B,D) = P i x e l Ω Pixel F Pixel L pixel = Ω Pixel F Pixel P i x e l L pixel = P i x e l L pixel N p i x e l N p i x e l Ω Pixel F Pixel
In this study, only complete lunar scans are chosen when lunar F-factor and LBR are calculated. To ensure that a full moon disk is chosen, 5 complete lunar scans are selected for each collection with a 2-pixel margins (750 m resolution) at the start and end of the scans. Since we are using the complete lunar scans only, the pixel solid angle and oversampling factors are constant at the time of the complete lunar scans and these two parameters can be moved out of the summation as common factors. Then, by introducing the factor of Npixel into the equation, the right side of Equation (5) can rearranged to become the multiplication of two factors. The first part becomes mean radiance of the moon and the second part of the equation becomes moon solid angle as shown in Equation (6).
E(B,D) = R a d moon ¯ Ω moon
Here, R a d moon ¯ is the mean radiance of the moon, and Ω moon is the effective moon solid angle at the time of lunar observation.
Since the effective lunar solid angle Ω moon can be expressed as a function of the lunar phase angle (φ) and distance between satellite and Moon (DistSat_Moon), Equation (6) is expanded in Equation (7) to provide details of the lunar irradiance calculation.
E(B,D) = R a d moon ¯ π R m o o n 2 D i s t S a t _ M o o n 2 1 + cos ( φ ) 2
The onboard calibration of the reflective M and I bands of VIIRS uses SD with known BRDF properties. Using a predetermined solar irradiance model, the F-factor is defined as the ratio between the model-based SD radiance and VIIRS-measured radiance and can be used to trend radiometric performance of VIIRS sensors. Similarly, the lunar calibration coefficient (lunar F-factor) can be calculated with Equation (8) based on the ratio between lunar irradiance derived from MT model-and measured lunar irradiance by VIIRS. Since the scheduled lunar data collections are for high gain state only in the case of dual gain M bands, the derived lunar F-factors only trend the radiometric performance of high gain state for these bands.
F(B,D) = I M T _ mod e l ( B ) E ( B , D )

3.4. Lunar Band Ratio (LBR)

Previously, most of the lunar calibrations relied on using the lunar irradiance model such as RObotic Lunar Observatory (ROLO) and recently MT model [6,7,8] as the reference. The Lunar Band Ratio (LBR) approach is developed and applied as a relative radiometric calibration method and eliminates the need of a lunar irradiance model. As mentioned in the introduction section, the LBR was implemented using lunar observations from the AVHRR and the results were successfully used for climate change trending [9]. In this study, the LBR method is applied to monitor the lifetime radiometric calibration accuracy of the VIIRS RSBs. The LBR used in this paper is defined by Equation (9), which is calculated as a ratio between the sum of the offset-removed “dn” for the band of interest and sum of the “dn” of the reference band M11. Because the LBR is calculated as a ratio between the band of interest and a reference band for lunar data acquired at the same time, it factors out residual geo-related variations such as Sun-Moon and Moon-Earth distance effects and lunar phase dependence.
LBR(B) = d n P i x e l ( B ) d n P i x e l ( B a n d M 11 )

4. Results

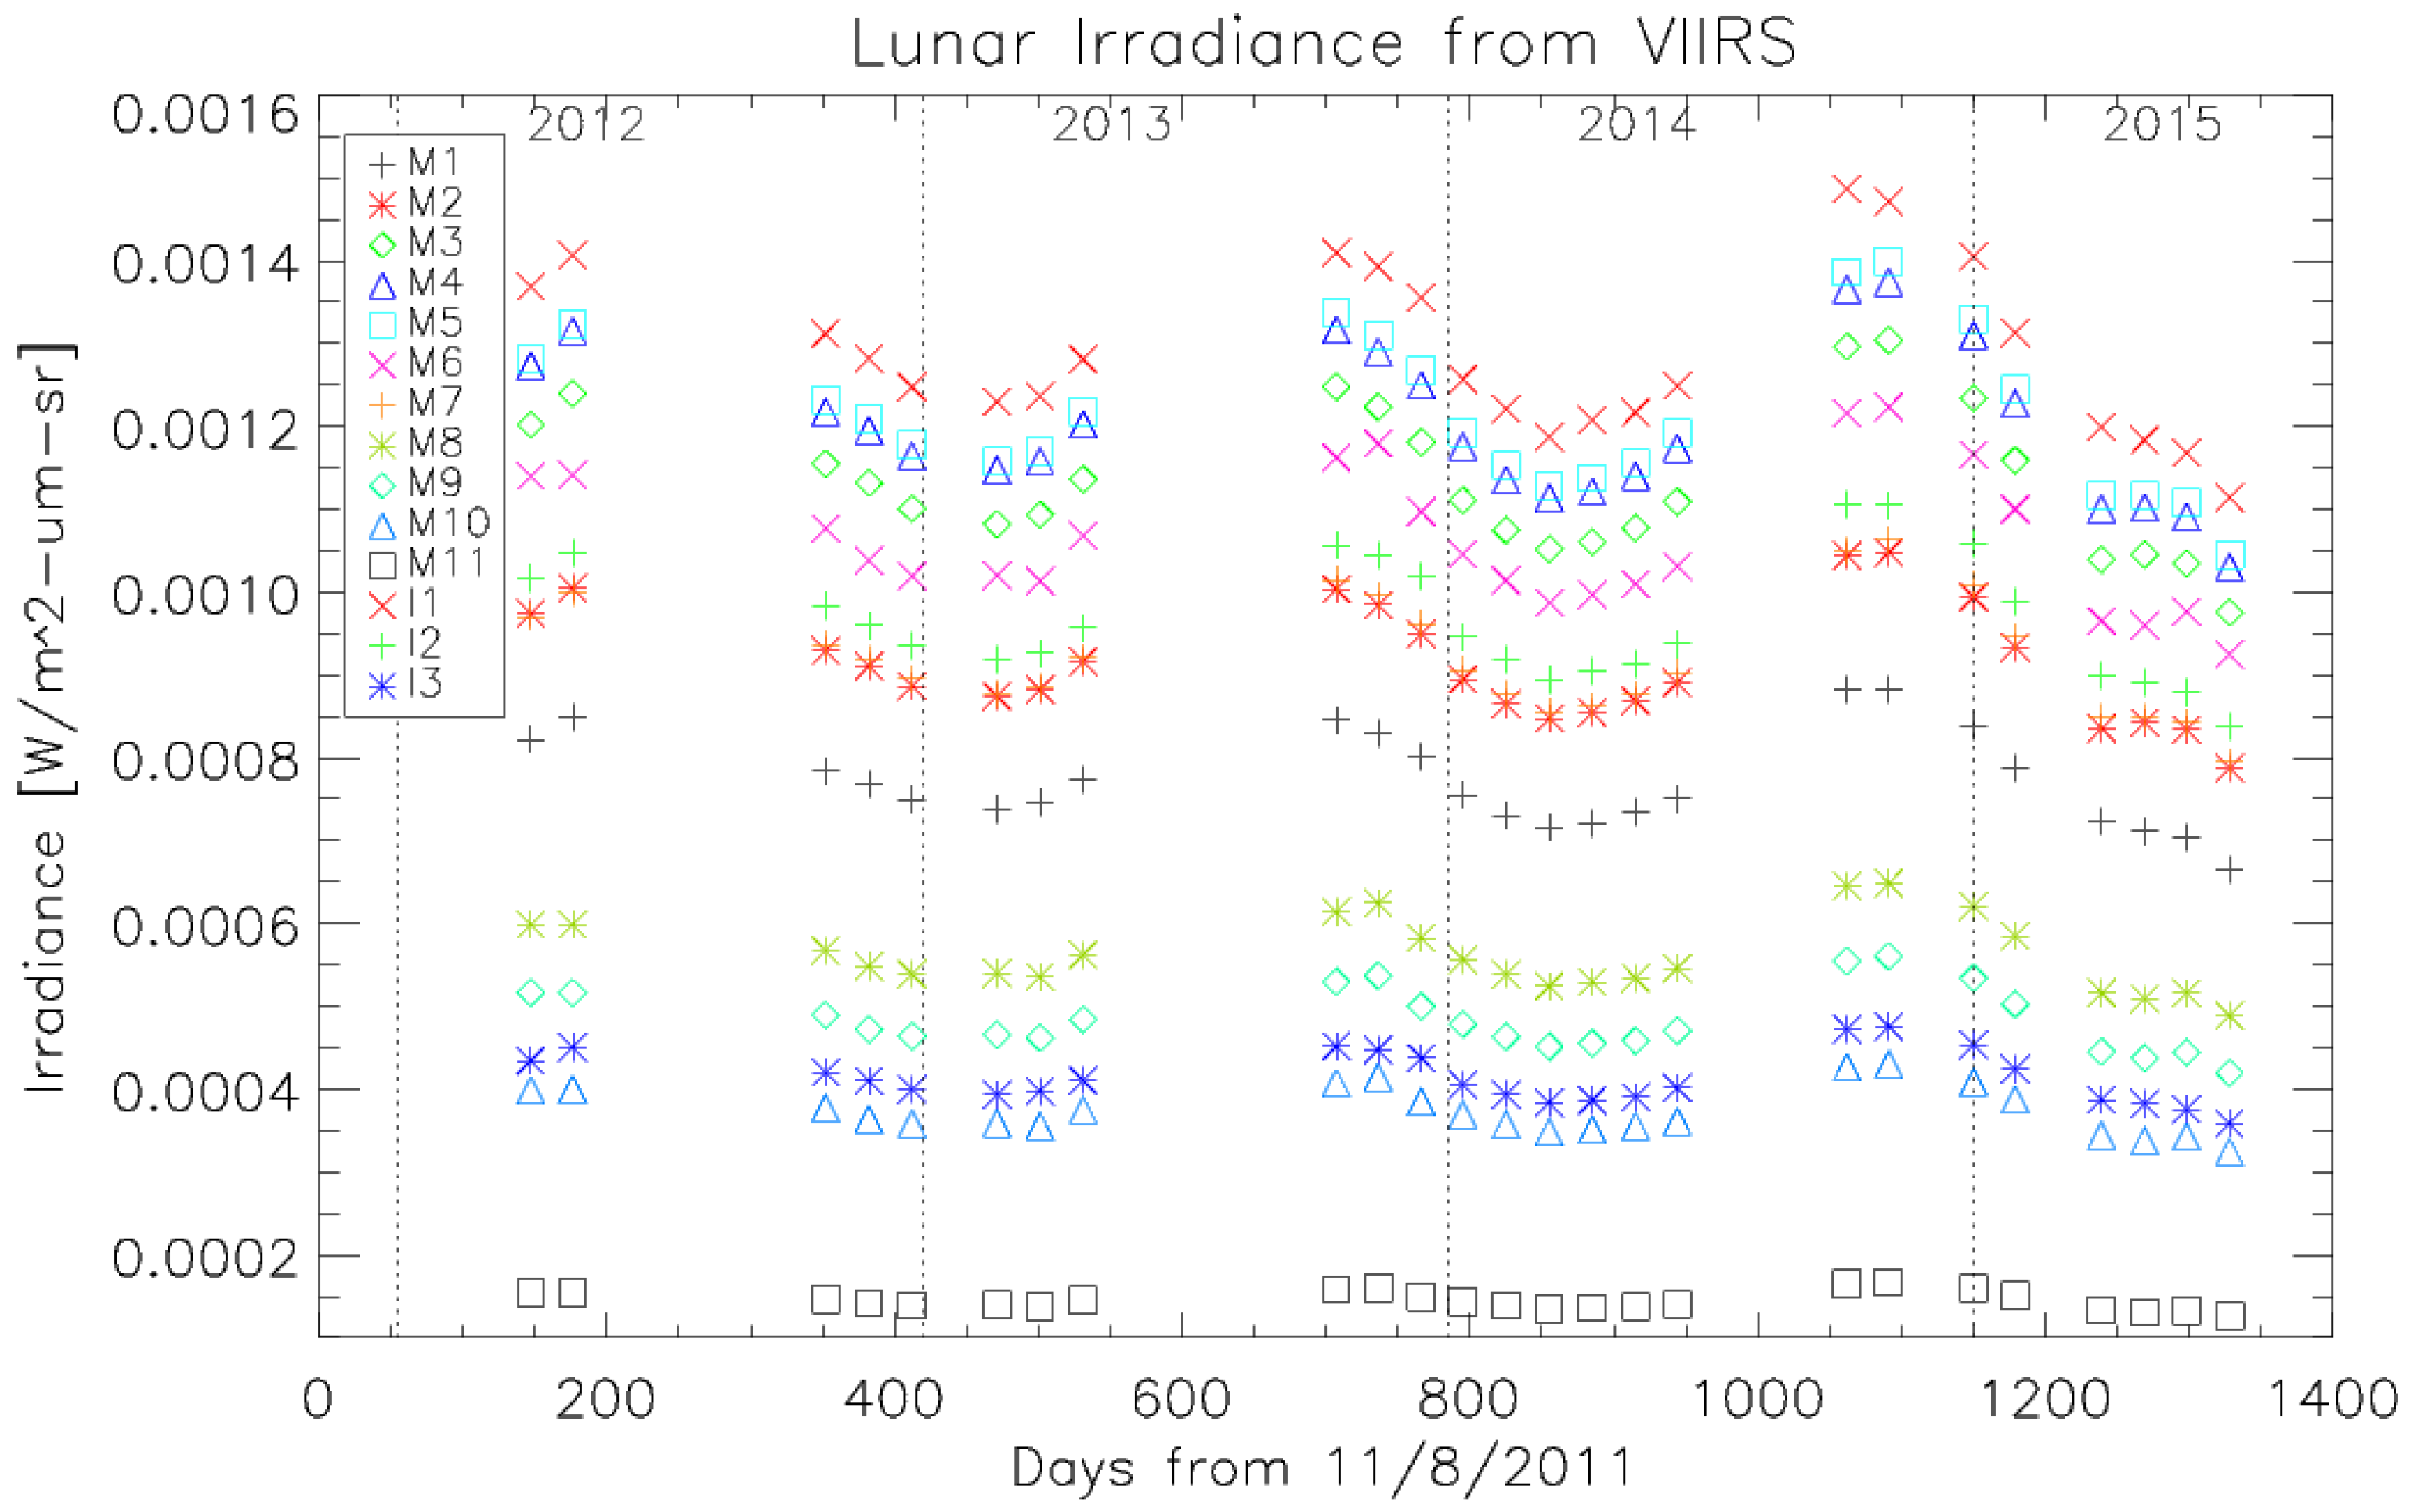
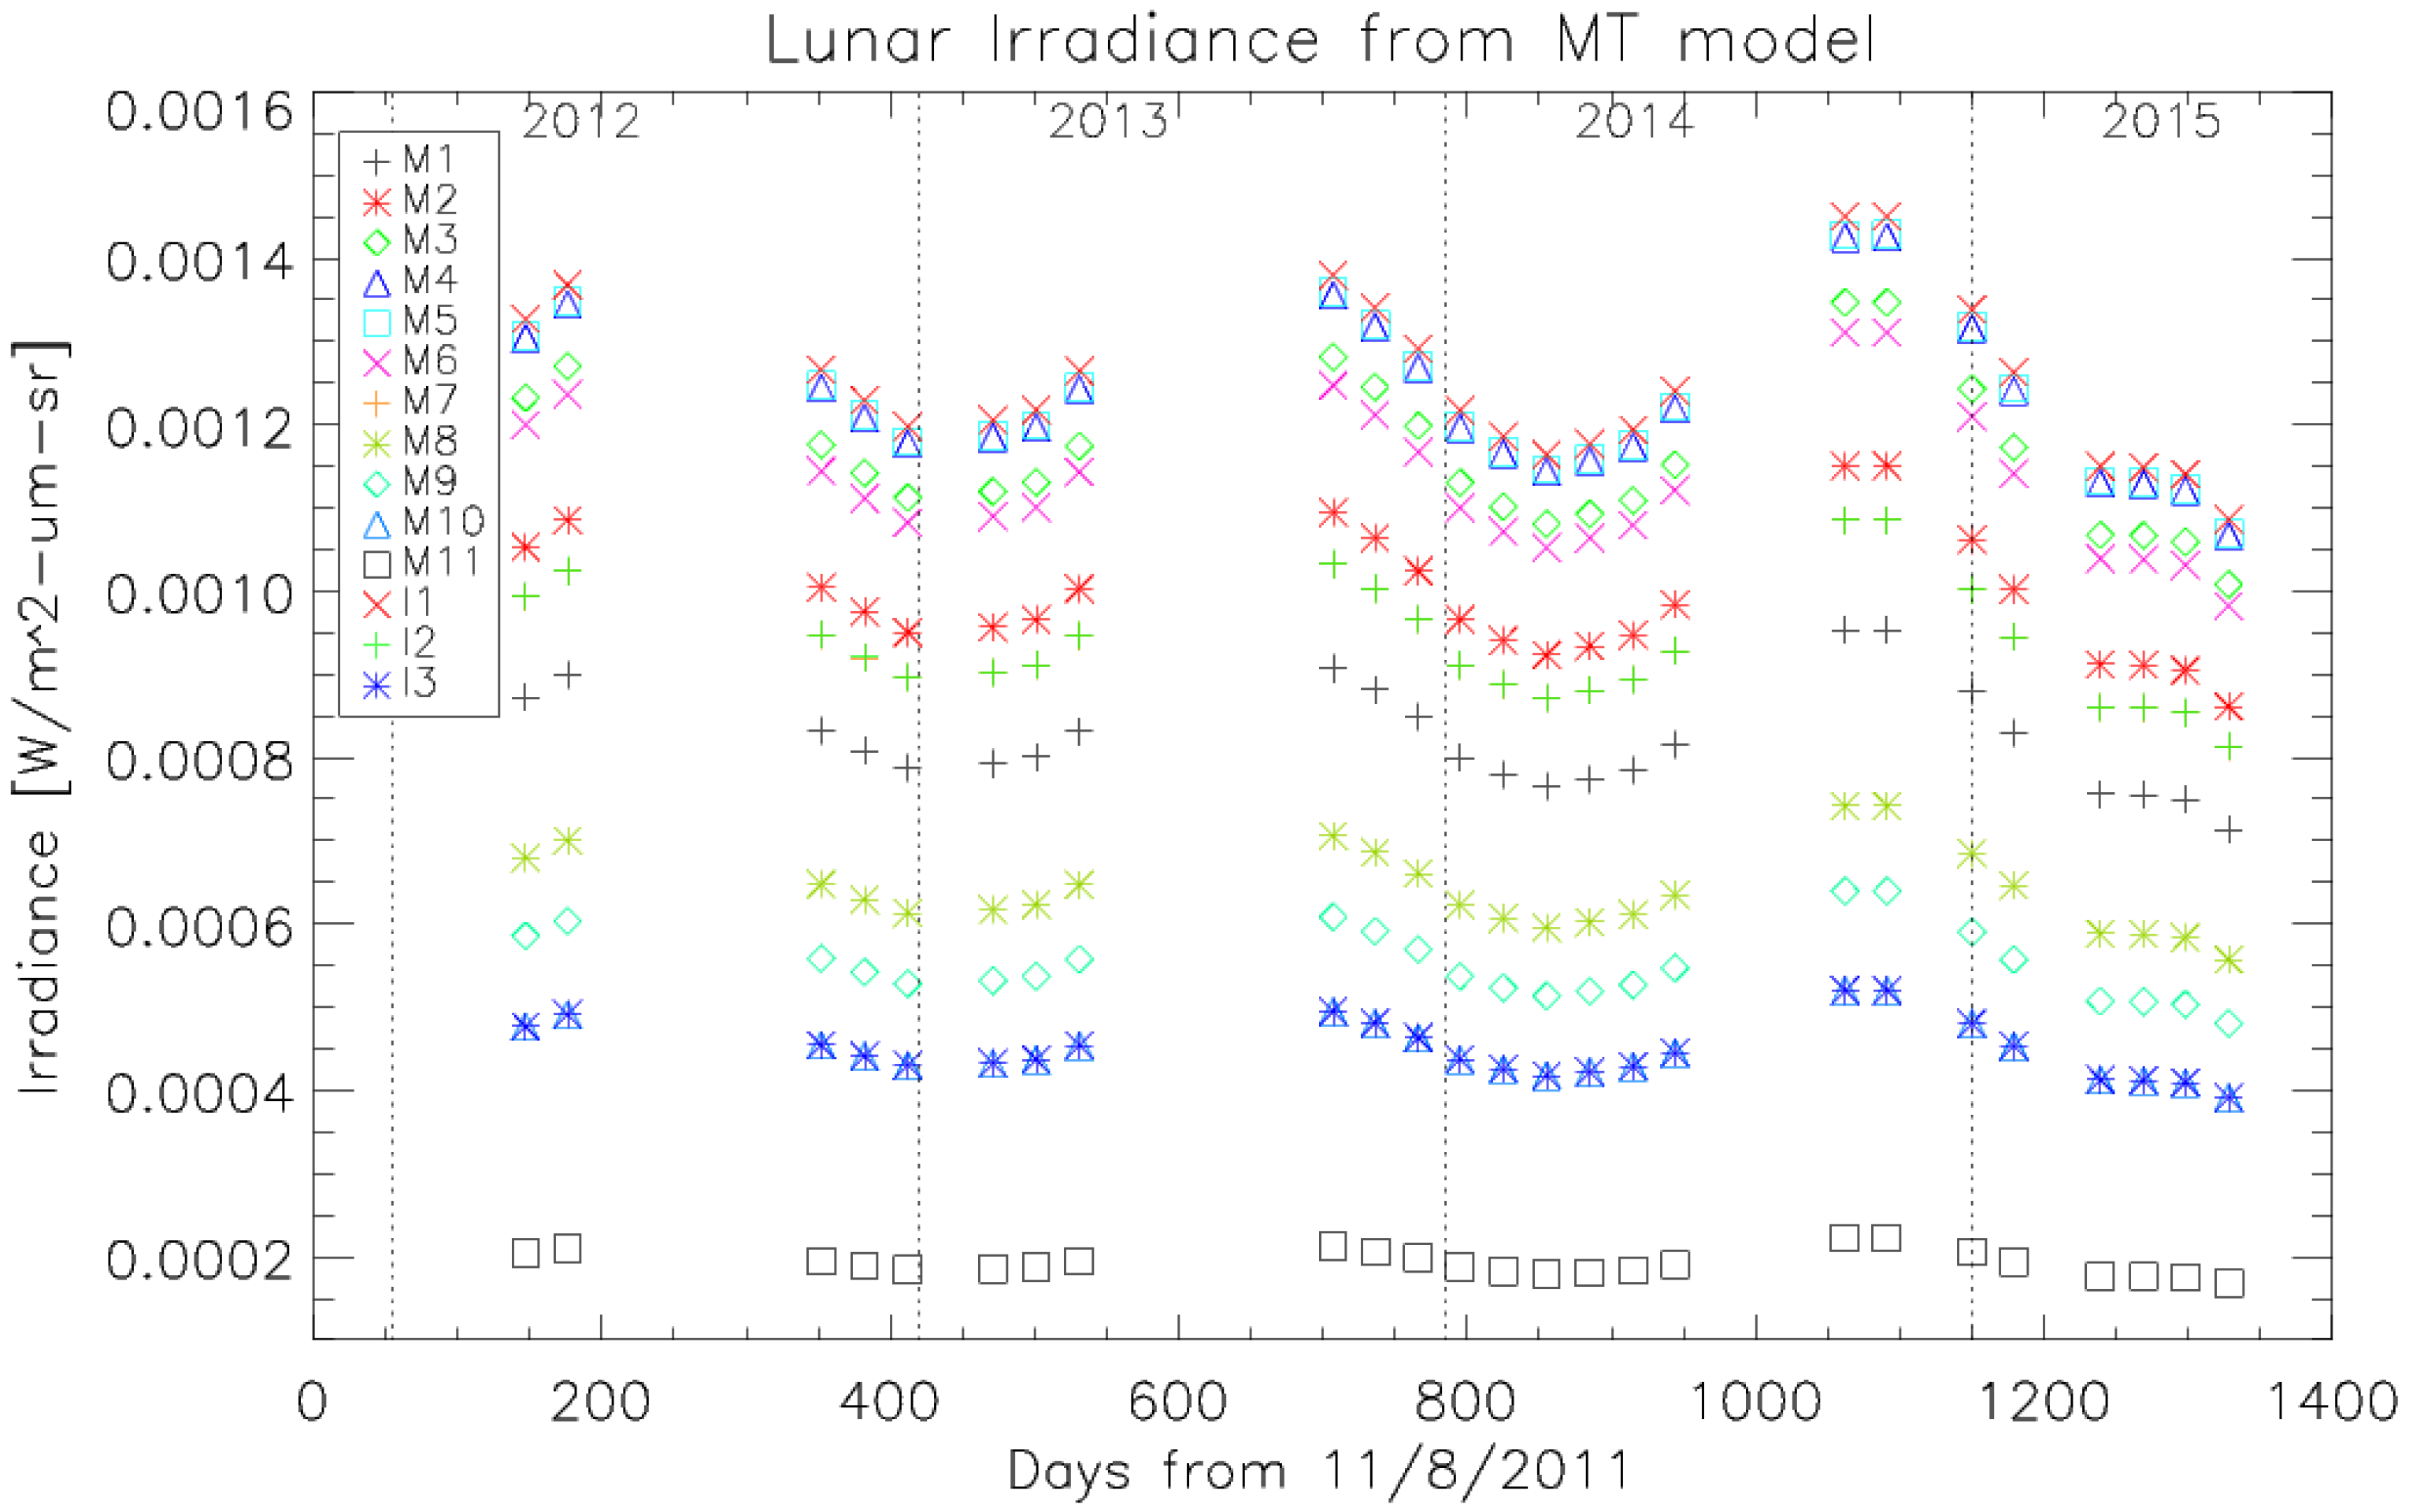
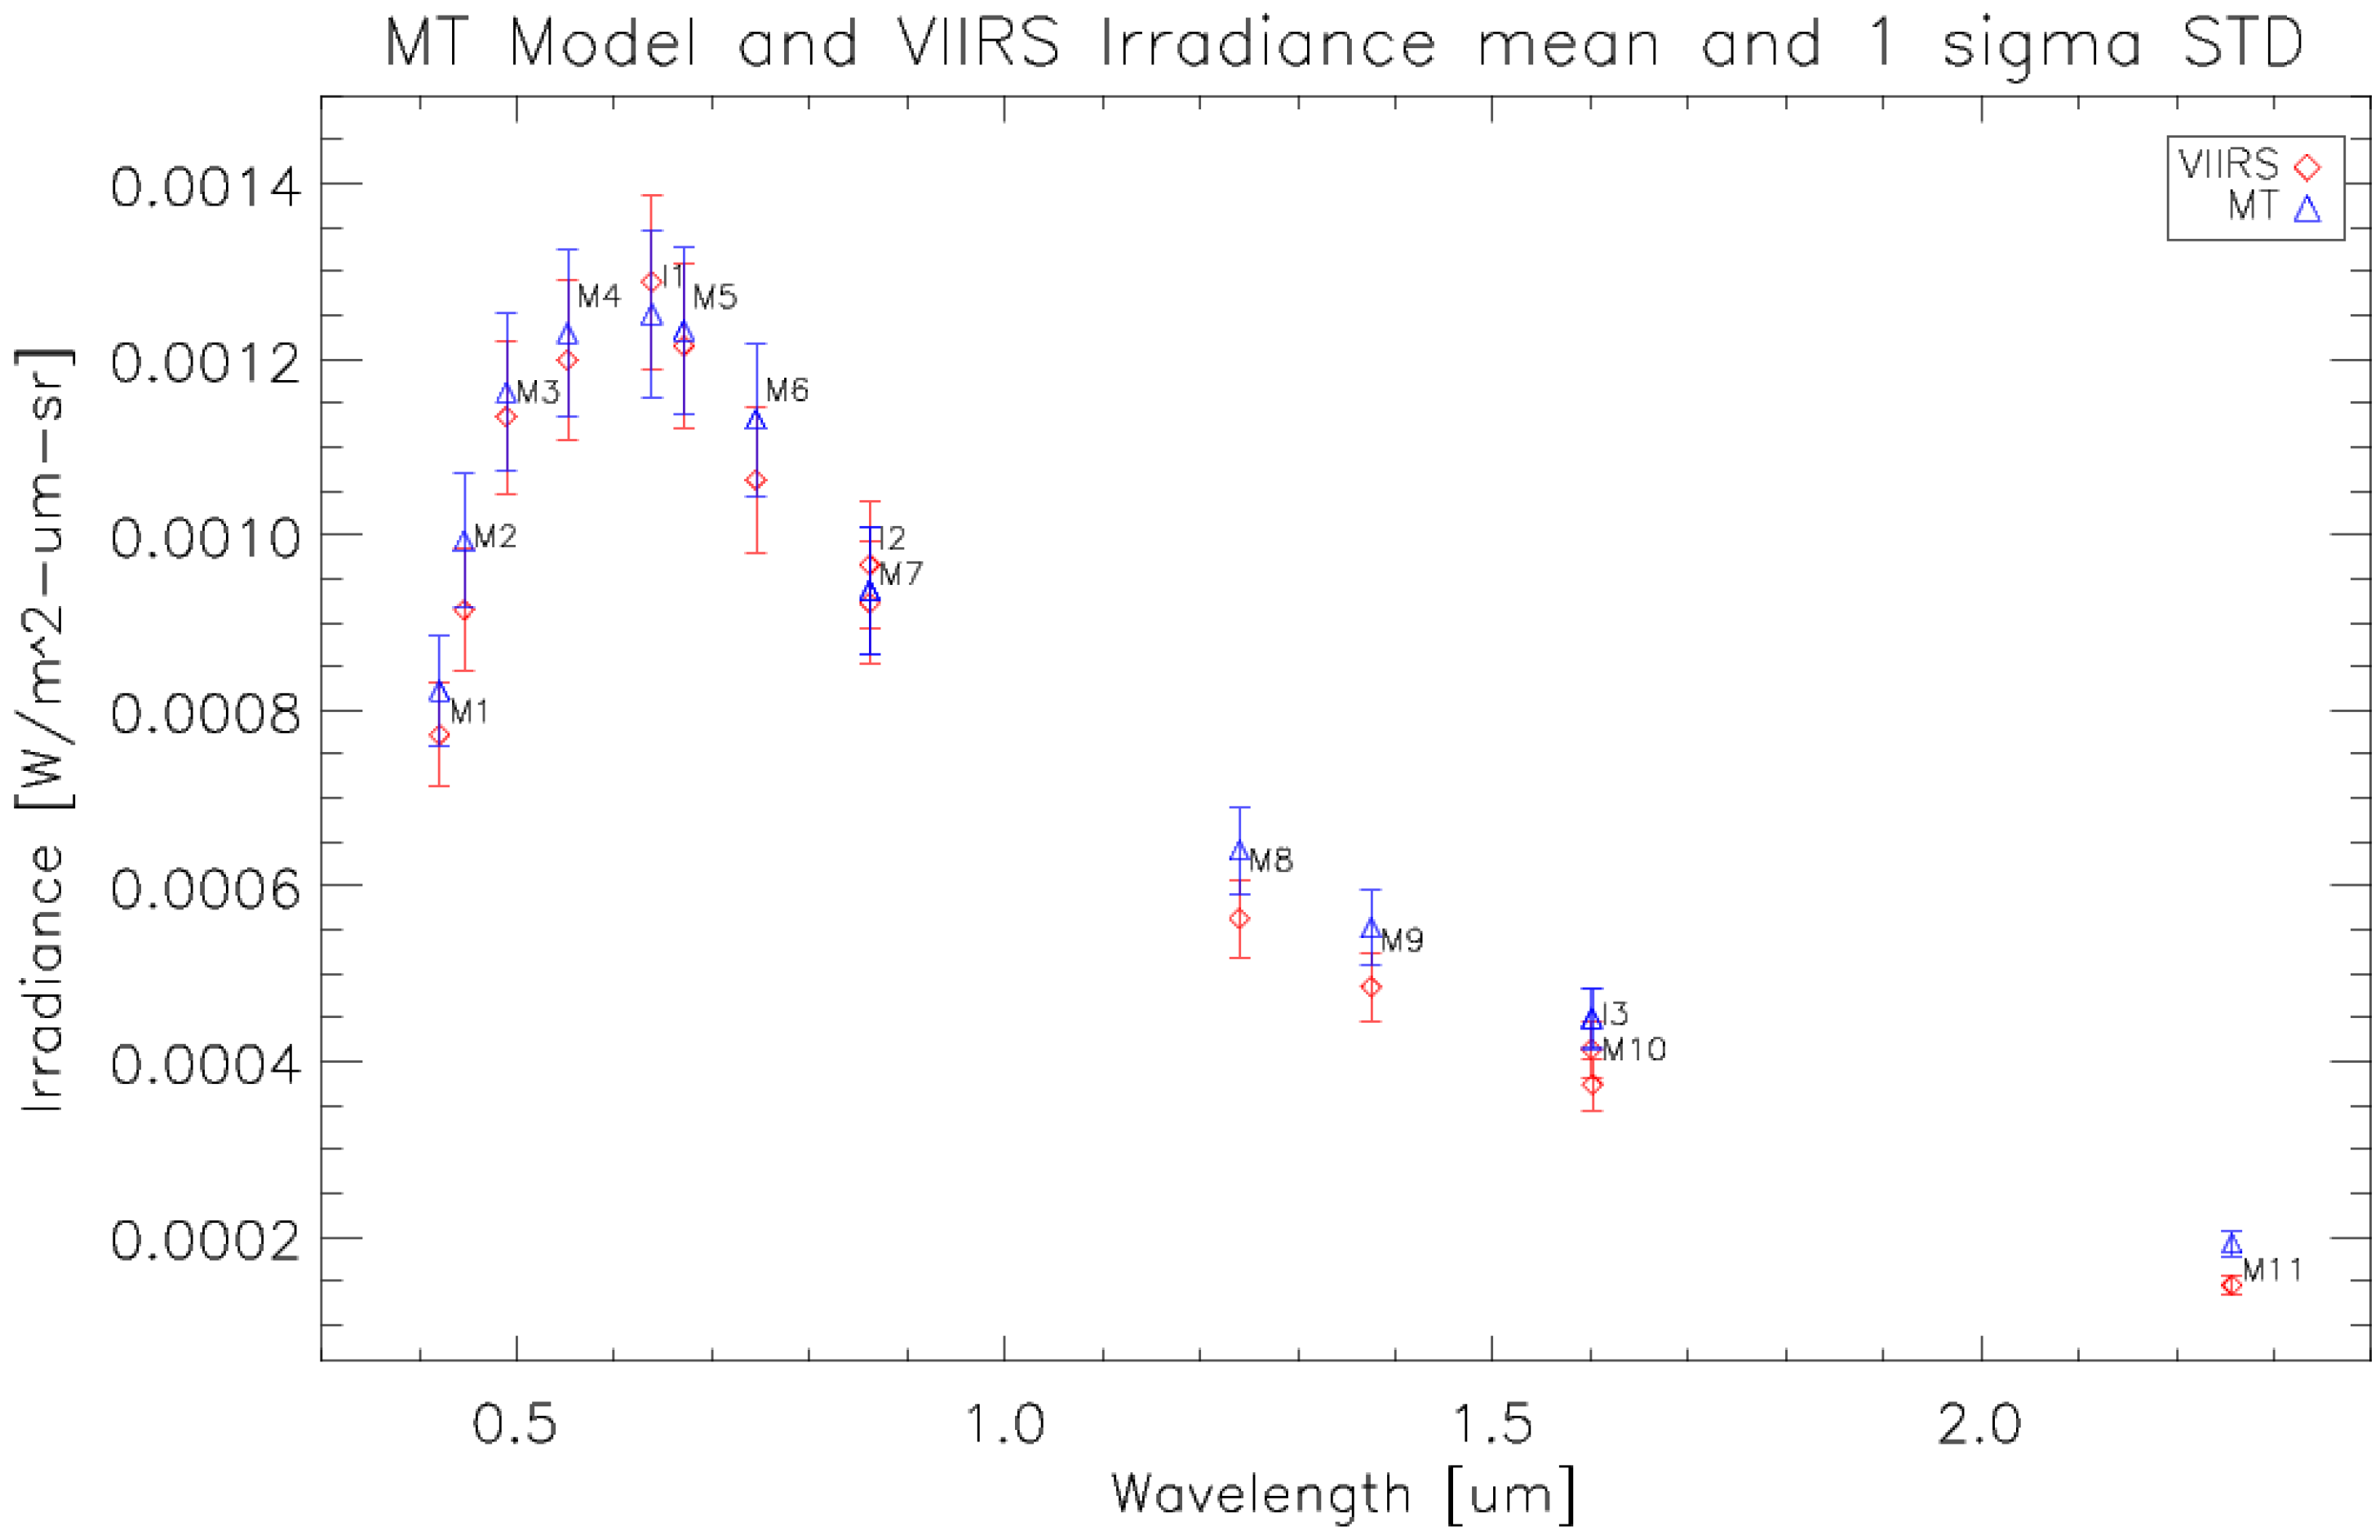
4.1. VIIRS Observed Lunar Irradiance Comparisons

The lunar surface observed by the VIIRS sensor is partially illuminated with lunar phase angle of −51.07 degree as shown in Figure 5. Near the nadir frame in band M1~M5, M7 and I bands provides 3 extra samples in scan direction which results in 3 times wide moon shapes in these bands. The phase angle (angle between Moon-Sun and Moon-VIIRS vector) determines the illuminated portion on the moon surface facing the sensor. In addition to the phase angle, the Sun-Moon and Moon-VIIRS distances also vary and depend on the time of data collection. The solid angle of Moon viewed by VIIRS is inversely proportional to the square of the moon and sensor distance and lunar phase as described in Equation (7). Taking all accounts of these lunar view geometry factors at the time of data collection, the lunar irradiances observed by VIIRS are shown in Figure 6 for all VIIRS RSBs since 2012. For each band, lunar irradiance is calculated over all detectors by combining lunar data from multiple lunar scans. Figure 6 shows lunar irradiance has an annual oscillation. The oscillation, has larger impact than the lunar phase because the phase angles of scheduled lunar observations are mostly around −51 degrees as listed in Table 1. During the months of June to September, there are no lunar data collections, because the moon goes below the Earth limb [14]. This is the reason that some of the lunar collections do not require lunar roll maneuver to place the moon in the SV port. In these roll maneuver-free lunar collections, manual inspections of lunar images for dark offset selection are required to ensure correct offset removal for lunar radiance calculation.
Figure 5. Scheduled lunar data collection for VIIRS on 29 May 2015.
Remotesensing 08 00015 g005
Figure 6. Lunar irradiance from VIIRS lunar observations for all RSBs of VIIRS.
Remotesensing 08 00015 g006
Lunar irradiance models such as the MT model also provide predictions of lunar irradiance for corresponding Sun-Moon-Satellite geometry. Figure 7 shows derived MT model-based lunar irradiance profiles for all VIIRS RSBs. The pattern is very similar with a slight difference when compared to the lunar irradiance derived from VIIRS lunar observations. To visualize the difference, Figure 8 shows the mean and standard deviation of lunar irradiances derived from the MT model and VIIRS observation with regard to the center wavelengths of VIIRS RSBs. Basic shape of irradiance profile is similar to the solar spectrum, since moon reflects solar illumination modulated by the lunar surface reflectance properties. In most cases, MT model has slightly larger values than VIIRS observed values except for the I1 and I2 bands. These differences are mostly caused by the degradation of VIIRS RSB sensors with additional contribution from uncertainty in the lunar model. The S-NPP VIIRS is based on the Solar Spectrum (SOLSPEC) instrument flown on the Atmospheric Laboratory for Applications and Science (ATLAS) spacecraft [4,21], whereas MT model is based on SORCE. Consequently, the band based static biases are expected between the VIIRS observed radiance and the MT model results. The spectrally matched band pairs of I2/M7 responses are very consistent with VIIRS observation and MT model cases in Figure 6 and Figure 7. The symbols are mostly overlapped and the differences are hardly recognizable. However, I3/M10 has notable differences between them, which is cause by the calibration coefficient c 0 = 0 update [22].
Figure 7. Lunar irradiance calculated with Miller and Turner (MT) model at the center time of VIIRS scheduled lunar collections.
Remotesensing 08 00015 g007
Figure 8. Lifetime mean and 1 sigma range of the Miller and Turner (MT) model and observed lunar irradiance.
Remotesensing 08 00015 g008

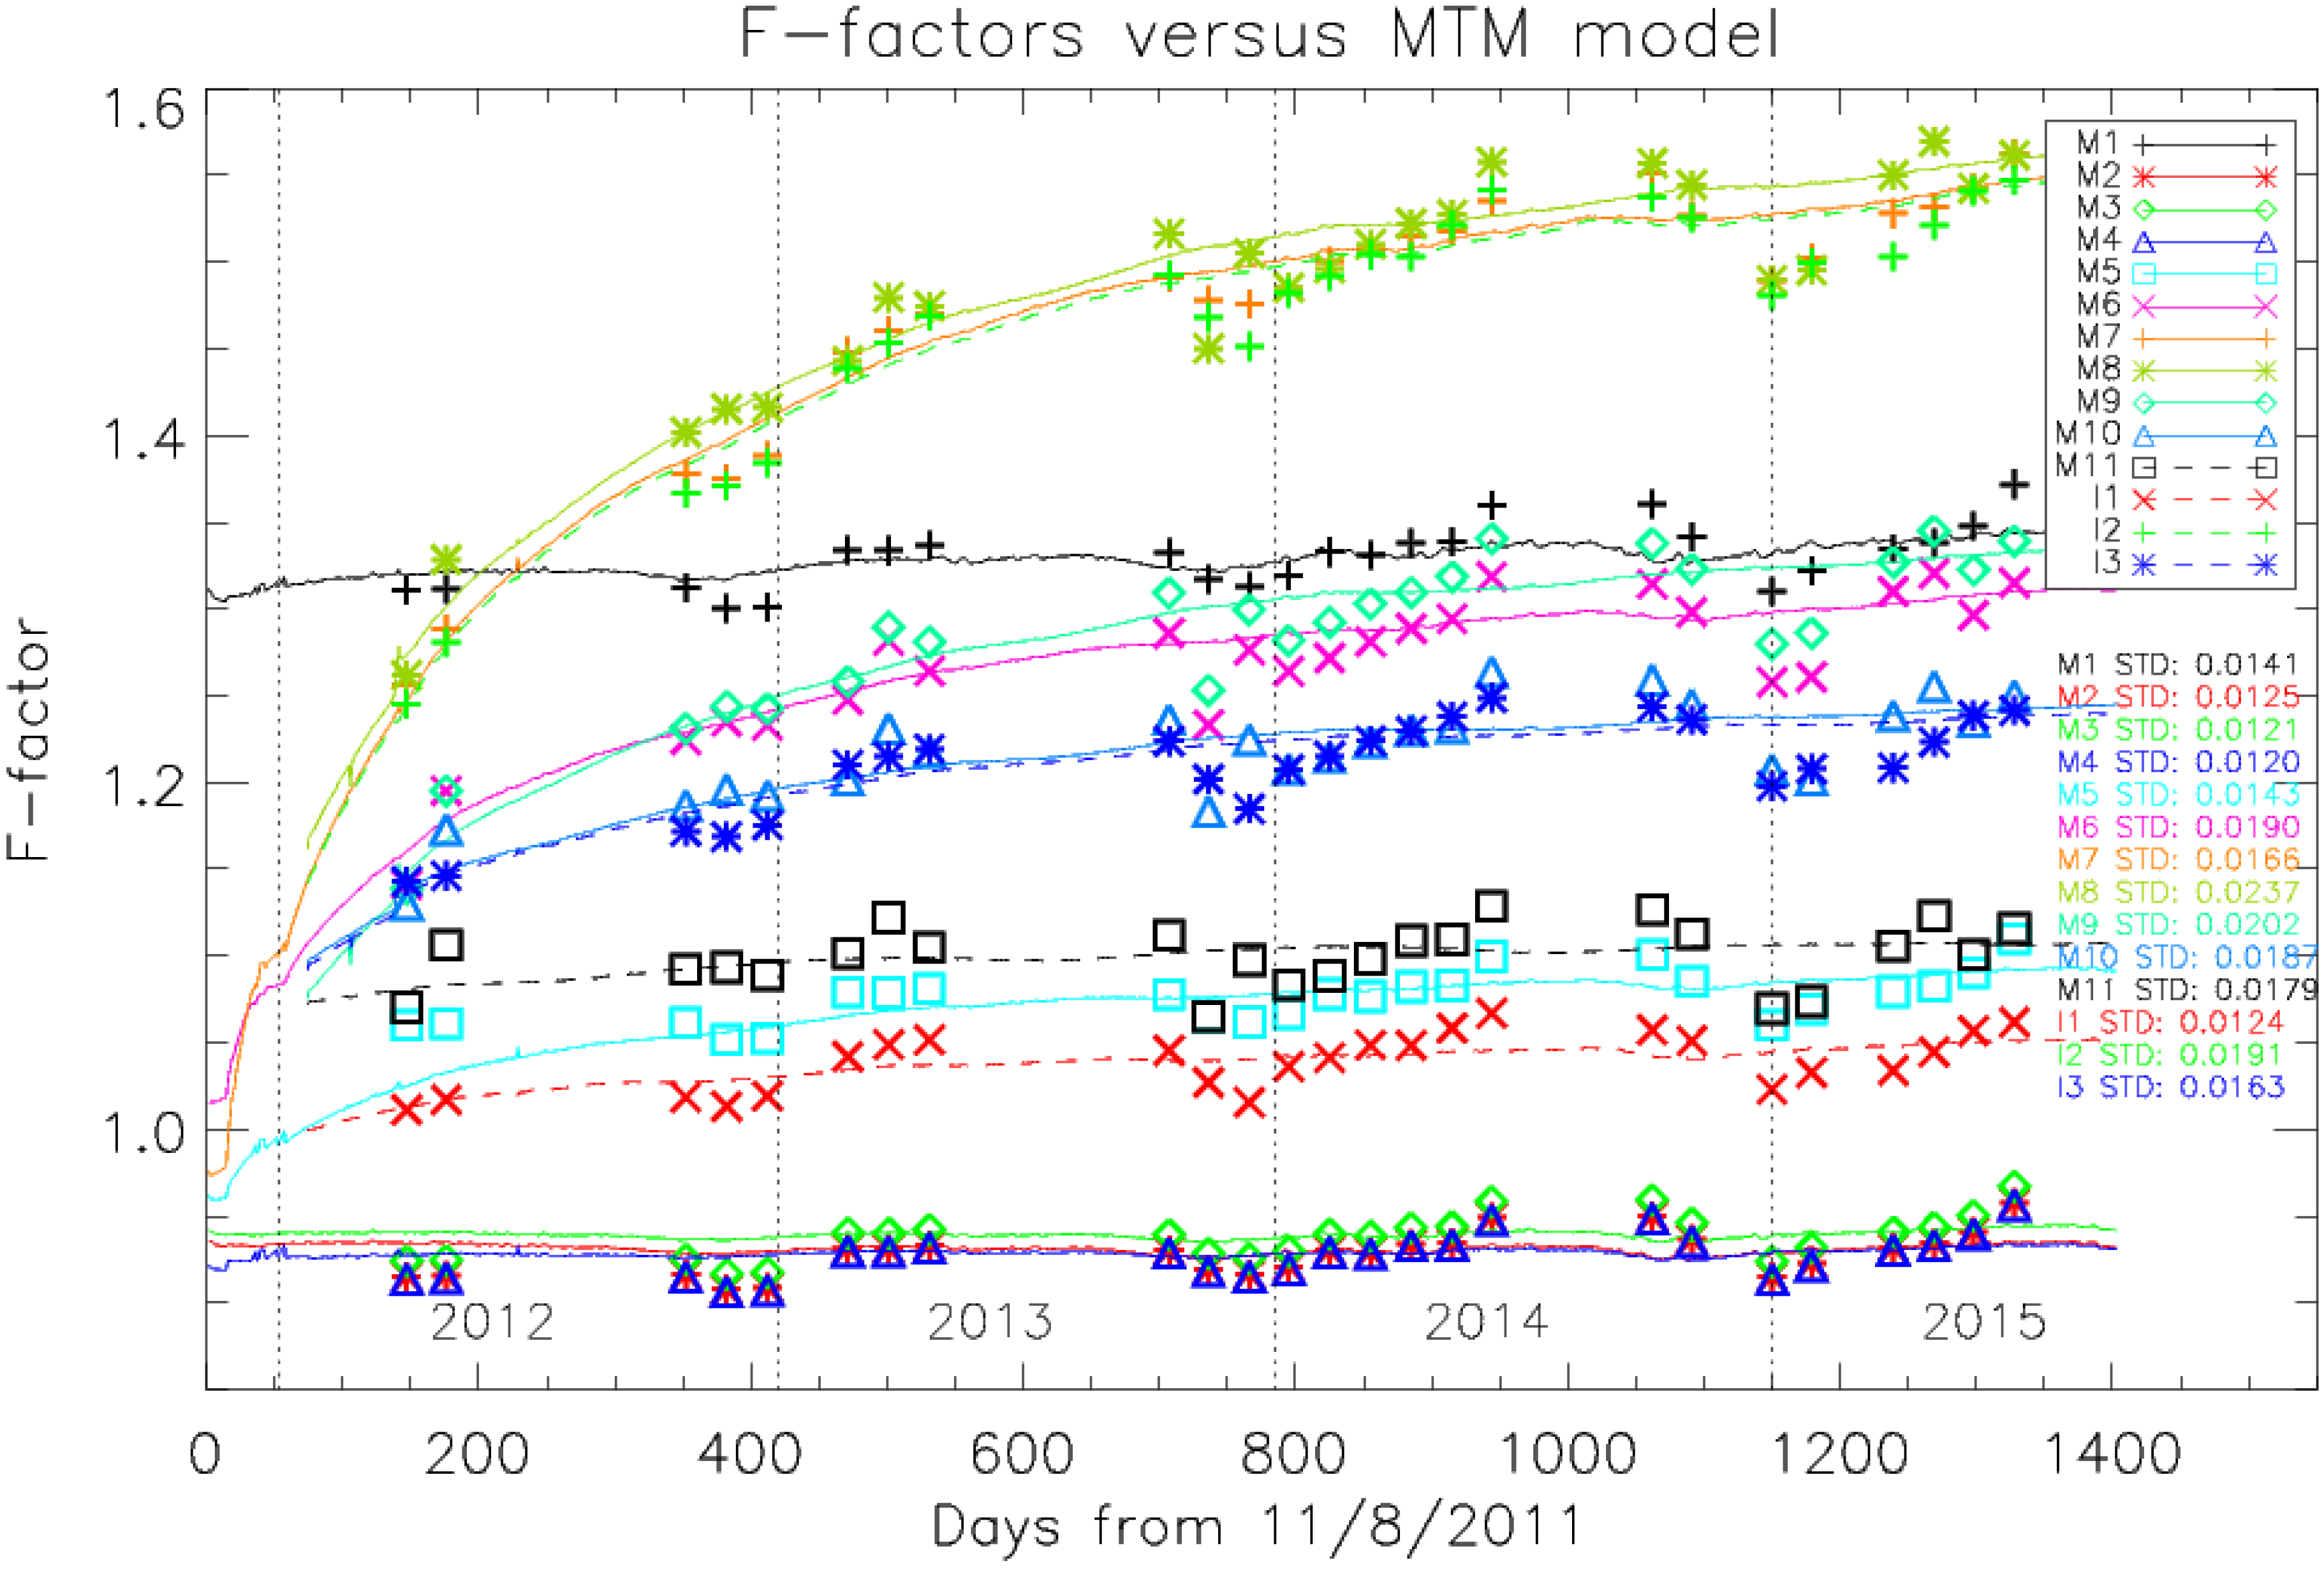
4.2. Lunar F-Factor versus SD F-Factor

The model predictions are often used to assist relative trending of sensor performance, because there are uncertainties in the absolute lunar irradiances [5,6]. Therefore, to compare the long term trending of the SD- and lunar F-factors, proper scaling factors need to be applied to the lunar F-factors. For all the VIIRS RSB bands, a best fitting scaling factor is calculated by minimizing the differences between lunar and SD based F-factors. The scaling factors are then applied to the lunar F-factors. The scaled lunar F-factors are over plotted in Figure 9 along with the SD F-factors. There are apparent annual oscillations in the lunar F-factor trending which is similar to the oscillations in the SD F-factor trending. Despite these oscillations, the lunar F-factors in general follow the lifetime trends of the SD F-factors. We further calculate the differences between the two F-factors by interpolating SD-F factors at the time of lunar data collection. The standard deviations of the difference range from 1.20 percent for band M4 to 2.37 percent for band M8. Figure 9 also provides all the standard deviation values on the right side of the figure. Based on these standard deviation values, the lifetime lunar F-factors track SD F-factors are within 2 percent for most bands and within 2.5 percent for bands M8 and M9.
Figure 9. Evolution of VIIRS SD and lunar F-factors for all VIIRS RSBs. The lunar F-factors have been applied with the best fitting scaling factors.
Remotesensing 08 00015 g009
The same F-factor method is applied to the ROLO mode based on EUMETSAT developed GIRO lunar irradiance tool. The ROLO based F-factors provide better agreements to the SD F-factors when they are compared to the MT model based results. Unfortunately, the detailed results cannot be included in this paper because the GIRO data policy has not yet been settled.

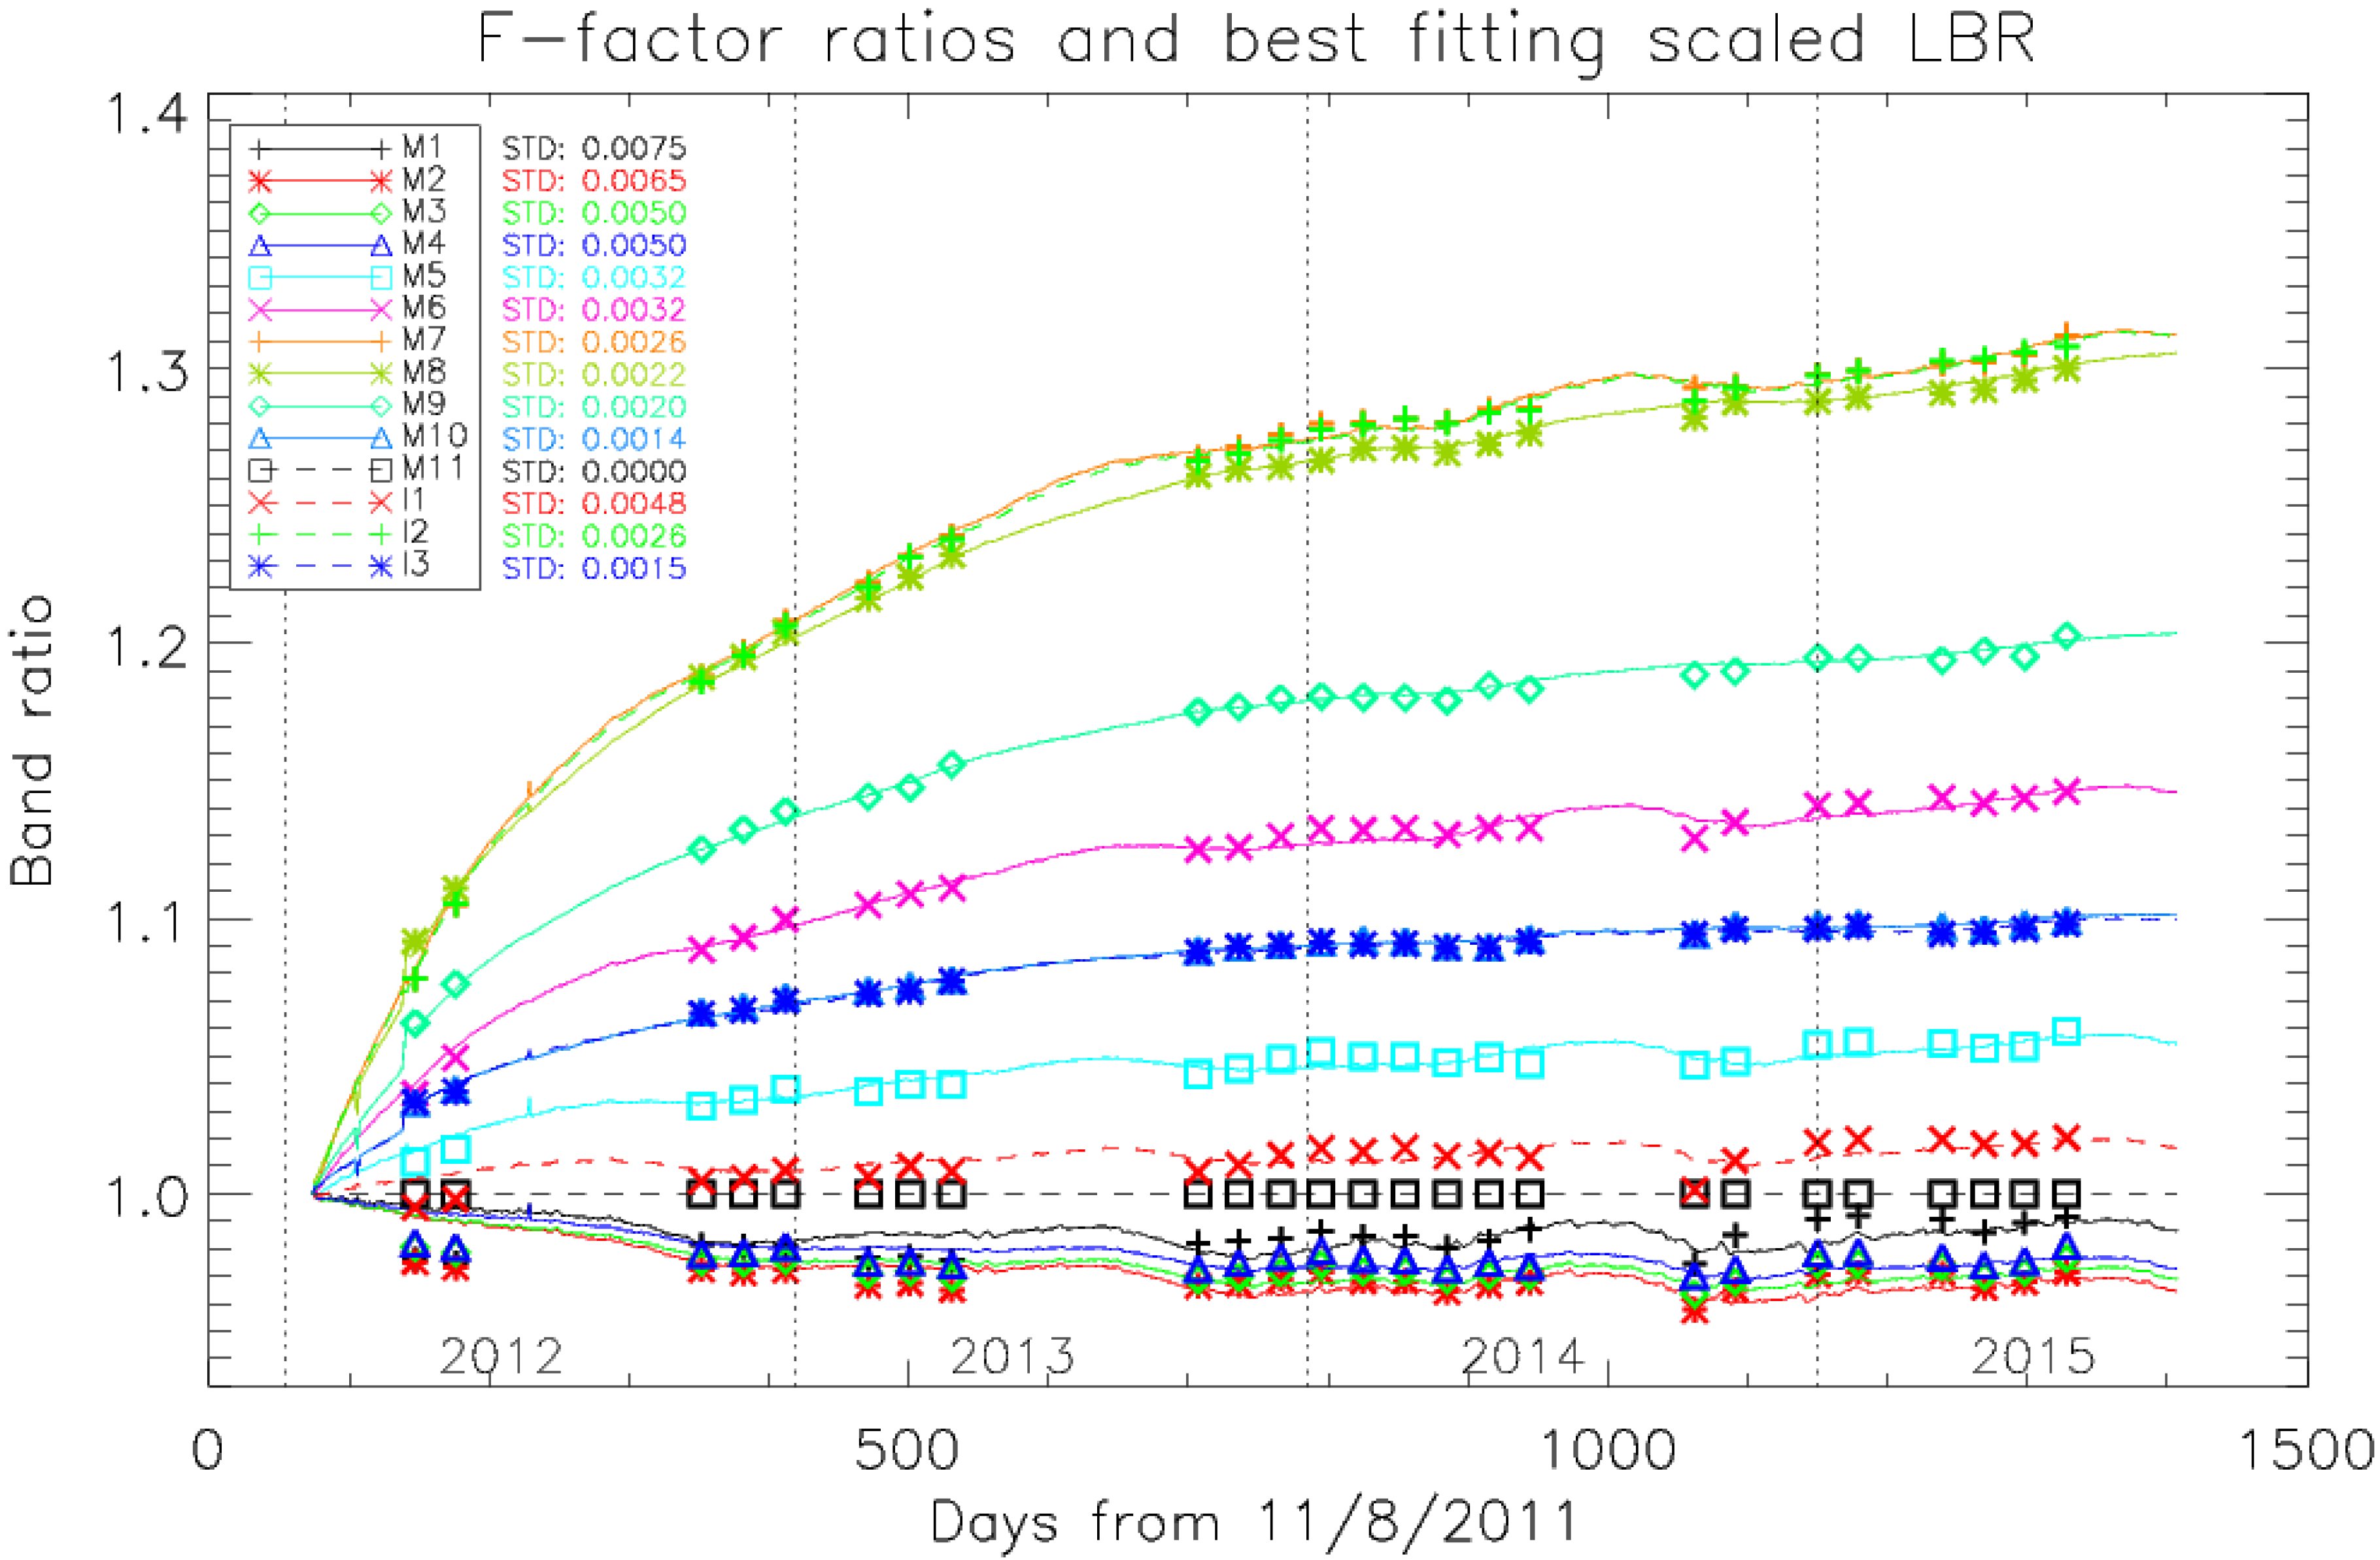
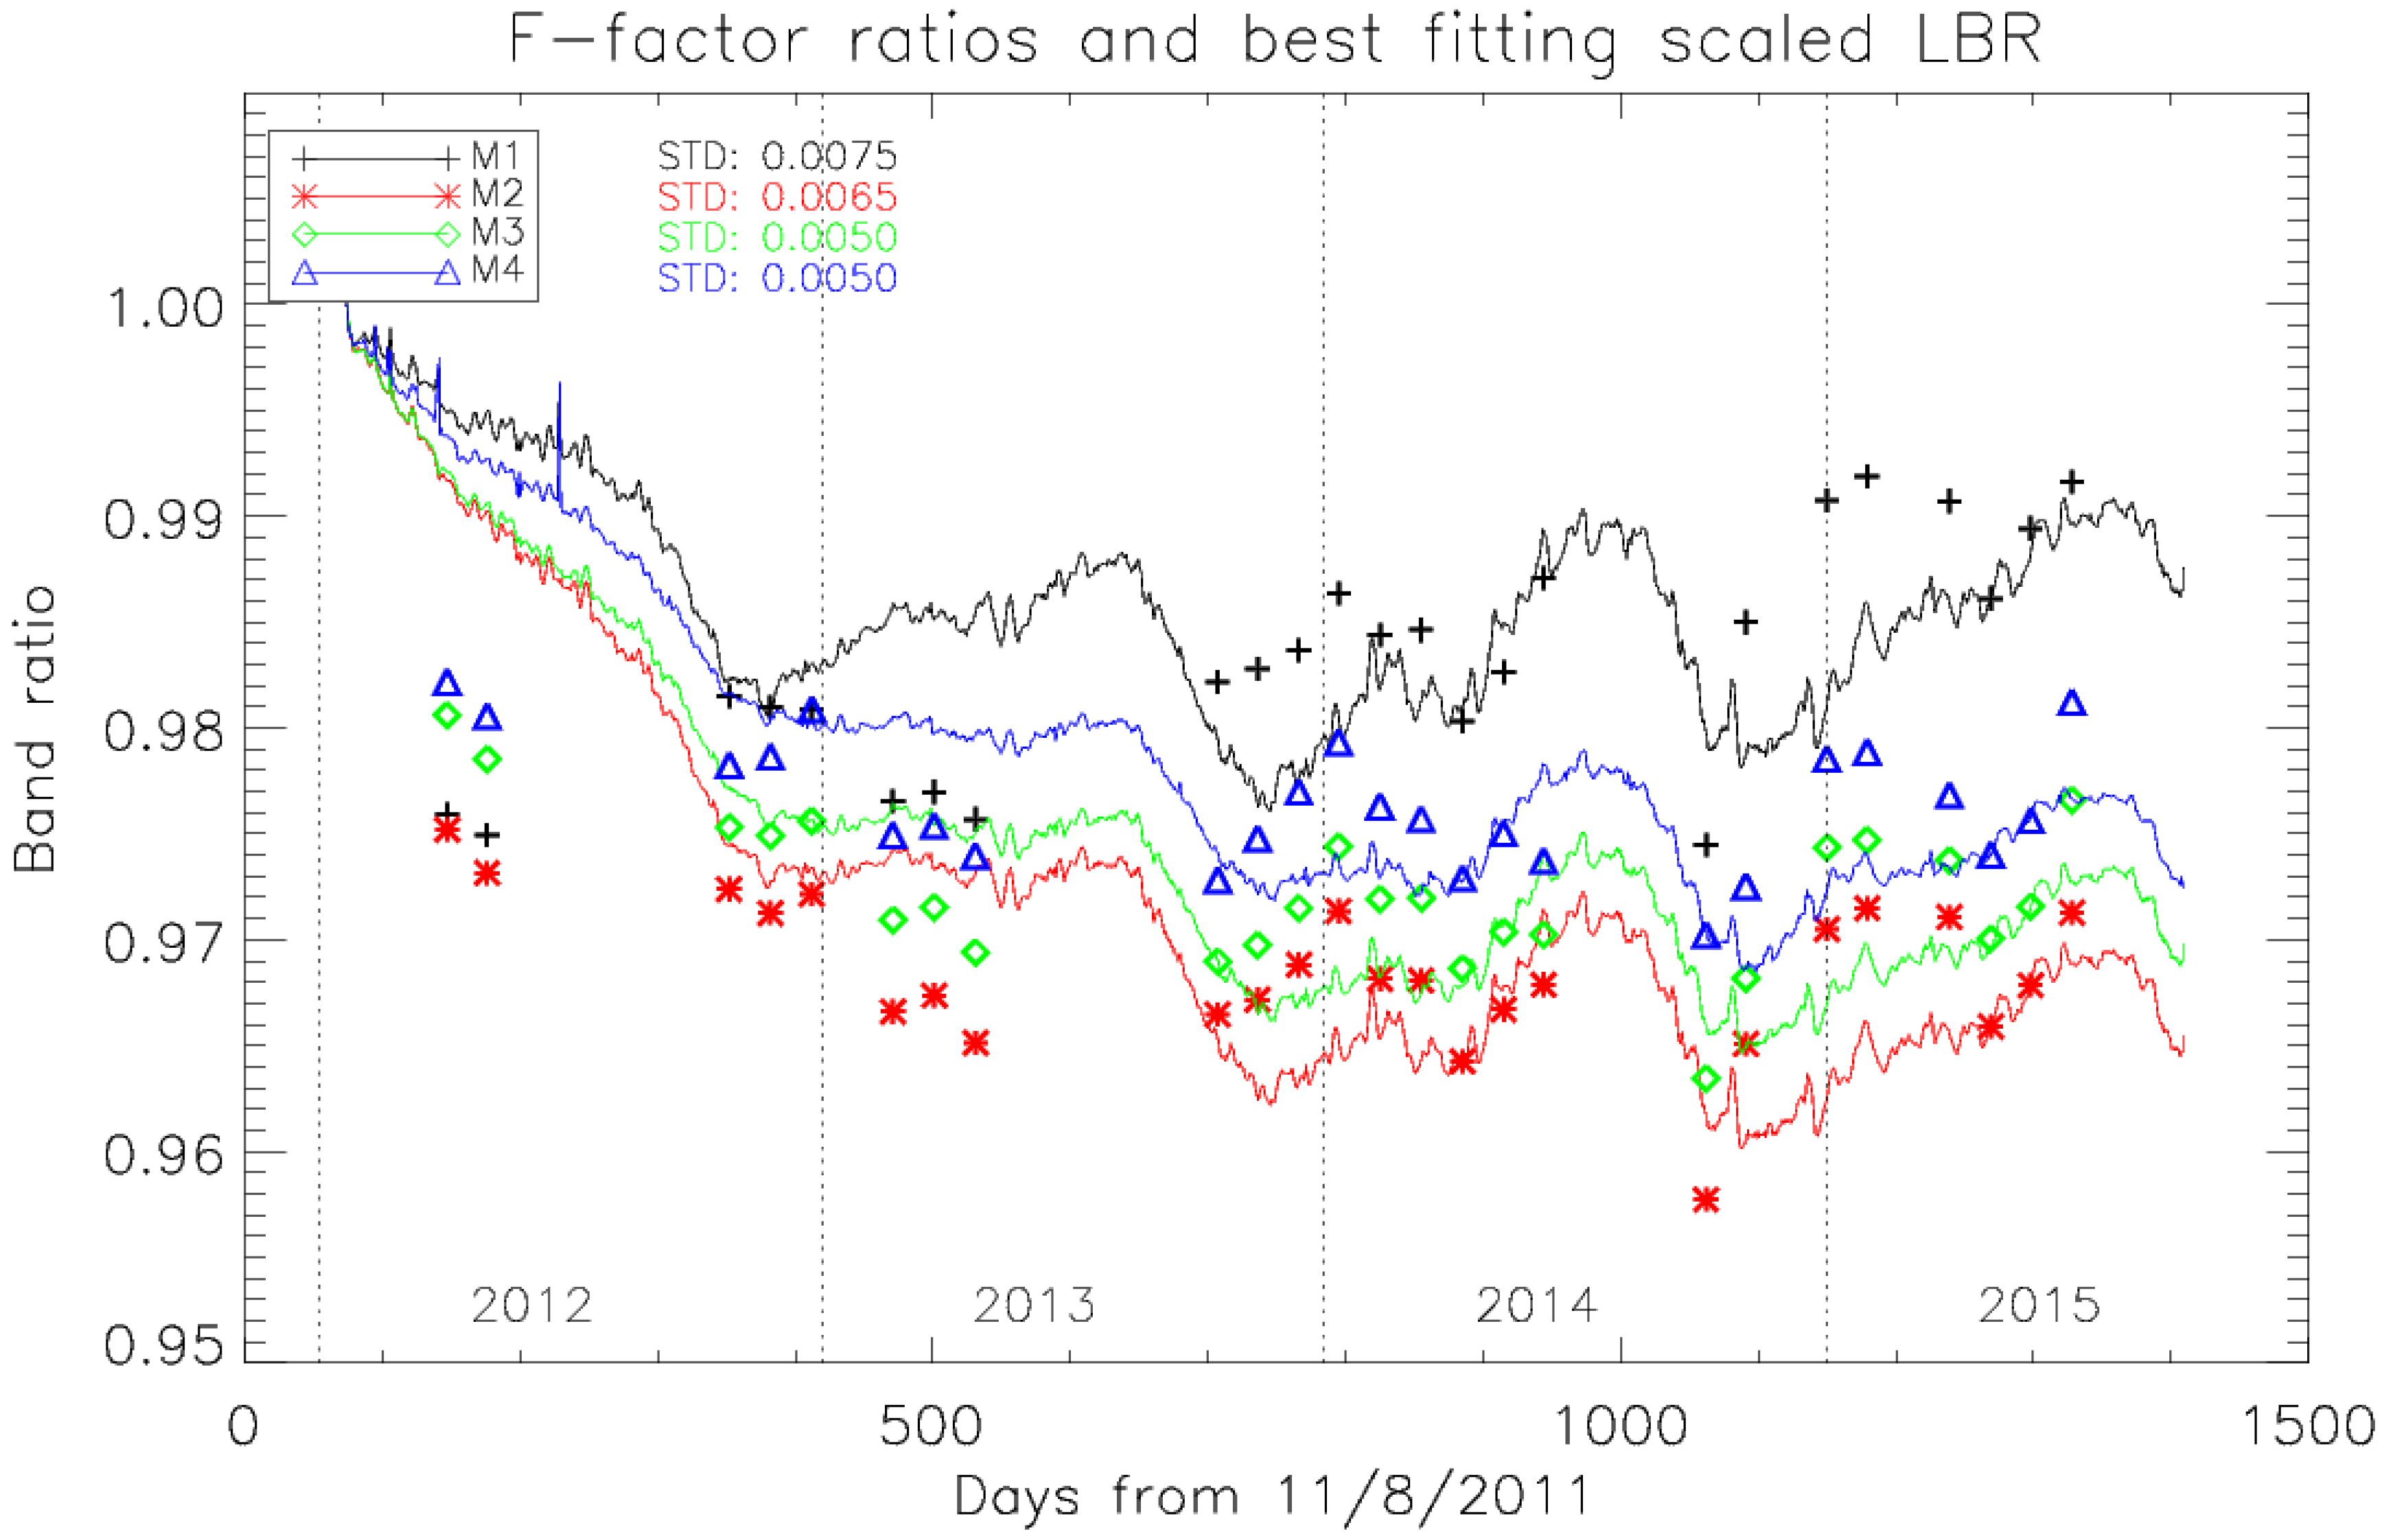
4.3. Lunar Band Ratio (LBR) and SD F-Factor Ratio Comparisons

Using Equation (9), LBRs are calculated and normalized with respect to the reference band M11. SD-based F-factors are similarly normalized by M11 in order to compare and validate the lifetime trends between the two independent calibration sources. Figure 10 shows the lifetime trend comparison between the SD-based F-factor ratio and LBR values. We note that the ratio of band M11 response is on the unity line since SD F-factors and LBR are referenced with this band. One advantage of using a ratio approach that can be seen is that the annual oscillations in the lunar model (Figure 9) mostly disappear. The SD F-factor ratios (lines in the figure) are normalized to the value on 18 January 2012 when the cryocooler door was opened and SWIR bands M8 and M11 data became available. A best fitting scaling factor to the LBRs is calculated and applied. The standard deviation values for the differences between LBRs and SD F-factor ratios are also shown next to the band legend on the left side in Figure 10. Compared to the differences between MT model-based and SD-based lunar F-factor, the standard deviations between band ratios are significantly reduced and they are all less than 1 percent level. These improvements in standard deviations are summarized in Table 2. Table 2 also shows the standard deviation differences (Δ%, third row) between the MT-based lunar F-factor and LBR in comparison to SD-based F factors. Significant improvements in comparison are observed with the LBR approach. From Table 2, the percent reduction in standard deviation can be seen to grow larger from 47 percent in the short wavelength M1 band to 92 percent in the longer wavelength M10.
Figure 10. F-factor ratios and lunar LBRs for all VIIRS RSBs. The SD based F-factors and LBR are both normalized to reference band M11.
Remotesensing 08 00015 g010
Table 2. Percent standard deviation improvements when comparing MT model-based lunar F-factor to LBR approaches. Both use SD-F factor as reference in calculating standard deviations.
BandM1M2M3M4M5M6M7M8M9M10M11I1I2I3
MT Model STD (%)1.411.251.211.201.431.901.662.372.021.871.791.241.911.63
LBR STD (%)0.750.650.500.590.320.320.260.220.200.14-0.480.260.15
STD Imp. Δ %47485951788384909092-618690

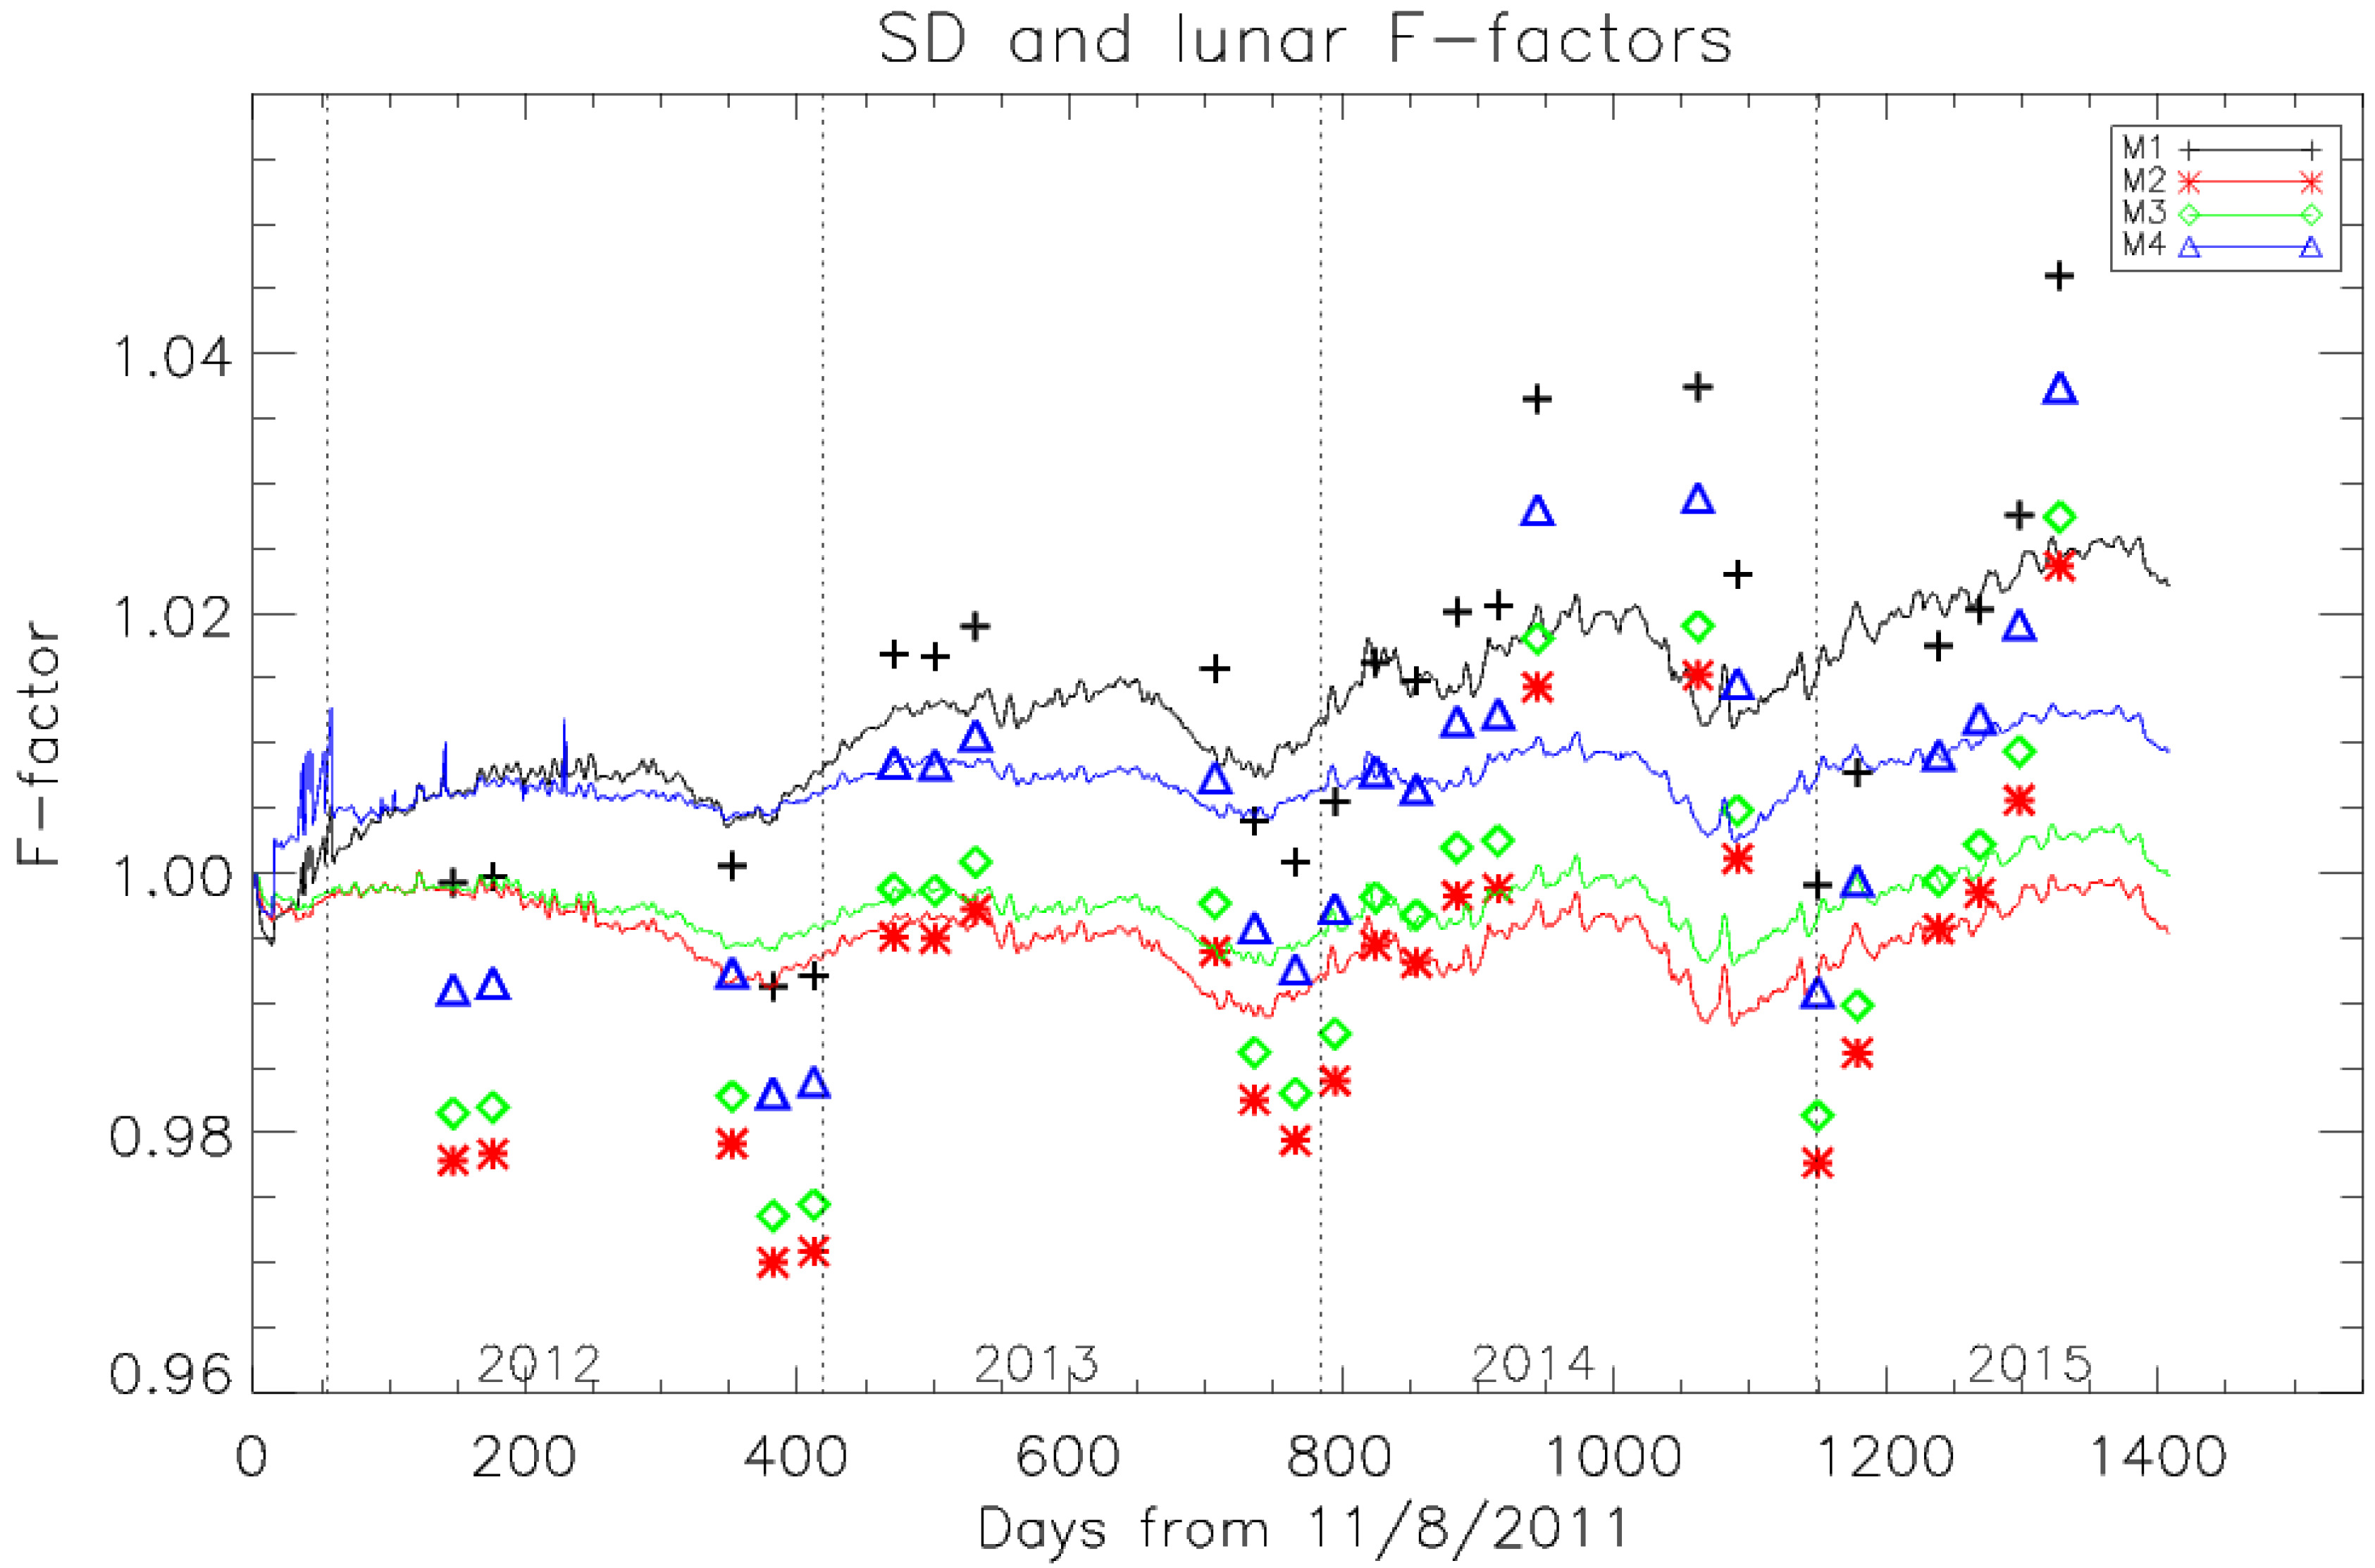
4.4. Lifetime Trends in Short Wavelength M1-M4 Bands

Recently, a hybrid method was developed combining advantages of ROLO based lunar calibration and SD based calibration [23]. Lunar calibration provides long-term baseline because it has monthly updates whereas SD calibration provides smooth and daily updates. In the hybrid method, the SD F-factors are modulated to match the lifetime lunar calibration trends in M1 to M4 only. Since SD degraded non-uniformly with respect to the incident angle for SDSM and RTA view direction, there was 0.1 percent per degree for detector 1 in band M1 wavelength [23]. With their hybrid approach, F-factor ratios were fitted to quadratic polynomials over time to correct the SD F-factors to the lifetime lunar calibration. To further analyze corresponding lifetime trends in band M1 to M4, Figure 11 shows MT model-based lunar and SD F-factors aligned with the best fitting scaling factor for each band. The lunar F-factors (denoted as symbols) have lifetime trend with positive slopes. They also have relatively larger annual oscillations compared to the SD F-factors. This lifetime drift can be caused by uncertainties in the MT lunar model with respect to geometry parameters.
Figure 11. Normalized SD and MT-based lunar F-factors in bands M1 to M4. The lunar F-factors have been scaled to the SD F-factors with the best fitting scaling factors.
Remotesensing 08 00015 g011
When F-factors are compared with to ROLO model versus SD, no lifetime time dependent discrepancies are observable. However there are similar annual oscillations to the MT model, the amplitudes of the oscillation are smaller and constant over the years. In addition, the ROLO based lunar F-factors and SD F-factors show excellent agreement between them especially in bands M1 to M4. To validate the lifetime drifts in the VIIRS short wavelengths, LBR results are further investigated in Figure 12.
Figure 12 shows LBR trending results without using a lunar irradiance model. Since the F-factor changes of the reference band M11 over time was faster in 2012, the normalized SD F-factor ratios in M1 to M4 show rapid drop. Once the reference band is stabilized after 2013, the SD F-factor ratios show stable trends with similar annual oscillations as in Figure 11. Comparing the LBR and F-factor ratios show that they are highly consistent with each other without any significant lifetime deviation in the short wavelength bands. The LBR and F-factor ratios agree to within 0.75 percent level of standard deviation for all M1–M4 spectral bands except for the first two LBR values in year 2012. Considering all the inter-comparison results from lunar irradiance model-based and model-free LBR methods, there are no direct evidences of lifetime calibration discrepancies (especially in short wavelength bands) between the SD and lunar based calibration.
Figure 12. Normalized SD and lunar F-factor ratios in all RSB bands zoomed in M1 to M4 range.
Remotesensing 08 00015 g012

5. Conclusions

The moon serves as a robust and independent on-orbit calibration source for the S-NPP VIIRS sensor without complications of atmospheric effects. In this paper, we presented two independent lunar data processing techniques for sensor radiometric performance trending. One is lunar irradiance model (MT model)-based lunar F-factor method and the other is the reference band-based LBR method. In the MT mode-based lunar F-factor method, we presented details of lunar irradiance calculation steps, including offset estimations, pixel radiance calculation, and effective moon solid angle calculation. The effective lunar solid angle formulation enables us to avoid calculation of complex and unclear over-sampling factors, which is the key factor for lunar calibrations. The MT model-based F-factors are compared to the SD F-factors. The lunar F-factors are within 2 percent standard deviation range for most spectral bands except for M8 and M9 bands, which is within 2.5 percent.
The Lunar Band Ratio (LBR), a simple band ratio method, is applied without using a lunar irradiance model. After the proper offset-removal and effective pixel aggregation; all lunar responses of RSBs are normalized to the reference band M11. The LBR comparison analysis reveals that all the bands consistently agree with the SD F-factor ratio within 1 percent level. The advantage of applying LBR for radiometric instrument performance trending is that it is simple to implement and does not depend on lunar irradiance model. This band ratio approach is not subject to the uncertainties included in the lunar model and factors out geometric dependences. One recognized limitation of the LBR method is that a stable reference band needs to be selected and it can only trend the relative radiometric stability.
This paper presented validations of the SD-based VIIRS lifetime radiometric performances using MT model-based lunar calibration and LBR. The two methods did not show evidences of lifetime differences between SD and lunar based calibrations. The MT model based results show that most of the RSB bands are within 2 percent standard deviation whereas LBR results provide sub percent accuracy especially in bands M1 to M4. The LBR can potentially be very useful to monitor and validate lifetime radiometric trends of on-orbit hyper- or multi-spectral imaging sensors, because it is conceptually simple to apply.
The two lunar calibration methods, MT model and LBR, will be added to the VIIRS ICVS website as independent validations of the current SD based calibration results. These two methods are also going to be applied to the next JPSS1 (J1) VIIRS as a part of radiometric calibration and validation plan.

Acknowledgments

Authors would like to thank Steven Miller for providing the MT lunar irradiance model, which is used for F-factor calculation. Thanks are extended to all NOAA ICVS and VIIRS SDR team members for the invaluable supports. Authors thank to Mitch Schull for his detailed review of the manuscript. The manuscript contents are solely the opinions of the authors and do not constitute a statement of policy, decision, or position on behalf of NOAA or the U.S. government. This work is funded by the NOAA JPSS program.

Author Contributions

Taeyoung Choi collected all the VIIRS lunar data, developed the processing code, performed the analysis, and wrote the manuscript. Xi Shao provided MT lunar irradiance model results and developed the effective lunar solid angle method. Changyong Cao suggested the LBR methodology and provided directions of the study. Fuzhong Weng supported the study and provided technical guidance.

Conflicts of Interest

The authors declare no conflict of interest.

References

  1. Schueler, C.; Clement, J.E.; Ardanuy, P.; Welsh, C.; DeLuccia, F.; Swenson, H. NPOESS VIIRS sensor design overview. Proc. SPIE 2013, 4483. [Google Scholar] [CrossRef]
  2. Cao, C.; Xiong, X.; Blonski, S.; Liu, Q.; Uprety, S.; Shao, X.; Bai, Y.; Weng, F. Suomi NPP VIIRS sensor data record verification, validation, and long-term performance monitoring. J. Geophys. Res. Atmos. 2013, 118. [Google Scholar] [CrossRef]
  3. Cao, C.; DeLuccia, F.; Xiong, X.; Wolfe, R.; Weng, F. Early on-orbit performance of the visible infrared imaging radiometer suite (VIIRS) onboard the suomi national polar-orbiting partnership (S-NPP) Satellite. IEEE Trans. Geosci. Remote Sens. 2014, 52, 1142–1156. [Google Scholar] [CrossRef]
  4. Baker, N.; Kilcoyne, H. Joint Polar Satellite System (JPSS) VIIRS Radiometric Calibration Algorithm Theoretical Basis Document (ATBD). Available online: http://jointmission.gsfc.nasa.gov/sciencedocs/2015-06/474-00027_ATBD-VIIRS-Radiometric-Calibration_C.pdf (accessed on 9 October 2015).
  5. Kieffer, H.H.; Stone, T.C. The spectral irradiance of the Moon. Astron. J. 2005, 129, 2887–2901. [Google Scholar] [CrossRef]
  6. Stone, T.C.; Kieffer, H.H. An absolute irradiance of the Moon for on-orbit calibration. Proc. SPIE 2002, 4814. [Google Scholar] [CrossRef]
  7. Miller, S.D.; Turner, R.E. A dynamic lunar spectral irradiance data set for NPOESS/VIIRS day/night band nighttime environmental applications. IEEE Trans. Geosci. Remote Sens. 2009, 47, 2316. [Google Scholar] [CrossRef]
  8. Stone, T.C.; Kieffer, H.H. Use of the Moon to support onorbit sensor calibration for climate change measurements. Proc. SPIE 2006, 6296. [Google Scholar] [CrossRef]
  9. Cao, C.; Vermote, E.; Xiong, X. Using AVHRR lunar observations for NDVI long-term climate change detection. J. Geophys. Res. 2009, 114. [Google Scholar] [CrossRef]
  10. The Land Long Term Data Record (LTDR) Webpage. Available online: http://ltdr.nascom.nasa.gov/ (accessed on 17 November 2015).
  11. The NOAA Integrated Calibration Validation System (ICVS) Webpage. Available online: http://www.star.nesdis.noaa.gov/icvs/status_NPP_VIIRS.php (accessed on 9 October 2015).
  12. Fulbright, J.P.; Lei, N.; McIntire, J.; Efremova, B.; Chen, X.; Xiong, X. Improving the characterization and performance of the Suomi-NPP VIIRS solar diffuser stability monitor. Proc. SPIE 2013, 8866. [Google Scholar] [CrossRef]
  13. Joint Polar Satellite System (JPSS) Webpage. Available online: http://jointmission.gsfc.nasa.gov/documents.html (accessed on 9 October 2015).
  14. Patt, F.S.; Eplee, R.E.; Barnes, R.A.; Meister, G.; Butler, J.J. Use of the moon as a calibration reference for NPP VIIRS. Proc. SPIE 2005, 5882. [Google Scholar] [CrossRef]
  15. Fulbright, J.P.; Wang, Z.; Xiong, X. Suomi-NPP VIIRS lunar radiometric calibration observations. Proc. SPIE 2014, 9218. [Google Scholar] [CrossRef]
  16. Shao, X.; Cao, C.; Uprety, S. Vicarious calibration of S-NPP/VIIRS day-night band. Proc. SPIE 2013, 8866. [Google Scholar] [CrossRef]
  17. Lunar Calibration Algorithm Work Area. Available online: https://gsics.nesdis.noaa.gov/wiki/Development/LunarWorkArea (accessed on 9 October 2015).
  18. DeLuccia, F.J. VIIRS reflective solar band (RSB) performance and uncertainty estimates. In Proceedings of Suomi NPP SDR Science and Products Review, College Park, MD, USA, 18–20 December 2013.
  19. Blonski, S.; Cao, C.; Shao, X.; Uprety, S. VIIRS reflective solar bands calibration changes and potential impacts on ocean color applications. Proc. SPIE 2014, 9111. [Google Scholar] [CrossRef]
  20. Xiong, X.; Sun, J.; Barnes, W. Intercomparison of On-Orbit Calibration Consistency between Terra and Aqua MODIS Reflective Solar Bands Using the Moon. IEEE Trans. Geosci. Remote Sens. 2008, 5, 778–782. [Google Scholar] [CrossRef]
  21. Thuillier, G.; Herse, M.; Labs, D.; Foujolos, T.; Peetermans, W.; Gillotay, D.; Simon, P.C.; Mandel, H. The Solar Spectral Irradiance from 200 to 2400 nm as Measured by the SOLSPEC Spectrometer from the ATLAS and EURECA Missions. Solar Phys. 2013, 214, 1–22. [Google Scholar] [CrossRef]
  22. Choi, T.; Sun, N.; Chen, W.; Cao, C.; Weng, F. S-NPP VIIRS significant events in 2014 monitored by NOAA integrated calibration validation system. In Proceedings of the NOAA STAR JPSS 2015 Annual Science Team Meeting, College Park, MD, USA, 24–28 August 2015.
  23. Sun, J.; Wang, M. VIIRS reflective solar bands calibration improvements with hybrid approach. In Proceedings of the NOAA STAR JPSS 2015 Annual Science Team Meeting, College Park, MD, USA, 24–28 August 2015.

