The Reprocessed Suomi NPP Satellite Observations
by
 , , , , , , , ,
Cheng-Zhi Zou
1,*, 
Lihang Zhou
2,
Lin Lin
3,
Ninghai Sun
4,
Yong Chen
4,
Lawrence E. Flynn
1,
Bin Zhang
3,
Changyong Cao
1,
Flavio Iturbide-Sanchez
1,
Trevor Beck
1,
Banghua Yan
1,
Satya Kalluri
1,
Yan Bai
3,
Slawomir Blonski
4,
Taeyoung Choi
4,
Murty Divakarla
5,
Yalong Gu
4,
Xianjun Hao
6,
Wei Li
3,
Ding Liang
4,
Jianguo Niu
5,
Xi Shao
3,
Larrabee Strow
7,
David C. Tobin
8,
Denis Tremblay
4,
Sirish Uprety
3,
Wenhui Wang
3,
Hui Xu
3,
Hu Yang
3 and
Mitchell D. Goldberg
2add
Show full author list
1
Center for Satellite Applications and Research, NOAA/NESDIS, College Park, MD 20740, USA
2
Joint Polar Satellite System, NOAA/NESDIS, Lanham, MD 20706, USA
3
ESSIC/CISESS, University of Maryland, College Park, MD 20740, USA
4
Global Science and Technology, College Park, MD 20740, USA
5
I. M. Systems Group, Inc., College Park, MD 20740, USA
6
Global Environment and Natural Resources Institute/Environmental Science and Technology Center, George Mason University, Fairfax, VA 22030, USA
7
Department of Physics, University of Maryland Baltimore County, Baltimore, MD 21250, USA
8
Space Science and Engineering Center, University of Wisconsin-Madison, Madison, WI 53715, USA
*
Author to whom correspondence should be addressed.
Remote Sens. 2020, 12(18), 2891; https://doi.org/10.3390/rs12182891
Submission received: 31 July 2020
/
Revised: 2 September 2020
/
Accepted: 3 September 2020
/
Published: 6 September 2020
(This article belongs to the Special Issue Satellite Data Application, Validation and Calibration for Atmospheric Observation)
Abstract
:The launch of the National Oceanic and Atmospheric Administration (NOAA)/ National Aeronautics and Space Administration (NASA) Suomi National Polar-orbiting Partnership (S-NPP) and its follow-on NOAA Joint Polar Satellite Systems (JPSS) satellites marks the beginning of a new era of operational satellite observations of the Earth and atmosphere for environmental applications with high spatial resolution and sampling rate. The S-NPP and JPSS are equipped with five instruments, each with advanced design in Earth sampling, including the Advanced Technology Microwave Sounder (ATMS), the Cross-track Infrared Sounder (CrIS), the Ozone Mapping and Profiler Suite (OMPS), the Visible Infrared Imaging Radiometer Suite (VIIRS), and the Clouds and the Earth’s Radiant Energy System (CERES). Among them, the ATMS is the new generation of microwave sounder measuring temperature profiles from the surface to the upper stratosphere and moisture profiles from the surface to the upper troposphere, while CrIS is the first of a series of advanced operational hyperspectral sounders providing more accurate atmospheric and moisture sounding observations with higher vertical resolution for weather and climate applications. The OMPS instrument measures solar backscattered ultraviolet to provide information on the concentrations of ozone in the Earth’s atmosphere, and VIIRS provides global observations of a variety of essential environmental variables over the land, atmosphere, cryosphere, and ocean with visible and infrared imagery. The CERES instrument measures the solar energy reflected by the Earth, the longwave radiative emission from the Earth, and the role of cloud processes in the Earth’s energy balance. Presently, observations from several instruments on S-NPP and JPSS-1 (re-named NOAA-20 after launch) provide near real-time monitoring of the environmental changes and improve weather forecasting by assimilation into numerical weather prediction models. Envisioning the need for consistencies in satellite retrievals, improving climate reanalyses, development of climate data records, and improving numerical weather forecasting, the NOAA/Center for Satellite Applications and Research (STAR) has been reprocessing the S-NPP observations for ATMS, CrIS, OMPS, and VIIRS through their life cycle. This article provides a summary of the instrument observing principles, data characteristics, reprocessing approaches, calibration algorithms, and validation results of the reprocessed sensor data records. The reprocessing generated consistent Level-1 sensor data records using unified and consistent calibration algorithms for each instrument that removed artificial jumps in data owing to operational changes, instrument anomalies, contaminations by anomaly views of the environment or spacecraft, and other causes. The reprocessed sensor data records were compared with and validated against other observations for a consistency check whenever such data were available. The reprocessed data will be archived in the NOAA data center with the same format as the operational data and technical support for data requests. Such a reprocessing is expected to improve the efficiency of the use of the S-NPP and JPSS satellite data and the accuracy of the observed essential environmental variables through either consistent satellite retrievals or use of the reprocessed data in numerical data assimilations.
1. Introduction
Satellite observations have been playing a vital role in improving numerical weather prediction (NWP) during the past few decades. Direct use of the satellite radiance data in NWPs was demonstrated to considerably improve NWP forecasting skills in earlier data assimilation experiments [1,2]. After the initial success, the assimilation of satellite data in NWP models has been one of the major drivers in the continued improvement of the NWP forecasting skills over the last twenty years [3,4]. Satellite data assimilation has now become a standard practice in NWP forecasting in nearly all advanced weather forecasting operational centers in the world. Currently, more than 90% of the assimilated data for NWP are derived from satellite observations.
Due to its long-term continuity, satellite measurements have also been widely used to investigate global climate changes during the last four decades. Satellite climate data records (CDRs) have been the primary source for determining global climate trends in many essential climate variables. Such climate variables include, but are not limited to, global atmospheric temperatures from the mid-troposphere [5,6,7,8,9,10,11] to the upper stratosphere [12,13,14,15,16,17], sea ice concentration [18,19], and sea-level rise [20,21,22,23,24,25], etc. In addition, satellite observations are key input data sources in the development of climate reanalysis systems [26,27,28,29,30], which are broadly used for investigation of both the global climate change attribution and evolution of synoptic weather systems.
Current applications of satellite data in both NWP forecasting and climate reanalyses often include those produced based on operational calibration. An operational calibration generates satellite radiance data in level-1b swath format with necessary quality control procedure and provides all other necessary instrument telemetry information needed for instrument calibration. Such telemetry information includes, but is not limited to, raw counts data corresponding to the earth view, cold space view, and warm target blackbody view; instrument temperatures and blackbody temperatures, Earth view angles, spacecraft orbital parameters, and geophysical locations of views, etc. This calibration is, in general, conducted at satellite operational agencies, and can change frequently due to operational requirements on data latency, improvements and optimization of calibration algorithms, changes and improvements of quality control procedures, etc. As an example, the National Oceanic and Atmospheric Administration (NOAA) operational calibration algorithms for generating instrument sensor data records (SDRs or radiances) for the Suomi National Polar-orbiting Partnership (S-NPP) satellite typically proceed through three stages: beta, provisional, and validated maturity, with many updates of algorithms and calibration coefficients taking place between them [31,32,33]. Such changes can cause inconsistency in the level-1b satellite radiance data records and lead to radiance or brightness temperature (BT) bias jumps and drifts over time when compared with other observations or numerical model simulations.
Life-cycle satellite reprocessing can minimize or remove the inconsistency and improve the calibration accuracy by using unified and consistent calibration algorithms across the reprocessing period [34]. Unlike operational calibration and processing, reprocessing does not have a strict latency requirement; as a result, more efforts can be devoted to improving calibration algorithms and data consistency and accuracy. Such efforts are particularly beneficial to user applications that require long-term consistency of data products for reliable determination of climate trends observed with the data products. Reprocessing and recalibration result in consistent radiance fundamental climate data records (FCDRs) that are building blocks for CDRs. It is envisioned that reprocessing using the best science and most matured calibration algorithms provides the best FCDR inputs for essential climate variables and the development of critical CDRs [35]. In an end-to-end approach, FCDRs and CDRs can be generated simultaneously in a data production stream [9,10]. Examples of reprocessing included those for instrument observations onboard historical NOAA, National Aeronautics and Space Administration (NASA), the European Organization for the Exploitation of Meteorological Satellites (EUMETSAT), and the Defense Meteorological Satellite Program (DMSP) satellite series for the development of CDRs. The historical NOAA Polar-orbiting Operational Environmental Satellites (POES) carried the Advanced Very High-Resolution Radiometer (AVHRR), the Television Infrared Observation Satellite (TIROS) Operational Vertical Sounder (TOVS) suite of instruments, the Advanced Microwave Sounding Unit-A (AMSU-A), as well as other instruments. The TOVS suite of instruments consisted of three sensors: the High Resolution Infrared Radiation Sounder (HIRS), the Microwave Sounding Unit (MSU), and the Stratospheric Sounding Unit (SSU). The EUMETSAT MetOp series also carry AMSU-A and AVHRR. Together with AMSU-A, the TOVS instruments had been providing critical atmospheric temperature and moisture sounding observations globally for over four decades. Reprocessing and recalibration of these instruments had resulted in consistent FCDRs which were further used to develop the tropospheric and lower-stratospheric temperature CDRs from the MSU and AMSU-A observations [9,10], the high-quality middle to upper stratospheric temperature time series from the SSU observations [14], and the cloud parameter CDRs from the HIRS observations [36,37]. Reprocessing of AVHRR helped the generation of several long-term essential climate variables for climate change monitoring, including the total cloud amount, the Earth’s radiation budget at the top of the atmosphere, the outgoing longwave radiation, and the absorbed solar radiation by the Earth–Atmosphere system, etc. [38,39]. As a long-lasting effort, the reprocessing for the DMSP Special Sensor Microwave Imager (SSM/I) was conducted many times over a period spanning two decades [40]. This effort was the basis for the development of a bundle of long-term essential climate variables consisting of surface wind speed over the ocean, rain rate, clouds, and total precipitable water, etc. [41,42].
In addition to CDR development, reprocessing contributes to the improved reanalysis products that merge data from many different observations through data assimilation to attain global climate analyses. As an example, recalibrated and consistent MSU observations developed by Zou et al. [9] were assimilated into NOAA Climate Forecast System Reanalysis (CFSR) and NASA’s Modern-Era Retrospective Analysis for Research and Applications (MERRA) [26,27]. This assimilation improved the temporal consistency in bias correction patterns [27,43] and may have helped MERRA to produce a more realistic stratospheric temperature response following the eruption of Mount Pinatubo [44].
The goal of this article is to describe the reprocessing of instrument observations from S-NPP during the period from near its launch time to 8 March 2017 and to provide a perspective on reprocessing of its follow-on NOAA Joint Polar Satellite Systems (JPSS) satellites. The JPSS is the U.S. new generation polar-orbiting operational environmental satellite series making Earth and atmosphere observations for weather and climate applications with high spatial resolution and sampling rate. The S-NPP and JPSS-1 (renamed as NOAA-20 after launch) satellites were launched on 28 October 2011 and 18 November 2017, respectively, into afternoon orbits with a local time ascending node (LTAN) at 1:30 p.m. S-NPP is JPSS’s experimental program which became NOAA’s prime afternoon satellite since 1 May 2014. Three additional JPSS satellites are planned to be launched onto the same afternoon orbit every five years starting from 2017. These satellites constitute a continuous observation of the global environment for the next two decades and are a heritage of the past instrument observations.
The S-NPP and JPSS are equipped with five instruments, each with advanced design in Earth samplings, including the Advanced Technology Microwave Sounder (ATMS), Cross-track Infrared Sounder (CrIS), Ozone Mapping and Profiler Suite (OMPS), Visible Infrared Imaging Radiometer Suite (VIIRS), and Clouds and the Earth’s Radiant Energy System (CERES). Among them, the ATMS is the new generation of microwave sounder measuring temperature and moisture profiles in the atmosphere, while CrIS is an advanced hyperspectral sounder providing more accurate and detailed atmospheric and moisture sounding observations for weather and climate applications. The OMPS instrument measures solar backscattered ultraviolet to provide information on the concentrations of ozone in the Earth’s atmosphere, and the VIIRS provides global observations of a variety of essential environmental variables over the land, atmosphere, cryosphere, and ocean with visible and infrared imagery. Finally, the CERES measures the solar energy reflected by the Earth and the longwave radiation from the Earth, providing necessary information to understand the role of cloud processes in the Earth’s energy balance.
Currently, observations from these instruments on S-NPP and NOAA-20 provide near real-time monitoring of the environmental changes and improve weather forecasting by assimilation into numerical weather prediction models. To facilitate user applications in further improvement of weather prediction and particularly climate change investigation, the NOAA/Center for Satellite Applications and Research (STAR) has been reprocessing the ATMS, CrIS, OMPS, and VIIRS onboard S-NPP using unified calibration algorithms that are based on optimal operational calibration. As a first version, the reprocessing used the S-NPP NOAA operational calibration algorithms and coefficients baselined on 8 March 2017, when all planned S-NPP post-launch updates were completed and in operation. The reprocessing period was from a starting date close to the S-NPP launch time, depending on when the instruments were turned on, to 8 March 2017 for most instruments. The reprocessing generates improved and consistent sensor data records when validated against other types of instrument observations or numerical simulations. This article summarizes this reprocessing procedure and validation results for the S-NPP, focusing on consistency check and stability assessment. This summary is organized instrument by instrument in the following sections. The next section is dedicated to ATMS, followed by CrIS, OMPS, and VIIRS. Each section consists of a description of instrument observation and calibration principles, calibration algorithms, reprocessing procedure, and validation results. Section 6 provides a conclusion and perspective to the JPSS reprocessing.
2. ATMS Reprocessing
2.1. The Instrument and Calibration Principles
The ATMS is a total power cross-track radiometer with 22 channels, combining all the channels of the heritage sensors, including AMSU-A and AMSU-B/Microwave Humidity Sounder (MHS), into a single sensor that spans from 23 to 183 GHz (Table 1). Such a design offers significant advantage in the reduction in instrument weight and the use of power. Among the channels, 1–2 and 16–17 are the window channels providing information on the atmospheric clouds, total precipitable water, surface emissivity, and water vapor concentration near the surface. Channels 3–15, often called the oxygen channels, use atmospheric oxygen absorption bands for temperature soundings from the surface to the upper stratosphere at approximately 1 hPa. The remaining channels, 18–22, use water vapor absorption lines at 183 GHz for humidity soundings from the lower to the upper troposphere at about 200 hPa. The ATMS channel frequencies are the same as those of AMSU-A and AMSU-B/MHS for most channels except for the addition of temperature-sounding channel 4 (51.74 GHz) and two water vapor channels at 183 GHz (see Table 1).
The ATMS has two receiving antennas—one serving channels 1–15 and the other serving channels 16–22. ATMS scans the Earth within the range of 52.725° on each side of the nadir direction with an angular sampling interval of 1.11°, providing 96 Earth observations in a scan line with a swath width about 2600 km. Each of the 96 Earth samples takes about 18 milliseconds integration time. The beam width of the scans is 5.2° for channels 1–2, 2.2° for channels 3–16, and 1.1° for channels 17–22. This gives a ground nadir field of view (FOV) resolution of 75 km for channels 1–2, 32 km for channels 3–16, and 16 km for channels 17–22 for the S-NPP satellite orbital height of 829 km above the Earth.
When scanning the Earth, the signals received by the antennas are processed by the instrument and output as digital counts. These digital counts are then converted to the Earth radiances or brightness temperatures through an in-flight calibration system and instrument transfer function. Similar to its predecessor, AMSU-A, ATMS calibration relies on two calibration targets as end-point references: a cosmic space cold target and an onboard blackbody warm target. The cold space has a temperature of 2.73 K, and the warm target temperature is measured by platinum resistance thermometers (PRTs) embedded in the blackbody target. In each scan cycle, the instrument looks at these two targets, as well as the Earth, and the signals from these looks are recorded as digital counts. For linear transfer function, the Earth scene brightness temperature is completely determined by the two reference points that have known temperatures in a linear interpolation between the two targets and the Earth views.
In reality, however, the transfer function is slightly nonlinear. This nonlinearity is often assumed to be quadratically related to the Earth scene counts. The magnitude of the quadratic nonlinearity is characterized by a so-called nonlinear calibration coefficient and it was determined using pre-launch thermal vacuum test data in operational calibration [45]. Such a calibration system allows most of the system losses and instrument defects to be removed, since the calibration target views involve the same optical and electrical signal paths as the Earth scene views. Of interest, the nonlinear calibration coefficient can also be obtained in post-launch recalibration efforts by using post-launch simultaneous nadir overpass (SNO) matchups. For instance, optimal nonlinear calibration coefficients were obtained for the MSU and AMSU-A instruments using SNOs which removed or minimized time-varying biases related to instrument temperature variations [9,10].
2.2. Consistency and Stability of Reprocessed ATMS Data
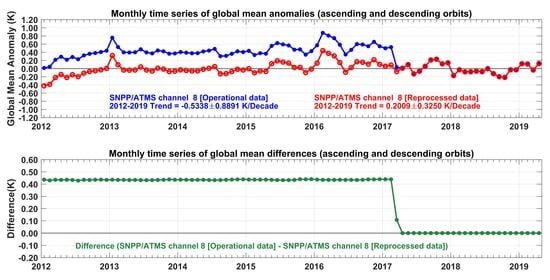
Operational calibration algorithm and procedure have been described in detail in Weng et al. [45] and relevant references within it. This calibration generates the operational level-1 swath radiances that are broadly used in NWP data assimilations to improve NWP weather forecast and for climate reanalyses. However, the operational calibration has gone through a series of updates that have caused inconsistencies in time series. These included the update of processing calibration coefficients on 19 April 2012 at a post-launch instrument evaluation time after their initial implementation at the S-NPP launch time on 28 October 2011; the update of lunar intrusion correction on 20 February 2014; a change of calibration algorithm on 8 March 2017. The last update involved calibration algorithm changes from using the transfer function in its brightness-temperature form before to using the same transfer function but in its radiance form after 8 March 2017, and a fix of a sign bug in expressing the nonlinear term in the calibration equation. The change from brightness temperature to radiance forms in using the transfer function resulted in a better handling of and more accurate bias corrections in the cold space views owing to antenna emission [46]. These calibration changes caused large bias jumps in the brightness temperature time series before and after 8 March 2017 (Figure 1). Other updates had negligible effects on the consistency of time series when compared to the reprocessed time series (Figure 1).
The ATMS life cycle reprocessing used a fixed calibration algorithm taken from the operational calibration after the update on 8 March 2017. The fact that the reprocessed data agree exactly with those of the operational calibration after 8 March 2017 in Figure 1 demonstrates that the former dataset has a calibration accuracy the same as the latter. To examine the consistency and stability of the reprocessed radiance data, the same approach as proposed in Zou et al. [47] is used here, in which the ATMS observations are compared to the AMSU-A observations onboard the NASA’s Aqua satellite. AMSU-A has the same channel frequencies as the ATMS (Table 1) for most temperature sounding channels so they observe the same layers of the atmospheric temperature. The Aqua satellite was launched on 4 May 2002 and its orbit has been fixed at close to 1:30 pm for its LTAN throughout its operation. In assessing the stability of historical microwave sounders, changes in diurnal sampling over time and calibration drift have been the main source of uncertainties when satellite orbits drift [47]. However, the similar overpass timing for S-NPP and Aqua in stable orbits naturally removes most of the diurnal differences between them, offering a great advantage in assessing consistency and stability between comparing instruments. In Zou et al. [47], a direct comparison of temperature anomalies between the two instruments shows little or no relative calibration drift for most channels. By comparing with Aqua AMSU-A, Zou et al. [47] suggest that the reprocessed S-NPP/ATMS instruments have achieved absolute radiometric stability in the measured atmospheric temperatures within 0.004 K per year for the time period between 2012 and 2018 for all analyzed channels. A similar comparison is shown in Figure 2 for the S-NPP/ATMS channel 8 and Aqua/AMSU-A channel 7 during the period 2012–2019. Trend differences between the two example channels are within 0.003 K/Year, slightly below the required stability of 0.004 K/Year for the temperature soundings for climate trend studies [48]. Similar results are also obtained for other channels when the quality of Aqua data is good enough for the comparison.
The consistency and high radiometric stability in the reprocessed ATMS data have a broad impact on the climate trend observations from the satellite microwave sounders. Such features allow the climate trends to be inferred directly from the reprocessed ATMS observations with high confidence. With consistency and high radiometric stability, the reprocessed ATMS data could also be used as a reference when developing merged temperature time series from microwave sounders onboard multiple satellites [47]. Merged and harmonized satellite temperature products were developed by different research groups [5,6,7,8,9,10]. However, differences remain in the climate trend estimates between these research groups for the same satellite products owing to differences in bias correction algorithms applied in removing diurnal sampling drift or calibration drift. In this aspect, the stable ATMS observations can help in identifying potential drifts in the harmonized satellite temperature records and improve their accuracy by serving as a reference in developing algorithms for corrections of diurnal sampling and calibration-drifting errors.
The reprocessed ATMS data could also help resolve debates on observed differences in climate trends between different types of instruments and climate reanalyses. Radiosonde observations had been homogenized and extensively used for detecting atmospheric temperature climate trends [49,50,51,52,53,54,55]. Disagreement exists in climate trend estimates between the satellite and radiosonde observations [56,57]. By comparing with the stable ATMS observations, biases and their drifts over time in the radiosonde observations could be identified, which would, in turn, help in developing more accurate radiosonde data records for climate trend detection. Similarly, the Global Positioning System (GPS) Radio Occultation (RO) observations had been used for temperature trend investigations, but harmonized satellite data products of earlier versions showed large trend differences relative to the GPS-RO observations for the lower-stratospheric layer [58,59]. Comparisons between GPS-RO and the reprocessed stable ATMS observations could be helpful in identifying drift, if any, in the GPS-RO observations, or conversely, demonstrating their agreement in climate trend detection [60].
3. CrIS Reprocessing
3.1. The Instrument and Calibration Principles
The CrIS instrument is a Fourier transform spectrometer, providing double-sided interferogram measurements in which an interference pattern is produced when the incoming radiation passes through the interferometer. The optical and mechanical design of this instrument and the principles for interferogram data generation are described in detail in Han et al. [61] and the JPSS CrIS SDR Algorithm Theoretical Basis Document [62]. The CrIS interferometer includes a beamsplitter, a porch swing moving mirror, a stationary mirror with dynamic alignment, and a laser metrology system. The beamsplitter divides the incoming radiation into two beams that travel between different mirrors. An interference pattern is produced as the optical path difference between the two beams changes with the sweep of the moving mirrors. After passing through the interferometer, the radiation signal is transformed into time-varying interferogram data that are then output as digital counts from the analog-to-digital converter. To maintain a high signal-to-noise ratio in the interferogram measurements, CrIS is designed with a complex finite impulse response digital band-pass filter to reject out-band signals and to reduce noise in the interferogram data. After going through the filtering process, the interferogram counts are converted to calibrated radiance spectra first through a Fourier transform and then a radiometric calibration process on the ground using the internal calibration target and deep space views as calibration references. The calibrated and geolocated radiance data are referred to as the radiance spectra SDRs. They provide a total of 1305 apodized channels in the normal spectral resolution (NSR) operational mode, covering three spectral bands for sounding the atmosphere. These are the long-wave infrared (LWIR) band, from 650 to 1095 cm−1, the mid-wave infrared (MWIR) band, from 1210 to 1750 cm−1, and the short-wave infrared (SWIR) band, from 2155 to 2550 cm−1 (Table 2). The spectral resolutions for the CrIS SDR data at NSR are 0.625, 1.25, and 2.5 cm−1 for the LWIR, MWIR, and SWIR bands, respectively. The CrIS can also be operated in the full spectral resolution (FSR) mode, in which all the three bands have the same spectral resolution of 0.625 cm−1, with a total of 2223 unapodized channels. Characterized by its high spectral resolution and wide spectral coverage, a large number of channels, as well as high signal-to-noise ratio, CrIS provides much improved vertical sounding resolution and accuracy in temperature and moisture information compared to the NOAA heritage HIRS.
CrIS contains nine detectors arranged on a 3 × 3 grid on a focal plane for each of the three spectral bands to receive the interferogram data. The interferometer optical axis is nominally centered in the middle of the fifth detector. The size and position of the detection field stop define the FOV for each detector, and the combined 3 × 3 FOVs define the field of regard (FOR). The nominal cross-track and in-track offset angles are 1.1° for each FOV. One typical CrIS scan sequence consists of 34 interferometer sweeps that comprise thirty FORs, or Earth scenes, two deep space observations and two internal calibration target measurements. CrIS scans the Earth within the scan angle range of 48.33° on each side of the nadir direction, and with an angular FOR sampling interval of 3.33°. The swath width of the CrIS scan is about 2200 km with a nadir footprint size of about 14 km for each FOV. Each scan takes about 8 s, where 0.2 s are required for each Earth scene, deep space or internal target interferogram measurement.
The Earth scene measurements are calibrated radiometrically for each channel independently using the instrument blackbody internal calibration target and the deep space views, whose radiance is negligible in the frequency range of CrIS measurements. The CrIS radiometric calibration relies on the proper radiometric nonlinearity correction [63]. The CrIS radiometric transfer function is linearly dominated and the small nonlinear response is characterized by a quadratic term multiplied by non-linear calibration coefficients. The CrIS SDRs also went through a complex spectral calibration aiming at removing instrument-design-related spectral self-apodization (shift in channel frequency or distortion in the spectral line shape) and ringing artifacts (spectral noise, see Strow et al. [64]). The spectral self-apodization is induced by the beam divergence that arose from the small angles between the incoming beam direction and the off-axis detectors in the 3 × 3 grid. The spectral noise was caused by the imaginary component out of the Fourier transform of the asymmetric interferogram, where the asymmetry arose from the phase delay between the two beams divided by the beamsplitter. Three main operations are included in the spectral calibration: application of a band-pass filter to suppress the noise signals in the guard bands that were amplified during the radiometric calibration, an instrument line shape correction to remove self-apodization effect, and spectral resampling to change the spectral resolution from the laser grid to the common user grid. All three operations are combined into a single matrix in the ground process, referred to as the correction matrix operator (CMO).
3.2. Consistency and Stability of Reprocessed CrIS Data
The operational calibration algorithm, procedures for producing the S-NPP CrIS SDR data and the SDR validation and data quality have been described in detail in [61,63,64,65,66,67]. The operationally calibrated CrIS SDR data at the NSR mode are broadly used and assimilated at NWP centers to improve weather forecasting and climate reanalyses due to its high radiometric, spectral, and geometric accuracy, as well as excellent noise performance. However, the quality and calibration accuracy of the operational CrIS SDR data were continuously improved through a series of algorithm and software updates that have caused SDR inconsistencies, impacting its long-term stability. The key updates included: (i) update of the processing calibration coefficients on 11 April 2012; (ii) implementation of updates of non-linearity coefficients and instrument line shape parameters, as part of the operational processing system on 20 February 2014; (iii) transition to full spectral interferogram mode implemented in the Raw Data Record (RDR) on 4 December 2014; (iv) a change of the calibration algorithm on 8 March 2017 to include both NSR and FSR SDR data as part of the operational processing system; (v) separation of the CMO and engineering packet output; (vi) recalculating the resampling matrix using the latest metrology laser wavelength. Among these changes, the new calibration algorithm developed by Han and Chen [68] and implemented in March 2017 represented one of the major improvements in CrIS calibration. Instead of performing radiometric calibration first and spectral calibration second in the earlier calibration procedure, the new approach first applies the spectral calibration to the raw spectra after non-linear correction and the removal of the common phases from the radiance spectra, and then applies the radiometric calibration.
To generate the reprocessed SDR data product, a dedicated reprocessing system was developed based on the operational software and calibration algorithm updated on 8 March 2017. In the reprocessing system, the calibration coefficients, including the non-linearity coefficients, the instrument line shape parameters, and the geolocation mapping angles, were refined with the latest updates based on the work from CrIS SDR science team. Those calibration coefficients were included as part of the Engineering Packet in the RDR data stream. The reprocessing system takes advantage of the highly stable spectral emission line from a neon lightbulb to calibrate the metrology laser wavelength [64,65]. The resampling wavelength was updated based on the neon-calibrated metrology laser wavelength and it resulted in close to zero sampling errors in the spectral calibration. In the reprocessing system, all the S-NPP NSR SDRs were generated with the same calibration coefficients, resulting in improved consistency during the CrIS life-time mission. Figure 3a,b compare the FOV-to-FOV radiometric differences among the nine LWIR detectors before and after the reprocessing, respectively. The reprocessed SDR product shows consistent and smaller FOV-to-FOV radiometric differences throughout the reprocessing period (Figure 3b), in contrast to the performance observed for the operational SDR product, which shows a major discontinuity around February 2014. The FOV-to-FOV radiometric differences relative to the central detector (FOV5) are within 0.03K for the reprocessed SDR product. This translates to a maximum FOV-to-FOV radiometric difference of 0.06 K, demonstrating the high radiometric accuracy and stability of the reprocessed SDR product. This uniformity of the reprocessed FOV-to-FOV radiometric performance is largely due to the improvement of the nonlinearity coefficients. This feature allows the NWP and reanalysis models to assimilate CrIS data from all of the FOVs without special treatment for different FOVs.
Figure 4 shows the time series of the spectral errors of the reprocessed SDR product and compares its performance against the metrology laser wavelength, derived from the neon-calibration subsystem, and the operational SDR product performance. Figure 4 shows that the CrIS metrology laser wavelength varies within 4 ppm, as measured by the neon-lamp-calibration subsystem. Similarly, the spectral errors in the operational SDR product also vary within about 4 ppm. In contrast, the reprocessed SDR product has spectral errors less than 0.5 ppm, nearly an order of magnitude smaller than those spectral variations observed in the neon-calibrated metrology laser wavelength and the operational SDR product. The performance of the reprocessed SDR products demonstrates its remarkable spectral accuracy and stability.
4. OMPS Reprocessing
4.1. The Instruments and Calibration Principles
The S-NPP OMPS is composed of three sensors, the Nadir Mapper (NM), Nadir Profiler (NP), and Limb Profiler (LP), and only the first two instruments and their reprocessing are described here. Dittman et al. [69] and Seftor et al. [70] provided a detailed description of the optical design of the NM and NP instruments. The two instruments are nadir-viewing spectrometers that measure backscattered ultraviolet sunlight from the Earth’s atmosphere and surface. The NM and NP share the same telescope with a dichroic beam splitter downstream redirecting the incoming radiation into either of the two spectrometers. The telescope has a 110° total across-track FOR, resulting in a 2800 km swath width at the Earth’s surface. The dichroic beam splitter was optimized to reflect light for wavelengths shorter than 300 nm to the NP spectrometer and to transmit light for wavelengths longer than 310 nm to the NM spectrometer. There is a transition from reflection to transmission over the 300 nm to 310 nm interval. The telescope also includes a depolarizer to minimize the sensor linear polarization sensitivity [71].
After being split, the light from each spectrometer is dispersed via a diffraction grating onto corresponding dual charge-coupled devices (CCDs) with two-dimensional arrays that are located at each spectrometer’s focal plane, comprising 740 individual spatial detector pixels and 340 spectral channels. The NM and NP, respectively, illuminate 196 and 147 of the 340 spectral samples. Given the total bandwidth for each of NM and NP, this results in a spectral resolution of ~0.41 nm for both instruments. In the spatial dimension, multiple pixels were summed together into a single “macro-pixel” to provide an instantaneous FOV (IFOV) much larger than the pixel size. Specifically, each IFOV is composed of 93 pixels for NP and of 20 pixels for all but the most extreme left and right off-nadir IFOVs for NM. The nadir-viewing resolution with such a composition is 50 km cross-track by 50 km along-track taking 7.6 s total integration time for NM and 250 km × 250 km taking 38 s total integration time for NP.
The OMPS nadir sensors retrieve estimates of ozone amounts by utilizing normalized radiances (NRs), defined as the ratio of measured Earth radiance to measured solar irradiance [72,73]. The NR is referred to as the albedo or reflectance at the top-of-the-atmosphere. Calibration of NR includes those of the Earth radiance and solar irradiance. Solar observations are made by putting one of the two reflective diffusers at the entrance aperture. They are rotated through seven different positions to obtain full coverage of the 110° FOV. One of them is the working diffuser providing solar irradiance measurement once every two weeks, and the other is a reference diffuser deployed every six months to monitor the stability of the working diffuser. The Earth radiance calibration assumes a close-to-linear relationship between the incoming light and the counts’ values from the analog-to-digital converter output. Linearity is defined relative to the measured signals at two points: one at the bias level as the lower limit and one at the 75% of the prelaunch saturation point of the analog-to-digital converter as the upper limit. A non-linear correction is applied at the count level. Responses at individual pixels are converted from corrected counts using slope between the two points as well as other prelaunch knowledge. Details of the calculation procedure to create the Earth radiance can be found in Seftor et al. [70].
Wavelength calibration is conducted by utilizing the solar flux measurements and knowledge of the solar spectral line structure, that is, the solar Fraunhofer lines, as the reference. In this calibration, a reference wavelength registration is first performed in which laboratory reference spectral data were derived for each pixel on the CCD focal plane. They are then binned and averaged into the same data samples as the Earth view pixels to provide a reference for the Earth views. On-orbit wavelength calibration at each Earth view pixel is computed by periodically comparing the reference irradiance with the actually observed irradiance. The OMPS wavelength scales are subject to shifts due to thermal loading changes in various optical elements, referred to as the thermo-optical effect [74]. Among them, solar wavelength shifts up to 0.11 nm was observed for the NM due to a dramatic change in its operational temperature after the transition from the ground to on-orbit. Intra-orbit Earth wavelength shifts up to 0.05 nm are found for the NM in association with intra-orbit changes in housing temperature. In addition, both Earth and solar wavelengths drift in an annual cycle with a magnitude of 0.04 nm for NP and 0.02 nm for NM, respectively, due to seasonal variations of optical bench temperature associated with changes of the solar beta angle. Calibration algorithms were developed to correct these wavelength shifts [74,75]. The OMPS on-orbit wavelength calibration detects any of those shifts and then corrects the measured wavelength as a function of the spectral and spatial positions on the CCD focal plane using relevant calibration algorithms. The calibrated wavelength scales achieved an accuracy of better than 0.02 nm for NM and 0.01 nm for NP, respectively.
4.2. Consistency and Stability of Reprocessed OMPS Data
Both radiometric and wavelength calibrations for the operational NM and NP SDRs have been described in detail in Seftor et al. [70] and Pan et al. [74,75]. These calibration processes correct biases from several different error sources, including CCD dark current, electronic bias, nonlinearity, stray light, throughput degradation, and wavelength scales. Dark current is caused by electrons thermally excited into the CCD conduction band. Although the dark current is well characterized and stable before launch, it varies on orbit due to lattice damage caused by energetic solar wind or cosmic ray particles striking the CCD. Time-varying corrections are needed to remove the dark current effect. Figure 5 shows the time series of N-values, which are logs of NR, averaged over the tropical region for both operational and reprocessed SDRs for both NM and NP at selected channels. The OMPS operational SDRs were first released on 27 January 2012, three months after the S-NPP launch time, and then a Beta version was released shortly later on 13 March 2012. As a Beta version, the SDRs allow the users to get familiar with the data formats and parameters but are not appropriate for quantitative scientific studies and applications, as only initial radiometric and solar flux calibrations were applied. As such, a series of calibration updates were implemented after the release of the Beta version. Table 3 and Table 4 provide the timelines for these calibration updates for NM and NP, respectively. For NM, weekly dark current calibration started on 21 December 2012, followed by a series of updates of the stray light calibration look up table (LUT). Among them, the updates on 10 July 2013, 21 November 2014, and 18 December 2014 caused large jumps in the operational NR time series for the 302 nm channel (Figure 5a). A major update in calibration algorithms was made on 9 September 2015, the release date of the validated maturity version (VMV) of SDRs, including updates of the solar LUT, wavelength calibration LUT, calibration constant, and stray light calibration LUT. The time series remained smooth for most of the period afterward, except for another jump on 9 July 2018 caused by the update of the stray light calibration LUT at that date.
For NP, major jumps in the operational NR time series occurred at four calibration updates: solar and wavelength LUT updates in the middle of July 2012, start of the weekly dark current calibration on 12 February 2013, update of stray light LUT on 18 March 2014, and solar and wavelength LUT updates on 9 September 2015 when the VMV was released.
In the reprocessing, consistent algorithms, tables and corrections were applied to both NM and NP throughout their reprocessing periods from 27 January 2012, the SDR releasing date, to 9 July 2018 for NM and 8 March 2017 for NP, respectively. The software codes and calibration LUTs that were used for reprocessing are the same as those used in operations on the end dates of reprocessing for both NM and NP, except that the operational processing used half-week delayed tables while the reprocessing used the current week tables for the dark current correction. The consistent calibration algorithms and tables in the reprocessing had effectively removed jumps in the operational processed NR time series, leading to consistent reprocessed time series for both NM and NP through their entire reprocessing periods (Figure 5a,b).
The operational and reprocessed SDRs are in better agreement during the later periods than the earlier periods of reprocessing in general, due to the use of the same calibration algorithms and LUTs applied at the end dates of reprocessing. The magnitudes of differences between the reprocessed and operational SDRs are different for different channels of the NM and NP instruments. For NM, large differences occurred for channels with shorter wavelengths, e.g., channel 302 nm before the VMV releasing date. On the other hand, the reprocessed and operational NR time series are almost the same for channels with a longer wavelength, i.e., channels 317.5 nm and 339.6 nm. For NP, significant differences between the reprocessed and operational N-values are observed for all selected channels before the VMV releasing date. There are two reasons for these phenomena. The first is that channels with shorter wavelengths have stronger ozone absorption leading to smaller radiances and are thus more sensitive to changes of calibration algorithms and tables. The other is that the dichroic beam splitter redirects 90% of the incoming sunlight to NP but only 10% to NM at 302 nm. The lower radiance levels for the channels received by NP caused noticeable sensitivity to changes of calibration algorithms for all of its channels. In contrast, only the NM channels with smaller signal levels are more sensitive to dark current and stray light changes since the incoming radiances are small.
Such differences in channel sensitivity to calibration changes help explain the slight differences between the operational and reprocessed SDRs during the period immediately before the end dates of reprocessing. For NM, calibration tables on the end date (9 July 2018) for reprocessing included the updated stray light correction LUTs on the same day and this was slightly different from those used in the operational processing on and after the VMV releasing date. This, together with differences in the dark current correction, caused slight differences between the reprocessed and operational NRs from 9 September 2015 to 9 July 2018 for all the selected NM channels (Figure 5a). On the other hand, LUTs used in the NP reprocessing are the same as those in operations on the VMV releasing date. This resulted in identical operational and reprocessed SDRs for NP channels 292 nm and 302 nm, which are not as sensitive to dark current corrections, from 9 September 2015 to 8 March 2017. However, due to the high sensitivity of channel 253 nm to the dark current correction, the reprocessed and operational SDRs for this channel show noticeable differences during the same period of time.
Changes in calibration constants and tables used in reprocessing also improved the consistency in the N-value measurement between the NM and NP. Figure 6 and Figure 7 investigate the spectral dependence of the improvements by comparing the operational and reprocessed SDRs for a sample day in September 2012. Figure 6a shows that the main changes from the operational to reprocessed solar irradiances were in the overlap region from 300 nm to 310 nm for both the NM and NP. In contrast, the main changes to the Earth radiances were from 250 nm to 290 nm for the NP and from 300 nm to 310 nm for the NM (Figure 6b). These changes in solar irradiance and Earth radiance led to changes in the absolute N-values in the corresponding spectral regions (Figure 6c). Improvements in the stray light corrections listed in Table 3 and Table 4 for the two instruments had the largest impact on the changes in these variables. Figure 7 shows the N-value differences for both the operational and reprocessed NM and NP relative to a smooth quadratic fit function that is used as a consistent reference to compare the NM and NP with different wavelength scales. Wavelike structures in the difference curves represent real signals from the solar and ozone absorption spectral features. The most striking feature in the plot is that the differences between the NM and NP for the reprocessed SDRs (differences between the dotted lines) are much smaller than those in the operational products (differences between the solid lines) in their overlap spectral region. This demonstrates the improved consistency between the NM and NP in the reprocessed SDRs. This improvement was largely due to the wavelength scale and irradiance calibration coefficient refinements over this interval as listed in Table 3 and Table 4.
Although reprocessing produced consistent time series, they are not considered as the final products as bias correction algorithms are still under improvement and will be implemented when they reach maturity. For the NM sensor, solar reference measurements show little throughput degradation and no time-dependent calibration or solar adjustments are made to the SDR products. The same Day 1 solar irradiance spectra and wavelength scales are used as the basis for the measurement-based adjustments for both reprocessed and operational products. The NM has an intra-orbital variation in the wavelength scale and this variation is estimated from the Earth-view radiances on a granule by granule basis. The new wavelength scales and the solar flux adjusted to these new wavelength scales have been reported in the SDR. Additionally, an error in the NM dark correction code has been identified and corrected code has been developed for the operational SDRs. However, reprocessing has not used this most updated code yet. The error is small for solar zenith angles less than 88°.
For the NP, solar reference measurements show wavelength-dependent degradation, however, no time-dependent calibration or solar adjustments for this degradation are made to the SDR products. This means that the NR values using the SDR information will have uncorrected calibration drifts from the Earth-view radiances. The NP also has an annual variation in the wavelength scale. The Day 1 solar irradiance spectra and wavelength scales are regularly updated by using the biweekly working diffuser solar measurements to account for this wavelength scale variation. Improved “Day 1” wavelength scales and unexpected behavior in night-side measurements are under investigation. Considerations are made to include degradation adjustments and solar activity in the biweekly table deliveries.
Once further improvements to account for these issues are made in the operational SDRs, reprocessing will be conducted again using consistent algorithms accounting for the improvement for an extended period of time longer than the reprocessing presented here. The initial set of reprocessed SDRs has already been used to generate total column ozone and ozone vertical profile CDRs, the Version 8 ozone datasets. The reprocessed SDRs were used as inputs to the Version 8 total ozone algorithm with a constant (non-time-varying) set of channel bias adjustments calculated to give agreement with the Earth Observing System (EOS) Aura Ozone Monitoring Instrument (OMI) Version 8 record [76]. The reprocessed SDRs were also used as inputs to the Version 8 ozone profile algorithm with a constant set of channel bias adjustments to give agreement with the NOAA-19 SBUV/2 Version 8 record in 2013 [77]. Daily updates to the solar irradiance were created to account for wavelength scale variations and throughput degradation that was not included in the current SDR reprocessing.
5. VIIRS Reprocessing
5.1. The Instrument and Calibration Principles
The VIIRS instrument is a whiskbroom scanning radiometer measuring reflected and emitted radiation from the Earth in the spectrum between 0.412 µm and 12.01 µm. A detailed description on the optical design and instrument characteristics is given in Cao et al. [78,79,80] and in the VIIRS algorithm theoretical basis document (ATBD) [81]. The VIIRS fore optics includes a rotating telescope assembly, and a rotating half angle mirror synchronized with the telescope. The aft optics consist of two dichroic beamsplitters with four-mirror anastigmat with all reflective design, three focal plane assemblies (FPA) with detector arrays designed to measure the visible/near infrared (VisNIR), the shortwave/midwave infrared (SW/MWIR), and the longwave infrared (LWIR) spectrum, with an additional day–night-band (DNB) FPA mounted adjacent to the VisNIR FPA. The onboard calibration system relies on a solar diffuser, solar diffuser stability monitor (SDSM), an onboard calibrator blackbody, and space view. The telescope scans the Earth between the angles of ±56.28° from nadir, resulting in a swath width of 3060 km at the nominal altitude of 829 km. Incoming radiation received by the telescope is reflected from the half-angle mirror into the aft-optics subsystem. The light is then spectrally and spatially divided by the beamsplitters and directed to the three FPA detector arrays with the DNB and VisNIR FPAs sharing the same optical path. The detector arrays are built in rectangular patterns, arranged with “bands” in the scan direction and detector numbers in the track direction [81]. The VIIRS instrument provides moderate resolution radiometric bands (M-bands) and fine resolution imaging bands (I-bands). Each M-band and I-band consists of 16 and 32 along-track detectors, respectively. VIIRS has a total of sixteen M-bands and five I-bands distributed among the three FPAs (Table 5). Among them, seven M-bands and two I-bands are in the VisNIR FPA, six M-bands and two I-bands in the SW/MWIR FPA, and three M-bands and one I-band in the LWIR FPA, respectively. Among the M-bands, eleven are reflective solar bands (RSBs) and five are the thermal emissive bands (TEBs). The I-bands include three RSBs and two TEBs. VIIRS uses a unique approach of pixel aggregation which controls the pixel growth towards the end of the scan. Such an aggregation helps a band maintain a nearly constant resolution over the entire scanning swath. At nadir, the FOV spatial resolutions are 750 m for the M-bands and 375 m for the I-bands.
The DNB module includes a CCD array and a focal plane interface electronics. The single DNB band contains 672 sub-detectors in the along-track direction by using multiple CCDs that provide multiple samples in the scan direction. The unique DNB detector technology allows the measurement of nightlights, reflected solar and/or moon lights with a large dynamic range, such as the reflected signals from as low as quarter moon illumination to the brightest daylight [80]. The DNB has a constant spatial resolution of 750 m across the scan, due to the advanced subpixel aggregation scheme with 32 aggregation zones from nadir to edge of the scan.
Radiation received by the FPAs is converted to digital counts by the analog-to-digital converters as detector outputs, which are then converted to radiances using the on-board calibration system. VIIRS is a conventional differencing radiometer that uses the space view to determine zero radiance and observations of a known radiance source to determine the gain. For RSBs, the known radiance source is the on-board solar diffuser. The diffuser is fully illuminated once per orbit as the satellite passes from the dark side to the light side of the Earth near the South Pole and the reflected solar radiance from the diffuser is used as a reference to calibrate the Earth radiance and reflectance [80]. However, the solar diffuser degrades over time. The SDSM is therefore used to determine the degradation by directly measuring sunlight through an attenuation screen and comparing it with the reflected radiance from the solar diffuser.
For TEBs, the on-board blackbody serves as the calibration target. Six National Institute of Standards and Technology (NIST) traceable thermistors are embedded uniformly on the blackbody to measure its bulk temperature to ensure reliability and traceability of the measurements.
To measure radiances with seven orders of magnitude in dynamic range [80,82], the DNB is made of three sub focal plane arrays: the low-gain, mid-gain, and dual high-gain FPAs. The low-gain is used for high radiance or daytime observations, an intermediate-gain is used for mid-radiance, and a high-gain is used for low radiance or nighttime observations, with automatic switching between the gain stages to accommodate observed light sources. The low-gain stage calibration uses the same onboard solar diffuser and space view that are shared with the RSBs. For mid-gain and high-gain stages, however, measurements from the solar diffuser and space views are saturated, thus cannot be used for calibration directly. As a result, calibration of the mid-gain and high-gain stages rely on gain transfer from the low-gain stage through the gain ratio approach. In addition, because of an electronic timing difference between the calibrator view and Earth view, the dark ocean and blackbody views during a new moon are used to replace the space view and provide Earth view calibration offset for calibration of all three gain stages of DNB [81,83,84]. Detailed information on the DNB calibration is given in Uprety et al. [84].
Conversion from the Earth view digital counts to Earth view radiances is carried out through a quadratic calibration equation for all bands using their calibration target views as end-point references. Prelaunch calibration coefficients were determined in laboratory tests and used initially after launch. To account for onboard sensor degradation and other onboard calibration changes, a band-dependent time-varying scaling factor (also known as F-factor) is introduced in the calibration equation for the VIIRS instrument. Changes in scaling factors are parameterized as a function of time in the instrument calibration LUTs. Operational SDRs are generated using constantly updated LUTs with the algorithm and data processing software within a so-called Algorithm Development Library (ADL) framework. Details on the calibration equations for different bands were given in Cao et al. [80] and VIIRS ATBD [81].
Despite the comprehensive design of the RSB onboard calibration system with a solar diffuser and SDSM, residual degradation still exists which is not accounted for in the operational calibration using the onboard calibration system alone. This has an impact on applications that require extremely high long-term stability and accuracy. To mitigate this effect, rigorous monthly lunar calibration through spacecraft maneuvers has been operationalized to measure the moon irradiance at the same lunar phase angle [85]. In addition, vicarious calibration methods have also been used to account for the residual degradation, such as using the deep convective clouds, and twenty global calibration sites. The vicarious calibration has been used as feedback and correction for the operational calibration, as well as for reprocessing.
5.2. Consistency and Stability of Reprocessed VIIRS Data
The first VIIRS visible image was taken on 21 November 2011 when the VIIRS nadir door was opened, allowing Earth observations from the RSBs and DNB. Later on 18 January 2012, the cryo-cooler was opened for TEBs. VIIRS became thermally stable and functional two days later and has been continuously generating SDRs based on operational calibration algorithms since 19 January 2012 until present. Although assessments of the VIIRS calibration showed that it outperformed legacy sensors such as the AVHRR or Moderate Resolution Imaging Spectroradiometer (MODIS), there were many calibration and operational changes during the first 5 years of its mission for SDR improvement [80,86,87]. These changes caused time series of the VIIRS operational SDRs being inconsistent for climate change applications. To improve SDR consistency, reprocessing was conducted for the period from 2 January 2012 to 8 March 2017 for RSBs and DNB, and from 19 January 2012 to 8 March 2017 for TEBs using consistent calibration algorithms and calibration LUTs for all of the VIIRS bands. The reprocessing incorporated all improvements developed before the end date of reprocessing into the ADL framework, although different bands used different updated LUTs specific for the bands.
Uprety et al. [88] and Choi et al. [85] summarized the reprocessing for the RSBs. The biggest challenge in calibrating the RSBs is that the scaling factor derived from the onboard SDSM and solar diffuser has uncertainties due to errors in the measurement of the solar diffuser bi-directional reflectance function and screen vignetting function [89]. A series of updates was implemented in the operational calibration to improve the radiometric correction factor that included the update of the SDSM screen transmittance tables in early 2012, prelaunch calibration coefficients update in April 2014, optimized Robust Holt-Winters filter parameters for the characterization of solar diffuser degradation in May 2014, the transition from manual computation to automatic determination in software codes of the scaling factor, and solar vector error correction [87], etc. Although these updates largely improved radiometric accuracy in the RSBs, they also resulted in bias jumps in the operational SDR’s time series (Figure 8). VIIRS reprocessing accommodated all of these changes. In addition, VIIRS reprocessing applied Kalman filter to determine gain coefficients for the M1–M7 and I1–I2 RSBs that help to remove long-term biases and improve data quality. Kalman filter allows calculation of the instrument degradation using multiple independent approaches and combining them for an optimal determination of gain values in calibration. Specifically, the Kalman filter combines calibration results from the latest solar diffuser-based calibration parameters with reduced seasonal oscillations, lunar, deep convective clouds, and extended SNO results. It also reconciles discrepancies between low-gain and high-gain calibrations.
An additional correction has also been applied for the M5 and M7 for the entire reprocessing period by comparing it with MODIS using SNO methods. Figure 8 shows the reflectance anomaly time series (reflectance minus an annual mean climatology) for the M5 band for the operational and reprocessed data over the Libya-4 desert area and their ratio. Both the operational and reprocessed data show similar temporal patterns in their monthly anomaly time series although there is a small bias between them. However, their ratio (reprocessed/operational) at the pixel level shows jumps associated with major calibration updates, suggesting inconsistency in the operational SDRs. This inconsistency has been removed in the reprocessed SDRs.
Uprety et al. [84] described in detail on the reprocessing of the DNB. The DNB is unique in wide relative spectral response function in the visible region designed especially for nighttime imaging. However, the nighttime observations are contaminated by stray light from the Sun when the satellite is in the twilight zone. Atmospheric airglow contamination impacted high-gain stage calibration using the dark ocean and resulted in low accuracy and substantial presence of negative radiance at views near the new moon. Algorithms to correct these biases along with other calibration updates were implemented at different times when SDRs were operationally generated, including an update of calibration coefficients using on-orbit data in late March 2012, stray-light correction since mid-2013, accommodation of changes in relative spectral response resulting from telescope throughput degradation in April 2013, removal of atmospheric airglow effect in early 2017, and minimizing strong striping in radiance for higher aggregation zones since January 2017. These calibration changes improved the quality of the operational SDRs over time, but also caused inconsistency in the SDR time series.
Reprocessing accommodated all calibration updates in the operational SDRs. Additionally, an improved stray-light correction algorithm was applied in the reprocessing to remove residual errors in the stray-light correction in the operational SDRs. Calibration improvements in the dark offset and gain ratios estimated every month during the new moon are updated periodically in the reprocessing. All of these improvements resulted in higher quality and consistent reprocessed DNB images [84].
The thermal band performance is very stable in general [86,90]. A main issue with the thermal band calibration is that a small bias on the order of 0.1 K was introduced in the brightness temperatures during the quarterly blackbody warm-up/cool-down (WUCD) periods—an operational procedure to assess the thermal band calibration nonlinearity [90]. This bias is caused by a calibration defect during the blackbody unsteady states when its temperature changes by nearly 50 K during a WUCD event. This bias is further amplified by up to 0.3 K in the sea surface temperatures through retrieval algorithms. Cao et al. [90] developed a diagnostic and correction method by introducing a compensatory term in the calibration equation to remove this bias. This correction algorithm was further analyzed and evaluated by Wang et al. [91] and has been implemented in the NOAA operational processing since 25 July 2019. In the reprocessing, the same correction algorithm for the WUCD effect was implemented for the entire reprocessing period from 19 January 2012 to 8 March 2017. Figure 9 compares brightness temperatures pixel by pixel at nadir between the reprocessed and operational SDRs over the tropical site (142° E, 2° N) separated into cloudy and clear sky conditions. As seen, the WUCD biases in the operational SDRs show up as regular spikes in the brightness temperature difference time series and they have been mostly mitigated in the reprocessing.
The VIIRS thermal bands are compared with the heritage sensor MODIS onboard Aqua for consistency and stability assessment. Some of the MODIS channels in the infrared region match quite well with the VIIRS thermal bands (Table 5), although their central wavelengths are slightly different. Nevertheless, the impact of these small wavelength differences is negligible in their stability assessment. The VIIRS band M15 (10.75 µm) and MODIS band 31 (11.03 µm) are selected here for comparison. These two bands have very close central wavelengths and bandwidths, and both are used for the sea surface temperature retrievals, respectively, in their own mission. In assessing the consistency and stability of similar sensors on different platforms, changes in diurnal sampling over time due to satellite orbital drifts pose a challenge in explaining comparison results. Fortunately, the similar overpass timing for S-NPP and Aqua in stable orbits naturally removes most of the diurnal differences between them, offering a great advantage in the stability assessment. Figure 10 shows the monthly global mean BT time series of near-nadir observations from 01/2012 to 03/2017 for both VIIRS and MODIS, ascending and descending nodes separately, and their differences. Seasonal variations dominate in both the VIIRS and MODIS global mean time series, but the ascending observations are a few Kelvin degrees larger than the descending data. This is because the former are daytime observations close to 1:30 pm local time while the latter are nighttime observations close to 1:30 am local time. In their difference time series, the VIIRS brightness temperatures are warmer by approximately 0.15 K than MODIS on average for both daytime and nighttime observations. This bias arises for the most part due to differences in the relative spectral response functions between the two sensors [92]. In addition, the S-NPP orbits drifted relative to Aqua in a zigzag pattern with a maximum of 10 min apart and a minimum near zero minute occurred in late 2014. This small orbital drift caused biases on the order of 0.03–0.08 K between the two instruments [93].
Trends for the VIIRS minus MODIS time series are 0.0165 ± 0.0119 K/Year for daytime passes and 0.0016 ± 0.0133 K/Year for nighttime passes, respectively, during the five years from January 2012 to March 2017, with VIIRS being warmer. Uncertainties in trends represent 95% confidence intervals with autocorrelation adjustments. These uncertainties are relatively large that are mainly due to shorter observation length and larger magnitude of noise in the difference time series. These could be improved in future studies as the time series become longer and more observations from the larger scan angles, after scan-angle correction, are used in the global mean calculations to reduce noise [47]. Looking at the trend differences between VIIRS and MODIS, the trend value in daytime passes is an order of magnitude larger than that in the nighttime passes. This is most likely related to diurnal drift difference. Shao et al. [93] showed that the VIIRS M15 band was 0.084 K warmer than the MODIS B31 band in daytime passes in low latitudes, caused by the 10-min orbital drift of VIIRS relative to Aqua and a steeper temperature diurnal gradient near 1:30 pm local time. In contrast, orbital-drift related differences between the same two instrument bands were only of 0.028 K for nighttime passes due to a flat temperature diurnal gradient near 1:30 am local time [93], although orbital drift is also of 10-min magnitude between the two satellites. As such, the impact of diurnal changes on trend comparisons is negligible for the nighttime passes and the trend differences of the global nighttime time series best characterize the radiometric stability in the VIIRS and MODIS obviations. With the diurnal effect excluded, the small trend differences in nighttime passes suggest that there are little or nearly no relative drifting errors between the S-NPP/VIIRS and Aqua/MODIS observations for the comparing bands. As the two instruments were calibrated completely independently and it is unlikely that their biases are drifting to exactly the same direction to arrive at a near-zero relative drifting error, the most probable explanation is that both instruments have achieved an absolute radiometric stability within ±0.0016 K per year. Since these bands are mainly for retrieving sea surface temperatures, this stability satisfies the accuracy requirement for climate change measurement that allows reliable detection of the temperature climate trends at the surface [47,48].
Reprocessing also resulted in the improvement of geolocation accuracy. Wolfe et al. [94] described in detail the geometric calibration including prelaunch pointing and alignment measurements for all VIIRS bands. Prelaunch calibrated geolocation had biases up to −775 m in the track direction and 1118 m in the scan direction. Post-launch correction for these errors involves updates of a multi-parameter geolocation LUT containing instrument scan angle information, such as the satellite roll, yaw, and pitch angles, as well as other information. The first two updates, performed on 23 February 2012 and 18 April 2013, had reduced the geolocation error biases to within 2 m [94]. In addition, several other updates and refinement of scan angles in geolocation LUT were also performed to improve the geolocation accuracy in the NOAA operational processing during the period from three months after launch until 22 August 2013 [95]. The DNB operational SDR product did not have a terrain corrected geolocation until May 2014. These updates resulted in inconsistency in geolocation accuracy between the earlier and later periods of the VIIRS SDRs. In the reprocessing, optimal LUTs were applied to accommodate improved geolocation calibration algorithms and produced consistent geolocation accuracy throughout the reprocessing period for all the VIIRS band resolutions. Detailed description on the reprocessing improvements of the VIIRS geolocation can be found in Wang et al. [95].
6. Conclusions
In summary of the previous sections, the SDR data for the four instruments, ATMS, CrIS, OMPS, and VIIRS onboard S-NPP was reprocessed at NOAA/STAR for the period from near the launch time to 8 March 2017. The reprocessing was based on calibration algorithms and coefficients of the validated maturity version (the baseline version) for individual instruments. The reprocessing had effectively removed bias jumps in the operational SDR time series associated with changes in calibration algorithms and coefficients that were used to generate the SDRs. Preliminary assessments of the reprocessed SDR time series show much-improved consistency and stability over time compared to the operational SDRs as well as observations from legacy sensors onboard Aqua satellite. The reprocessed SDRs allow scientists to quantify their quality in the time dimension and open the opportunity for them to be used in a variety of environmental applications such as the development of climate data records, identifying NWP model errors, improving climate reanalyses as input datasets, and supporting satellite calibration and validation activities.
The reprocessed S-NPP SDR data are currently saved in a cluster computing system hosted by STAR and University of Maryland and accessible through the URL address: ftp://jlrdata.umd.edu/pub/SNPP_Reprocessing/. In addition, the transition of the reprocessed data to the NOAA/Comprehensive Large Array-data Stewardship System (CLASS) is being planned for archiving and distribution with operational support.
The reprocessing as described in this article was only the first attempt to develop consistent S-NPP SDRs. Since updates in calibration algorithms and coefficients are a continued activity in the operational generation of SDRs for improvement of SDR accuracy throughout the rest of the S-NPP mission, inconsistency could still occur beyond the end date of the first reprocessing period as presented here. To accommodate such changes, new versions of life-cycle reprocessing will be conducted now and then throughout the rest of the S-NPP mission whenever new changes and updates in the calibration algorithms and coefficients are significant enough to warrant a reprocessing. Similar to the baseline version, such reprocessing will use the latest calibration algorithms and coefficients to generate life-cycle consistent SDRs for a period that will be longer than the first reprocessing. The new reprocessing may be conducted individually for each instrument or together for all four instruments, and the results could replace the existing one for user applications or they could be used together for inter-comparison and mutual validation.
NOAA-20 has been successfully launched on 18 October 2017 into the same afternoon orbit as the S-NPP satellite. Similar reprocessing is being planned for NOAA-20 using consistent calibration algorithms and LUTs after its observations become a few years longer. Furthermore, such reprocessing could be implemented for future JPSS satellites, such as JPSS-2 and beyond, once these satellites are launched and operated for a few years. This will allow the JPSS instruments to achieve the lowest data uncertainties and long-term stability to augment the use of JPSS datasets in applications to evaluate and monitor societal impacts.
The reprocessing approach presented in this study emphasizes using the latest and consistent calibration algorithms taken from operations that have included all changes incurred during the operational calibration processes. This approach provides the reprocessed SDR products that not only have their own temporal consistencies but are also consistent with the latest operational products for user application support with required accuracies. Such an approach can be generalized and applied to satellite missions other than the JPSS series. This may include individual experimental missions such as those planned and launched by NASA, satellite mission series such as those from the NOAA Geostationary Operational Environmental Satellite (GOES) series and the second generation of the EUMETSAT MetOp (MetOp-SG) series, as well as other satellite missions. Reprocessing for individual instruments on a satellite mission, as for the historical heritage satellite instruments, was usually performed by individual research groups or investigators. These reprocessing approaches often used recalibration algorithms and coefficients derived by individual research groups. Although it had contributed a great deal to the reprocessing and CDR sciences, reprocessing with such approaches has become increasingly challenging as calibration processes become more and more complex with advancements in instrument designs. Given its importance and benefits to the user community, as well as for climate change monitoring, it would be most efficient if reprocessing is planned during the mission planning phases and then executed as a common best practice for science support by the satellite agencies responsible for the operational calibration activities. This would allow efficient transitions from operations to science and applications. In turn, feedback from users on the scientific quality of the reprocessed SDRs would help improve the next cycle of reprocessing, forming a transition process from research to operations.
Author Contributions
Conceptualization, C.-Z.Z., L.Z. and L.L.; Data curation, N.S., B.Z. and M.D.; Formal analysis, C.-Z.Z., Y.C., L.E.F., B.Z. and W.L.; Funding acquisition, M.D.G.; Methodology, L.S., D.C.T. and H.Y.; Project administration, C.-Z.Z.; Software, N.S., T.B., Y.B., S.B., T.C., Y.G., X.H., D.L., J.N., X.S., S.U., W.W. and H.X.; Supervision, S.K.; Visualization, Y.C., L.E.F., B.Z., X.H. and W.L.; Writing–original draft, C.-Z.Z., Y.C., L.E.F. and B.Z.; Writing–review and editing, L.Z., L.L., C.C., F.I.-S., B.Y., S.B., D.T., S.U. and W.W. All authors have read and agreed to the published version of the manuscript.
Funding
This research was funded by NOAA (Grants # NA14NES4320003 and NA19NES4320002) to the Cooperative Institute for Satellite Earth System Studies (CISESS) at the Earth System Science Interdisciplinary Center (ESSIC), University of Maryland.
Acknowledgments
The reprocessed S-NPP instrument sensor data records are available from the STAR/UMD web service: ftp://jlrdata.umd.edu/pub/SNPP_Reprocessing/. Detailed information on the S-NPP/JPSS instruments characteristics and their calibration performance can be found in the S-NPP/JPSS instrument documentation site https://www.star.nesdis.noaa.gov/jpss/Docs.php and calibration and validation site https://www.star.nesdis.noaa.gov/icvs/, respectively.
Conflicts of Interest
The authors declare no conflict of interest.
Disclaimer
The scientific results and conclusions, as well as any views or opinions expressed herein, are those of the author(s) and do not necessarily reflect those of NOAA or the Department of Commerce.
References
- Derber, J.C.; Wu, W.-S. The use of TOVS cloud-cleared radiances in the NCEP SSI analysis system. Mon. Weather Rev. 1998, 126, 2287–2299. [Google Scholar] [CrossRef]
- English, S.J.; Renshaw, R.J.; Dibben, P.C.; Smith, A.J.; Rayer, P.J.; Poulsen, C.; Saunders, F.W.; Eyre, J.R. A comparison of the impact of TOVS and ATOVS satellite sounding data on the accuracy of numerical weather forecasts. Q. J. R. Meteorol. Soc. 2000, 126, 2911–2931. [Google Scholar]
- Thépaut, J.-N. Satellite data assimilation in numerical weather prediction: An overview. In Proceedings of the Annual Seminar on Recent Developments in Data Assimilation for Atmosphere and Ocean, ECMWF, Reading, UK, 8–12 September 2003; pp. 75–94. [Google Scholar]
- Lorenc, A.C.; Marriott, R.T. Forecast sensitivity to observations in the Met Office Global NWP system. Q. J. R. Meteorol. Soc. 2014, 140, 209–224. [Google Scholar] [CrossRef]
- Spencer, R.W.; Christy, J.R. Precision and radiosonde validation of satellite gridpoint temperature anomalies. Part I: MSU Channel 2. J. Clim. 1992, 5, 847–857. [Google Scholar] [CrossRef] [Green Version]
- Christy, J.R.; Spencer, R.W.; Norris, W.B.; Braswell, W.D. Error estimates of version 5.0 of MSU-AMSU bulk atmospheric temperature. J. Atmos. Oceanic Technol. 2003, 20, 613–629. [Google Scholar] [CrossRef]
- Mears, C.A.; Schabel, M.C.; Wentz, F.J. A reanalysis of the MSU channel 2 tropospheric temperature record. J. Clim. 2003, 16, 3650–3664. [Google Scholar] [CrossRef]
- Mears, C.A.; Wentz, F.J. Sensitivity of satellite-derived tropospheric temperature trends to the diurnal cycle adjustment. J. Clim. 2016, 29, 3629–3646. [Google Scholar] [CrossRef]
- Zou, C.-Z.; Goldberg, M.; Cheng, Z.; Grody, N.; Sullivan, J.; Cao, C.; Tarpley, D. Recalibration of microwave sounding unit for climate studies using simultaneous nadir overpasses. J. Geophys. Res. 2006, 111, 1–24. [Google Scholar] [CrossRef] [Green Version]
- Zou, C.-Z.; Wang, W. Inter-satellite calibration of AMSU-A observations for weather and climate applications. J. Geophys. Res. Atmos. 2011, 116, 1–20. [Google Scholar] [CrossRef]
- Santer, B.D.; Bonfils, C.J.W.; Fu, Q.; Fyfe, J.C.; Hegerl, G.C.; Mears, C.; Painter, J.F.; Po-Chedley, S.; Wentz, F.J.; Zelinka, M.D.; et al. Celebrating the anniversary of three key events. Nat. Clim. Chang. 2019, 9, 180–182. [Google Scholar] [CrossRef] [Green Version]
- Wang, L.; Zou, C.-Z.; Qian, H. Construction of stratospheric temperature data records from Stratospheric Sounding Units. J. Clim. 2012, 25, 2931–2946. [Google Scholar] [CrossRef] [Green Version]
- Thompson, D.W.J.; Seidel, D.J.; Randel, W.J.; Zou, C.-Z.; Butler, A.H.; Mears, C.; Osso, A.; Long, C.; Lin, R. The mystery of recent stratospheric temperature trends. Nature 2012, 491, 692–697. [Google Scholar] [CrossRef] [PubMed]
- Zou, C.-Z.; Qian, H.; Wang, W.; Wang, L.; Long, C. Recalibration and merging of SSU observations for stratospheric temperature trend studies. J. Geophys. Res. Atmos. 2014, 119, 13,180–13,205. [Google Scholar] [CrossRef]
- Zou, C.-Z.; Qian, H. Stratospheric temperature climate data record from merged SSU and AMSU-A observations. J. Atmos. Ocean. Tech. 2016, 33, 1967–1984. [Google Scholar] [CrossRef]
- Randel, W.J.; Smith, A.K.; Wu, F.; Zou, C.-Z.; Qian, H. Stratospheric temperature trends over 1979–2015 derived from combined SSU, MLS and SABER satellite observations. J. Clim. 2016, 29, 4843–4859. [Google Scholar] [CrossRef]
- Seidel, D.J.; Li, J.; Mears, C.; Moradi, I.; Nash, J.; Randel, W.J.; Saunders, R.; Thompson, D.W.J.; Zou, C.-Z. Stratospheric temperature changes during the satellite Era. J. Geophys. Res. 2016, 121, 664–681. [Google Scholar] [CrossRef]
- Cavalieri, D.J.; Gloersen, P.; Parkinson, C.L.; Comiso, J.C.; Zwally, H.J. Observed hemispheric asymmetry in global sea ice changes. Science 1997, 278, 1104–1106. [Google Scholar] [CrossRef]
- Comiso, J.C.; Meier, W.N.; Gersten, R. Variability and trends in the Arctic Sea ice cover: Results from different techniques. J. Geophys. Res. Oceans 2017, 122, 6883–6900. [Google Scholar] [CrossRef]
- Leuliette, E.; Nerem, R.; Mitchum, G. Calibration of TOPEX/Poseidon and Jason altimeter data to construct a continuous record of mean sea level change. Mar. Geodesy 2004, 27, 79–94. [Google Scholar] [CrossRef]
- Nerem, R.S.; Chambers, D.P.; Choe, C.; Mitchum, G.T. Estimating mean sea level change from the TOPEX and Jason altimeter missions. Mar. Geodesy 2010, 33, 435–446. [Google Scholar] [CrossRef]
- Nerem, R.S.; Beckley, B.D.; Fasullo, J.T.; Hamlington, B.D.; Masters, D.; Mitchum, G.T. Climate-change–driven accelerated sea-level rise detected in the altimeter era. Proc. Natl. Acad. Sci. USA 2018, 115, 2022–2025. [Google Scholar] [CrossRef] [PubMed] [Green Version]
- Ablain, M.; Legeais, J.F.; Prandi, P.; Marcos, M.; Fenoglio-Marc, L.; Dieng, H.B.; Benveniste, J.; Cazenave, A. Satellite altimetry-based sea level at global and regional scales. Surv. Geophys. 2017, 38, 9–33. [Google Scholar] [CrossRef]
- Chen, X.; Zhang, X.; Church, J.A.; Watson, C.S.; King, M.A.; Monselesan, D.; Legresy, D.B.; Harig, C. The increasing rate of global mean sea-level rise during 1993–2014. Nat. Clim. Chang. 2017, 7, 492–495. [Google Scholar] [CrossRef]
- Thompson, P.R.; Merrifield, M.A.; Leuliette, E.; Sweet, W.; Chambers, D.P.; Hamlington, B.D.; Jevrejeva, S.; Marra, J.J.; MItchum, G.T.; Nerem, R.S.; et al. Sea level variability and change [in “State of the Climate in 2017”]. Bull. Am. Meteorol. Soc. 2018, 99, S84–S87. [Google Scholar]
- Saha, S.; Moorthi, S.; Pan, H.L.; Wu, X.; Wang, J.; Nadiga, S.; Tripp, P.; Kistler, R.; Woollen, J.; Behringer, D.; et al. The NCEP climate forecast system reanalysis. Bull. Am. Meteorol. Soc. 2010, 91, 1015–1058. [Google Scholar] [CrossRef]
- Rienecker, M.M.; Suarez, M.J.; Gelaro, R.; Todling, R.; Bacmeister, J.; Liu, E.; Bosilovich, M.G.; Schubert, S.D.; Takacs, L.; Kim, G.K.; et al. MERRA—NASA’s Modern-Era Retrospective Analysis for Research and Applications. J. Clim. 2011, 24, 3624–3648. [Google Scholar] [CrossRef]
- Dee, D.P.; Uppala, S.M.; Simmons, A.J.; Berrisford, P.; Poli, P.; Kobayashi, S.; Andrae, U.; Balmaseda, M.A.; Balsamo, G.; Bauer, D.P.; et al. The ERA-Interim reanalysis: Configuration and performance of the data assimilation system. Q. J. R. Meteorol. Soc. 2011, 137, 553–597. [Google Scholar] [CrossRef]
- Kobayashi, S.; Ota, Y.; Harada, Y.; Ebita, A.; Moriya, M.; Onoda, H.; Onogi, K.; Kamahori, H.; Kobayashi, C.; Endo, H.; et al. The JRA-55 Reanalysis: General specifications and basic characteristics. J. Meteorol. Soc. Jpn. 2015, 93, 5–48. [Google Scholar] [CrossRef] [Green Version]
- Fujiwara, M.; Wright, J.S.; Manney, G.L.; Gray, L.J.; Anstey, J.; Birner, T.; Davis, S.; Gerber, E.P.; Harvey, V.L.; Hegglin, M.I.; et al. Introduction to the SPARC Reanalysis Intercomparison Project (S-RIP) and overview of the reanalysis systems. Atmos. Chem. Phys. 2017, 17, 1417–1452. [Google Scholar] [CrossRef] [Green Version]
- Goldberg, M.D.; Kilcoyne, H.; Cikanek, H.; Mehta, A. Joint Polar Satellite System: The United States next generation civilian polar-orbiting environmental satellite system. J. Geophys. Res. Atmos. 2013, 118, 13463–13475. [Google Scholar] [CrossRef]
- Zhou, L.; Divakarla, M.; Liu, X. An Overview of the Joint Polar Satellite System (JPSS) Science Data Product Calibration and Validation. Remote Sens. 2016, 8, 139. [Google Scholar] [CrossRef] [Green Version]
- Zhou, L.; Divakarla, M.; Liu, X.; Layns, A.; Goldberg, M. An overview of the science performances and calibration. Validation of joint polar satellite system operational products. Remote Sens. 2019, 11, 698. [Google Scholar] [CrossRef] [Green Version]
- NOAA/STAR. Workshop Report on JPSS Life-Cycle Data Reprocessing to Advance Weather and Climate Applications. Available online: https://www.star.nesdis.noaa.gov/star/documents/meetings/JPSS2016_LDRW/NPSSLifeCycleDataReprocessingWorkshopSummary.pdf (accessed on 28 July 2020).
- National Research Council. Climate Data Records from Environmental Satellites: Interim Report; The National Academies Press: Washington, DC, USA, 2004; p. 135. [Google Scholar]
- Chen, R.; Cao, C.; Menzel, P.W. Intersatellite calibration of NOAA HIRS CO2 channels for climate studies. J. Geophys. Res. 2013, 118, 5190–5203. [Google Scholar]
- Menzel, W.P.; Frey, R.A.; Borbas, E.E.; Baum, B.A.; Cureton, G.; Bearson, N. Reprocessing of HIRS Satellite Measurements from 1980 to 2015: Development toward a Consistent Decadal Cloud Record. J. Appl. Meteor. Climatol. 2016, 55, 2397–2410. [Google Scholar] [CrossRef]
- Stowe, L.L.; Jacobowitz, H.; Ohring, G.; Knapp, K.R.; Nalli, N.R. The Advanced Very High Resolution Radiometer (AVHRR) Pathfinder Atmosphere (PATMOS) Climate Dataset: Initial Analyses and Evaluations. J. Clim. 2002, 15, 1243–1260. [Google Scholar] [CrossRef]
- Heidinger, A.K.; Foster, M.J.; Walther, A.; Zhao, X. The Pathfinder Atmospheres–Extended AVHRR Climate Dataset. Bull. Am. Meteor. Soc. 2014, 95, 909–922. [Google Scholar] [CrossRef]
- Wentz, F.J. SSM/I Version 7 Calibration Report; RSS Technical Report 011012; Remote Sensing Systems: Santa Rosa, CA, USA, 2013; 46p, Available online: http://images.remss.com/papers/rsstech/2012_011012_Wentz_Version-7_SSMI_Calibration.pdf (accessed on 28 August 2020).
- Mears, C.A.; Wang, J.; Smith, D.; Wentz, F.J. Intercomparison of total precipitable water measurements made by satellite-borne microwave radiometers and ground-based GPS instruments. J. Geophys. Res. Atmos. 2015, 120, 2492–2504. [Google Scholar] [CrossRef]
- Mears, C.A.; Smith, D.K.; Ricciardulli, L.; Wang, J.; Huelsing, H.; Wentz, F.J. Construction and Uncertainty Estimation of a Satellite-Derived Total Precipitable Water Data Record Over the World’s Oceans. Earth Space Sci. 2018, 5, 197–210. [Google Scholar] [CrossRef] [Green Version]
- Zou, C.-Z. Atmospheric temperature climate data records from satellite microwave sounders. In Satellite-Based Applications to Climate Change; Qu, J.J., Powell, A., Sivakumar, M.V.K., Eds.; Springer: New York, NY, USA, 2013; pp. 107–125. [Google Scholar]
- Simmons, A.J.; Poli, P.; Dee, D.P.; Berrisford, P.; Hersbach, H.; Kobayashi, S.; Peubey, C. Estimating low-frequency variability and trends in atmospheric temperature using ERA-Interim. Q. J. R. Meteor. Soc. 2014, 140, 329–353. [Google Scholar] [CrossRef]
- Weng, F.; Zou, X.; Sun, N.; Yang, H.; Tian, M.; Blackwell, W.J.; Wang, X.; Lin, L.; Anderson, K. Calibration of Suomi national polar-orbiting partnership advanced technology microwave sounder. J. Geophys. Res. Atmos. 2013, 118, 11187–11200. [Google Scholar] [CrossRef]
- Weng, F.; Yang, H. Validation of ATMS calibration accuracy using Suomi NPP pitch maneuver observations. Remote Sens. 2016, 8, 332. [Google Scholar] [CrossRef] [Green Version]
- Zou, C.-Z.; Goldberg, M.; Hao, X. New generation of US microwave sounder achieves high radiometric stability performance for reliable climate change detection. Sci. Adv. 2018, 4, eaau0049. [Google Scholar] [CrossRef] [PubMed] [Green Version]
- Ohring, G.; Wielicki, B.; Spencer, R.; Emery, B.; Datla, R. Satellite instrument calibration for measuring global climate change. Bull. Am. Meteorol. Soc. 2005, 86, 1303–1314. [Google Scholar] [CrossRef]
- Christy, J.R.; Spencer, R.W.; Braswell, W.D. MSU tropospheric temperatures: Dataset construction and radiosonde comparisons. J. Atmos. Oceanic Technol. 2000, 17, 1153–1170. [Google Scholar] [CrossRef]
- Parker, D.E.; Gordon, M.; Cullum, D.P.N.; Sexton, D.M.H.; Folland, C.K.; Rayner, N. A new gridded radiosonde temperature data base and recent temperature trends. Geophys. Res. Lett. 1997, 24, 1499–1502. [Google Scholar] [CrossRef]
- Haimberger, L. Homogenization of radiosonde temperature time series using innovation statistics. J. Clim. 2007, 20, 1377–1403. [Google Scholar] [CrossRef]
- Haimberger, L.; Tavolato, C.; Sperka, S. Towards the elimination of warm bias in historic radiosonde records—Some new results from a comprehensive intercomparison of upper air data. J. Clim. 2008, 21, 4587–4606. [Google Scholar] [CrossRef]
- Haimberger, L.; Tavolato, C.; Sperka, S. Homogenization of the global radiosonde temperature dataset through combined comparison with reanalysis background series and neighboring stations. J. Clim. 2012, 25, 8108–8131. [Google Scholar] [CrossRef]
- Sherwood, S.C.; Nishant, N. Atmospheric changes through 2012 as shown by iteratively homogenized radiosonde temperature and wind data (IUKv2). Environ. Res. Lett. 2015, 10, 054007. [Google Scholar] [CrossRef]
- Christy, J.R.; Norris, W.B. Satellite and VIZ–radiosonde intercomparisons for diagnosis of nonclimatic influences. J. Atmos. Ocean. Technol. 2006, 23, 1181–1194. [Google Scholar] [CrossRef]
- Thorne, P.W.; Lanzante, J.R.; Peterson, T.C.; Seidel, D.J.; Shine, K.P. Tropospheric temperature trends: History of an ongoing controversy. WIREs Clim. Chang. 2010, 2, 66–88. [Google Scholar] [CrossRef]
- Seidel, D.J.; Gillett, N.P.; Lanzante, J.R.; Shine, K.P.; Thorne, P.W. Stratospheric temperature trends: Our evolving understanding. WIREs Clim. Chang. 2011, 2, 592–616. [Google Scholar] [CrossRef]
- Ho, S.-P.; Kuo, Y.-H.; Zeng, Z.; Peterson, T.C. A comparison of lower stratosphere temperature from microwave measurements with CHAMP GPS RO data. Geophys. Res. Lett. 2007, 34, 1–5. [Google Scholar] [CrossRef] [Green Version]
- Steiner, A.K.; Lackner, B.C.; Ladstädter, F.; Scherllin-Pirscher, B.; Foelsche, U.; Kirchengast, G. GPS radio occultation for climate monitoring and change detection. Radio Sci. 2011, 46, 1–17. [Google Scholar] [CrossRef] [Green Version]
- Khaykin, S.M.; Funatsu, B.M.; Hauchecorne, A.; Godin-Beekmann, S.; Claud, C.; Keckhut, P.; Pazmino, A.; Gleisner, H.; Nielsen, J.K.; Syndergaard, S.; et al. Post-millennium changes in stratospheric temperature consistently resolved by GPS radio occultation and AMSU observations. Geophys. Res. Lett. 2017, 44, 7510–7518. [Google Scholar] [CrossRef]
- Han, Y.; Revercomb, H.; Cromp, M.; Gu, D.; Johnson, D.; Mooney, D.; Scott, D.; Strow, L.; Bingham, G.; Borg, L.; et al. Suomi NPP CrIS measurements, sensor data record algorithm, calibration and validation activities, and record data quality. J. Geophys. Res. Atmos. 2013, 118, 12734–12748. [Google Scholar] [CrossRef]
- JPSS Configuration Management Office. Joint Polar Satellite System (JPSS) Cross Track Infrared Sounder (CrIS) Sensor Data Records (SDR) Algorithm Theoretical Basis Document (ATBD) for Normal Spectral Resolution, JPSS Office, Document Code D0001-M01-S002. Available online: https://www.star.nesdis.noaa.gov/jpss/documents/ATBD/D0001-M01-S01-002_JPSS_ATBD_CRIS-SDR_nsr_20180614.pdf (accessed on 28 July 2020).
- Tobin, D.; Revercomb, H.; Knuteson, R.; Taylor, J.; Best, F.; Borg, L.; DeSlover, D.; Martin, G.; Buijs, H.; Esplin, M.; et al. Suomi-NPP CrIS radiometric calibration uncertainty. J. Geophys. Res. Atmos. 2013, 118, 10,589–10,600. [Google Scholar] [CrossRef]
- Strow, L.L.; Motteler, H.; Tobin, D.; Revercomb, H.; Hannon, S.; Buijs, H.; Predina, J.; Suwinski, L.; Glumb, R. Spectral calibration and validation of the Cross-track Infrared Sounder on the Suomi NPP satellite. J. Geophys. Res. Atmos. 2013, 118, 12486–12496. [Google Scholar] [CrossRef]
- Chen, Y.; Han, Y.; Weng, F. Characterization of long-term stability of Suomi NPP Cross-Track Infrared Sounder spectral calibration. IEEE Trans. Geosci. Remote Sens. 2017, 55, 1147–1159. [Google Scholar] [CrossRef]
- Zavyalov, V.; Esplin, M.; Scott, D.; Esplin, B.; Bingham, G.; Hoffman, E.; Lietzke, C.; Predina, J.; Frain, R.; Suwinski, L.; et al. Noise performance of the CrIS instrument. J. Geophys. Res. Atmos. 2013, 118, 13108–13120. [Google Scholar] [CrossRef] [Green Version]
- Wang, L.; Zhang, B.; Tremblay, D.; Han, Y. Improved scheme for Cross-track Infrared Sounder geolocation assessment and optimization. J. Geophys. Res. Atmos. 2016, 122, 519–536. [Google Scholar] [CrossRef]
- Han, Y.; Chen, Y. Calibration algorithm for Cross-Track Infrared Sounder full spectral resolution measurements. IEEE Trans. Geosci. Remote Sens. 2018, 56, 1008–1016. [Google Scholar] [CrossRef]
- Dittman, M.G.; Ramberg, E.; Chrisp, M.; Rodriguez, J.V.; Sparks, A.L.; Zaun, N.H.; Hendershot, P.; Dixon, T.; Philbrick, R.H.; Wasinger, D. Nadir ultraviolet imaging spectrometer for the NPOESS Ozone Mapping and Profiler Suite (OMPS). In Proceedings of the International Symposium on Optical Science and Technology, SPIE Proceedings 4814, 2002, Earth Observing Systems VII. Seattle, WA, USA, 24 September 2002; William, L.B., Ed.; pp. 111–119. [Google Scholar]
- Seftor, C.J.; Jaross, G.; Kowitt, M.; Haken, M.; Li, J.; Flynn, L.E. Postlaunch performance of the Suomi National Polar-orbiting Partnership Ozone Mapping and Profiler Suite (OMPS) nadir sensors. J. Geophys. Res. Atmos. 2014, 119, 4413–4428. [Google Scholar] [CrossRef] [Green Version]
- McClain, S.C.; Maymon, P.W.; Chipman, R.A. Design and analysis of a depolarizer for the NASA Moderate Resolution Imaging Spectrometer—Tilt (MODIS-T). Proc. SPIE 1992, 1746, 375–385. [Google Scholar]
- Bhartia, P.K.; McPeters, R.D.; Flynn, L.E.; Taylor, S.; Kramarova, N.A.; Frith, S.; Fisher, B.; DeLand, M. Solar Backscatter UV (SBUV) total ozone and profile algorithm. Atmos. Meas. Tech. 2013, 6, 2533–2548. [Google Scholar] [CrossRef] [Green Version]
- Rodriguez, J.V.; Seftor, C.J.; Wellemeyer, C.G.; Chance, K. An overview of the nadir sensor and algorithms for the NPOESS ozone mapping and profiler suite (OMPS). Proc. SPIE 2003, 4891, 65–75. [Google Scholar]
- Pan, C.; Weng, F.; Beck, T.; Flynn, L.; Ding, S. Recent improvements to Suomi NPP Ozone Mapper Profiler Suite nadir mapper sensor data records. IEEE Trans. Geosci. Remote Sens. 2017, 99, 1–7. [Google Scholar] [CrossRef]
- Pan, C.; Weng, F.; Flynn, L. Spectral performance and calibration of the Suomi NPP OMPS Nadir Profiler sensor. Earth Space Sci. 2017, 4, 737–745. [Google Scholar] [CrossRef]
- McPeters, R.D.; Frith, S.; Labow, G.J. OMI total column ozone: Extending the long-term data record. Atmos. Meas. Tech. 2015, 8, 4845–4850. [Google Scholar] [CrossRef] [Green Version]
- McPeters, R.D.; Bhartia, P.K.; Haffner, D.; Labow, G.J.; Flynn, L. The version 8.6 SBUV ozone data record: An overview. J. Geophys. Res. Atmos. 2013, 118, 8032–8039. [Google Scholar] [CrossRef] [Green Version]
- Cao, C.; Xiong, X.J.; Wolfe, R.; DeLuccia, F.; Liu, Q.M.; Blonski, S.; Lin, G.G.; Nishihama, M.; Pogorzala, D.; Oudrari, H.; et al. Visible Infrared Imaging Radiometer Suite (VIIRS) Sensor Data Record (SDR) User’s Guide, Version 1.2; NOAA Technical Report NESDIS 142A; NESDIS/NOAA/Department of Commerce: Washington, DC, USA, 2013; 46p.
- Cao, C.; Xiong, J.; Blonski, S.; Liu, Q.; Uprety, S.; Shao, X.; Bai, Y.; Weng, F. Suomi NPP VIIRS sensor data record verification, validation, and long-term performance monitoring. J. Geophys. Res. Atmos. 2013, 118, 11,664–11,678. [Google Scholar] [CrossRef]
- Cao, C.; DeLuccia, F.; Xiong, X.; Wolfe, R.; Weng, F. Early on-orbit performance of the Visible Infrared Imaging Radiometer Suite (VIIRS) onboard the Suomi National Polar-orbiting Partnership (S-NPP) satellite. IEEE Trans. Geosci. Remote Sens. 2014, 52, 1142–1156. [Google Scholar] [CrossRef] [Green Version]
- VIIRS ATBD, Joint Polar Satellite System (JPSS) Visible Infrared Imaging Radiometer Suite (VIIRS) Sensor Data Records (SDR) Algorithm Theoretical Basis Document (ATBD). 2013. Available online: https://ncc.nesdis.noaa.gov/documents/documentation/ATBD-VIIRS-RadiometricCal_20131212.pdf (accessed on 28 July 2020).
- Cao, C.; Bai, Y. Quantitative analysis of VIIRS DNB nightlight point source for light power estimation and stability monitoring. Remote Sens. 2014, 6, 11915–11935. [Google Scholar] [CrossRef] [Green Version]
- Cao, C.; Bai, Y.; Wang, W.; Choi, T. Radiometric inter-consistency of VIIRS DNB on Suomi NPP and NOAA-20 from observations of reflected lunar lights over deep convective clouds. Remote Sens. 2019, 11, 934. [Google Scholar] [CrossRef] [Green Version]
- Uprety, S.; Cao, C.; Gu, Y.; Shao, X.; Blonski, S.; Zhang, B. Calibration improvements in S-NPP VIIRS DNB Sensor Data Record using version 2 reprocessing. IEEE Trans. Geosci. Remote Sens. 2019, 57, 9602–9611. [Google Scholar] [CrossRef]
- Choi, T.; Shao, X.; Cao, C.; Weng, F. Radiometric Stability Monitoring of the Suomi NPP Visible Infrared Imaging Radiometer Suite (VIIRS) Reflective Solar Bands Using the Moon. Remote Sens. 2016, 88, 15. [Google Scholar] [CrossRef] [Green Version]
- Xiong, X.; Bulter, J.; Chiang, K.; Efremova, B.; Fulbright, J.; Lei, N.; Mclntire, J.; Oudrari, H.; Sun, J.; Wang, Z.; et al. VIIRS on-orbit calibration methodology and performance. J. Geophys. Res. Atmos. 2014, 119, 5065–5078. [Google Scholar] [CrossRef]
- Blonski, S.; Cao, C. Suomi NPP VIIRS Reflective Solar Bands operational calibration reprocessing. Remote Sens. 2015, 7, 16131–16149. [Google Scholar] [CrossRef] [Green Version]
- Uprety, S.; Cao, C.; Xiong, X.; Wang, W.; Zhang, B.; Choi, T.; Blonski, S.; Shao, X. Improving S-NPP VIIRS Reflective Solar Band (RSB) calibration accuracy through reprocessing. In Global Space-Based Inter-Calibration System (GSICS) Quarterly Newsletter; 2018; Volume 12, p. 15. Available online: https://repository.library.noaa.gov/view/noaa/19087 (accessed on 5 September 2020). [CrossRef]
- Sun, J.; Wang, M. VIIRS reflective solar bands calibration progress and its impact on ocean color products. Remote Sens. 2016, 8, 194. [Google Scholar] [CrossRef] [Green Version]
- Cao, C.; Wang, W.; Blonski, S.; Zhang, B. Radiometric traceability diagnosis and bias correction for the Suomi NPP VIIRS long-wave infrared channels during blackbody unsteady states. J. Geophys. Res. Atmos. 2017, 122, 5285–5297. [Google Scholar] [CrossRef]
- Wang, W.; Cao, C.; Ignatov, A.; Liang, X.; Li, Z.; Wang, L.; Zhang, B.; Blonski, S.; Li, J. Improving the Calibration of Suomi NPP VIIRS Thermal Emissive Bands during Blackbody Warm-Up/Cool-Down. IEEE Trans. Geosci. Remote Sens. 2019, 57, 1977–1994. [Google Scholar] [CrossRef]
- Li, Y.; Wu, A.; Xiong, X. Inter-comparison of S-NPP VIIRS and Aqua MODIS thermal emissive bands using hyperspectral infrared sounder measurements as a transfer reference. Remote Sens. 2016, 8, 72. [Google Scholar] [CrossRef] [Green Version]
- Shao, X.; Cao, C.; Xiong, X.; Liu, T.; Zhang, B.; Uprety, S. Orbital variations and impacts on observations from S-NPP, NOAA 18-20, and AQUA sun-synchronous satellites. In Proceedings of the SPIE, 10764, 2018, Earth Observing Systems XXIII, 107641U. San Diego, CA, USA, 7 September 2018; 2018. [Google Scholar]
- Wolfe, R.E.; Lin, G.; Nishihama, M.; Tewari, K.P.; Tilton, J.C.; Isaacman, A.R. Suomi NPP VIIRS prelaunch and on-orbit geometric calibration and characterization. J. Geophys. Res. Atmos. 2013, 118, 11508–11521. [Google Scholar] [CrossRef] [Green Version]
- Wang, W.; Cao, C.; Bai, Y.; Blonski, S.; Schull, M.A. Assessment of the NOAA S-NPP VIIRS geolocation reprocessing improvements. Remote Sens. 2017, 9, 974. [Google Scholar] [CrossRef] [Green Version]
Figure 1.
(a) Monthly global mean brightness temperature anomaly time series for ATMS channel 8 from operational calibrated (blue) and reprocessed (red) sensor data records, and (b) their differences (green). The global means are calculated using limb-adjusted scan positions from 29 to 68 for both operational calibrated and reprocessed datasets. The limb-adjustment and data processing details can be found in Zou et al. (2018). The bias jump between the operational calibrated and reprocessed data found in March 2017 was caused by the calibration update for the operational calibration on 8 March 2017. After that date, the two datasets are identical since they use the same calibration algorithm.

Figure 2.
(a) Monthly global mean brightness temperature anomaly time series for AMSU-A channel 7 onboard Aqua (blue) versus ATMS channel 8 onboard Suomi National Polar-orbiting Partnership (S-NPP) (red), and (b) their difference time series (green). The AMSU-A and ATMS data are from June 2002 and December 2011 to April 2019, respectively. The AMSU-A anomaly time series are overlaid by ATMS during their overlapping period, with their differences shown as nearly a constant zero line in the same temperature scale. Amplified scale of temperature is used in (b) to show detailed features in the anomaly difference time series. The ATMS and AMSU-A data are from limb-adjusted scan positions of 29–68 and 8–23, respectively, and averaged over ascending and descending orbits. Uncertainties in trends represent 95% confidence intervals with autocorrelation adjustments.

Figure 3.
Time series of daily mean field of view (FOV)-to-FOV BT difference for the long-wave infrared (LWIR) band (17 channels averaged from 672 to 682 cm−1) with respect to the center FOV 5 for (a) the operational and (b) the reprocessed SDRs, respectively. The time series are for clear sky over ocean. Scan-angle-corrected SDR data from all scan angles were used in calculating the daily means. The scan-angle correction was based on Community Radiative Transfer Model (CRTM) simulations with inputs from the European Centre for Medium Range Weather Forecasts (ECMWF) analyses. The gap during the period 05/08/2014 to 06/16/2014 in the plots was caused by missing ECMWF analyses at National Oceanic and Atmospheric Administration (NOAA)/ Center for Satellite Applications and Research (STAR).

Figure 4.
Long-term absolute spectral accuracy and stability for the LWIR band for the reprocessed CrIS SDRs (green line with open circle), compared to the operational SDRs (blue line with open circle) and neon-calibration subsystem (red line, indicated by “Neon Cal”). The absolute spectral error was obtained by simulating radiances at the top of the atmosphere using radiative transfer models under clear conditions and then finding the maximum correlations between the observed and simulated radiance by shifting the spectra in a certain range. The simulation was for the daily average of FOV5 at nadir direction (FORs 15 or 16), descending orbit over clear tropical ocean scenes. The three dashed vertical lines represent major algorithm update events as described in the main text.

Figure 5.
Daily N-value (−100 log10(NR)) time series for data over the tropical region (20° S–20° N) for (a) the Nadir Mapper (NM) and (b) the Nadir Profiler (NP) instruments at selected channels. Update events of calibration look up tables (LUTs) listed in Table 3 and Table 4 are marked by the red vertical lines. Note that the channel wavelengths have errors as large as 0.1 nm for the operational SDRs due to improvement in wavelength scale calibration over time, and of less than 0.02 nm for the reprocessed SDRs.

Figure 6.
Comparison of the operational and reprocessed SDRs for a single day, 20 September 2012. (a) Daily average percentage differences of the solar irradiances versus wavelength between the operational and reprocessed SDRs; (b) similar differences but for the Earth radiances; (c) similar differences but for the N-values. The percentage differences are calculated with respect to the reprocessed data and the daily means are simple averages for 950 measured spectra with solar zenith angles less than 80 degrees.

Figure 7.
N-Values for NM (Δ and +) and NP (◇ and ✳☐) versus wavelength in the overlap spectral interval from 302 nm to 308 nm. The operational (solid lines) and reprocessed (dotted lines) SDRs are for the same day as used in Figure 6. The differences are calculated relative to fit quadratics which are smoothed functions of wavelength averaged over the operational or reprocessed NM and NP data.

Figure 8.
Upper panel: The reflectance monthly anomaly time series for the VIIRS reflective solar band (RSB) M5 for the reprocessed and operational SDRs over the Libya-4 desert calibration site, located in the Great Sand Sea. The anomaly values are computed as the reflectance minus an annual mean climatology derived from the reprocessed data from January 2012 to March 2017. Lower panel: The pixel-by-pixel reflectance ratio (reprocessed/operational) time series over the Libya-4 area. Jumps in time series correspond to events in algorithm changes or LUT updates. The thinner lines after mid-2014 show a better agreement in variability of individual pixels between the reprocessed and operational SDRs in comparison to those before mid-2014.

Figure 9.
Brightness−temperature difference time series pixel by pixel at nadir for the reprocessed minus operational SDRs for the M15 thermal band at the tropical site (142° E, 2° N). The red (black) dots are for the clear (cloudy) sky pixels where the brightness temperatures are greater (smaller) than 260 K. The warm-up/cool-down (WUCD) biases in the operational SDRs show up as regular spikes in the brightness temperature difference time series and they have been mostly mitigated in the reprocessing. Note that the WUCD anomalies occurred in both the clear and cloudy difference time series, but those in the latter were overlaid by the former in the plot.

Figure 10.
Monthly global mean time series of brightness temperatures for S-NPP VIIRS M15 and Aqua MODIS B31 bands (upper panel) and their difference (VIIRS-MODIS) time series (lower panel). Ascending and descending orbits are plotted separately. To minimize limb effects due to a large scan angle, only near-nadir pixels within a distance of 180 km were used for both MODIS and VIIRS. VIIRS data on 01/2012 were excluded due to insufficient observations.


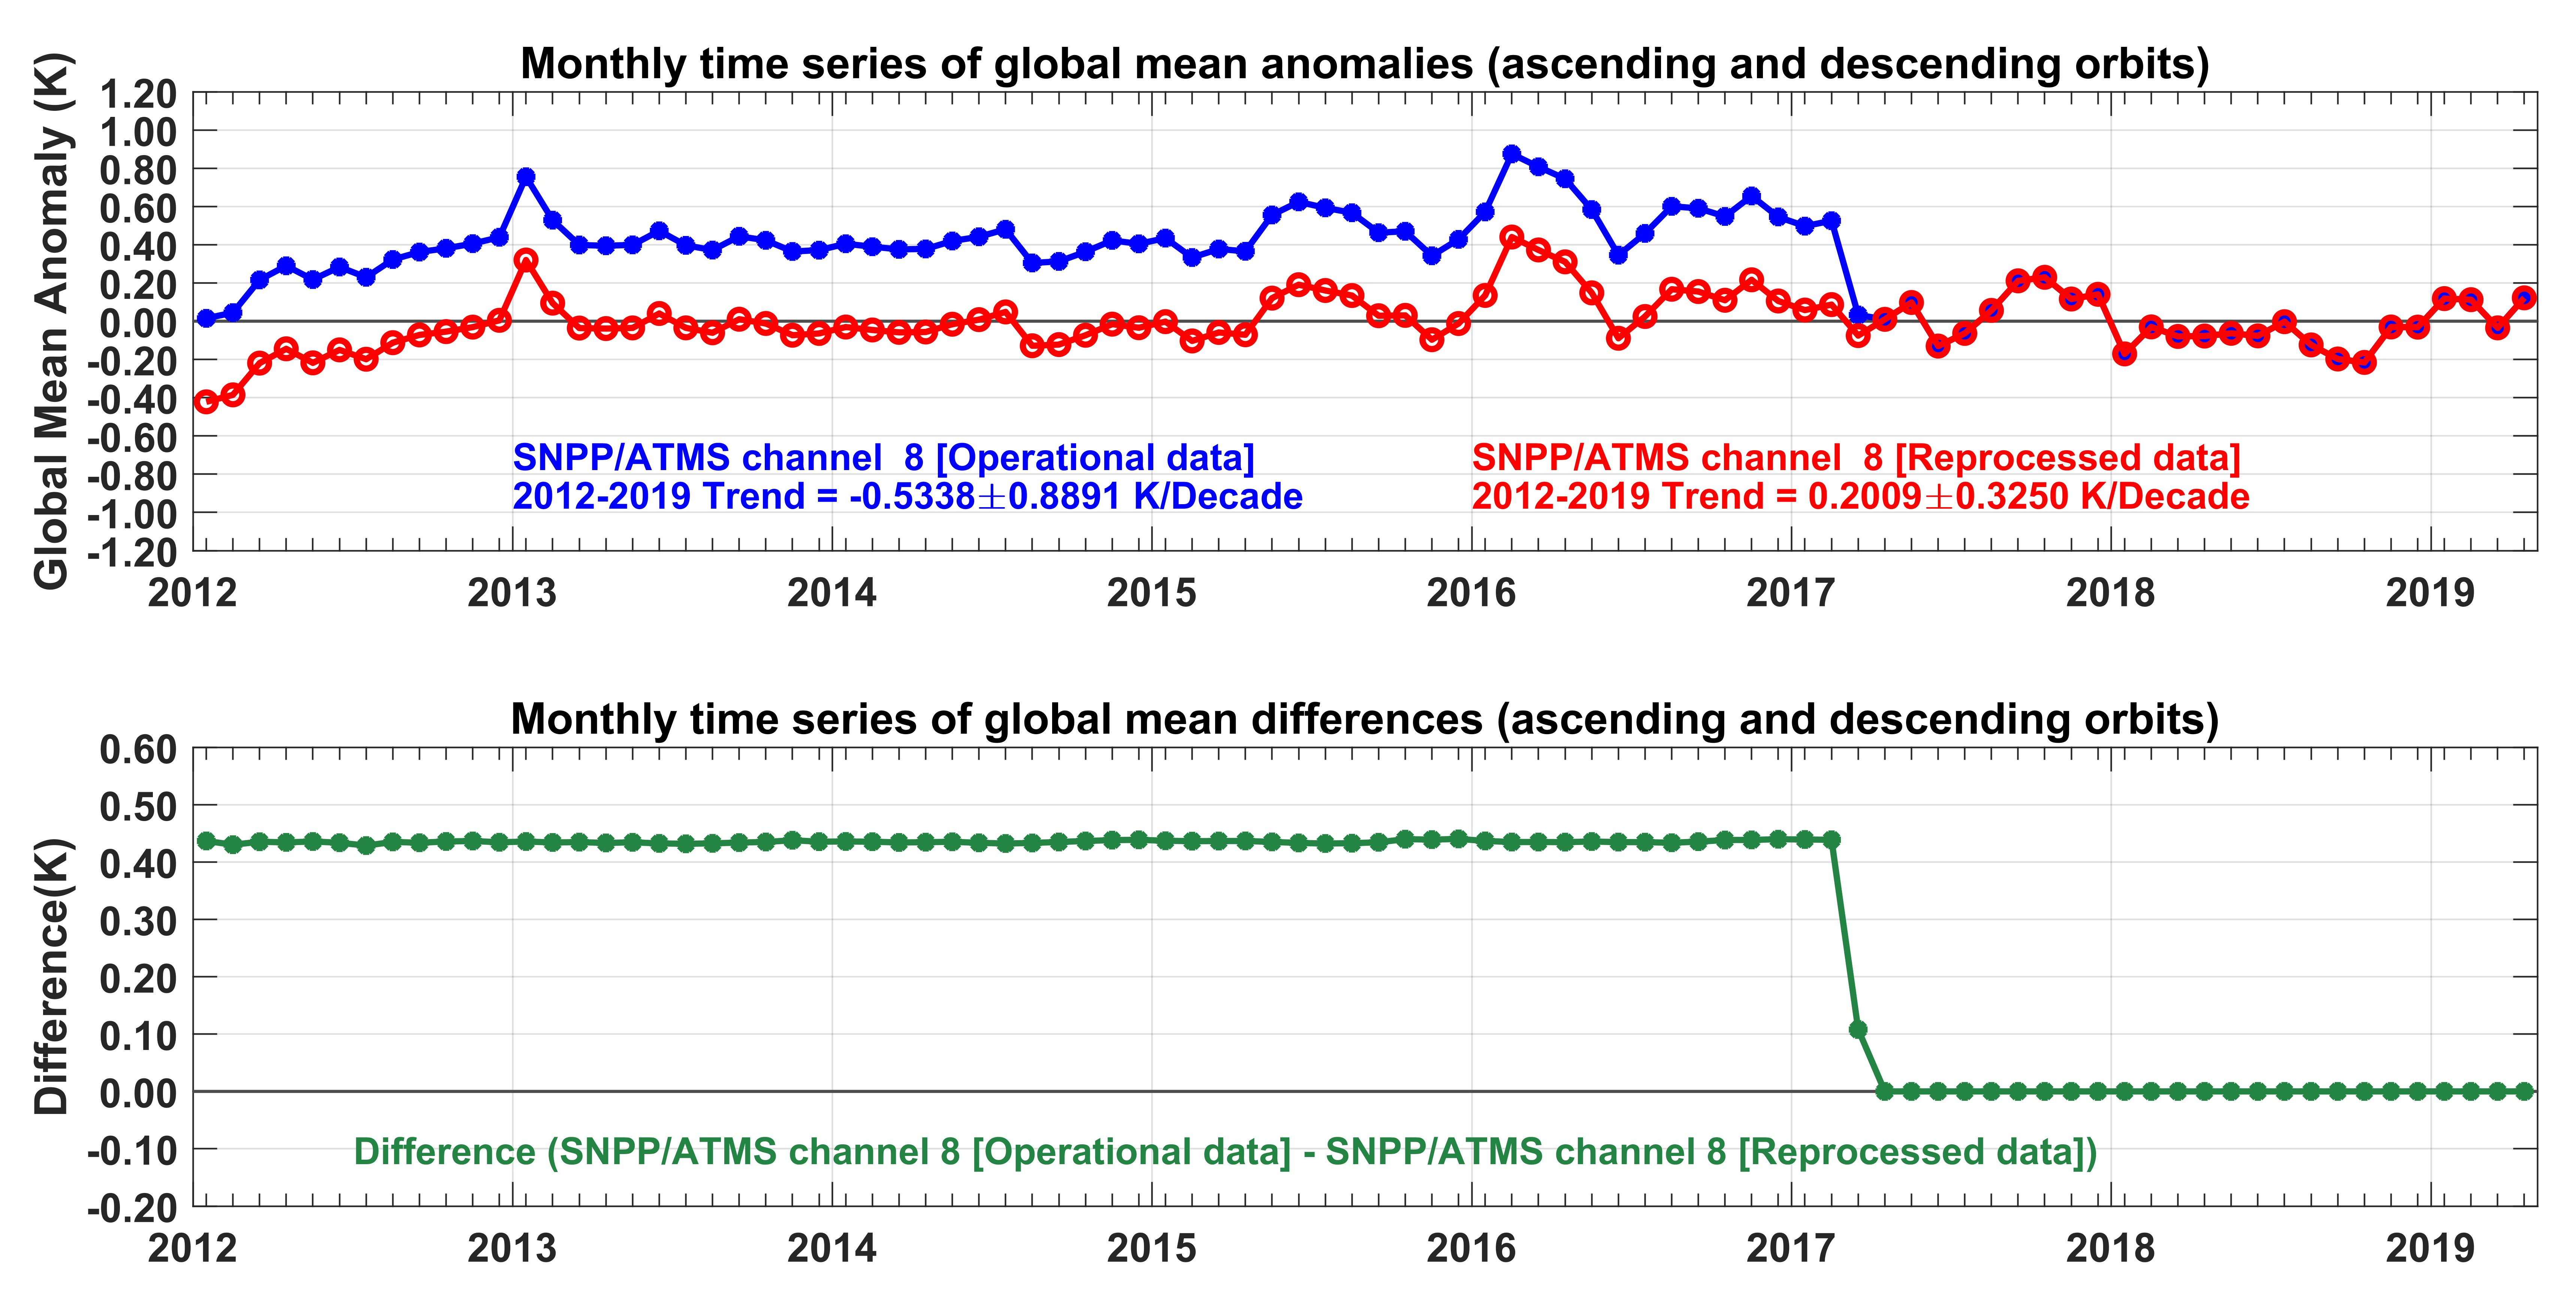
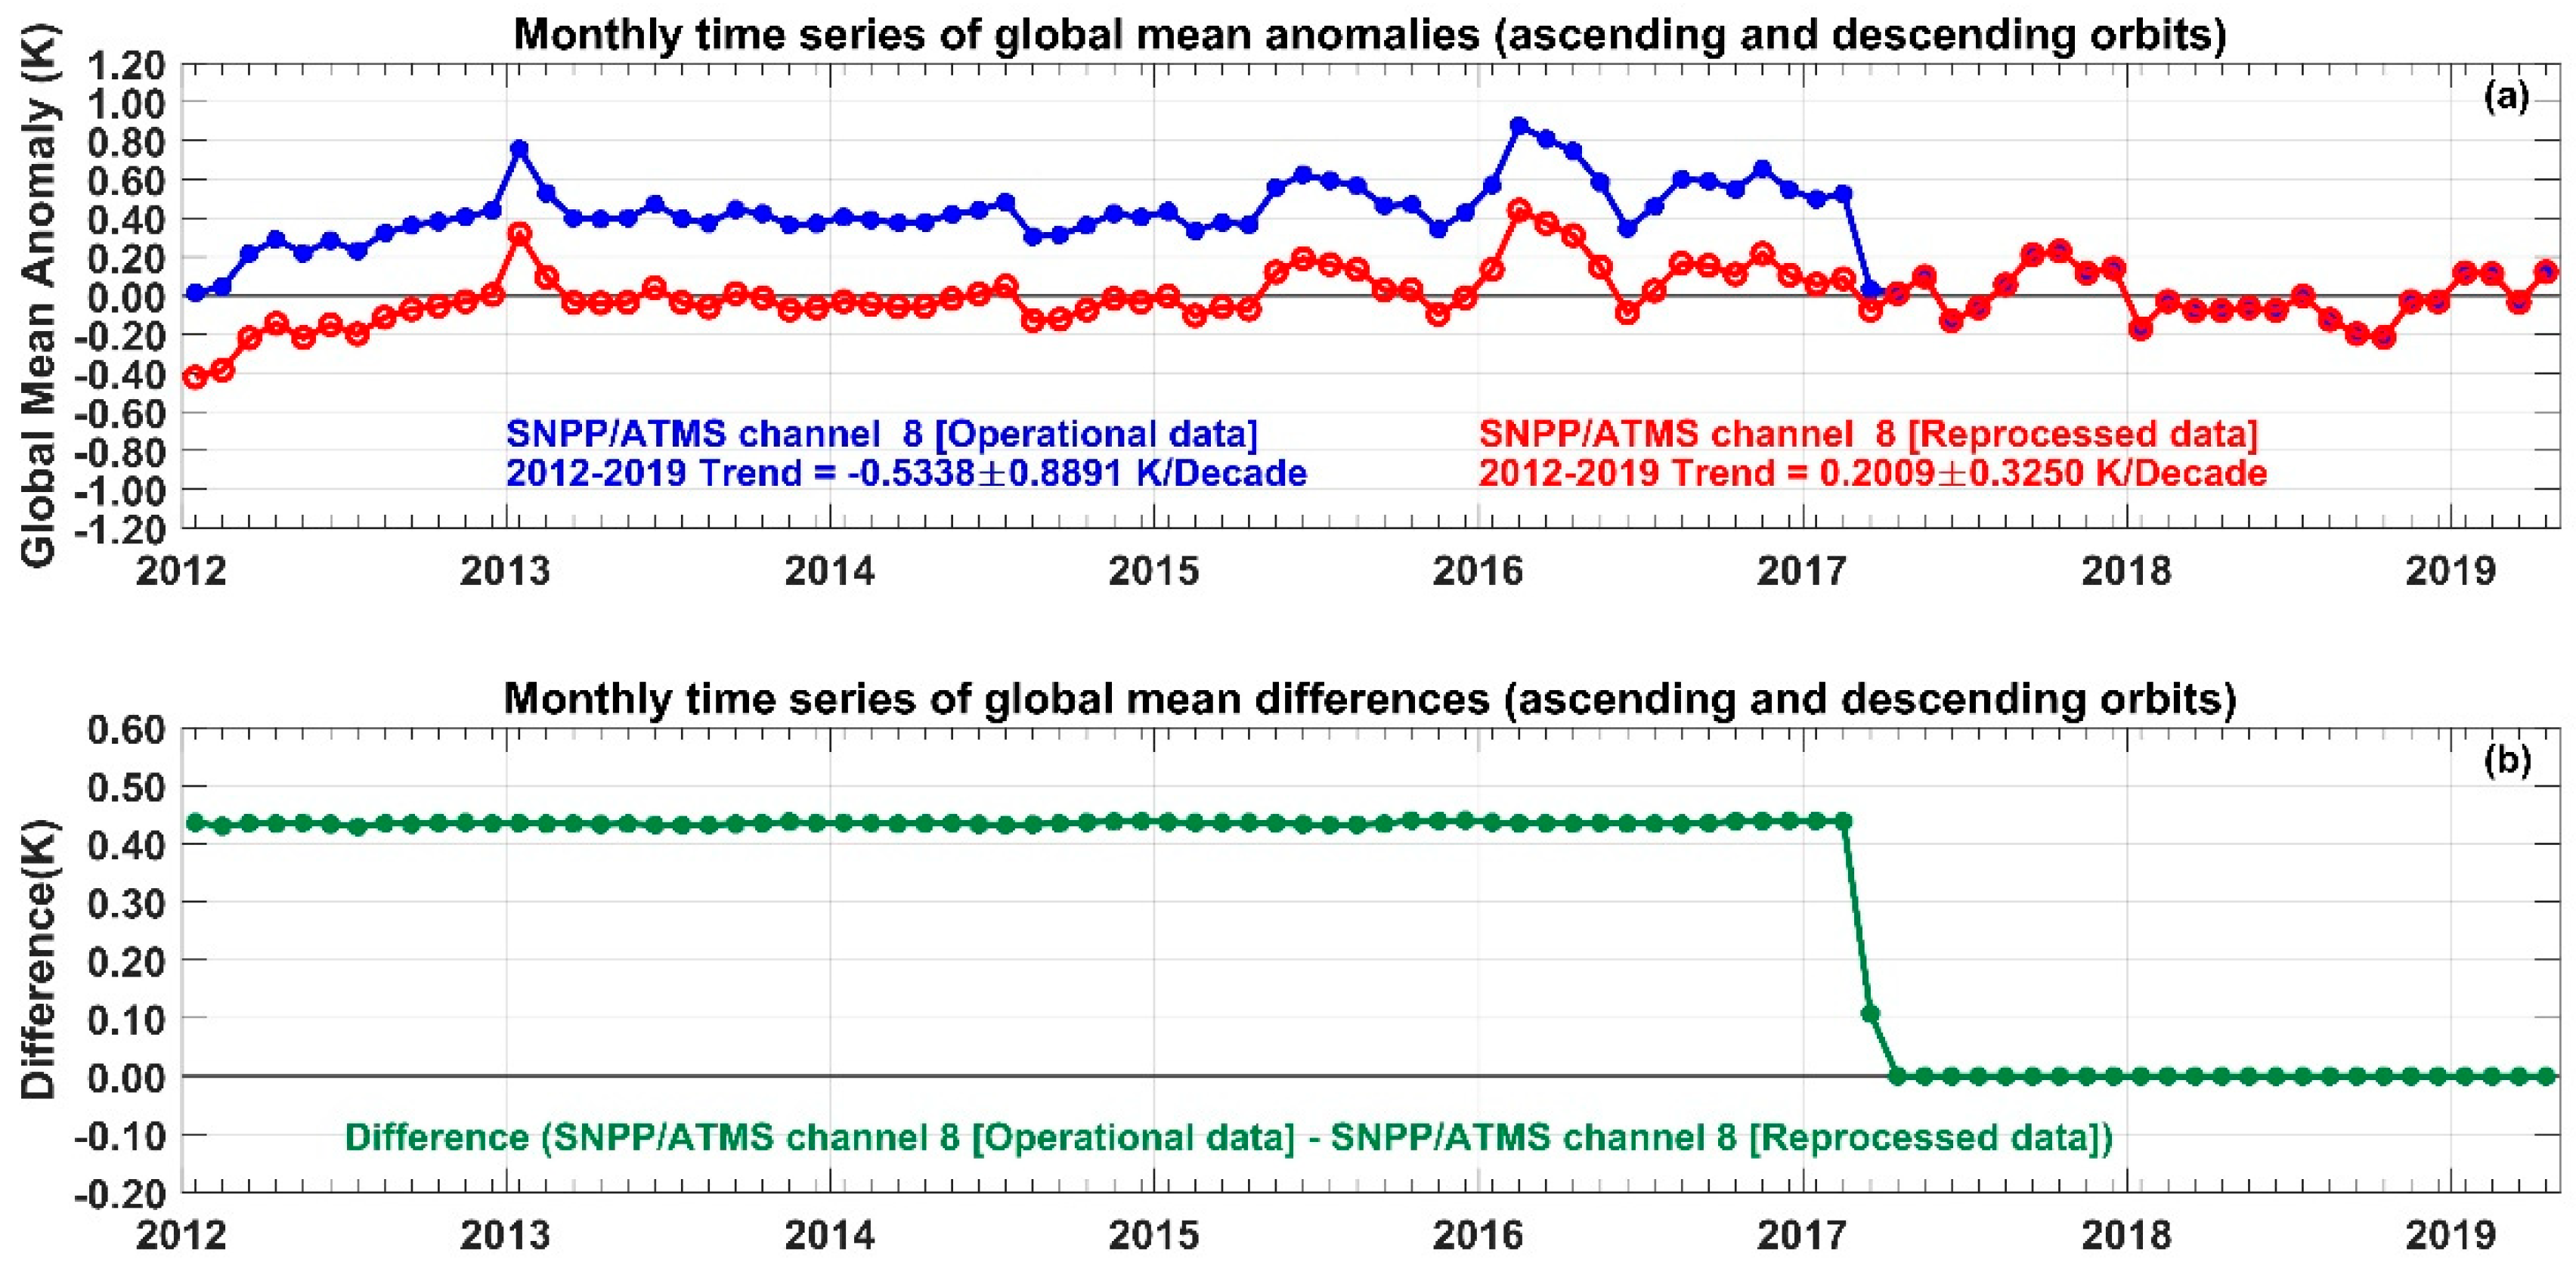
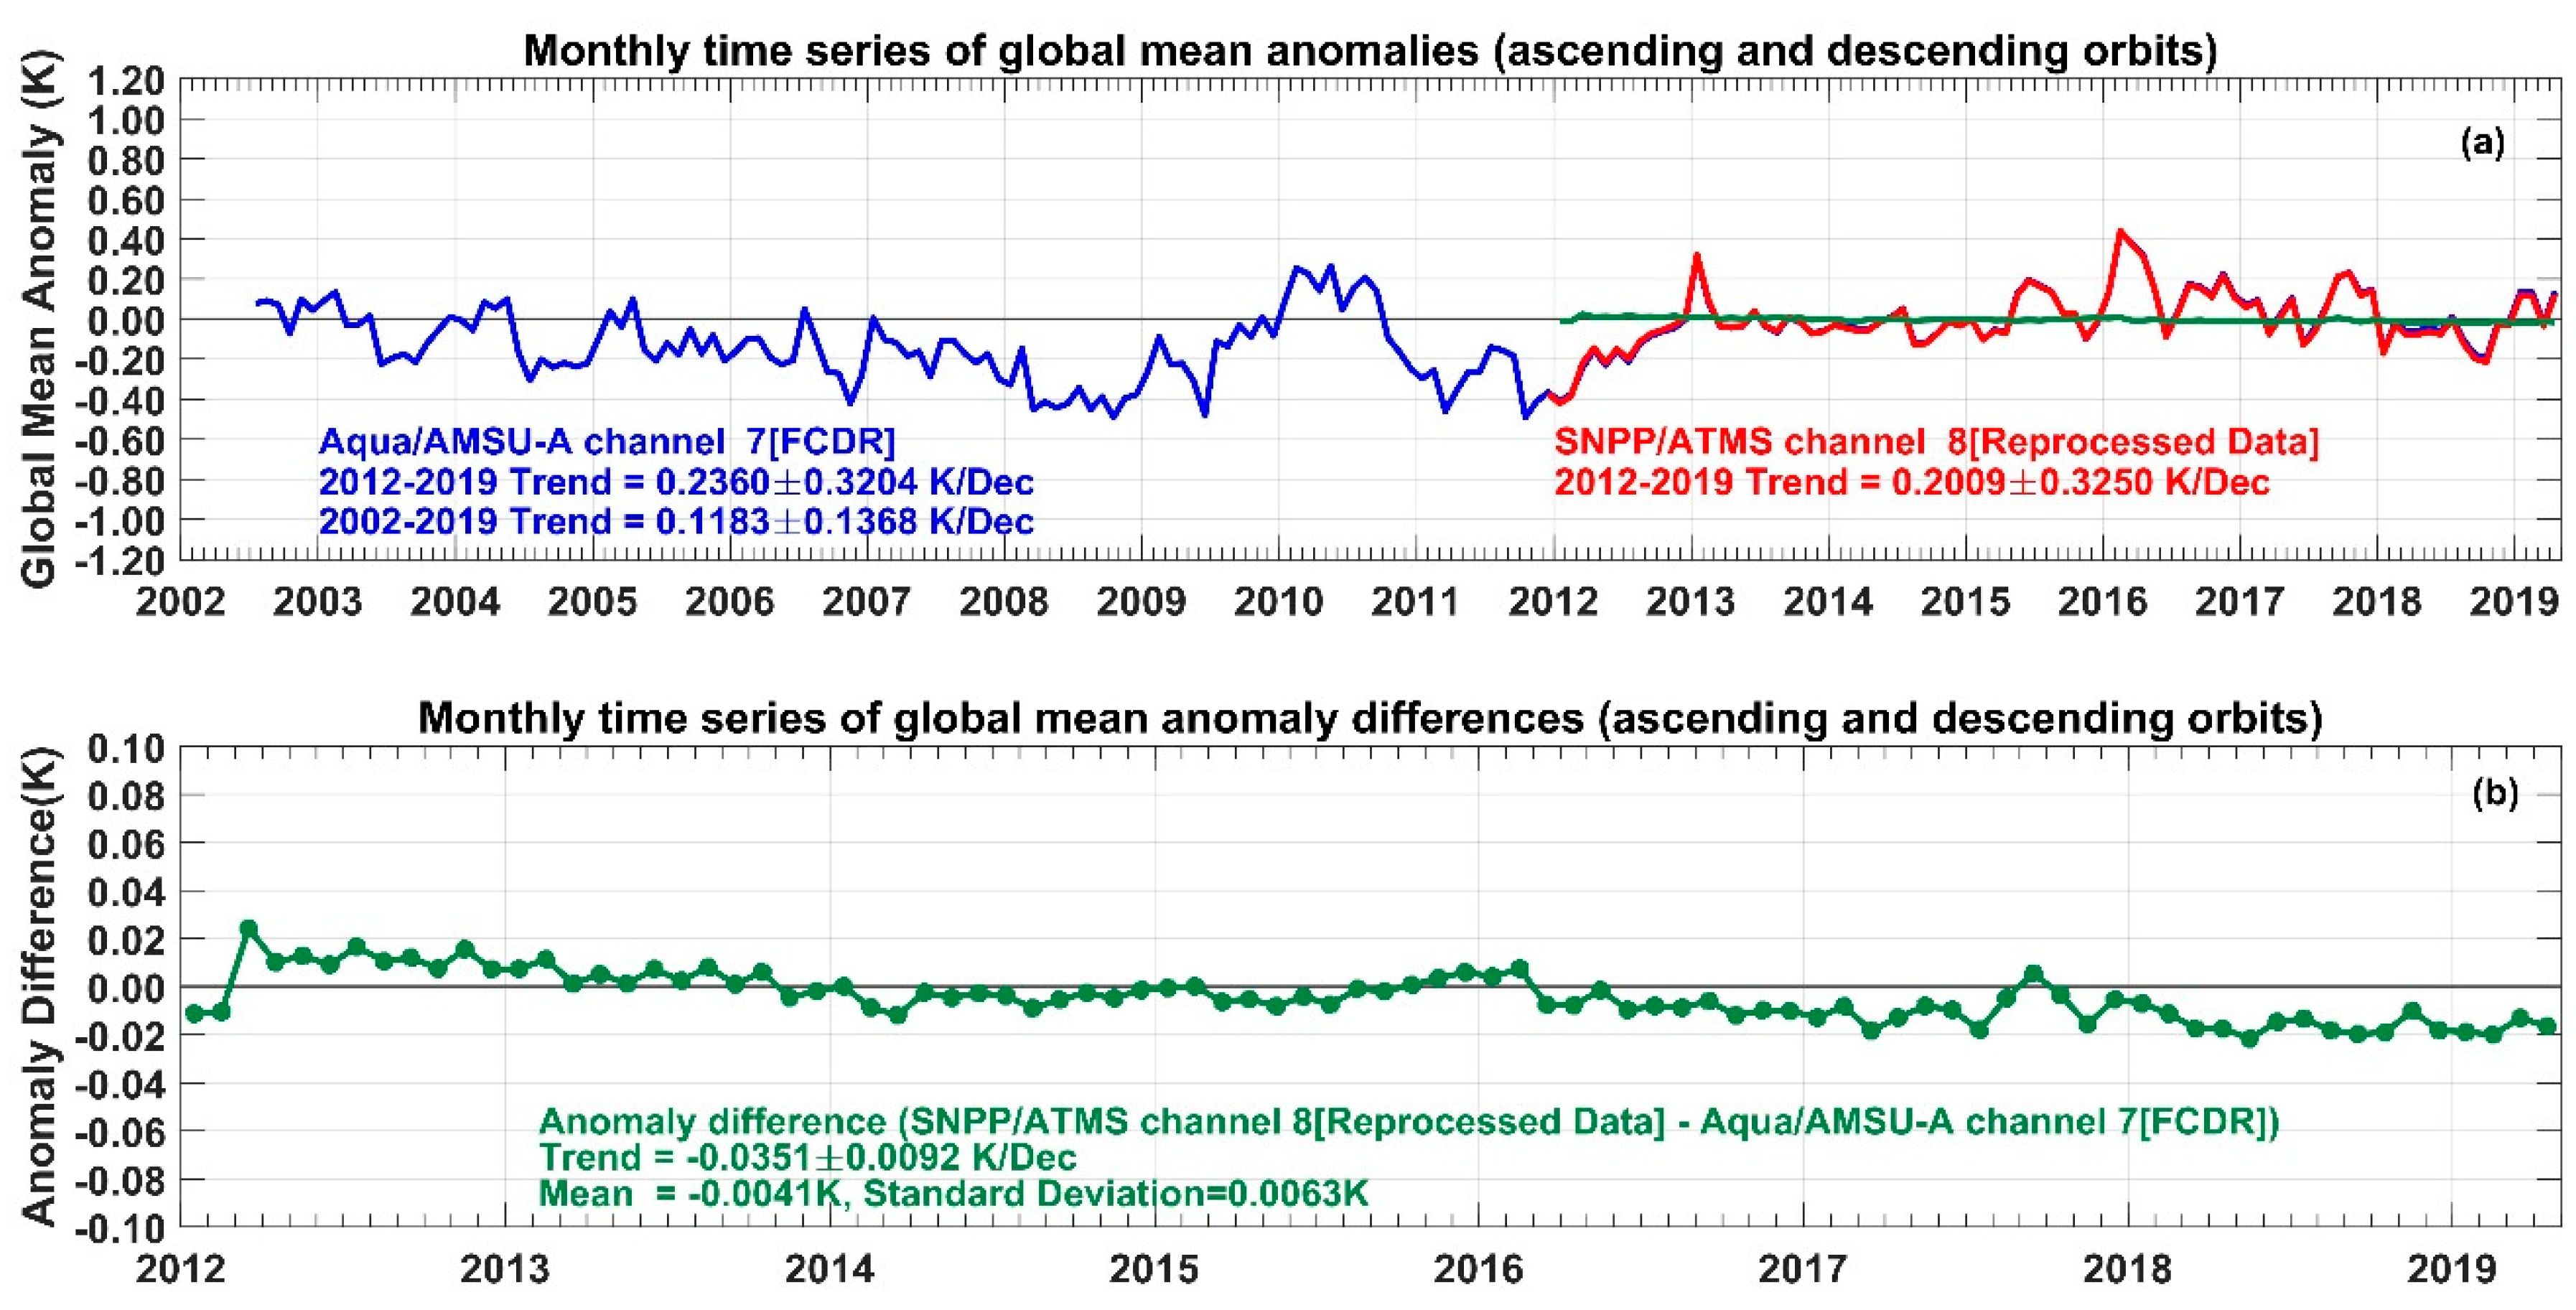
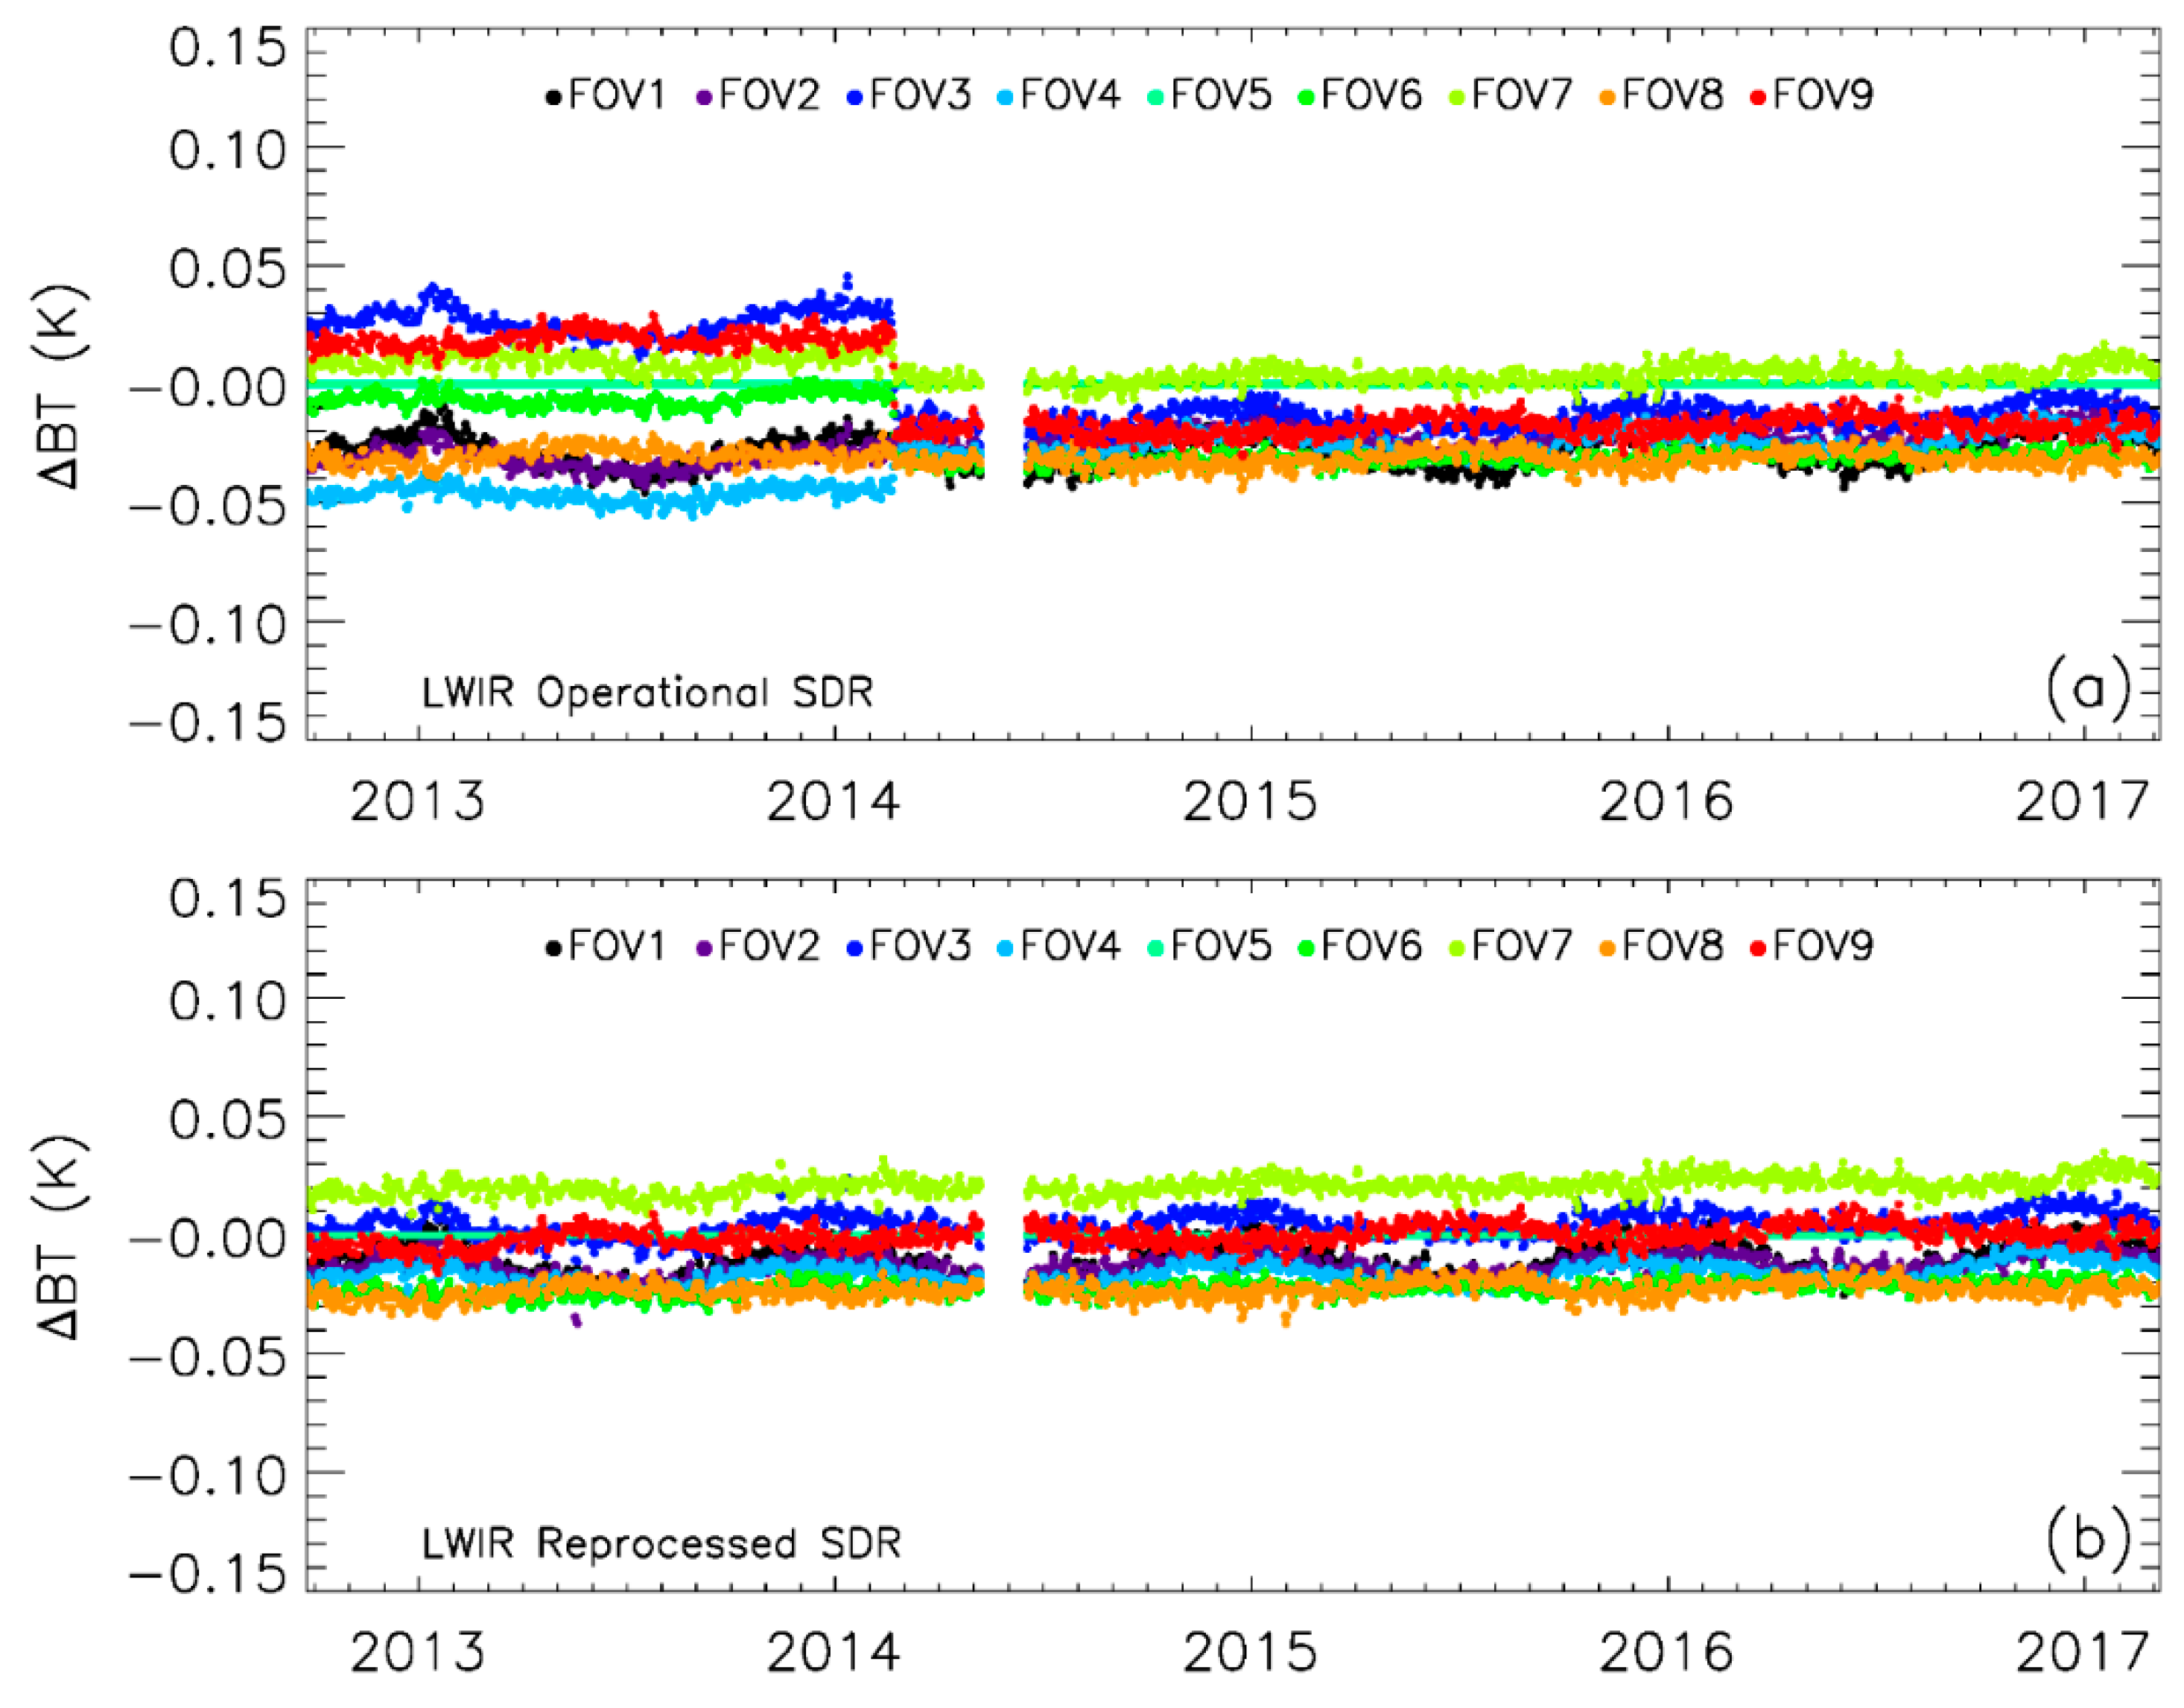
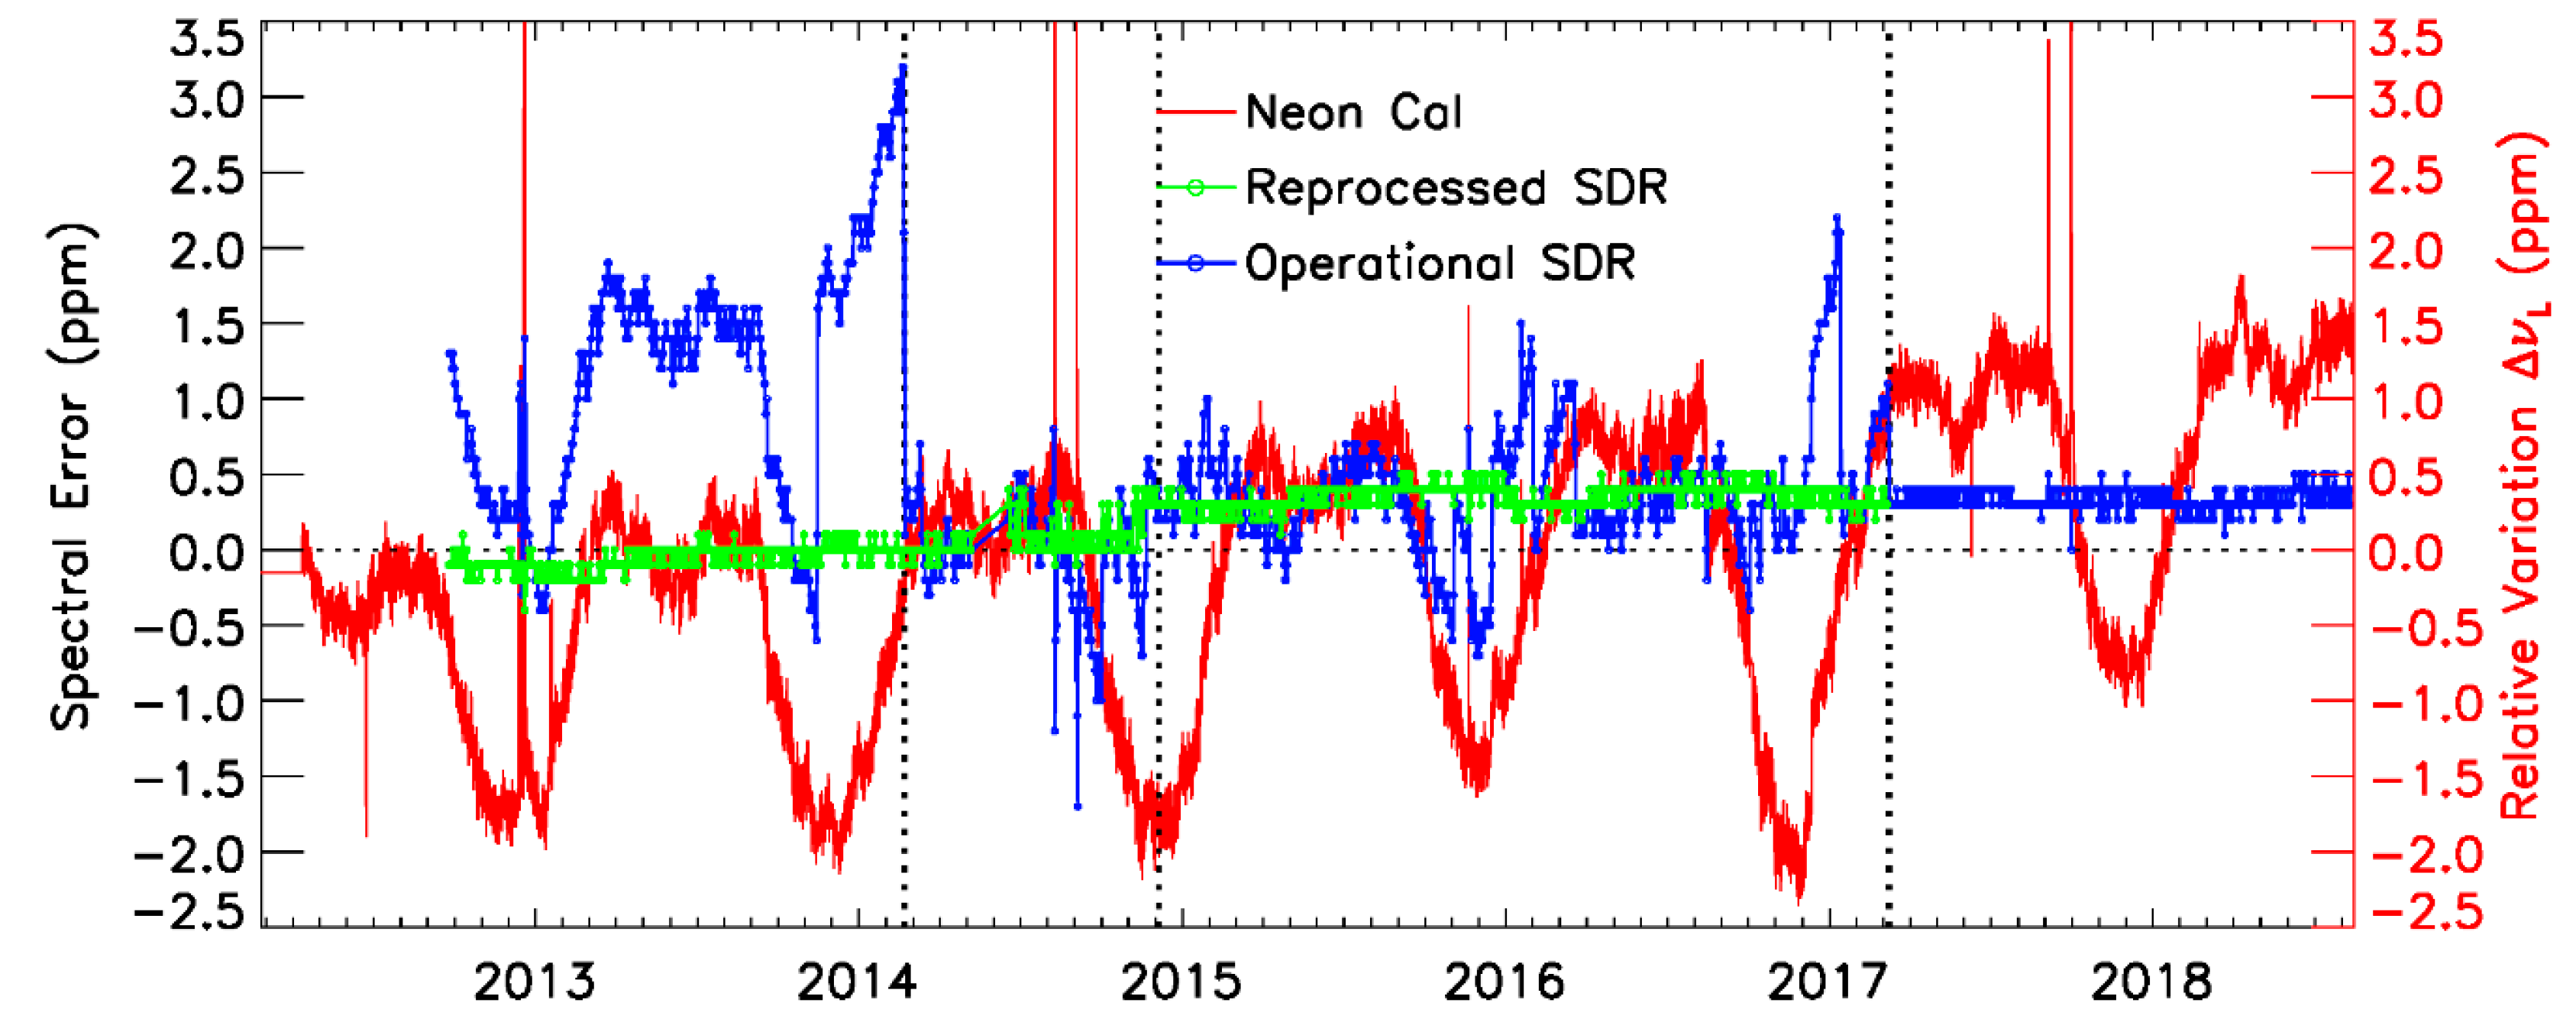
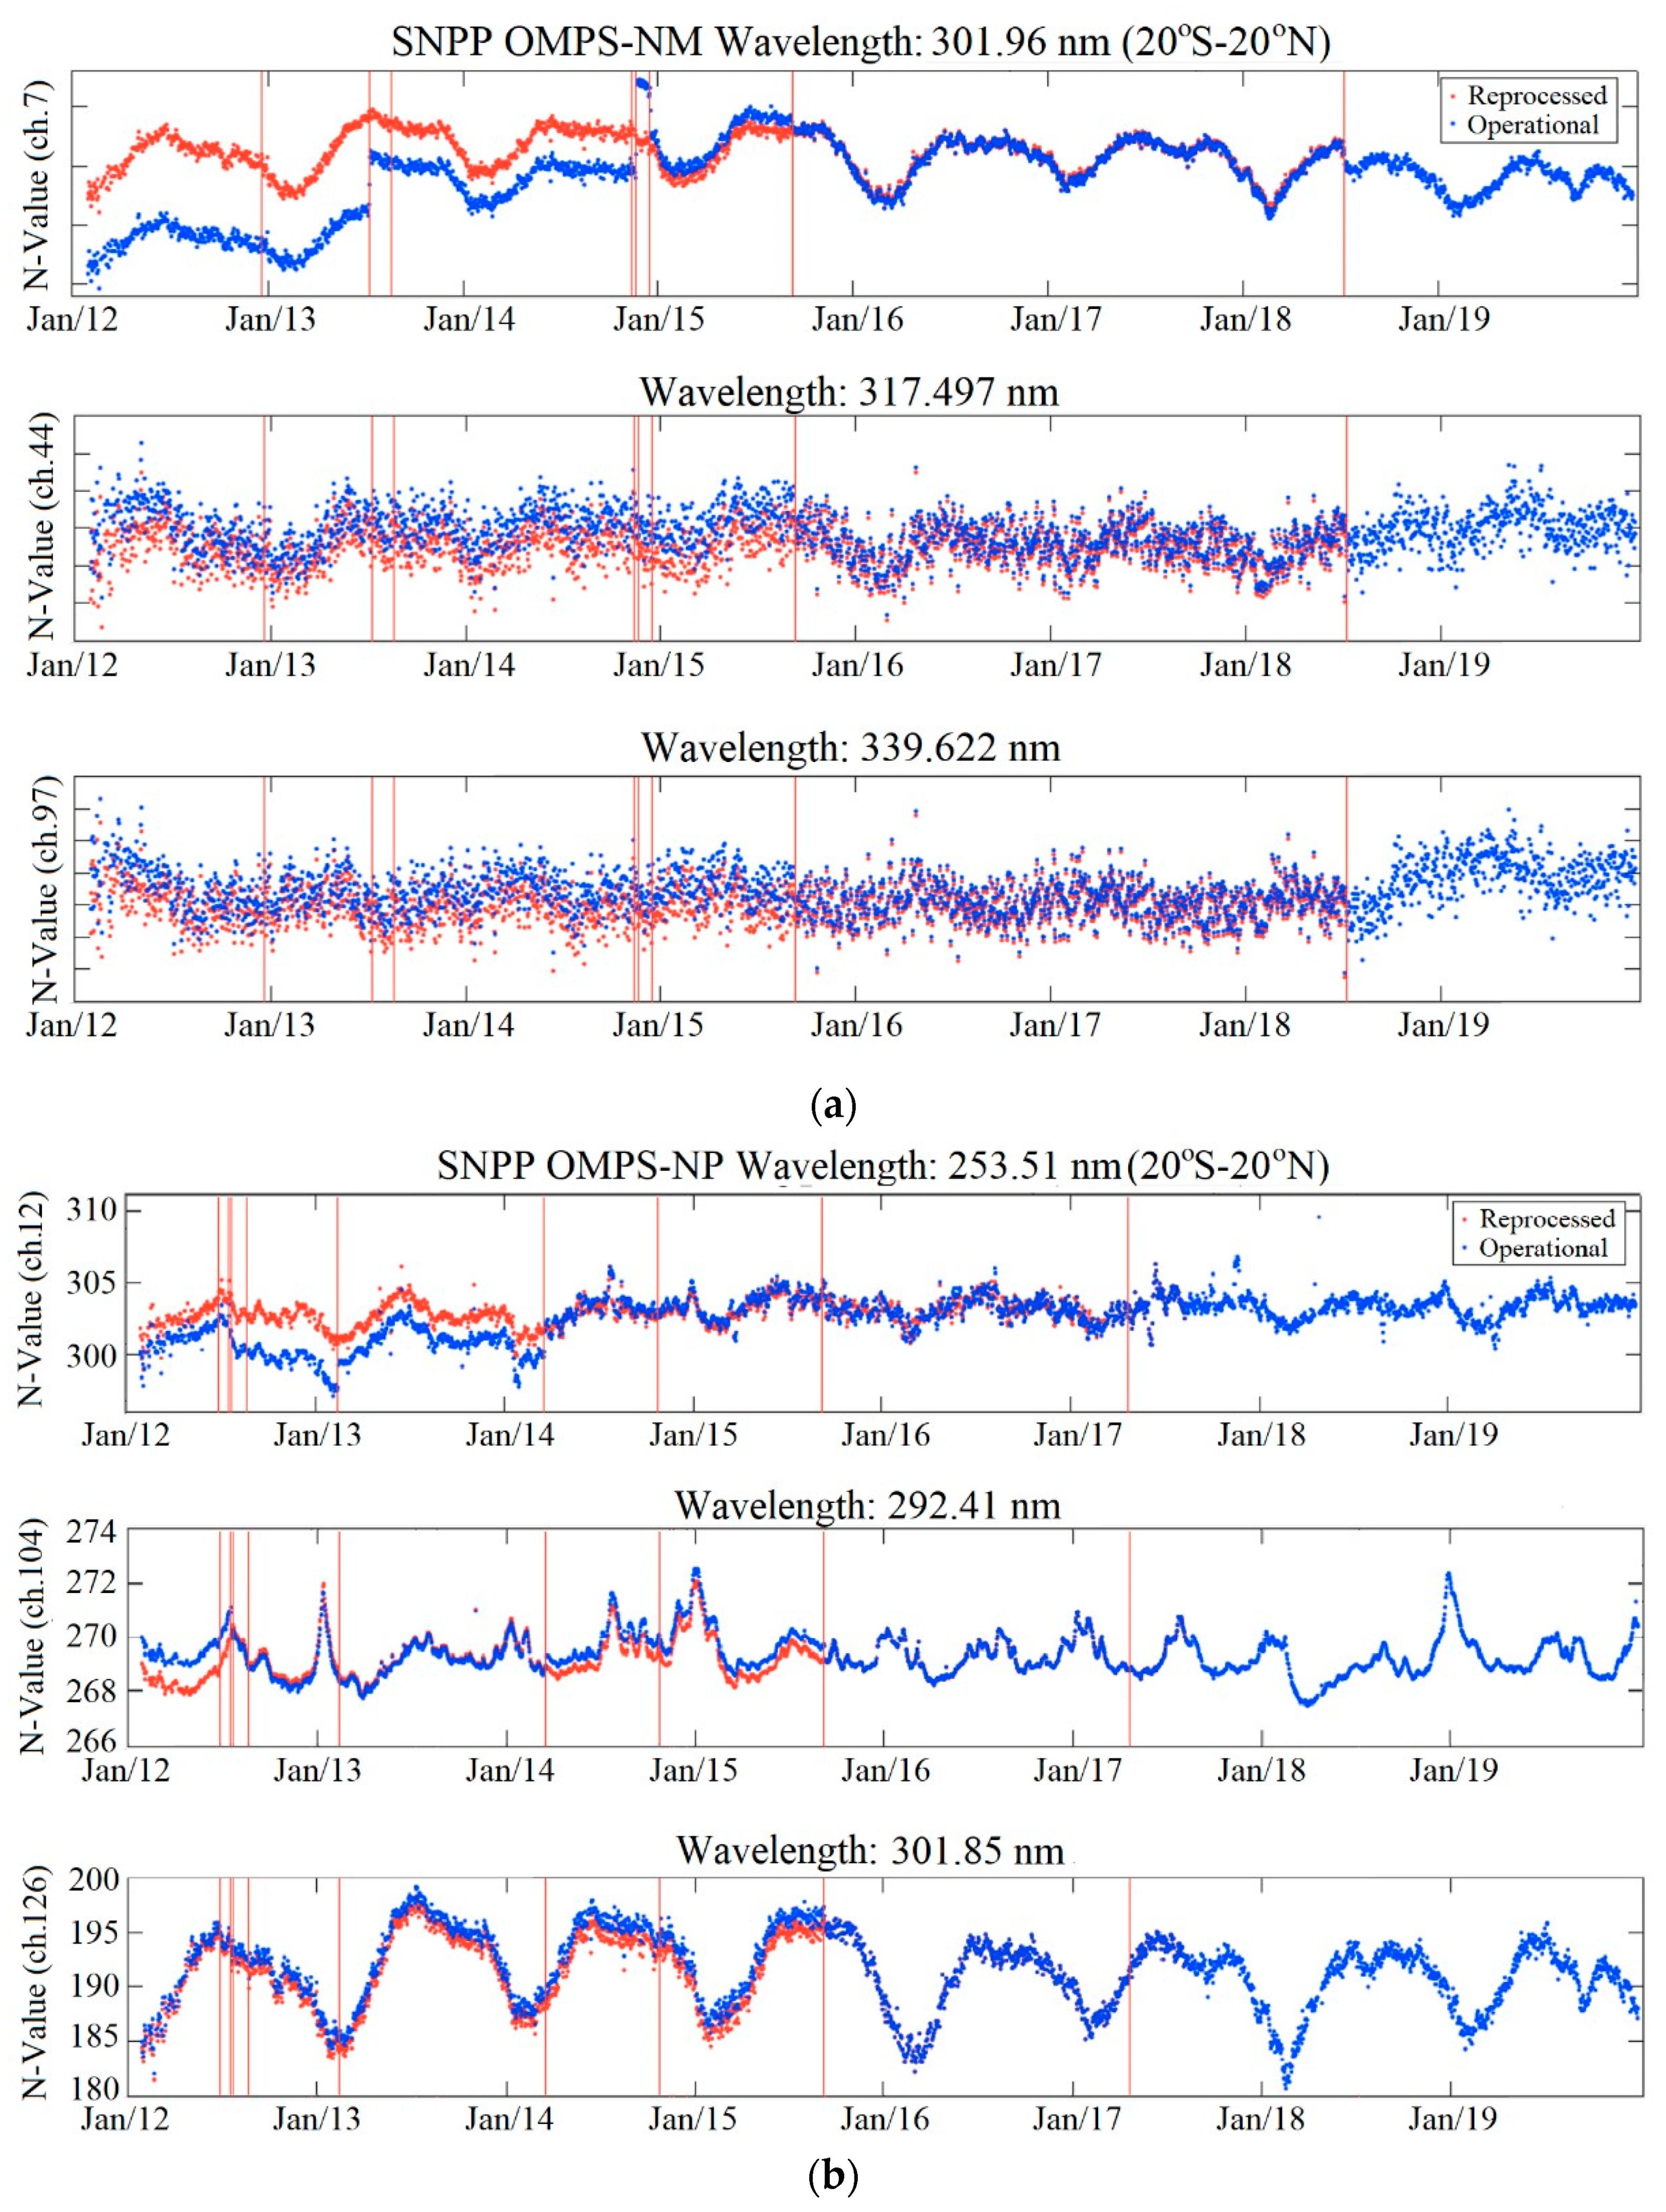
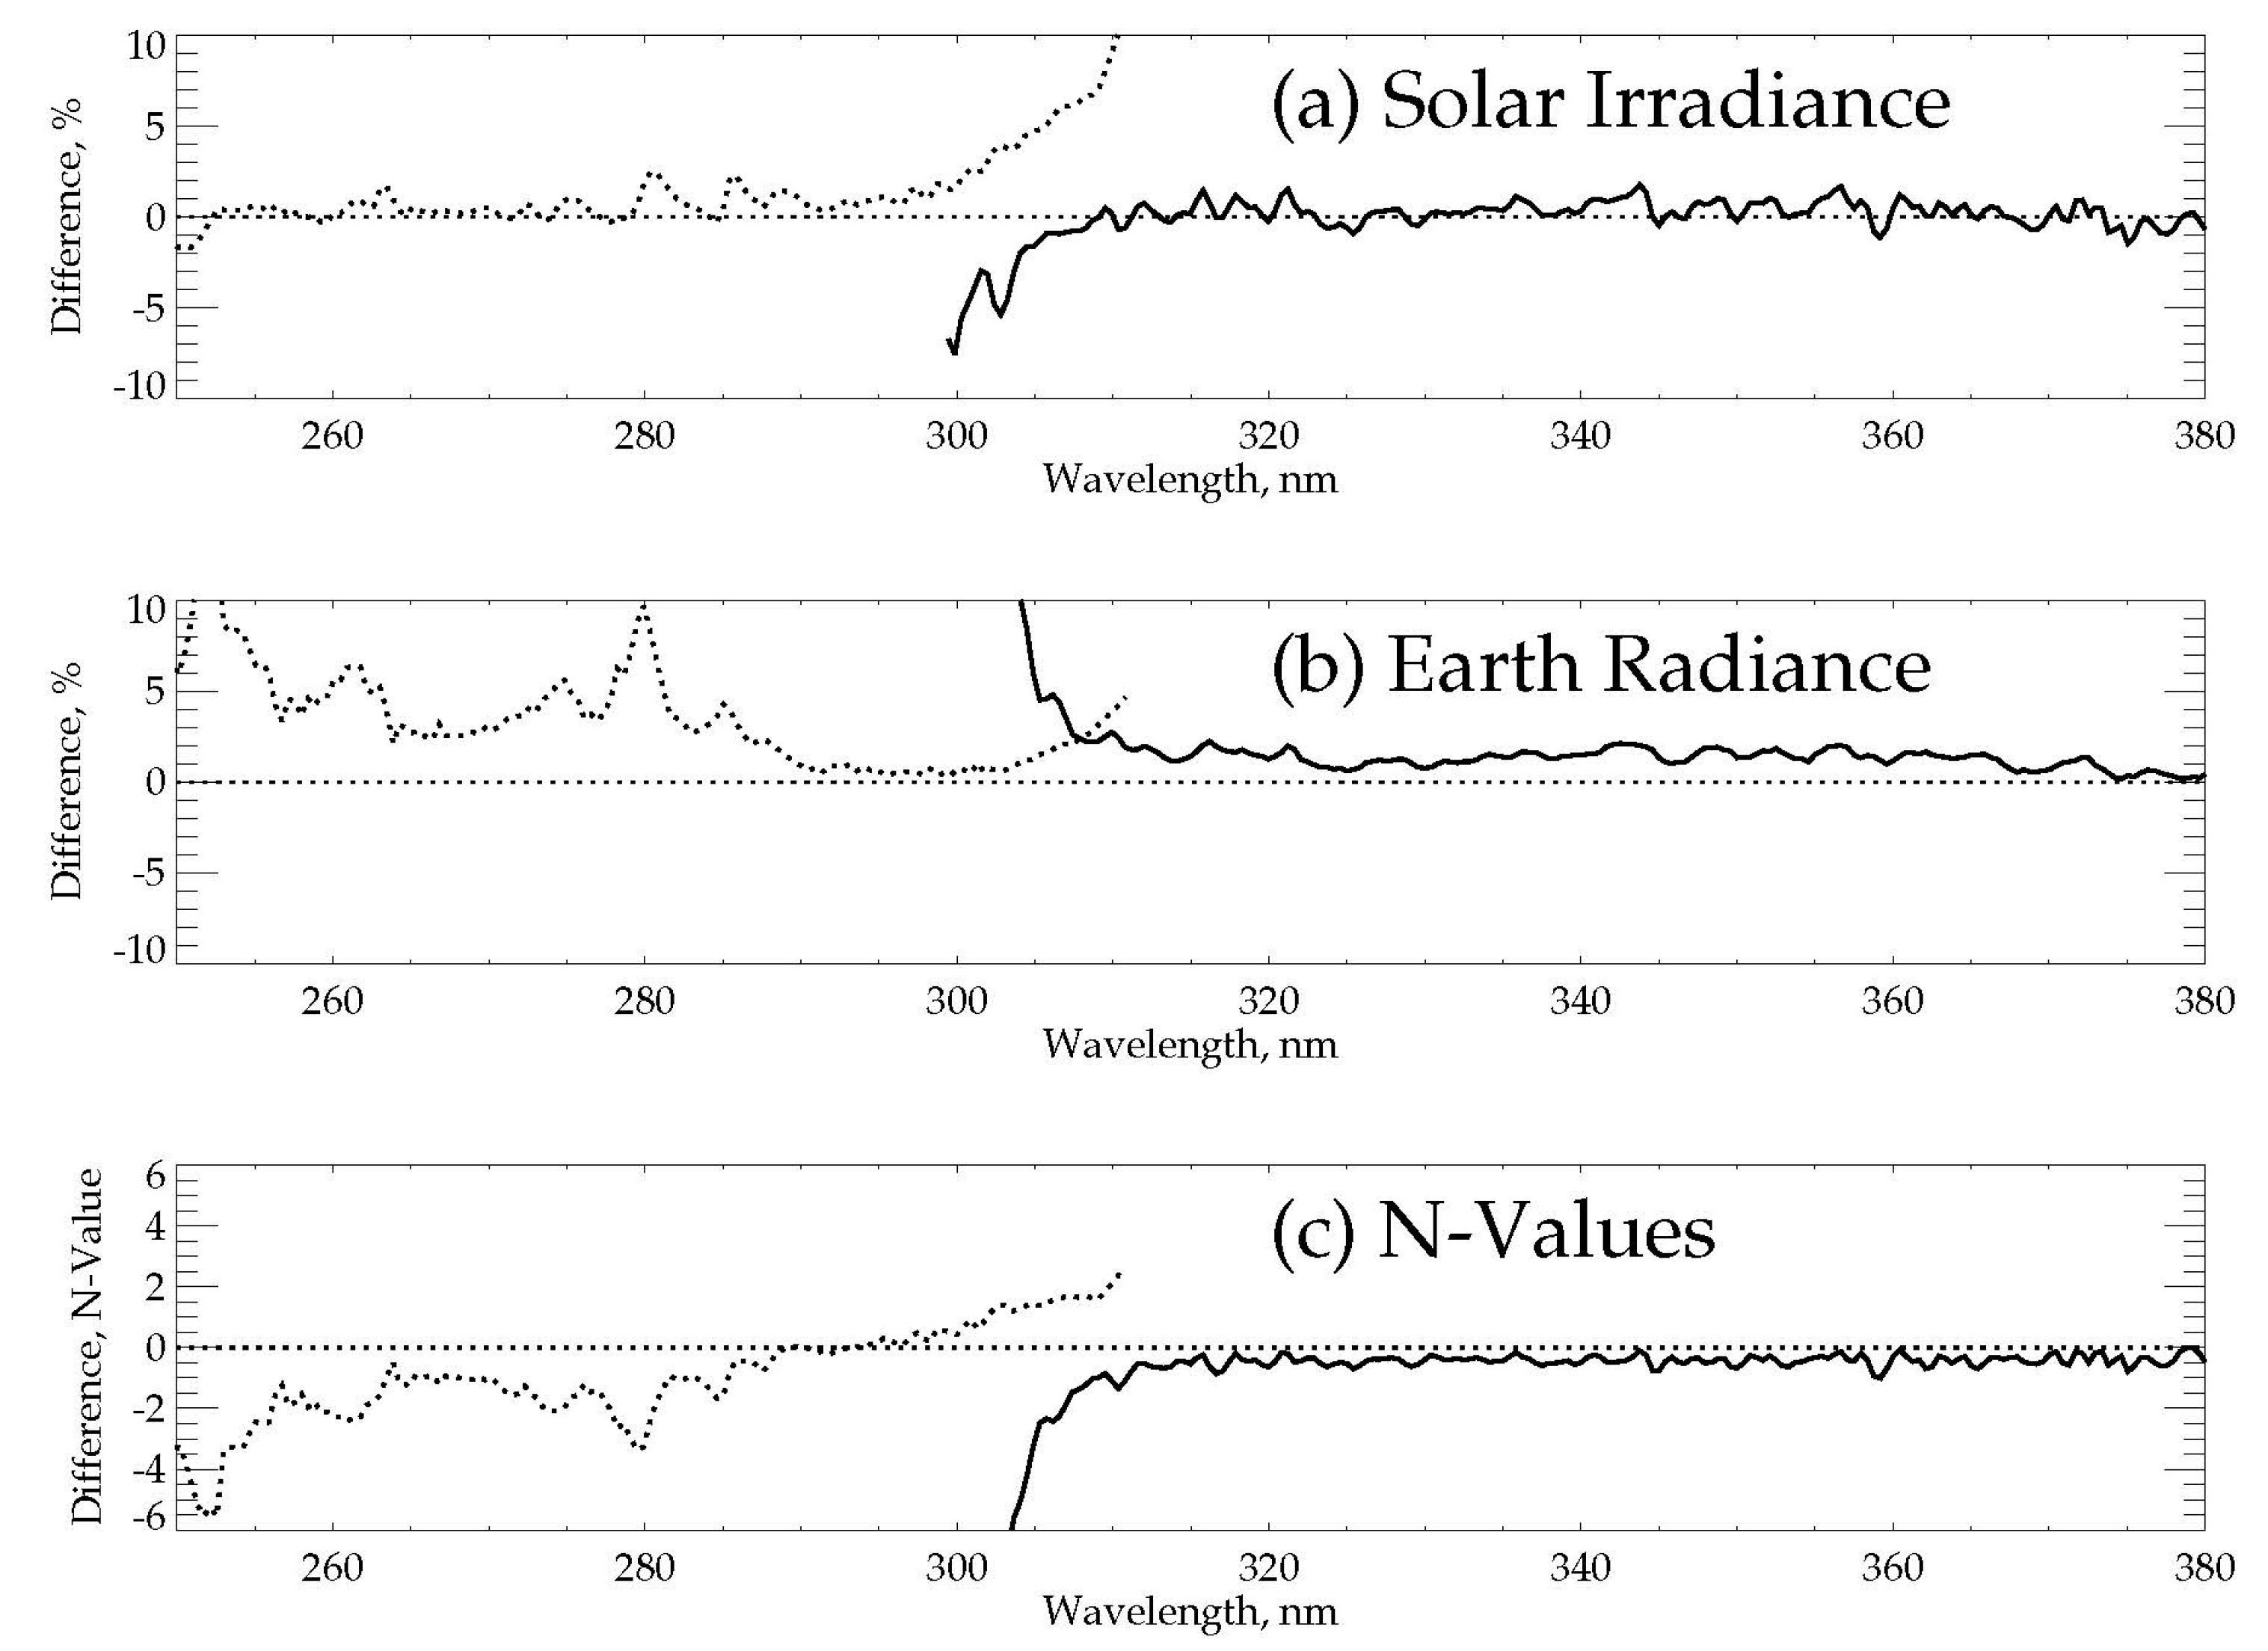
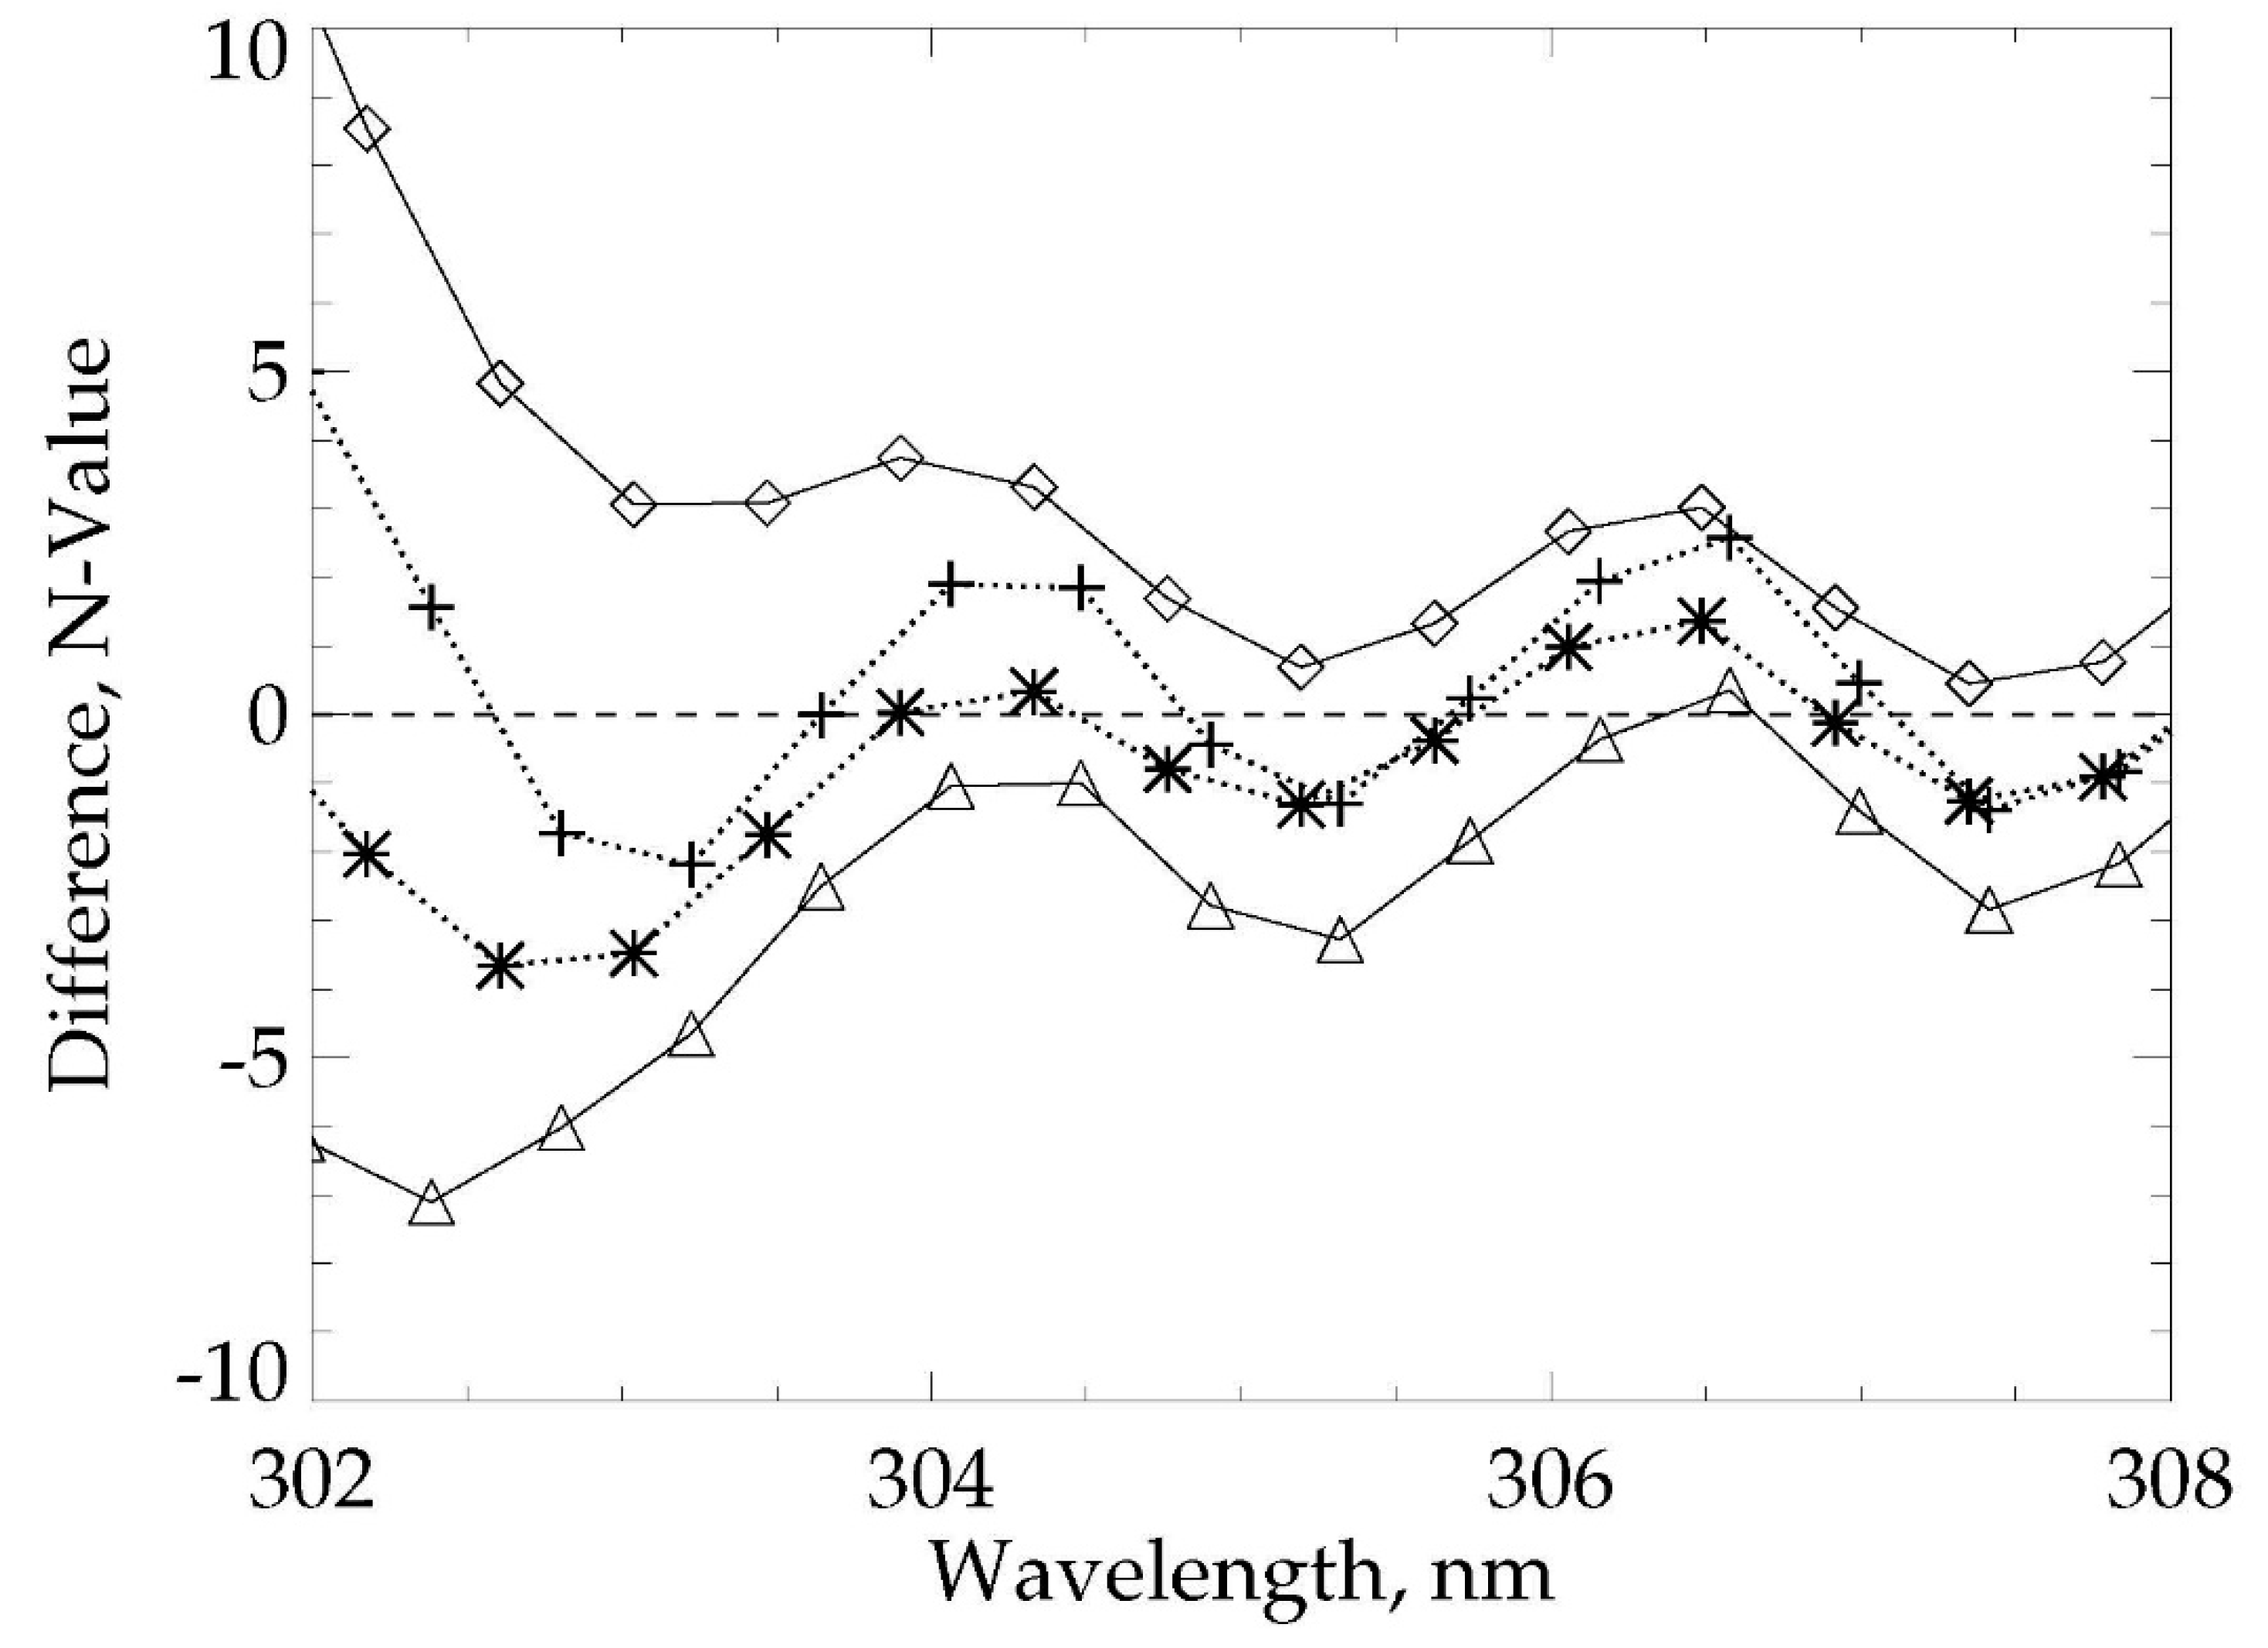
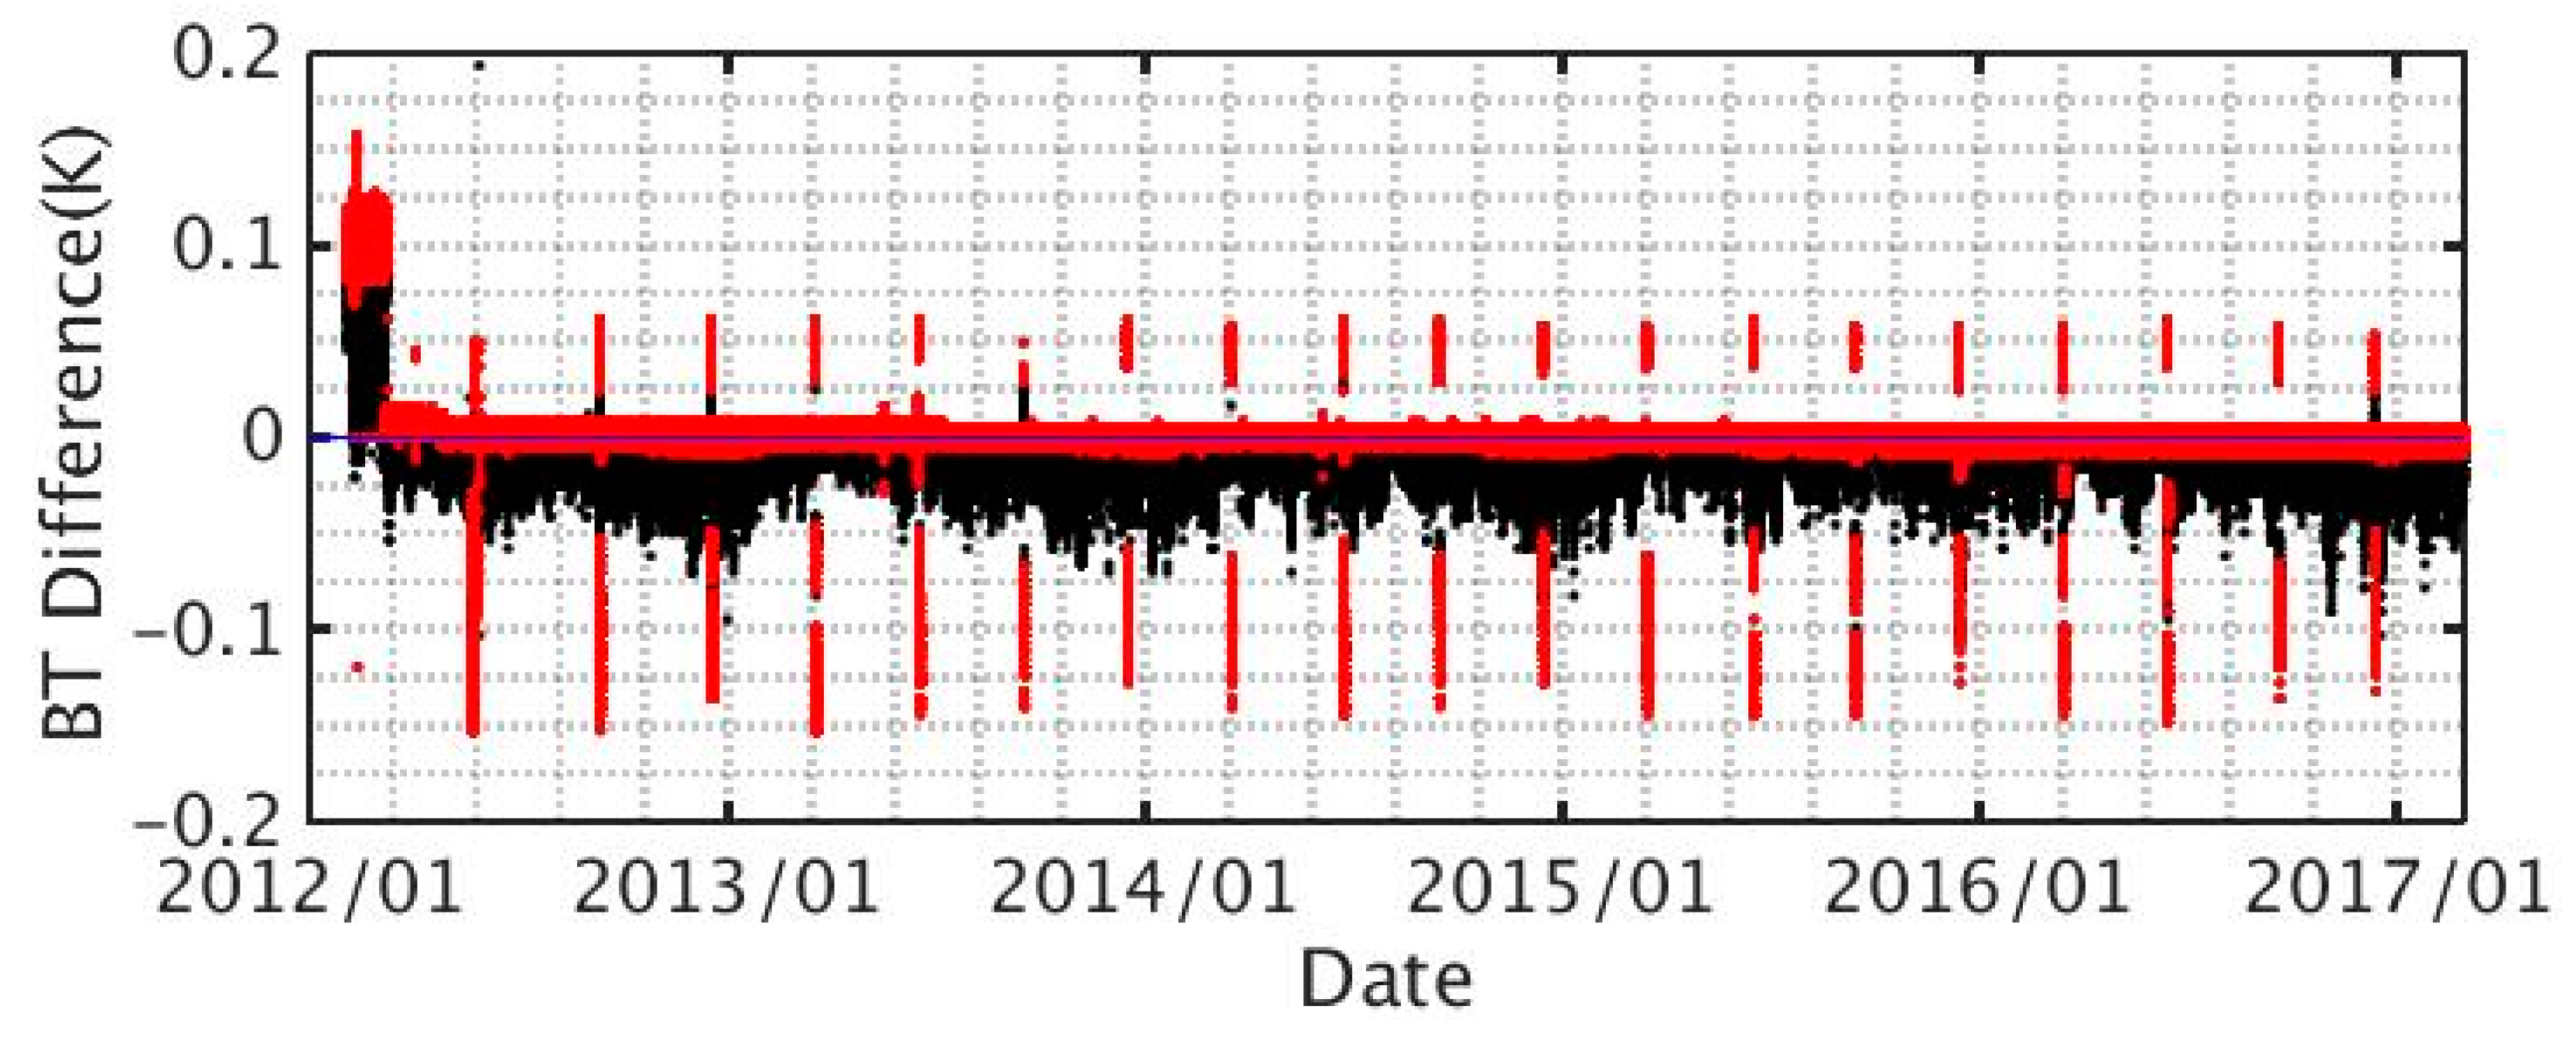
Table 1.
Basic characteristics for the Advanced Technology Microwave Sounder (ATMS) channels. The abbreviations QV, QH, and AMSU-A refer to quasi-vertical, quasi-horizontal, and Advanced Microwave Sounding Unit-A, respectively.
Table 1.
Basic characteristics for the Advanced Technology Microwave Sounder (ATMS) channels. The abbreviations QV, QH, and AMSU-A refer to quasi-vertical, quasi-horizontal, and Advanced Microwave Sounding Unit-A, respectively.
| ATMS Channel | Center Frequency (MHz) | Polarization | Maximum Bandwidth (MHz) | Calibration Accuracy (K) | 3-dB Bandwidth (deg) | Reference Channels |
|---|---|---|---|---|---|---|
| 1 | 23,800 | QV | 270 | 1.0 | 5.2 | AMSU-A Ch1 |
| 2 | 31,400 | QV | 180 | 1.0 | 5.2 | AMSU-A Ch2 |
| 3 | 50,300 | QH | 180 | 0.75 | 2.2 | AMSU-A Ch3 |
| 4 | 51,760 | QH | 400 | 0.75 | 2.2 | |
| 5 | 52,800 | QH | 400 | 0.75 | 2.2 | AMSU-A Ch4 |
| 6 | 53,596 ± 115 | QH | 170 | 0.75 | 2.2 | AMSU-A Ch5 |
| 7 | 54,400 | QH | 400 | 0.75 | 2.2 | AMSU-A Ch6 |
| 8 | 54,940 | QH | 400 | 0.75 | 2.2 | AMSU-A Ch7 |
| 9 | 55,500 | QH | 330 | 0.75 | 2.2 | AMSU-A Ch8 |
| 10 | 57,290.344(f0) | QH | 330 | 0.75 | 2.2 | AMSU-A Ch9 |
| 11 | fo ± 217 | QH | 78 | 0.75 | 2.2 | AMSU-A Ch10 |
| 12 | fo ± 322.2 ± 48 | QH | 36 | 0.75 | 2.2 | AMSU-A Ch11 |
| 13 | fo ± 322.2 ± 22 | QH | 16 | 0.75 | 2.2 | AMSU-A Ch12 |
| 14 | fo ± 322.2 ± 10 | QH | 8 | 0.75 | 2.2 | AMSU-A Ch13 |
| 15 | fo ± 322.2 ± 4.5 | QH | 3 | 0.75 | 2.2 | AMSU-A Ch14 |
| 16 | 88,200 | QV | 2000 | 1.0 | 2.2 | AMSU-B Ch16 |
| 17 | 165,500 | QH | 3000 | 1.0 | 1.1 | AMSU-B Ch17 |
| 18 | 183,310 ± 7000 | QH | 2000 | 1.0 | 1.1 | AMSU-B Ch20 |
| 19 | 183,310 ± 4500 | QH | 2000 | 1.0 | 1.1 | |
| 20 | 183,310 ± 3000 | QH | 1000 | 1.0 | 1.1 | AMSU-B Ch19 |
| 21 | 183,310 ± 1800 | QH | 1000 | 1.0 | 1.1 | |
| 22 | 183,310 ± 1000 | QH | 500 | 1.0 | 1.1 | AMSU-B Ch18 |
Table 2.
Basic characteristics and requirements for the Cross-track Infrared Sounder (CrIS) normal spectral resolution (NSR) and full spectral resolution (FSR) sensor data records (SDRs).
Table 2.
Basic characteristics and requirements for the Cross-track Infrared Sounder (CrIS) normal spectral resolution (NSR) and full spectral resolution (FSR) sensor data records (SDRs).
| Instrument | Frequency Band | Spectral Range (cm−1) | Number of In-Band Channels (Unapodized Channels) | Spectral Resolution (cm−1) | Effective Max. Path Difference (MPD) (cm) | Number of Channels with Guard Bands (Nb) | Decimation Factor (DFb) | NEdN (mW/m2/sr/cm−1) | Frequency Uncertainty (ppm) | Radiometric Uncertainty at 287 K BB (%) |
|---|---|---|---|---|---|---|---|---|---|---|
| NSR | LW | 650 to 1095 | 713 * (717) | 0.625 | 0.8 | 864 | 24 | 0.14 | 10 | 0.45 |
| MW | 1210 to 1750 | 433 * (437) | 1.25 | 0.4 | 528 | 20 | 0.06 | 10 | 0.58 | |
| SW | 2155 to 2550 | 159 * (163) | 2.5 | 0.2 | 200 | 26 | 0.007 | 10 | 0.77 | |
| FSR | LW | 650 to 1095 | 713 * (717) | 0.625 | 0.8 | 874 | 24 | 0.14 | 10 | 0.45 |
| MW | 1210 to 1750 | 865 * (869) | 0.625 | 0.8 | 1052 | 20 | 0.084 | 10 | 0.58 | |
| SW | 2155 to 2550 | 633 * (637) | 0.625 | 0.8 | 808 | 26 | 0.014 | 10 | 0.77 |
* Apodized channel.
Table 3.
Timeline for the S-NPP/Ozone Mapping and Profiler (OMPS)/NM calibration LUTs updates.
| Weekly Dark Current calibration started | 12/21/2012 |
| Stray light calibration LUT updates | 07/10/2013, 08/20/2013, 11/21/2014, 12/18/2014, 09/09/2015, 07/09/2018 |
| Observed Solar LUT update Wavelength calibration LUT update | 11/13/2014 |
| Solar LUT update Wavelength calibration LUT update Calibration constant update | 09/09/2015 |
Table 4.
Timeline for the S-NPP/OMPS/NP calibration LUTs updates.
| Wavelength calibration LUT updates | 6/26/2012, 7/22/2012, 8/19/2012, 10/23/2014, 09/09/2015 |
| Solar LUT updates | 07/17/2012, 09/09/2015, 04/20/2017 |
| Weekly Dark Current calibration started | 02/12/2013 |
| Stray light calibration LUT update | 03/18/2014 |
| Wavelength calibration LUT biweekly update started | 04/20/2017 |
Table 5.
Wavelength information for all Visible Infrared Imaging Radiometer Suite (VIIRS) bands and equivalent Moderate Resolution Imaging Spectroradiometer (MODIS) Thermal bands (from Cao et al. 2014). The abbreviations ViS/NIR, SW/MWIR, LWIR, and DNB stand for visible/near infrared, shortwave/midwave infrared, longwave infrared, and day–night-band, respectively.
| ViS/NIR | Band | M1 | M2 | M3 | M4 | I1 | M5 | M6 | I2 | M7 | |
| Wavelength (µm) | 0.412 | 0.445 | 0.488 | 0.555 | 0.640 | 0.672 | 0.746 | 0.865 | 0.865 | ||
| DNB | Band | DNB | |||||||||
| Wavelength (µm) | 0.5–0.9 | ||||||||||
| SW/MWIR | Band | M8 | M | I3 | M10 | M11 | I4 | M12 | M13 | ||
| Wavelength (µm) | 1.24 | 1.378 | 1.61 | 1.61 | 2.25 | 3.74 | 3.70 | 4.05 | |||
| LWIR | Band | M14 | M15 | I5 | M16 | ||||||
| Wavelength (µm) | 8.55 | 10.763 | 11.450 | 12.013 | |||||||
| MODIS Thermal Bands | Band | B20 | B22 | B29 | B31 | B32 | |||||
| Wavelength (µm) | 3.78 | 3.96 | 8.56 | 11.03 | 12.04 | ||||||
© 2020 by the authors. Licensee MDPI, Basel, Switzerland. This article is an open access article distributed under the terms and conditions of the Creative Commons Attribution (CC BY) license (http://creativecommons.org/licenses/by/4.0/).
Share and Cite
MDPI and ACS Style
Zou, C.-Z.; Zhou, L.; Lin, L.; Sun, N.; Chen, Y.; Flynn, L.E.; Zhang, B.; Cao, C.; Iturbide-Sanchez, F.; Beck, T.; et al. The Reprocessed Suomi NPP Satellite Observations. Remote Sens. 2020, 12, 2891. https://doi.org/10.3390/rs12182891
AMA Style
Zou C-Z, Zhou L, Lin L, Sun N, Chen Y, Flynn LE, Zhang B, Cao C, Iturbide-Sanchez F, Beck T, et al. The Reprocessed Suomi NPP Satellite Observations. Remote Sensing. 2020; 12(18):2891. https://doi.org/10.3390/rs12182891
Chicago/Turabian StyleZou, Cheng-Zhi, Lihang Zhou, Lin Lin, Ninghai Sun, Yong Chen, Lawrence E. Flynn, Bin Zhang, Changyong Cao, Flavio Iturbide-Sanchez, Trevor Beck, and et al. 2020. "The Reprocessed Suomi NPP Satellite Observations" Remote Sensing 12, no. 18: 2891. https://doi.org/10.3390/rs12182891
Note that from the first issue of 2016, this journal uses article numbers instead of page numbers. See further details here.