Urban Intensities. The Urbanization of the Iberian Mediterranean Coast in the Light of Nighttime Satellite Images of the Earth


Research Group on Energy, Territory and Society, Department of Geography, Autonomous University of Barcelona, Cerdanyola del Vallès, 08193 Bellaterra, Spain
*
Author to whom correspondence should be addressed.
Urban Sci. 2018, 2(4), 115; https://doi.org/10.3390/urbansci2040115
Submission received: 19 October 2018
/
Revised: 20 November 2018
/
Accepted: 24 November 2018
/
Published: 29 November 2018
(This article belongs to the Special Issue Land Squandering and Social Crisis in the Spanish City)
Abstract
:The contribution shares the approach of critical urban studies that have conceptualized urbanization more as a process than as a sum of spatial forms. Thus, the contribution studies the urbanization process not only from the point of view of the physical occupation of land but also considers changes in the intensity of the uses of space. To fulfill this aim, the new sources of nocturnal satellite images are particularly useful. These allow us to observe the intensity of urban uses both in terms of their distribution over space and their recurrence over time. The research focuses on the Iberian Mediterranean coast and permits the verification of the intensity of the urban uses of the space for the whole of this area and their seasonal variations throughout the year. The source of the study are the nighttime satellite images of the Earth for the 2012–2017 period from the NASA SNPP satellite equipped with the VIIRS-DNB instrument. By establishing a threshold of urban light the research shows that those districts with the greatest extensions of urban light do not necessarily correspond with the most densely populated areas. Similarly the absence of urban light does not necessarily indicate the absence of urban uses. Finally, the variations of intensity of light prove to be a good indicator of seasonal variations of activity in tourist areas.
1. Introduction
The traditional starting point of studies of urbanization processes has been a dual vision of space with a clear differentiation between urban and non- urban spaces. Accordingly, the basic premises of urban studies consider a city as an object characterized by particular attributes of form and function that clearly set it apart from the non-city—hence the configuration of the oppositions of country–city and rural–urban that have governed the conceptual development of this branch of the social sciences for decades [1,2].
This conceptual approach has given rise to countless studies seeking to establish the limits of urban and metropolitan settings on the basis of criteria related to administration, morphology, function, hierarchy of services, economic structures, and lifestyles [3,4]. These approaches have produced extremely interesting results that have often proved useful for the management and governance of a territory but have done nothing to refute the reality that nowadays a strict definition of urban limits is highly problematic in scientific terms.
This reality has led, in recent years, to a growing awareness that any understanding of spatial dynamics requires an analysis of urbanization as a process, rather than attempts to define a city, metropolis or region as circumscribed artifacts or areas. This process is made up of activities and social relationships in space that give rise to a complex and constantly changing network of settlements and flows of energy, resources, people, capital, goods, and information [4,5,6]. This approach therefore goes beyond the analysis and demarcation of spaces characterized by features traditionally ascribed to the city—compactness, complexity, and incessant continuity—to argue that urbanization should be studied as a process that, in its present phase, has led to the overall integration of planetary space as interdependent networks and a growing subjection of resources and goods to trading relationships [1,5,7,8,9,10].
However, the urbanization of space in terms of integration and interrelationships does not in any way imply its homogenization. On the contrary: just as urban macroregions present significant social and economic differences, they also display an extremely marked diversity in the intensity of uses in their territories. This diversity is not derived so much from the percentage of surface area that is artificialized, or even from the predominance of primary, secondary or tertiary uses of the space—as suggested by the old urban/rural duality—but by the fact that, in a territory entirely dominated by uses that could be described as urban, activities and flows present various levels of density and intensity. Thus, some areas experience intensive use as both flow and permanent installation of activities and population, while others present less intensity of use, but this absolutely does not mean that they are not also integrated into—and transformed by—the process of urbanization [10,11].
This article seeks to explore the dynamics of urbanization within a particular area: the eastern coast of the Iberian Peninsula and the Balearic archipelago. The territories of Catalonia, Valencian Community and the Balearic Islands form an urban macro-region with a population of almost 14 million residents, as well as 40 million international visitors per year. In fact, the Iberian Mediterranean coast constitutes an extensive urban region, which encompasses several regional metropolises—Barcelona, Tarragona, València, and Alacant-Elx—along with some of the most developed tourist areas of the Mediterranean—Costa Brava, Costa Daurada, Costa del Sol, and Mallorca—it is similar in size to the macro-regions of the Po Valley in Italy and the Randstad in the Netherlands and it is to be considered one of the main economic axes of Southern Europe. As various authors have pointed out this type of geographic areas are a particularly appropriate setting for a discussion of the intensity of urbanization, due to both the density of its urban uses and its striking seasonal variations [12,13].
In order to explore this subject, our research takes advantage of a relatively new source that is particularly suited to a study of the intensity of the urbanization process: the nighttime satellite images of the Earth issued by the USA’s National Oceanic and Atmospheric Administration (NOAA). Various authors have pointed out the potential of this source [14,15,16,17,18,19]. Starting from the assumption that the nighttime brightness revealed by these means is an anthropogenic phenomenon, then its analysis makes it possible to detect the presence of settlements and human activities (urban areas, communication routes and bridges, traces of fishing boats and ships, and other) and establish the relationships between the intensity of nighttime light, land use and a wide range of socioeconomic variables [14,15,16,17,18,19].
The article is divided into four sections: the first focuses on methodological questions; the second shows the particularities of spatial urbanization on the Iberian Mediterranean coast in terms of extension and intensity, via the data derived from nighttime satellite images; there follows an exploration, by way of example, of the variations over time in these intensities on the Balearic Islands that establishes relationships with various economic indicators; finally, a few brief conclusions close the article.
2. Materials and Methods
2.1. Basic Information
As explained, the spatial scope of this study includes the most urbanized regions of the eastern seaboard of Iberian Peninsula and the Balearic Islands. It extends over approximately 600 km of coastal line and is made up of the regions of Catalonia, Valencia, and the Balearic Islands. This macro-region, which has been named Arc Mediterrani, has population that exceeds 13 million inhabitants and generates 31.1% of Spanish GDP, with total volume—361 thousand million euro—which doubles the output of countries like Greece or Portugal, and approaches that of medium-sized European nations such as Norway and Austria. The Mediterranean macro-region also originates 40% of Spanish exports and has two large metropolises—the metropolitan areas of Barcelona and València—the tourist island of Mallorca, and a series of urban areas and medium-sizes cities: Girona-Costa Brava, Camps de Tarragona, Castelló-la Plana Alta, and Alacant-Elx.
Therefore, it can be said that Mediterranean coast, together with the metropolis of Madrid and the Atlantic coastal axis from Galicia to Lisbon, is one of the macro-regions with the highest demographic and economic potential of the Iberian Peninsula [20,21].
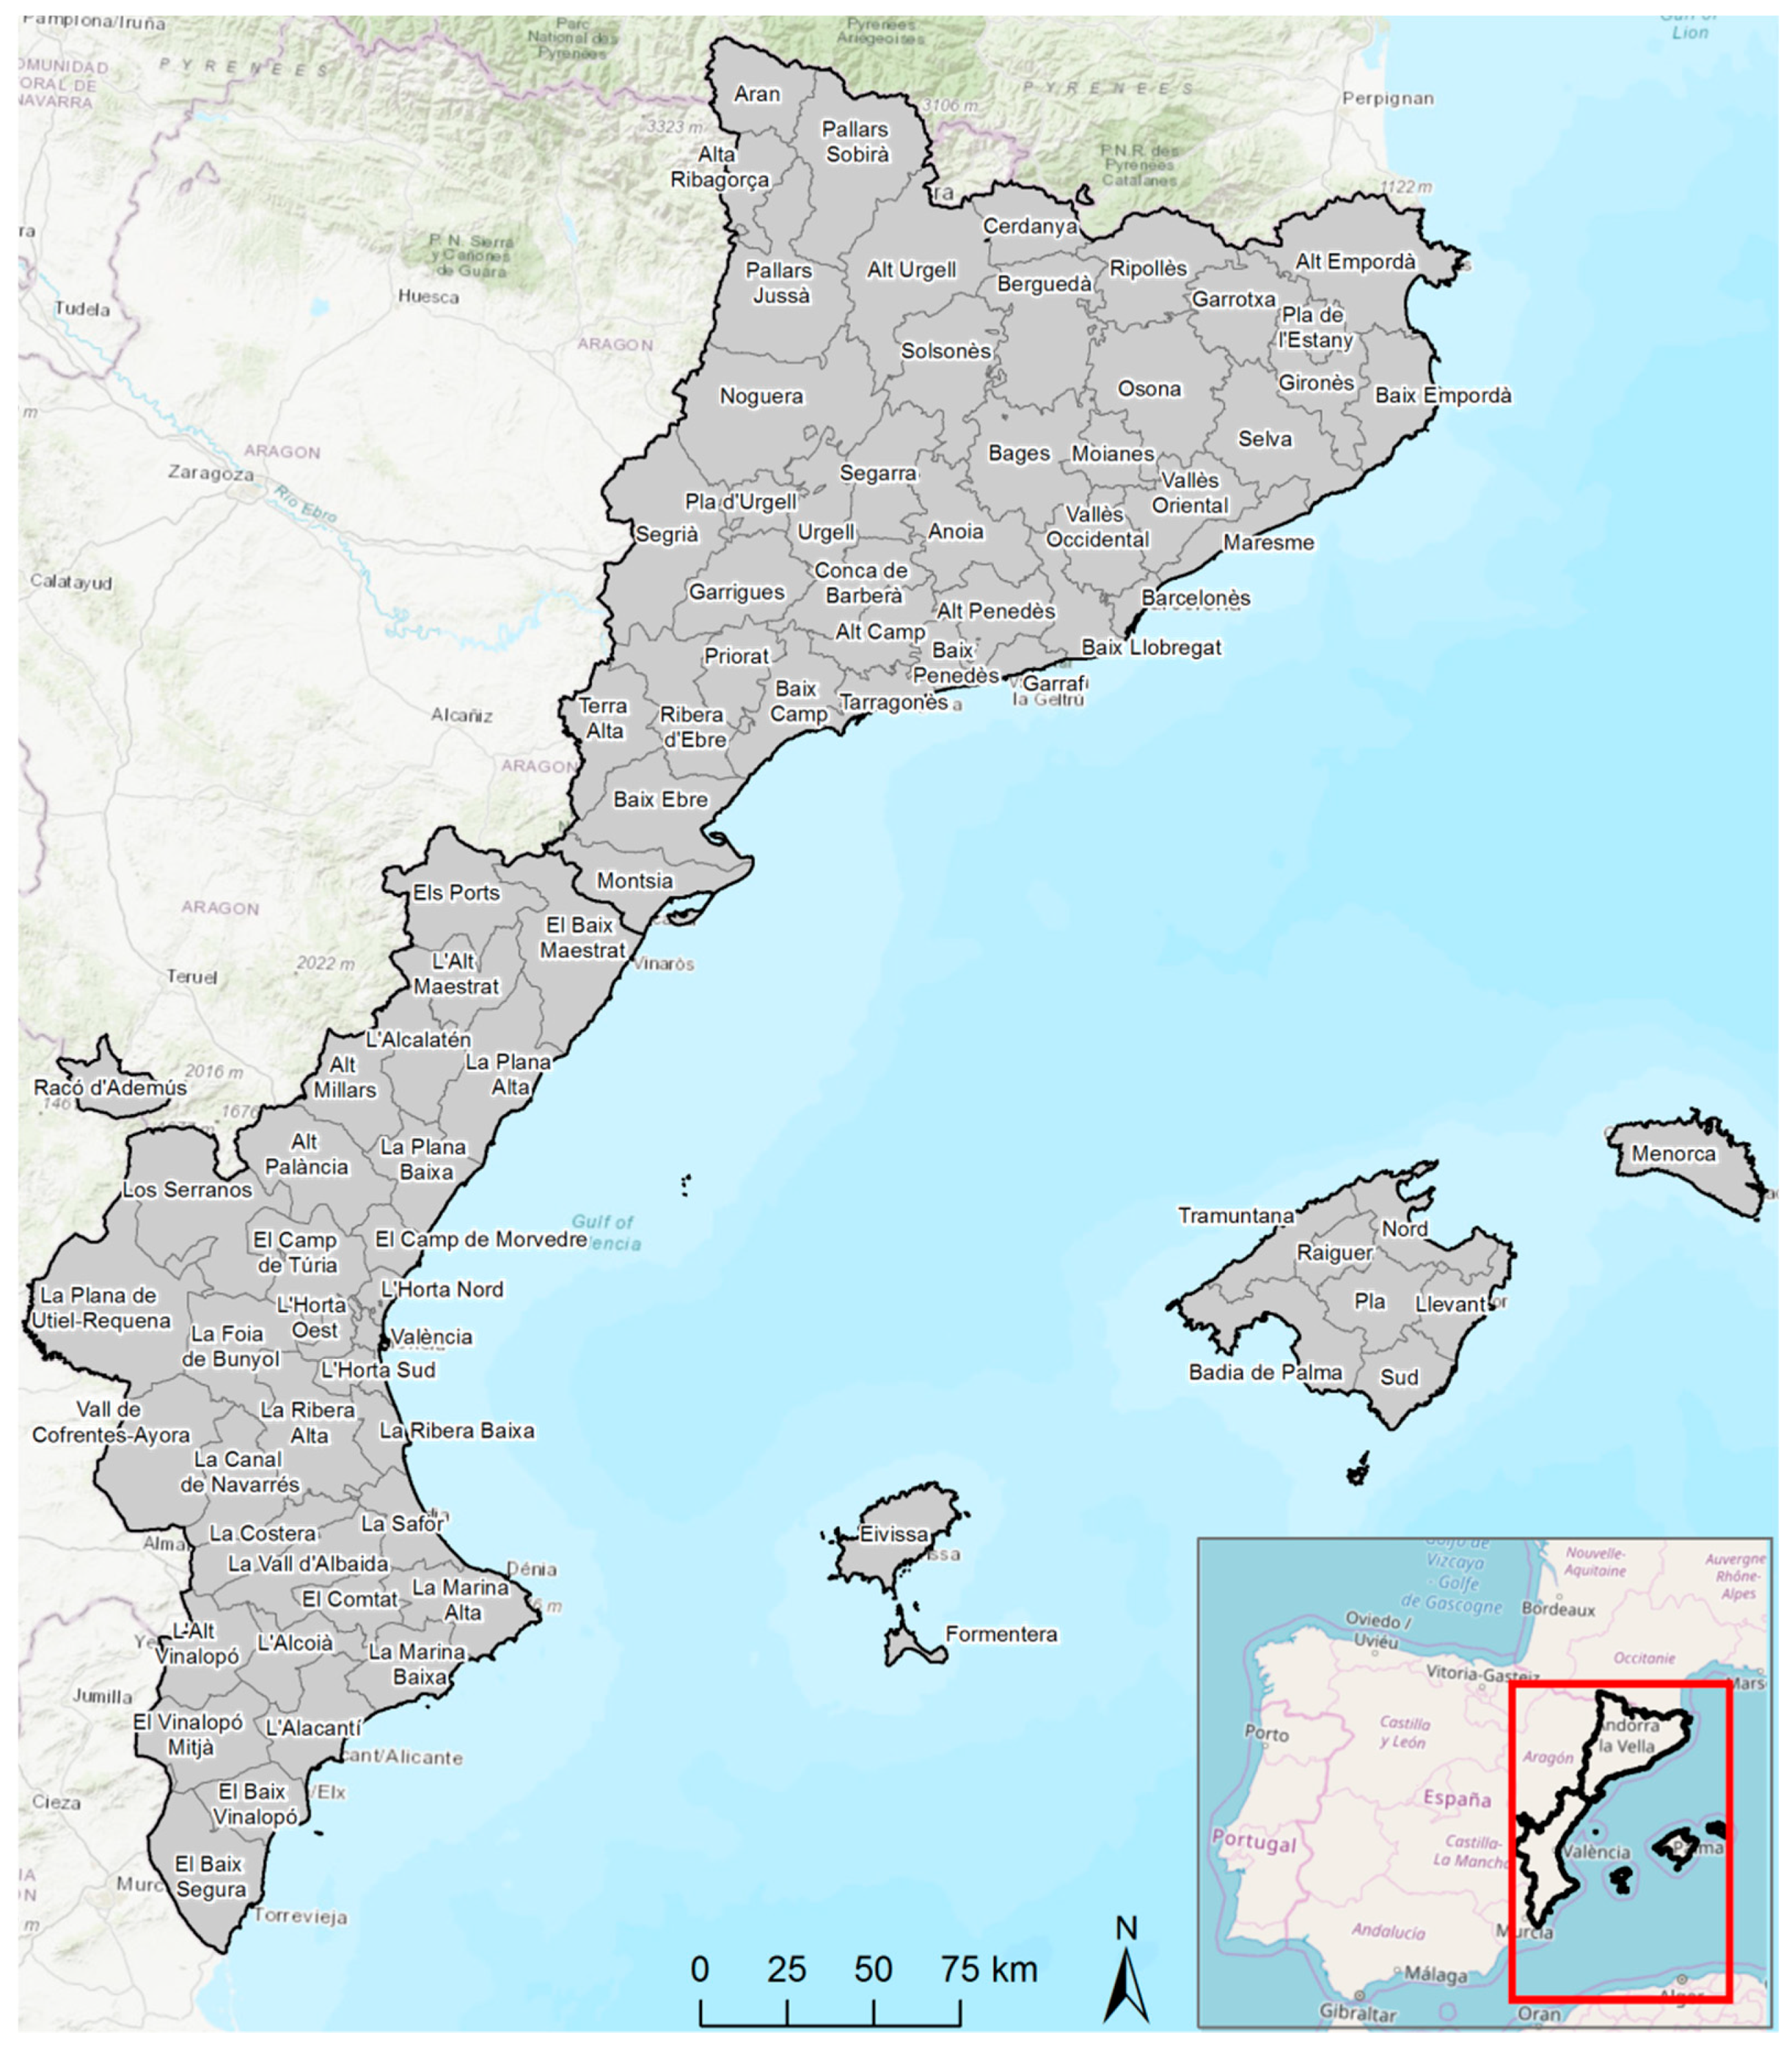
To treat the data we have used the subdivision of the study area in 86 “comarcas” or districts (Figure 1). The “comarca” is an administrative division of a political and statistical nature, somewhere between the local and regional levels, i.e., it is larger than municipality but smaller than a province.
The main source of basic information for this study is the nighttime satellite images of the Earth Observation Group (EOG), which belongs to the National Geophysical Data Center (NGDC) in the USA’s National Oceanic and Atmospheric Administration (NOAA). More particularly, these images form part of the NOAA’s teledetection products derived from satellite sensors with a capacity to capture light sensitivity in situations of little or no natural light and thus demonstrate the artificial lighting resulting from human activities. The EOG produces and makes available satellite images whose pixels contain values related to permanent nighttime lighting on the surface of the Earth.
The specific images used as a source herein only very recently became available to the researchers and they therefore provide new and exciting possibilities for analysis. They come from the Suomi National Polar-Orbital Partnership (SNPP) satellite, which supplies data via its VIIRS (Visible Infrared Imaging Radiometer Suite) and DNB (Day/Night Band) sensor. This sensor makes it possible to obtain calibrated global data on nighttime radiance within a spectral bandwidth of 500 to 900 nm, close to the bandwidth visible to humans [22].
This information is available in the form of monthly composites or the years 2012–2017, with periodic updates. The composites produced by the EOG are georeferenced rasters in a GeoTIFF format, with a pixel resolution of 15 arc-seconds, which makes it possible to work on the selected area with pixels of approximately 350 × 350 m (Table 1). Obviously this involves the limitation of not being able to observe the type of artifact or focus emitting the radiance inside each pixel, but in general terms it can be considered that the resolution level of the images is useful for our purposes and, in any case, it represents a great advance with regard to the quality of the images available until very recently [23].
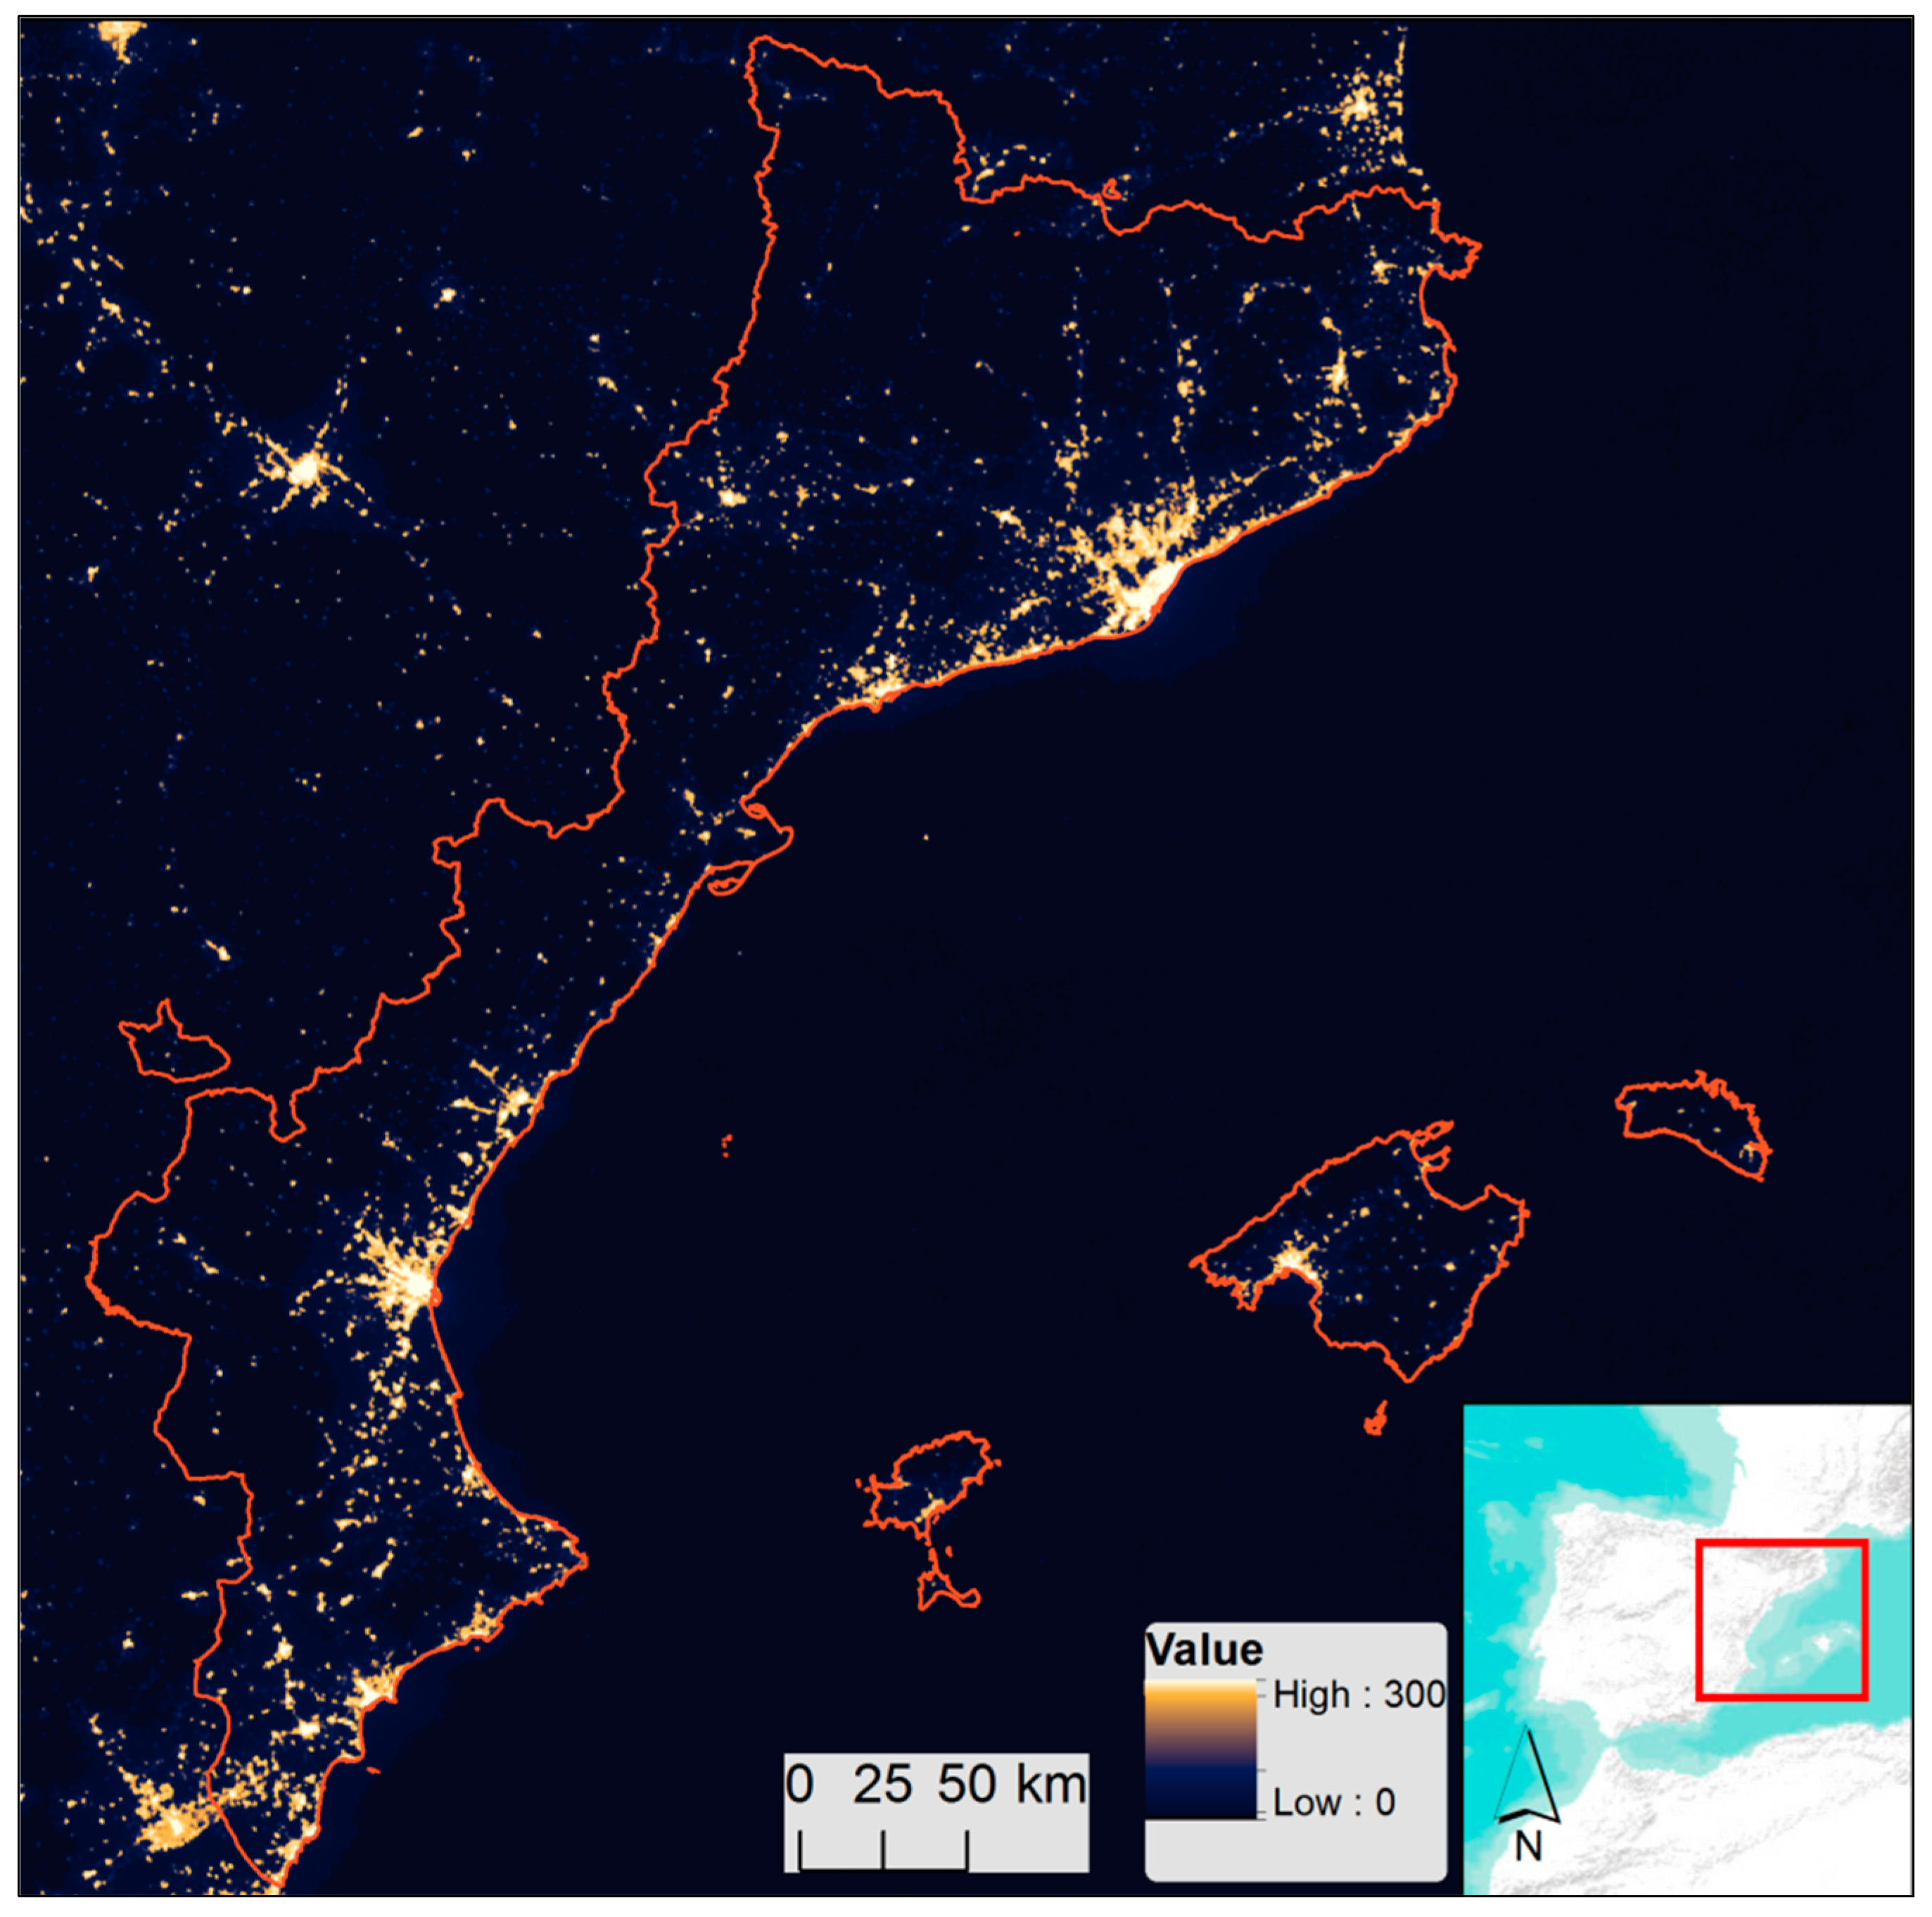
The images basic information lies in each of their pixels, where the mean value of the radiance emitted by that area on the Earth’s surface is presented in units of nW/cm2/sr. The values of the radiometric detection range (degrees of light intensity) lie between 0 and 300 nW/cm2/sr, with 0 as the value corresponding to absolute darkness and around 300 as maximum light (with some extreme values going beyond this range). This range of values makes it possible to distinguish small settlements and also differentiate values of radiance (intra-urban variations) without saturations in areas with the most light [24] (Figure 2). It is important to take into account that the treatment applied by the NOAA does not exclude relatively ephemeral incidents such as forest fires and gas ignition. Moreover, the monthly schedule of images prejudices the quality of the data, as some months might be very cloudy while others have an inordinate amount of sunlight, particularly in those latitudes far from the Equator around the time of the summer solstice. These circumstances can partially invalidate the satellite findings or prejudice the quality of the monthly composites. However, a raster file indicates the number of valid observations recorded for each month, and on this basis the NOAA has created the corresponding monthly composite of nighttime light. In the latitude of our study area, the surfeit of atmospheric light in the months of May, June, and July invalidate the satellite observations for that period, making it impossible to create the corresponding monthly composite. There are other effects that also have to be taken into account, such as that of the albedo of the land cover, although, according to [25], these have little influence.
2.2. Treatment of the Images
The procedure for the observation and treatment of the nighttime images involved, firstly, downloading the amount of the monthly satellite images available in the NOAA repository for the period from April 2012 to October 2017, and then the extraction (cropping) of the images corresponding to the study area. The period of time considered corresponds to the availability of the images at the initial moment of our research.
The images were subsequently converted to a vectorial format that permits the quantitative analysis of the data on light intensity in relation to other statistical and cartographic variables. This vectorization process required a previous conversion to whole numbers, due to the decimal format of the values of the cells. Whole numbers running from 0 to 300 (plus extreme values) were therefore used, with the original values from the NOAA raster images (which comprise up to fourteen digits) approximated to the nearest round number. In order to be able to work with other sources of information, all the cartographic bases were unified in a single cartographic space with the same projection and reference system (Datum: ETRS89, European Terrestrial Reference System 1989. Projection: UTM31N, Universal Transverse Mercator, spindle 31 north), all within a GIS work setting.
Furthermore, as evident from the above description of the characteristics of the source, measures had to be taken to compensate for any possible distortions resulting from accidental light emissions. Accordingly, when areas presented abnormal values in certain months—attributable to fires or other isolated incidents—these were corrected by calculating the mean value calculated for these months in undisrupted previous and subsequent years and then assigning it to the affected pixels. This allowed us to counteract the influence of large-scale fires detected by the images. Similarly, any undue influence of cloudiness on the monthly composites was ruled out by always having available at least two valid monthly observations per pixel.
Finally, in order to minimize any other possible effects on the images, new composites of mean monthly and annual light were generated on the basis of the available images. To obtain the annual means, the values for each pixel for all the months of each year were superimposed and added up to arrive at the annual arithmetic mean of the light emitted by each pixel (portion of surface area). In our case, the annual means for 2013–2016 were obtained on the basis of the nine months available to us, for, as explained above, we lack information about the months around the summer solstice. Only six months were available for 2012 (from April onwards, excluding the summer months) and only those up to October were available for 2017 (also excluding the months around the summer solstice). In order to study the seasonality of the urban uses of land without any of the sporadic effects that may occur in a specific year, the process was repeated, but this time adding up the data for each month of the six available years. This gave us the yearly mean of light for each month (January, February, etc.) for the entire study period.
This methodology allowed us to minimize any possible undue effects, while the use of annual and seasonal means for the whole study period reduced the impact of the possible effects of measures applied against light pollution and of changes in light sources over this time. Some studies have shown that a change of lighting system aimed at greater energy efficiency and/or reduction in light pollution can affect the amount of light captured by the satellite, as part of the wavelength of LEDs falls under the sensor’s detection limits of 500 nm. Such changes could explain why light emissions fail to increase in some countries, or even decrease [27]. However, the rebound effect defined by the Jevons paradox is also well known [28]. Furthermore, it must be taken into account that transitions towards LED lighting can intensify the “skyglow” halo due to shortened wavelengths [29]. In short, the effects of saving energy with outdoor LED lighting may not necessarily suppose a reduction in the total light emitted and recorded.
2.3. Methodology to Establish the Threshold of Urban Light
In view of both our intention to study the intensity of urban land uses and the common practice in research involving this type of image [18,30], we considered it appropriate to determine the threshold value at which the brightness of a lit surface area most accurately reflects the artificialization of the land. The images show that not all the pixels with light values above zero correspond to an area with uses that involve a permanent artificialization of the land. A definition of the minimum value of light (from 0 to 300) at which a lit surface area most closely corresponds to the presence of constructions, infrastructures and other artifacts is therefore of great benefit.
The main purpose of this definition is to provide a reference threshold when it comes to measuring the intensity of the urban uses of the territory, without pretending to imply, in any way, that urban uses do not extend to areas with lower levels of light. In contrast, as indicated above, this research starts from the premise that urbanization nowadays is a process that tends to integrate and transform the uses of a territory in its entirety. The concept of nighttime urban light must therefore be understood in terms of intensity rather than exclusion.
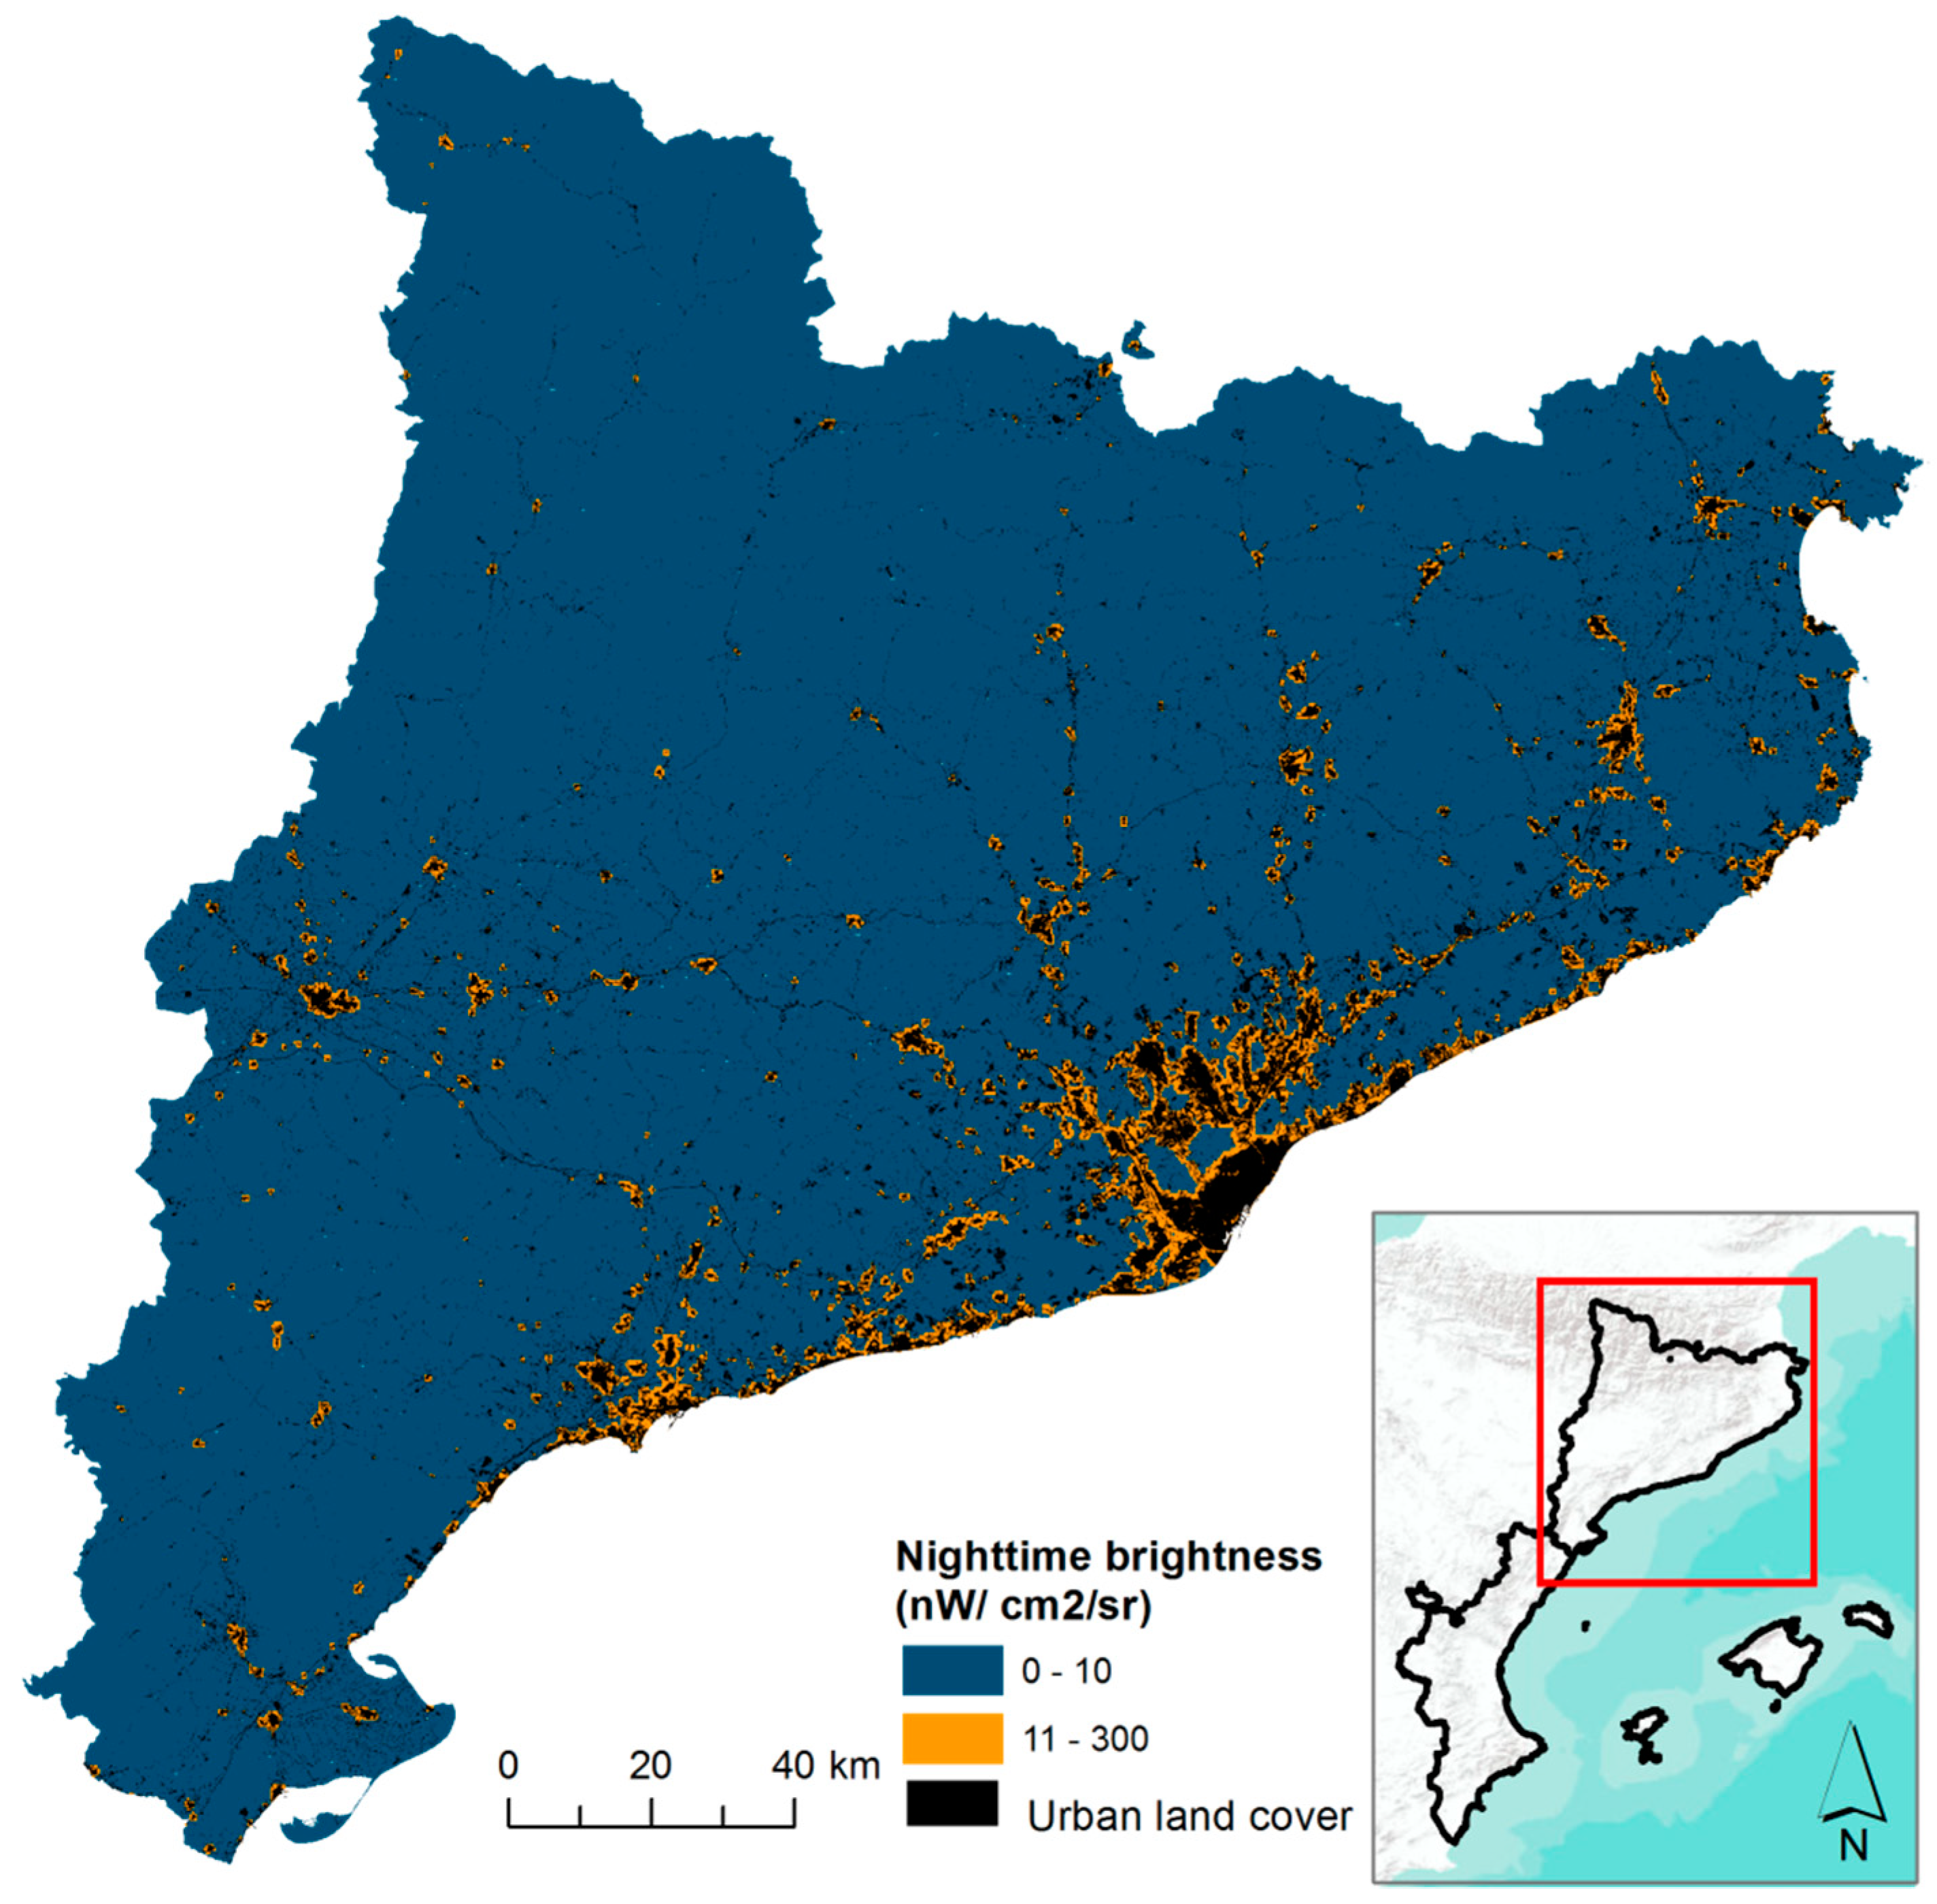
The methodology established in [18,30] was used to define this threshold. This procedure contrasts the light values of the satellite images with information about land cover derived from a reliable source. More specifically, the data on light values were contrasted with information on the physical extension of urban settlements on the map of land cover in Catalonia drawn up by the Centre de Recerca Ecològica i Aplicacions Forestals (CREAF) in 2009, the available source that was considered most preferable. The equivalent of the CREAF map for the Spanish territory as a whole would be the Land Cover Map (SIOSE) of the Instituto Geográfico Nacional. The reference scale of the SIOSE is 1:25,000, as against the greater detail (1:2500) and greater specificity of the classifications of land cover of the CREAF map. Time difference between the two sources (2009 CREAF map and 2012 NOAA images) may entail some distortion. In any case it should be taken into account that between 2009 and 2012 the surface area of developed land in Spanish was very small due to the situation of economic crisis.
In order to make the calculations that adjusted light levels to the reference source for land cover (which establishes 411 categories for this parameter), 50 types of land cover were selected, all falling under the category of artificialized land. These include all types of residential, industrial and tertiary land and facilities but rule out any type of land with uses that are agricultural, woodland, aquatic, etc. The areas corresponding to the various levels of light intensity were superimposed on to selected areas of the reference map in order to establish the correlation between the two. The data were crossed by using an image of nighttime brightness corresponding to the annual mean obtained via the monthly composites from April to December 2012, thereby correcting any possible seasonal variations. It was therefore possible to statistically evaluate the light level at which there was the greatest coincidence (intersection) of artificialized land and light intensity.
The results of this intersection (Table 2, Figure 3) showed the value of 11 (out of 300) to be the reference threshold at which there was the greatest coincidence of light intensity and artificialization of the land. This threshold enabled us to quantitatively analyze surface area in terms of the level of light intensity, which we refer to as “nighttime urban brightness”, i.e., light that emits radiance equal to or greater than 11 nW/cm2/sr.
3. Results and Discussion: Two Intensities of Urbanization
The results obtained allow us to calculate the extension of urban light intensity in terms of both space and time. With respect to space, the first result presented below is a general overview of the surface area that presented light levels, in all the 86 districts that comprise the studied territory. This is complemented by an analysis of the mean light levels displayed by each district. There follows an examination of light intensity in terms of time, with a special focus, as mentioned above, on the Balearic Islands, one of the regions with the most notable seasonal variations in this respect.
3.1. Light Intensity in Terms of Space
3.1.1. The Extension of Urban Light Intensity
The study and comparison of the nighttime urban light (from value 11 upwards) in the 86 districts provides information about the intensity of urbanization in each one, as well as information about the uses of land therein (Figure 4). The analysis was static and took in the means of all the available light values corresponding to the months of October within the study period. October is especially suited to synchronic studies and comparisons between territories within our study area because, on the one hand, atmospheric light does not affect nighttime observation and, on the other, there is less probability of any effects from the albedo of snow [27].
On the basis of the calculations of the light in the various districts, we can state that 6.7% of the territory in the study area presents light levels over the threshold of what we refer to as “nighttime urban brightness”. In absolute terms, this represents 4037 km2, somewhat bigger than the island of Mallorca.
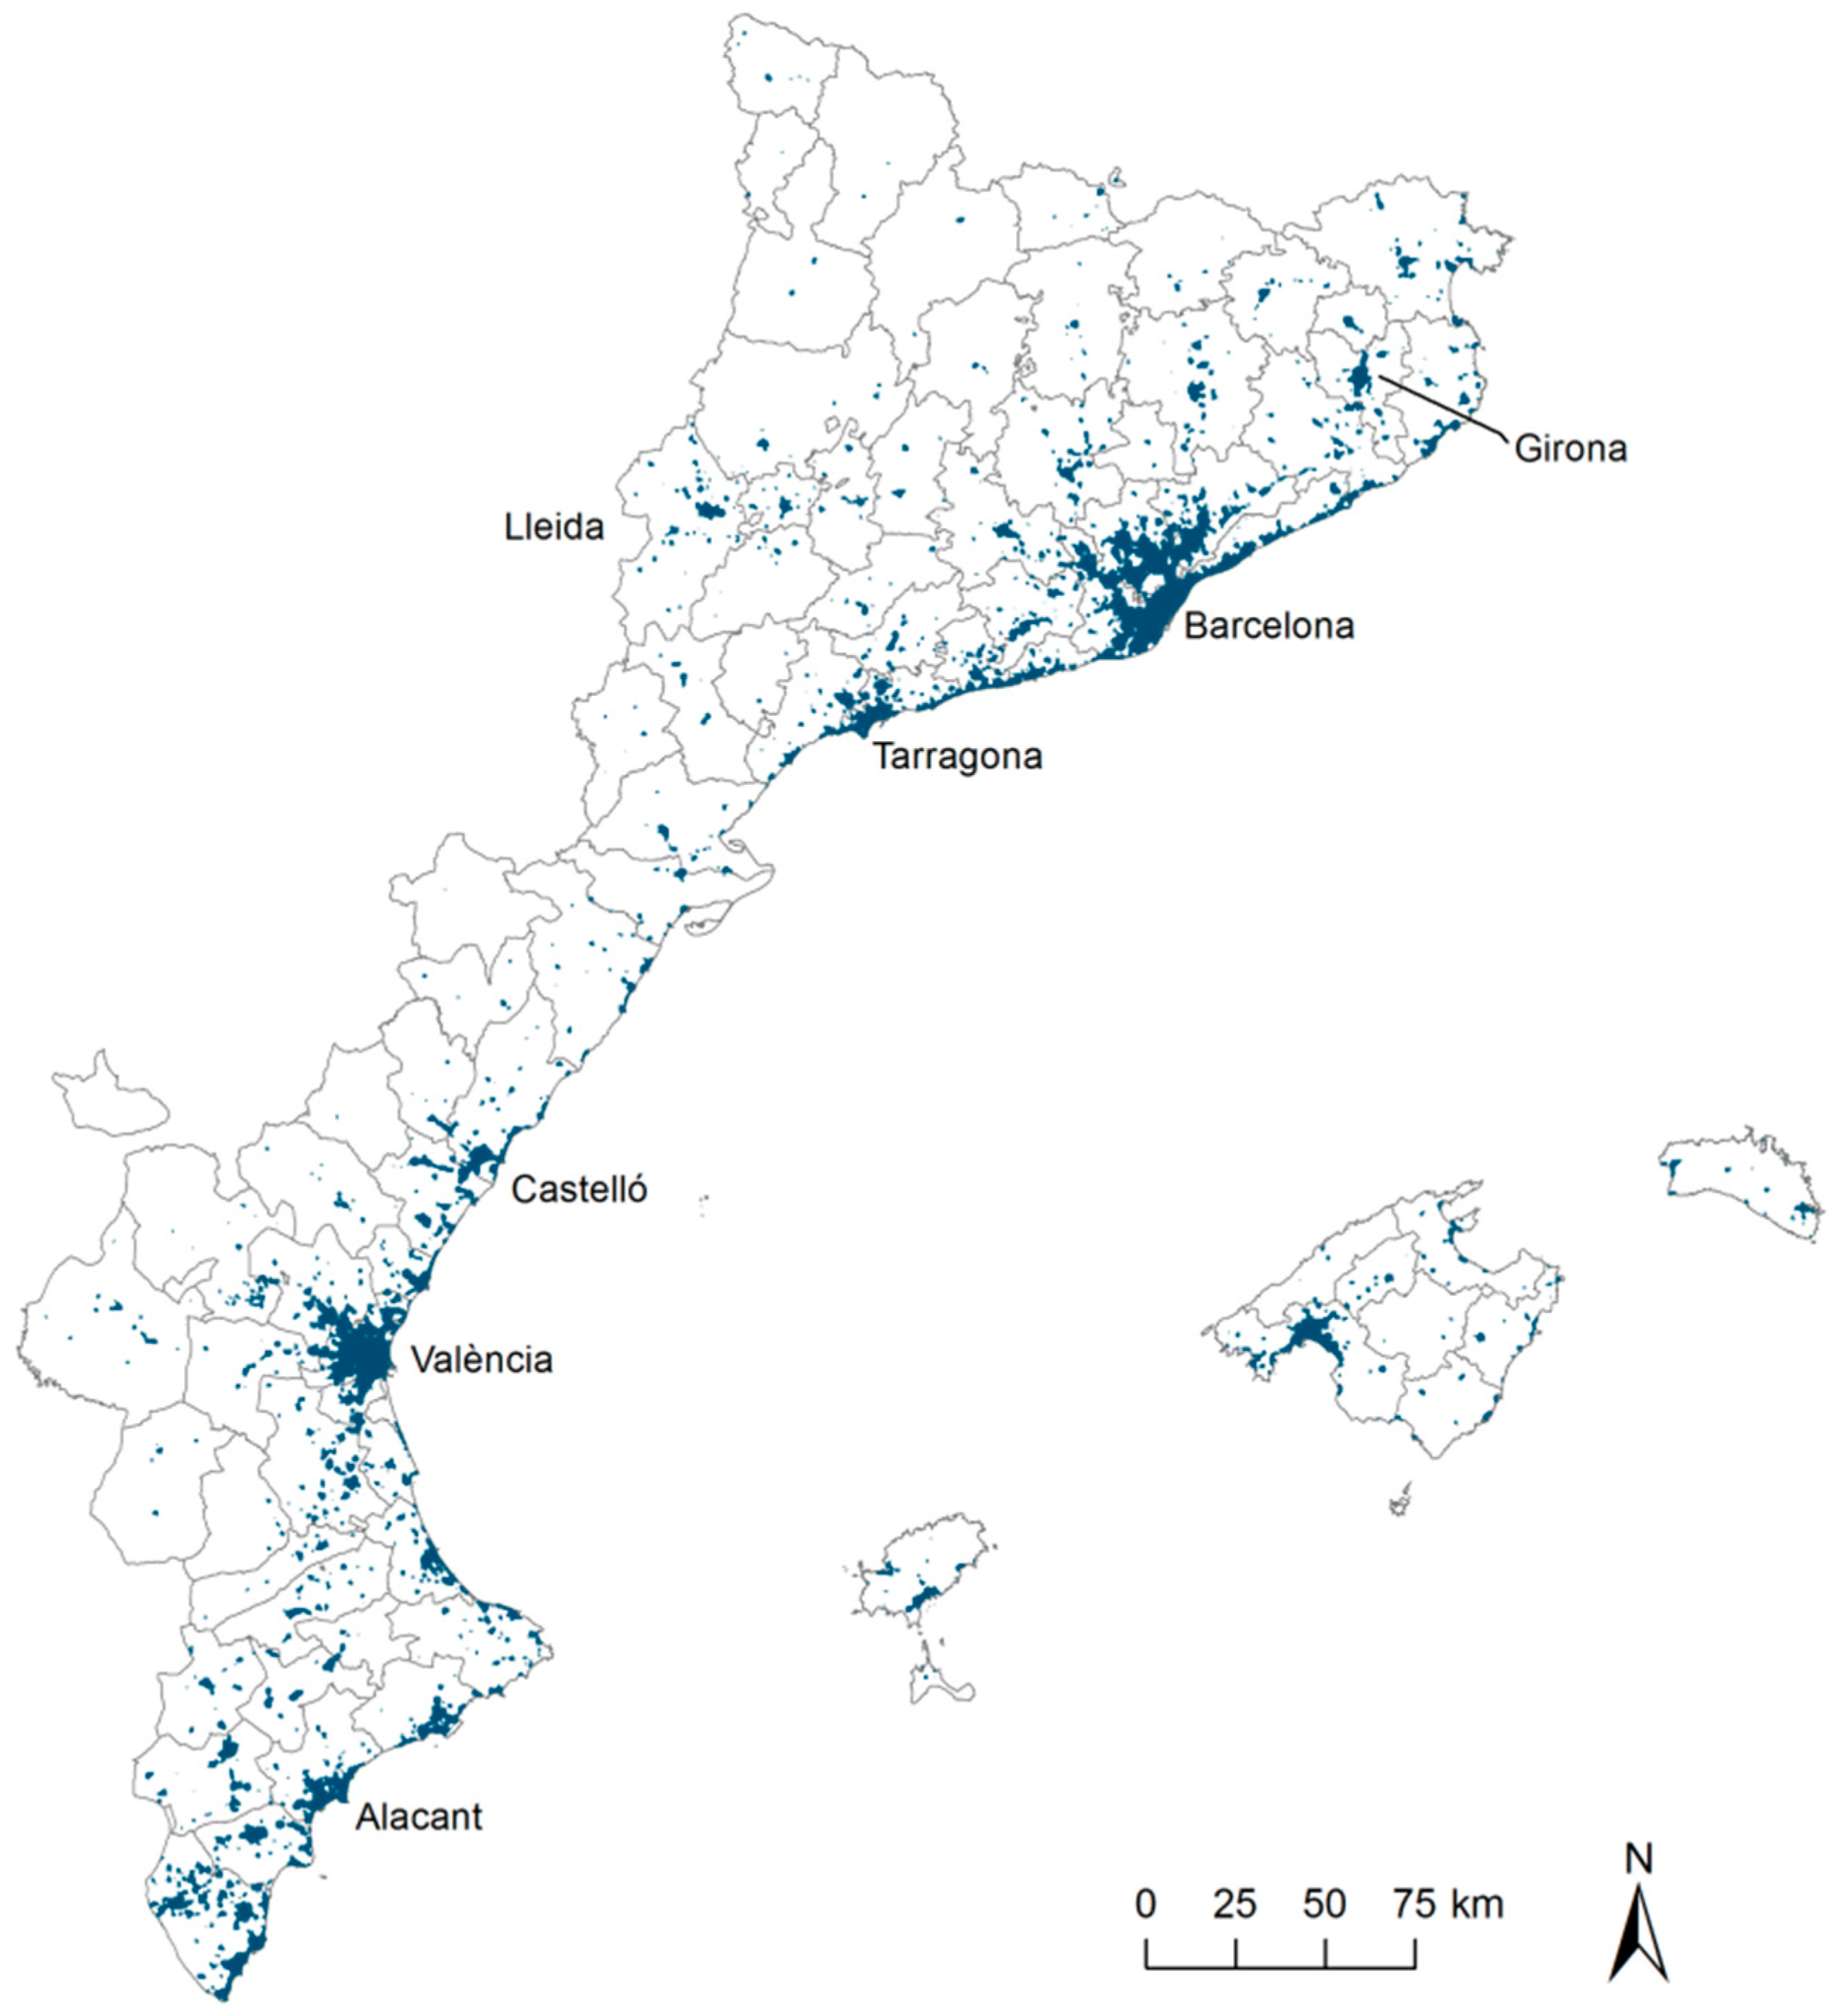
Figure 5 shows the areas above his threshold, with 290.6 km2 corresponding to the Balearic Islands (5.8% of the overall territory), 1938.8 to Catalonia (6%) and 1807 to Valencian Community (7.8%), which was the community that proportionally had the largest extension of urban intensity. It should be noted, however, that the area with the greatest urban intensity is not spread uniformly over the territory but traces a highly urbanized corridor along the coastline, most particularly around the two largest metropolitan regions—Barcelona and València—, as well as around Girona and the Costa Brava, the Camp de Tarragona, the Plana de Castelló, Alacant-Elx, and the Badia de Palma. Comparison with the surface area of artificialized land derived from other sources shows a close fit between the two values: in the case of Catalonia, for example, 1.02 km2 of urban brightness was detected for every km2 identified by the CREAF as urban land cover.
However, the results of some areas compensate those of others with respect to the relationship between artificialized land and urban brightness, so that a correlation as close as this may be somewhat deceptive. We have studied the relationship between the artificialization of land and brightness in [30]. In that work we showed that the use of data from the period 1992–2012 for the largest Spanish cities produced a ratio between artificialized land and urban light of 1 to 1.83. The very marked contrast with the results of the data from 2017 is due to the capacity to make much more accurate calculations with the Suomi NPP VIIRS images.
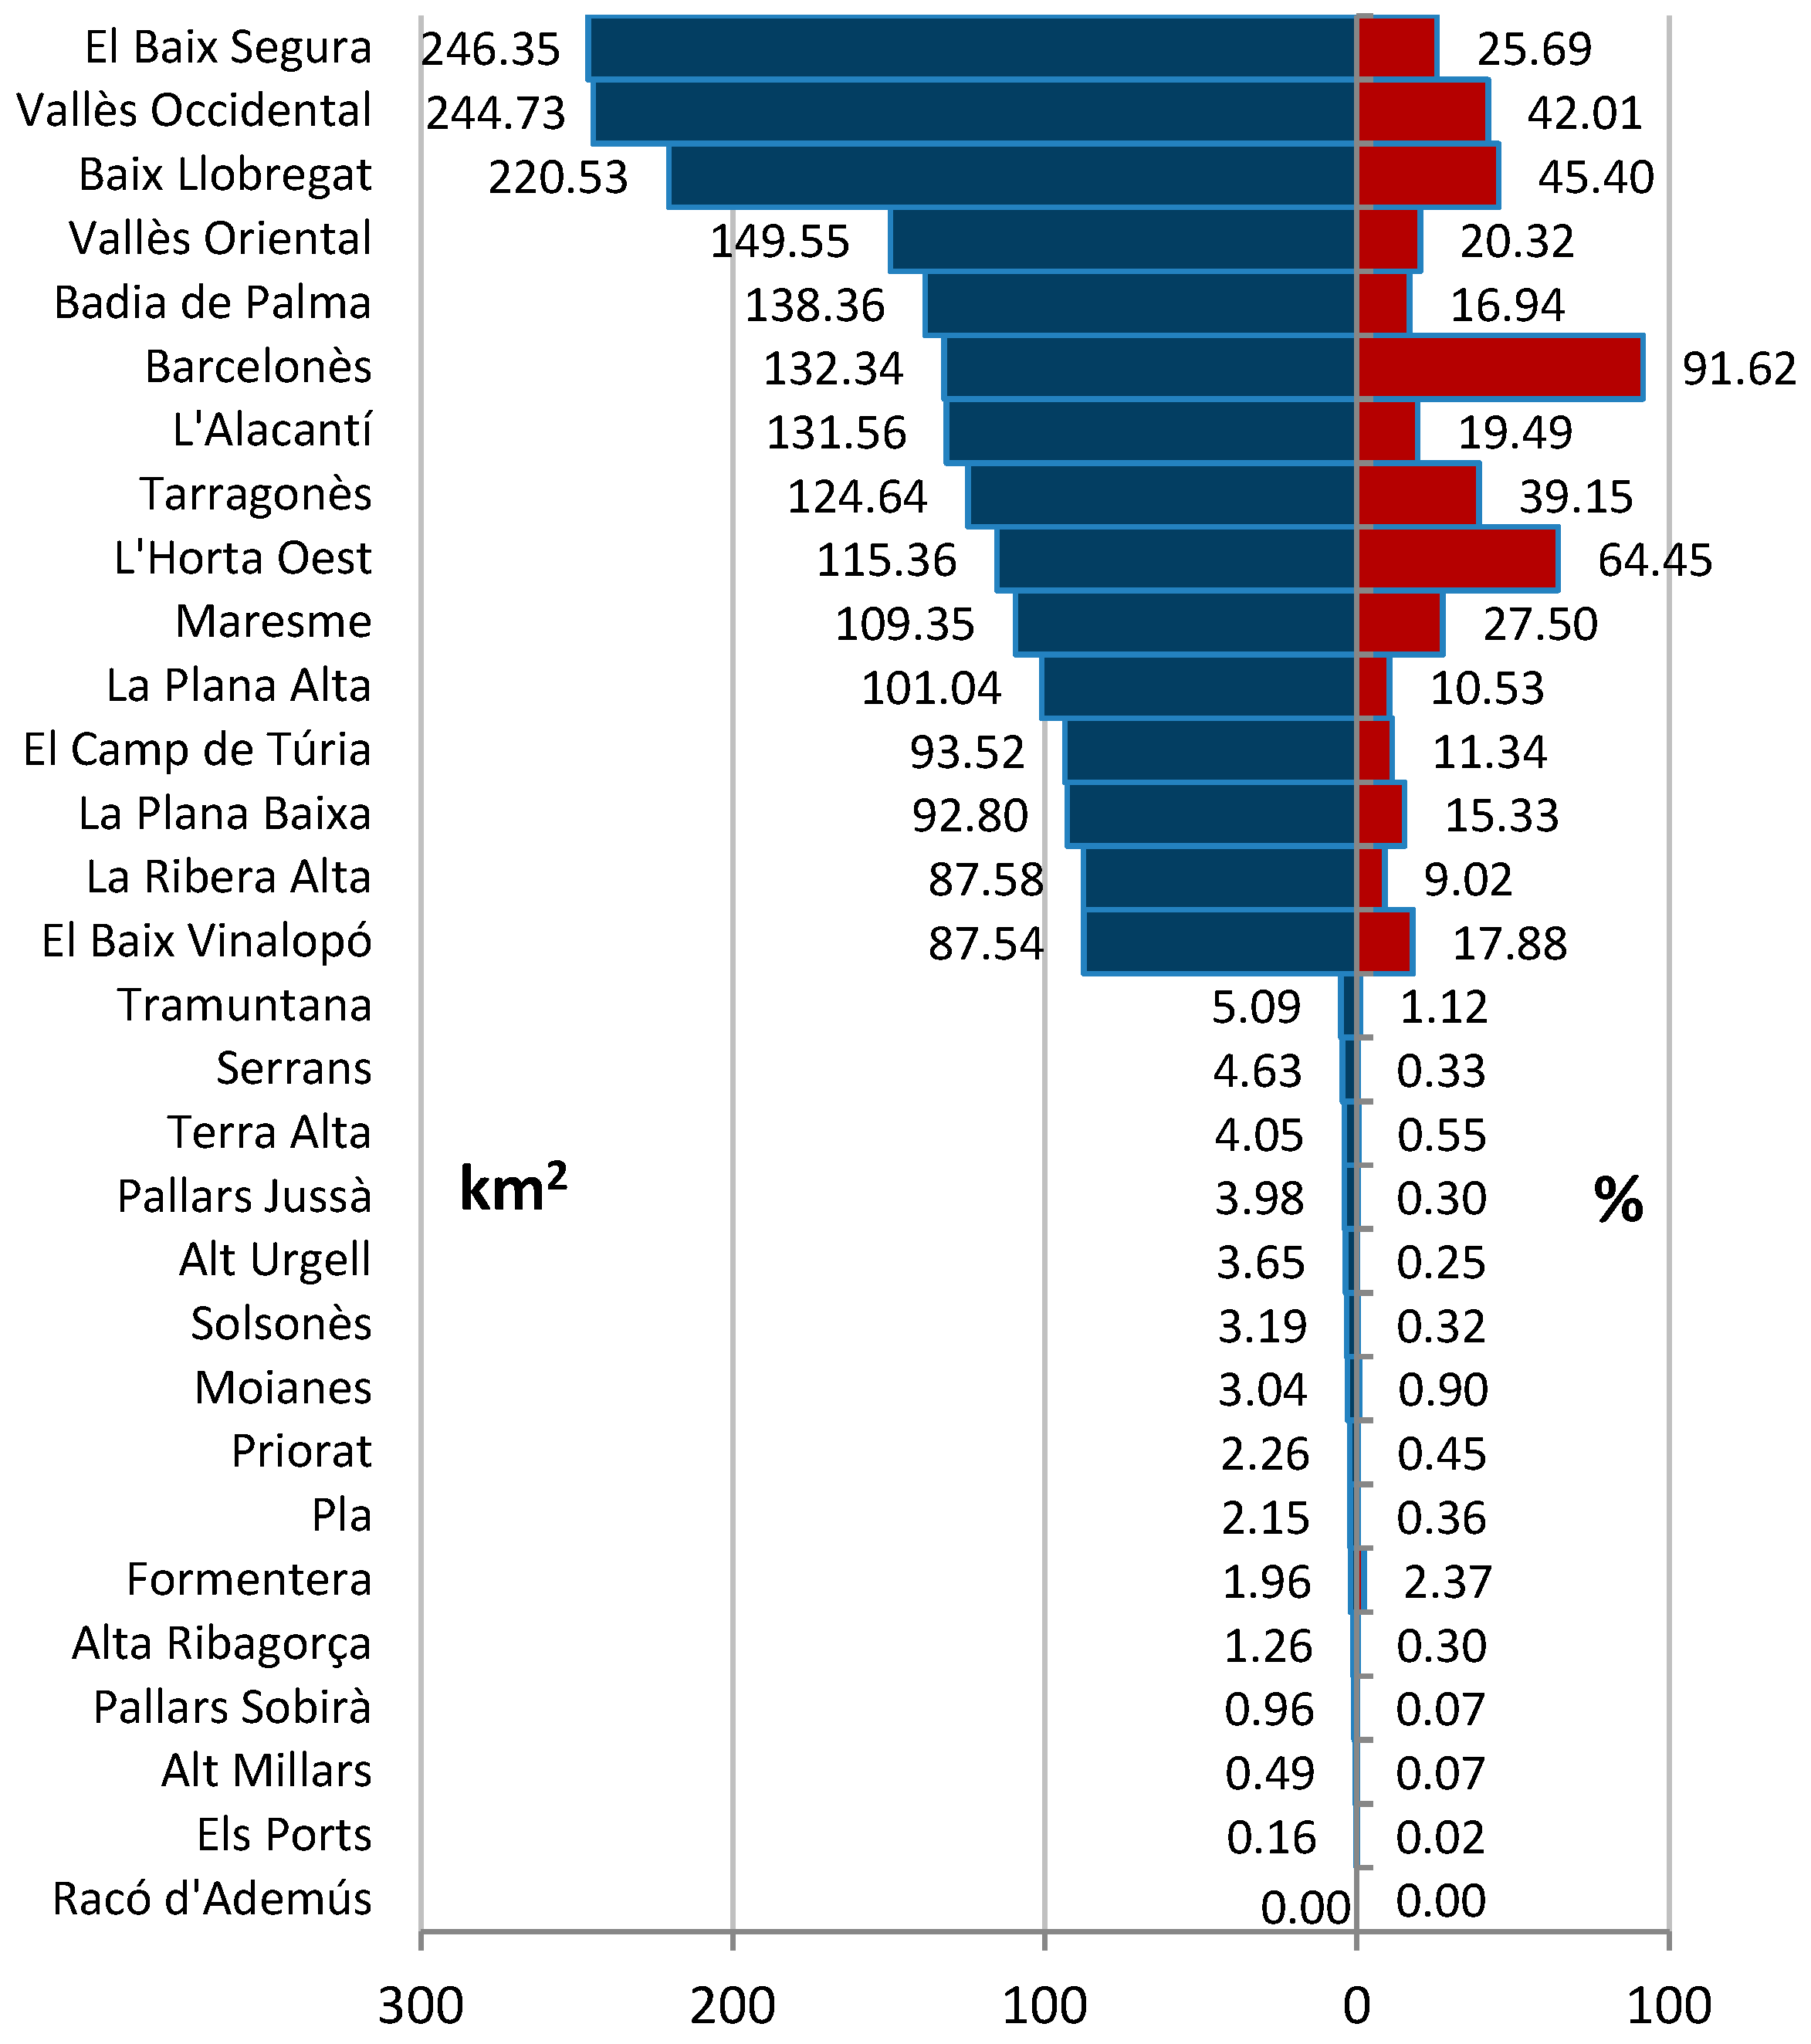
It would be wrong to suppose, however, that the largest areas of urban brightness in absolute terms are to be found in the most heavily populated districts: in fact, two of the most populated districts, Barcelonès and València, occupy the sixth and seventeenth positions, respectively, in the ranking of districts by surface area of urban brightness. In contrast, the districts with the largest extensions of land with urban brightness are characterized by more dispersed urbanization: the Baix Segura, on the southern border of València, with 348,622 inhabitants (INE 2017 [31]), has three times more surface area with urban brightness than València, with a population of 787,808. Similarly, the Vallès Occidental, with 910,031 inhabitants, has double the surface area with urban brightness in Barcelonès, with a population of 2,248,227. Urban brightness therefore clearly shows that the extension of urbanization does not necessarily correspond to a high density of population in much of the study area. This is because much of coastal developments related to tourism and second homes, covering a very large area, are of relatively low population density. Other factors such as the location of communication corridors, industrial plants and intensive agriculture along the coastline can also contribute to this effect.
The other side of the coin is represented by those districts with only a very small area above the threshold of urban light. Paradoxically, some of these districts devote a substantial part of their territory to producing energy via dams (as in the Alta Ribagorça and Pallars Jussà). Others are characterized by wine production (El Priorat and the Terra Alta), and others by tourism (the Serra de Tramuntana and the Pla de Mallorca and Formentera). In all these cases, these uses are highly urban and directly linked to the needs and dynamics of the urbanization process. An examination of urban light therefore reveals the presence, in more shaded areas, of what Neil Brenner [11] has called the “operational spaces” of the urbanization process: areas articulated by the provision of all kinds of resources and products essential to this process. Once again, it would be wrong to suppose that the evolution of these areas is not indissolubly linked to urbanization.
3.1.2. The Intensity of Urban Brightness
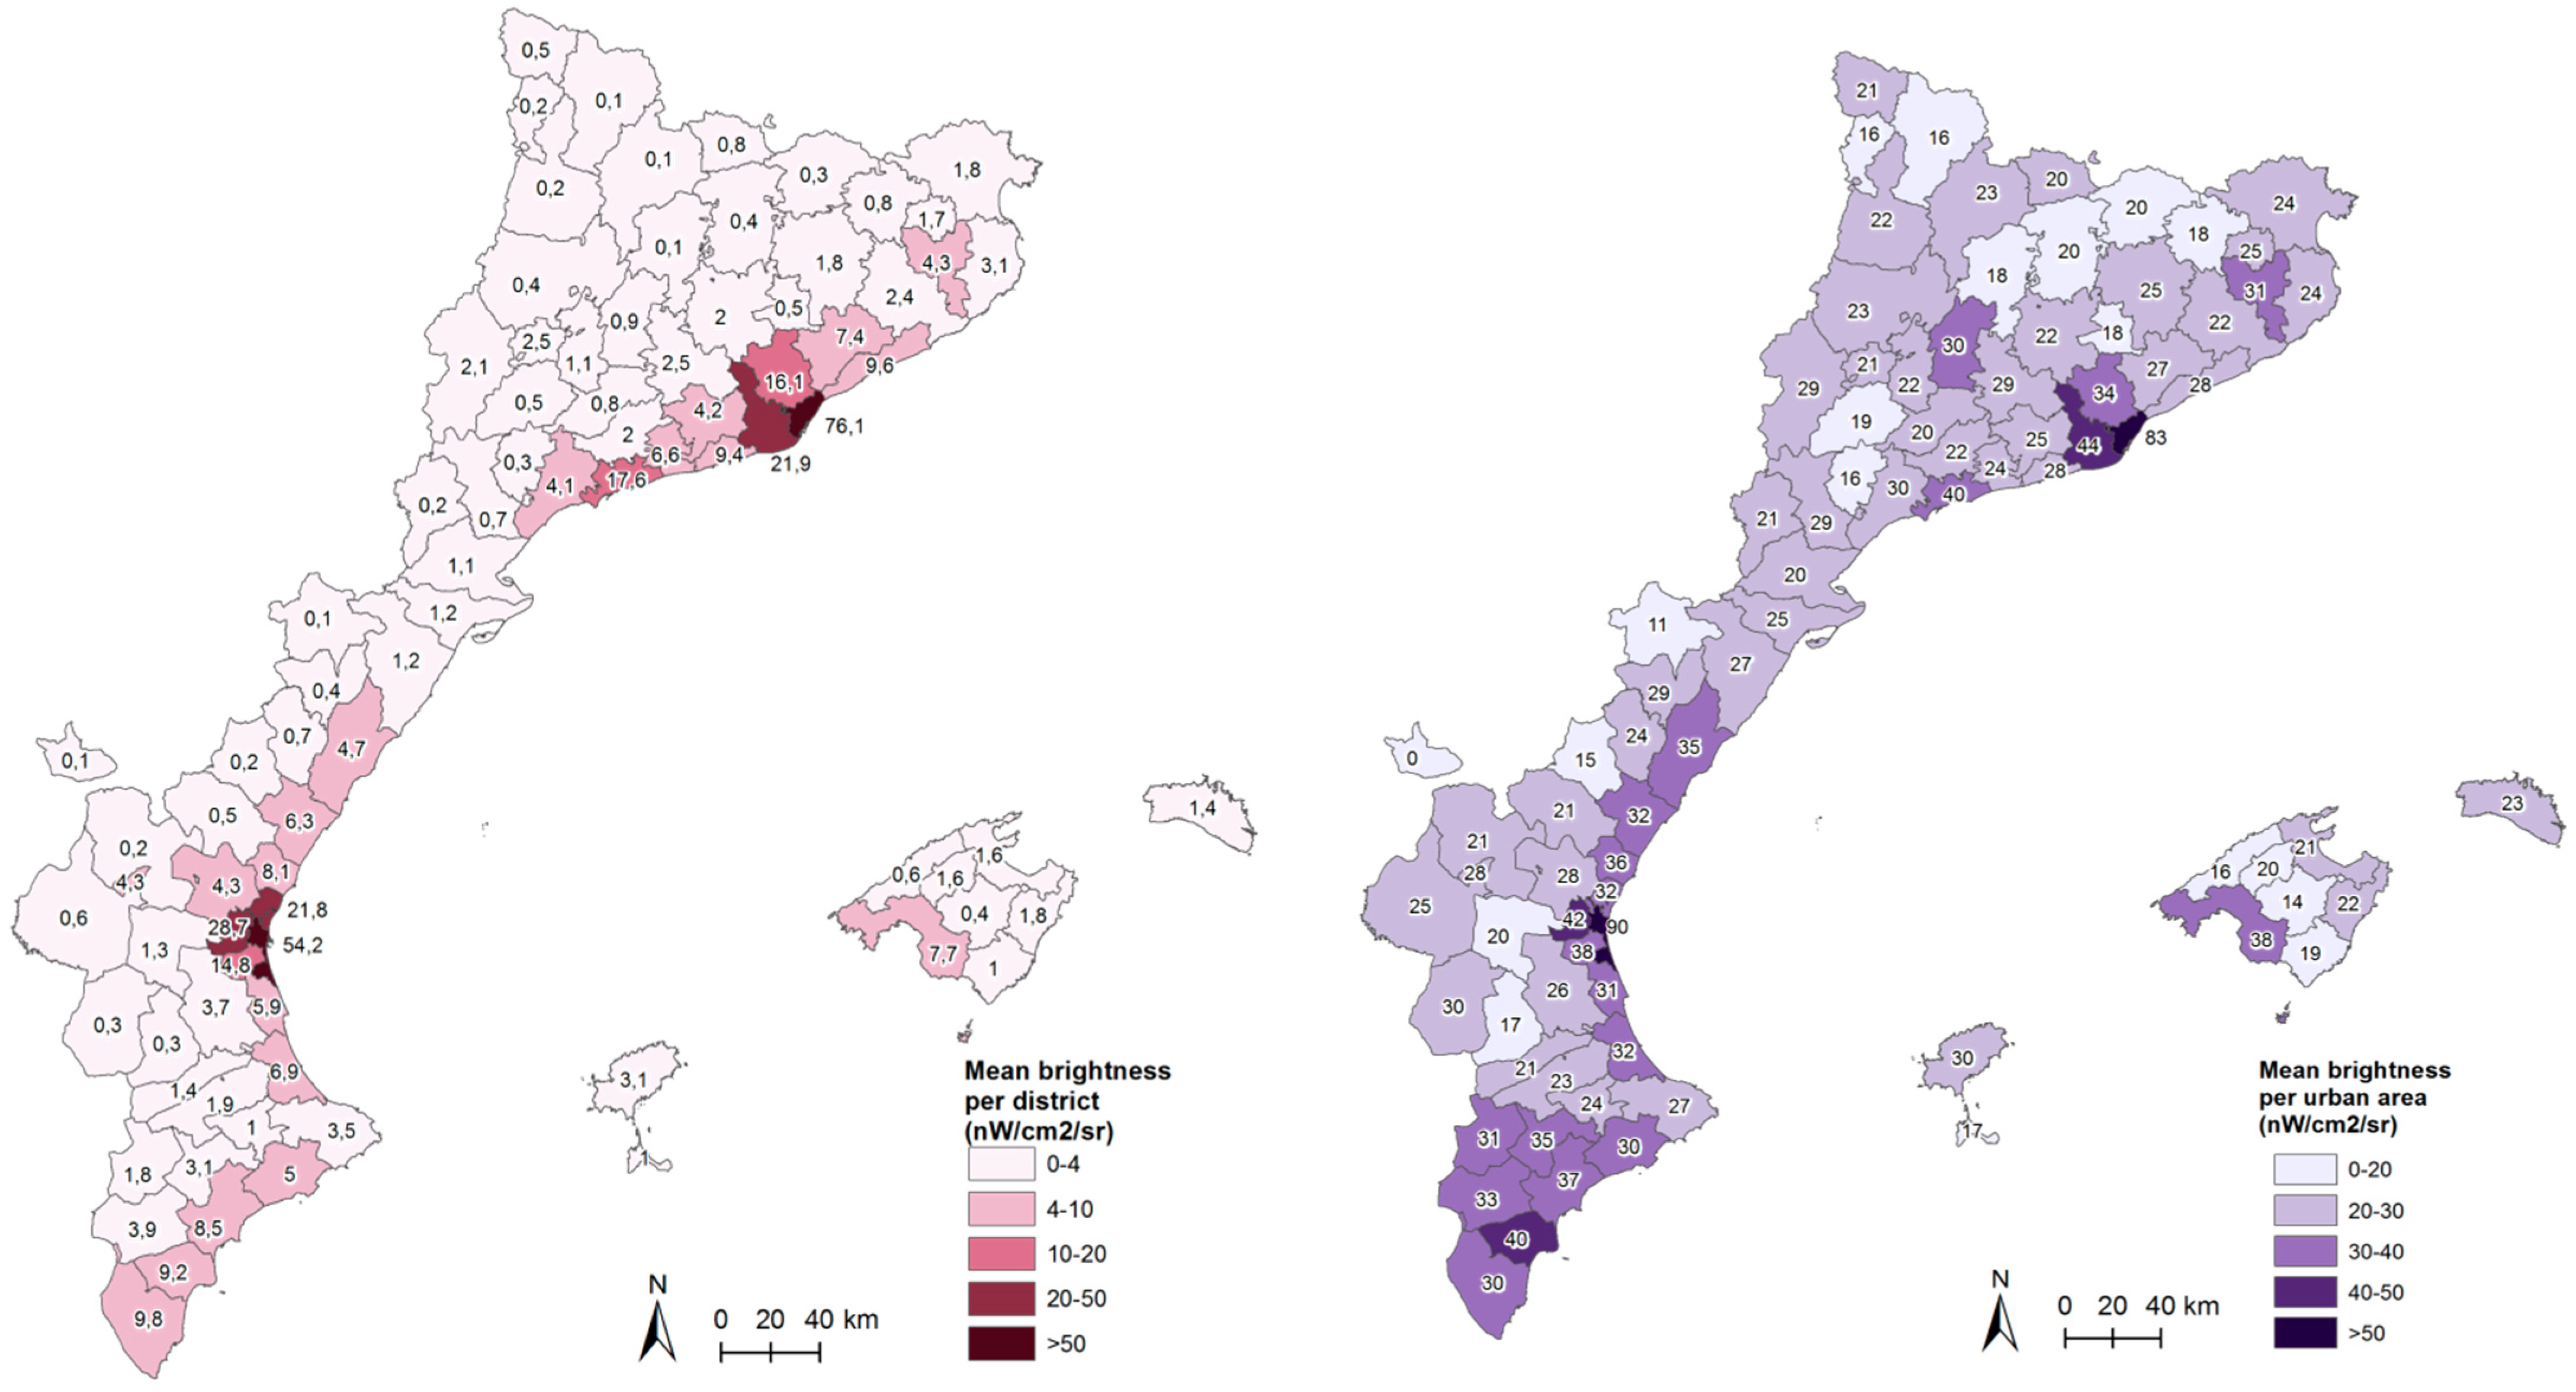
The calculation of the mean brightness per district allows us to fine-tune still further the relationship between the level of brightness and the intensity of urbanization. The first step involves obtaining the weighted mean brightness of each territory. The weighted mean brightness value corresponds to the total of the brightness values for each pixel multiplied by its surface area and divided by the total surface area of the area under consideration. In the study area as a whole the weighted mean is 2.94 nW/cm2/sr, with some differences between communities, with Valencian at the top with 3.43, followed by Catalonia with 2.66, and the Balearic Islands with 2.46. These figures broaden the picture of the relationship between brightness, population and GDP by suggesting that the territory that is relatively the most efficient in terms of light emitted per inhabitant or per unit of product would be Catalonia. This statement undoubtedly needs to be qualified by other factors (such as data on the transient population), but these fall beyond our present remit.
Secondly, the quality of the images and the range of the values allow us to move beyond a study of the brightness of a city to one of brightness in the city. In other words, we can evaluate the mean brightness of those areas that fall within the threshold for urban brightness and thus compare the intensities of use inside these areas.
The overall mean brightness of the areas above the threshold of urban brightness is 33.76 nW/cm2/sr. As can be seen in Figure 6, this mean intensity is not uniform in all the districts. The districts containing the two most heavily populated cities stand out: València with an intensity of 89.7 and Barcelonès with 82.5. The intensity of the next highest urban areas in other districts is around half these figures. In Catalonia, Baix Llobregat presents a value of 43.6, followed by Tarragonès, Vallès Ocidental, and Gironès. In València, the brightness of Horta Oest and Baix Vinalopó is particularly noteworthy, although it should be pointed out that almost all the coastline and the land to the south of the Comarques Centrals present very high levels of brightness. On the Balearic Islands, the light from the Bahia de Palma is particularly outstanding.
3.2. Light Intensity in Terms of Time
One of the main features of the contemporary urbanization process is the fact that its dynamics tend not only to embrace an entire region, to a greater or lesser extent, but also reflect notable variations in time of the uses that characterize it. Thus, the intensity of the urbanization process varies not only in space but also in time. Despite their limitations, nighttime satellite images of the Earth offer an innovative means of observing this phenomenon, as demonstrated below by an examination of the seasonal evolution of light on the Balearic Islands and the Pitiüses.
Any analysis of seasonal variations in brightness obviously requires an indicator that measures the amounts of light emitted by each territory at various times of the year, thereby providing a basis for intra- and inter-territorial seasonal comparisons. In our case, this indicator is provided by the images of the mean monthly composites for each of the nine months available, and the variable used will be what is known as the total emitted light, also used by authors like [27,29]. This is the sum of the light values (radiant intensity) for each area/territory multiplied by its surface area and thus covers both the lit surface area and the light level, making it possible to compare a single territory on a seasonal basis, as the result obtained indicates the total light total emitted per district. In order to facilitate comparisons between different seasons and between different territories, the mean value of the light emitted by each of the latter will be correlated via an index of 100 (Figure 7 and Figure 8). In this case we have considered brightness values above 2 nW/cm2/sr in order to obviate any noise from the instrument itself, as explained in, for example, [27,32,33]. Although the threshold of urban intensity enables us to differentiate intensities as regards land use, it does not take into account any settlements with lower intensity. In this exercise our concern is to use light to measure the activity of the human presence in the territory as a whole.
The usefulness of this exercise is particularly well demonstrated by its application to a territory such as the Balearic Islands. It is well known that, in territorial terms, these islands are characterized by both the vigor of by their urbanization process [34,35,36,37] and their striking seasonal variations in activity and population as a result of tourism [38,39,40]. An analysis of the total emitted light clearly reveals the intensity and variability of both these phenomena, although it must be stressed once again that the lack of data for the months of May, June and July, as explained above, represents a significant obstacle to a seasonal analysis of light using our source.
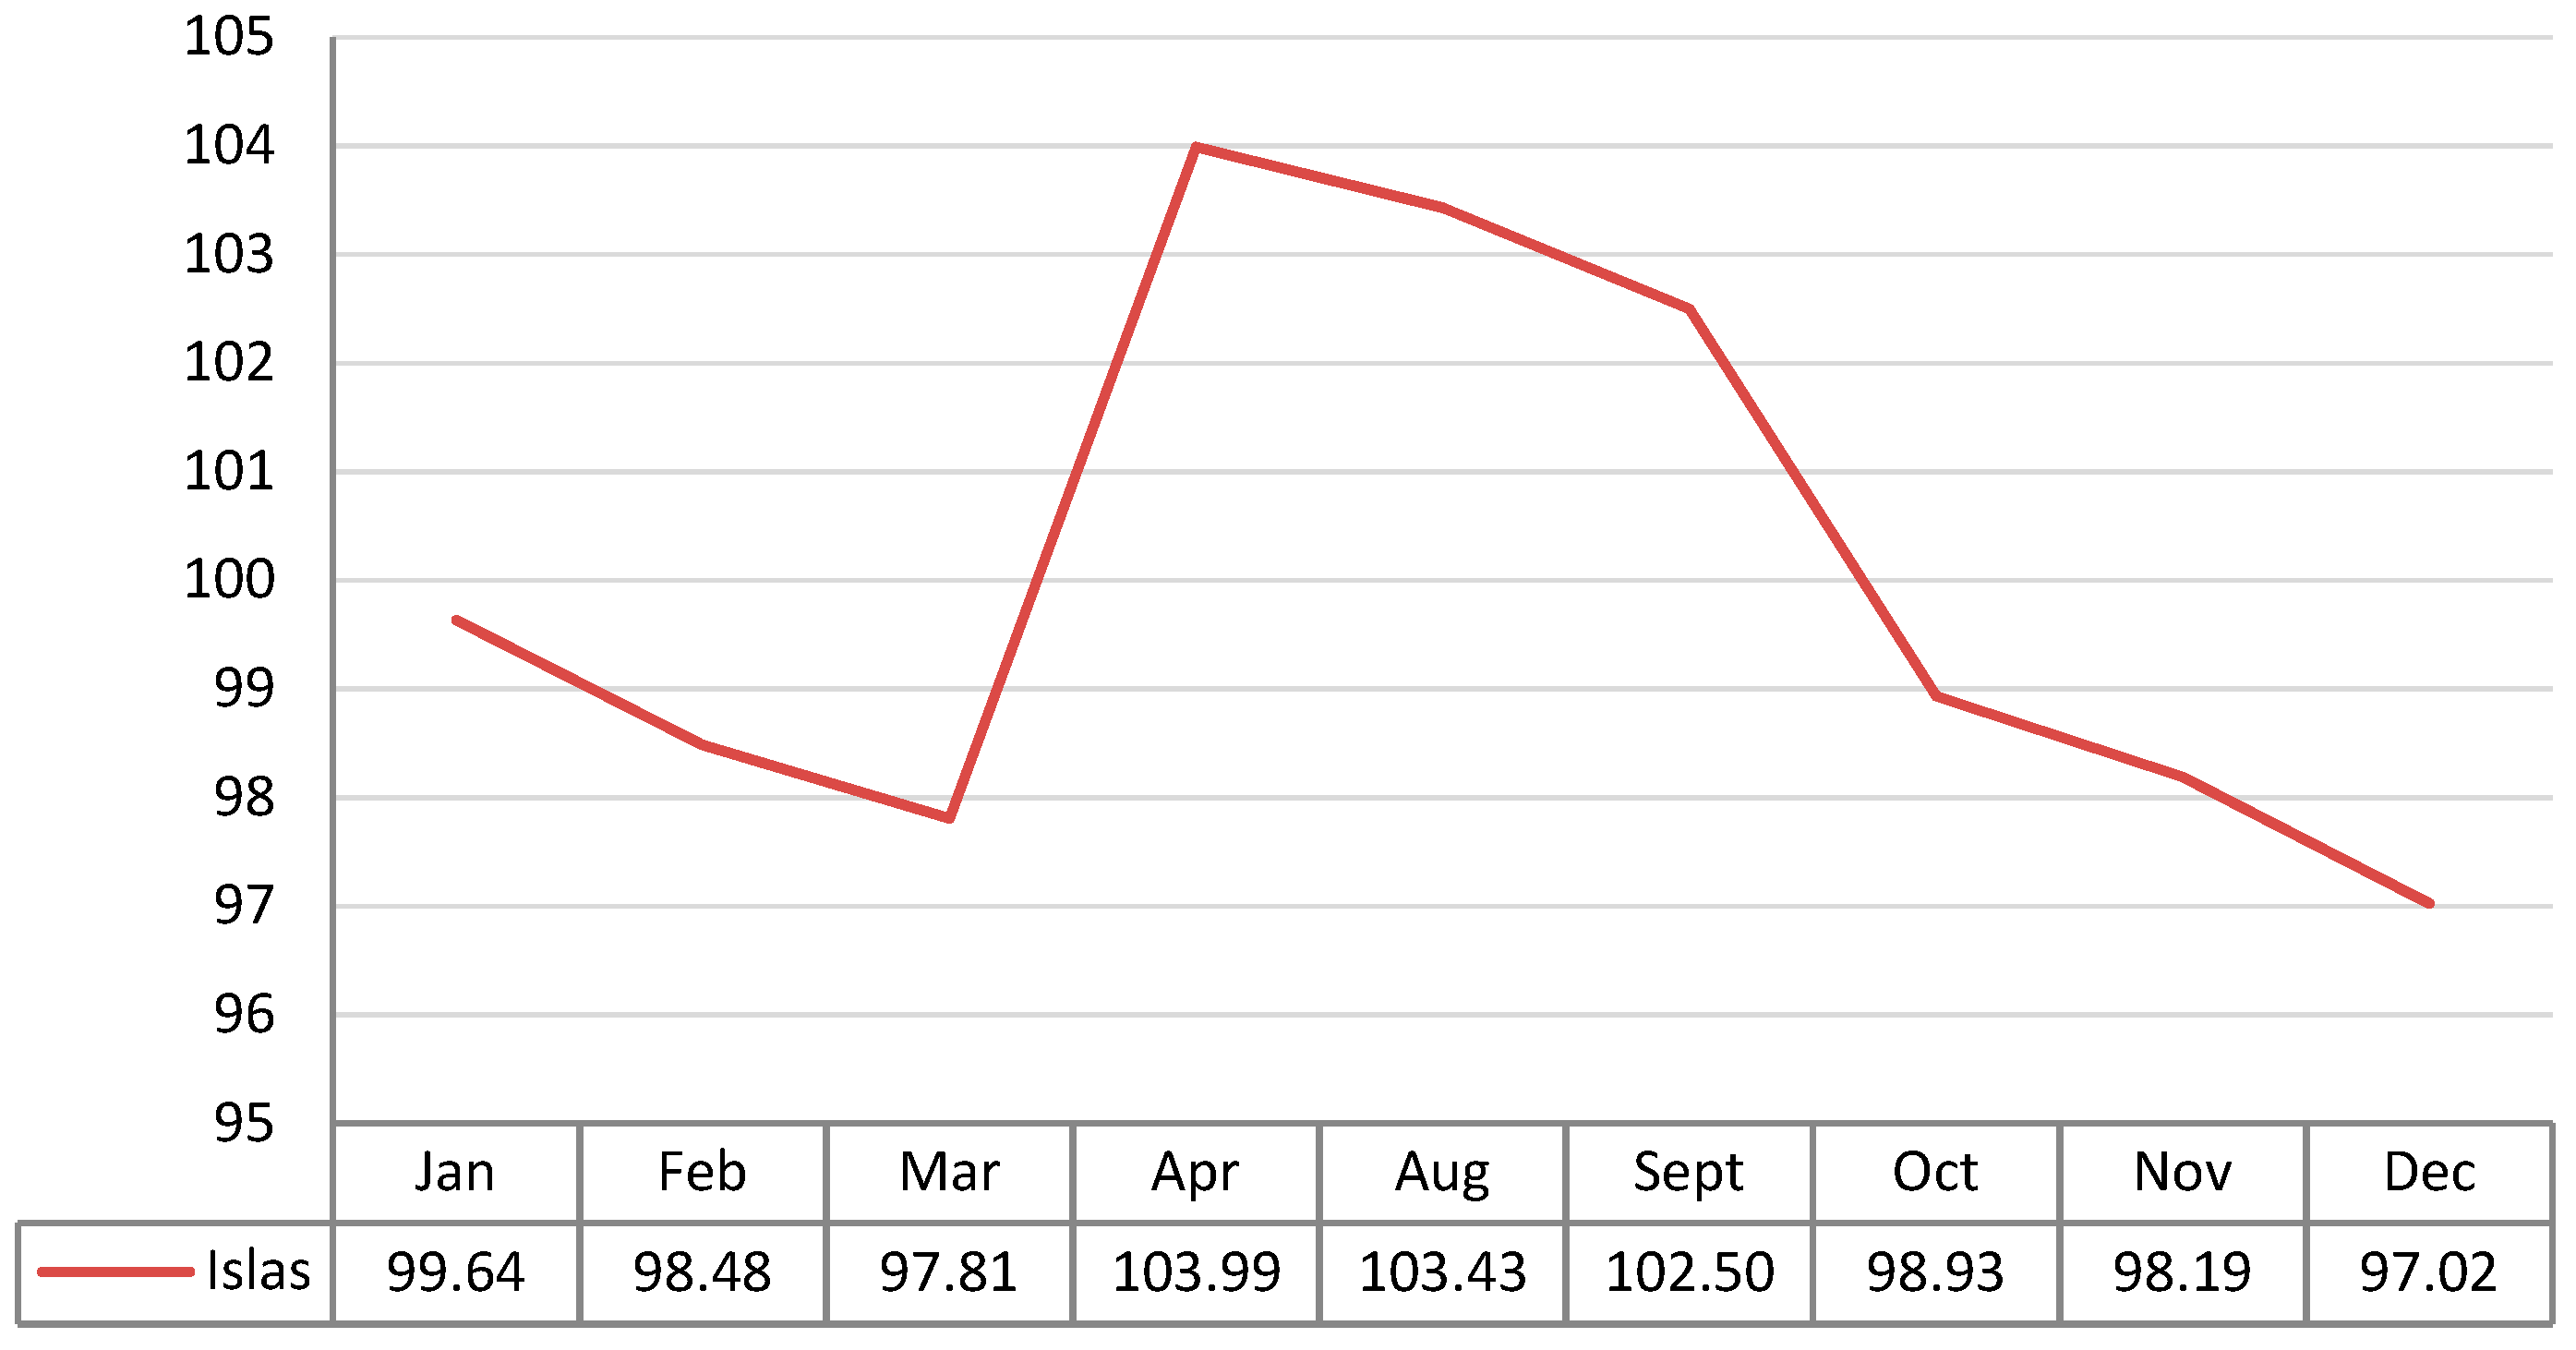
The results show that the average total light emitted in the various months of the year falls below the mean in the period from October to March but is well above it from April to September. This pattern obviously reflects the seasonal nature of the economic activities connected to the islands’ tourism. Nevertheless, the contrasts in light emission are not as marked as in other variables, as we shall see in more detail below. This suggests, in the first instance, a possibility that the seasonal increases recorded in some territories are compensated by greater stability in others.
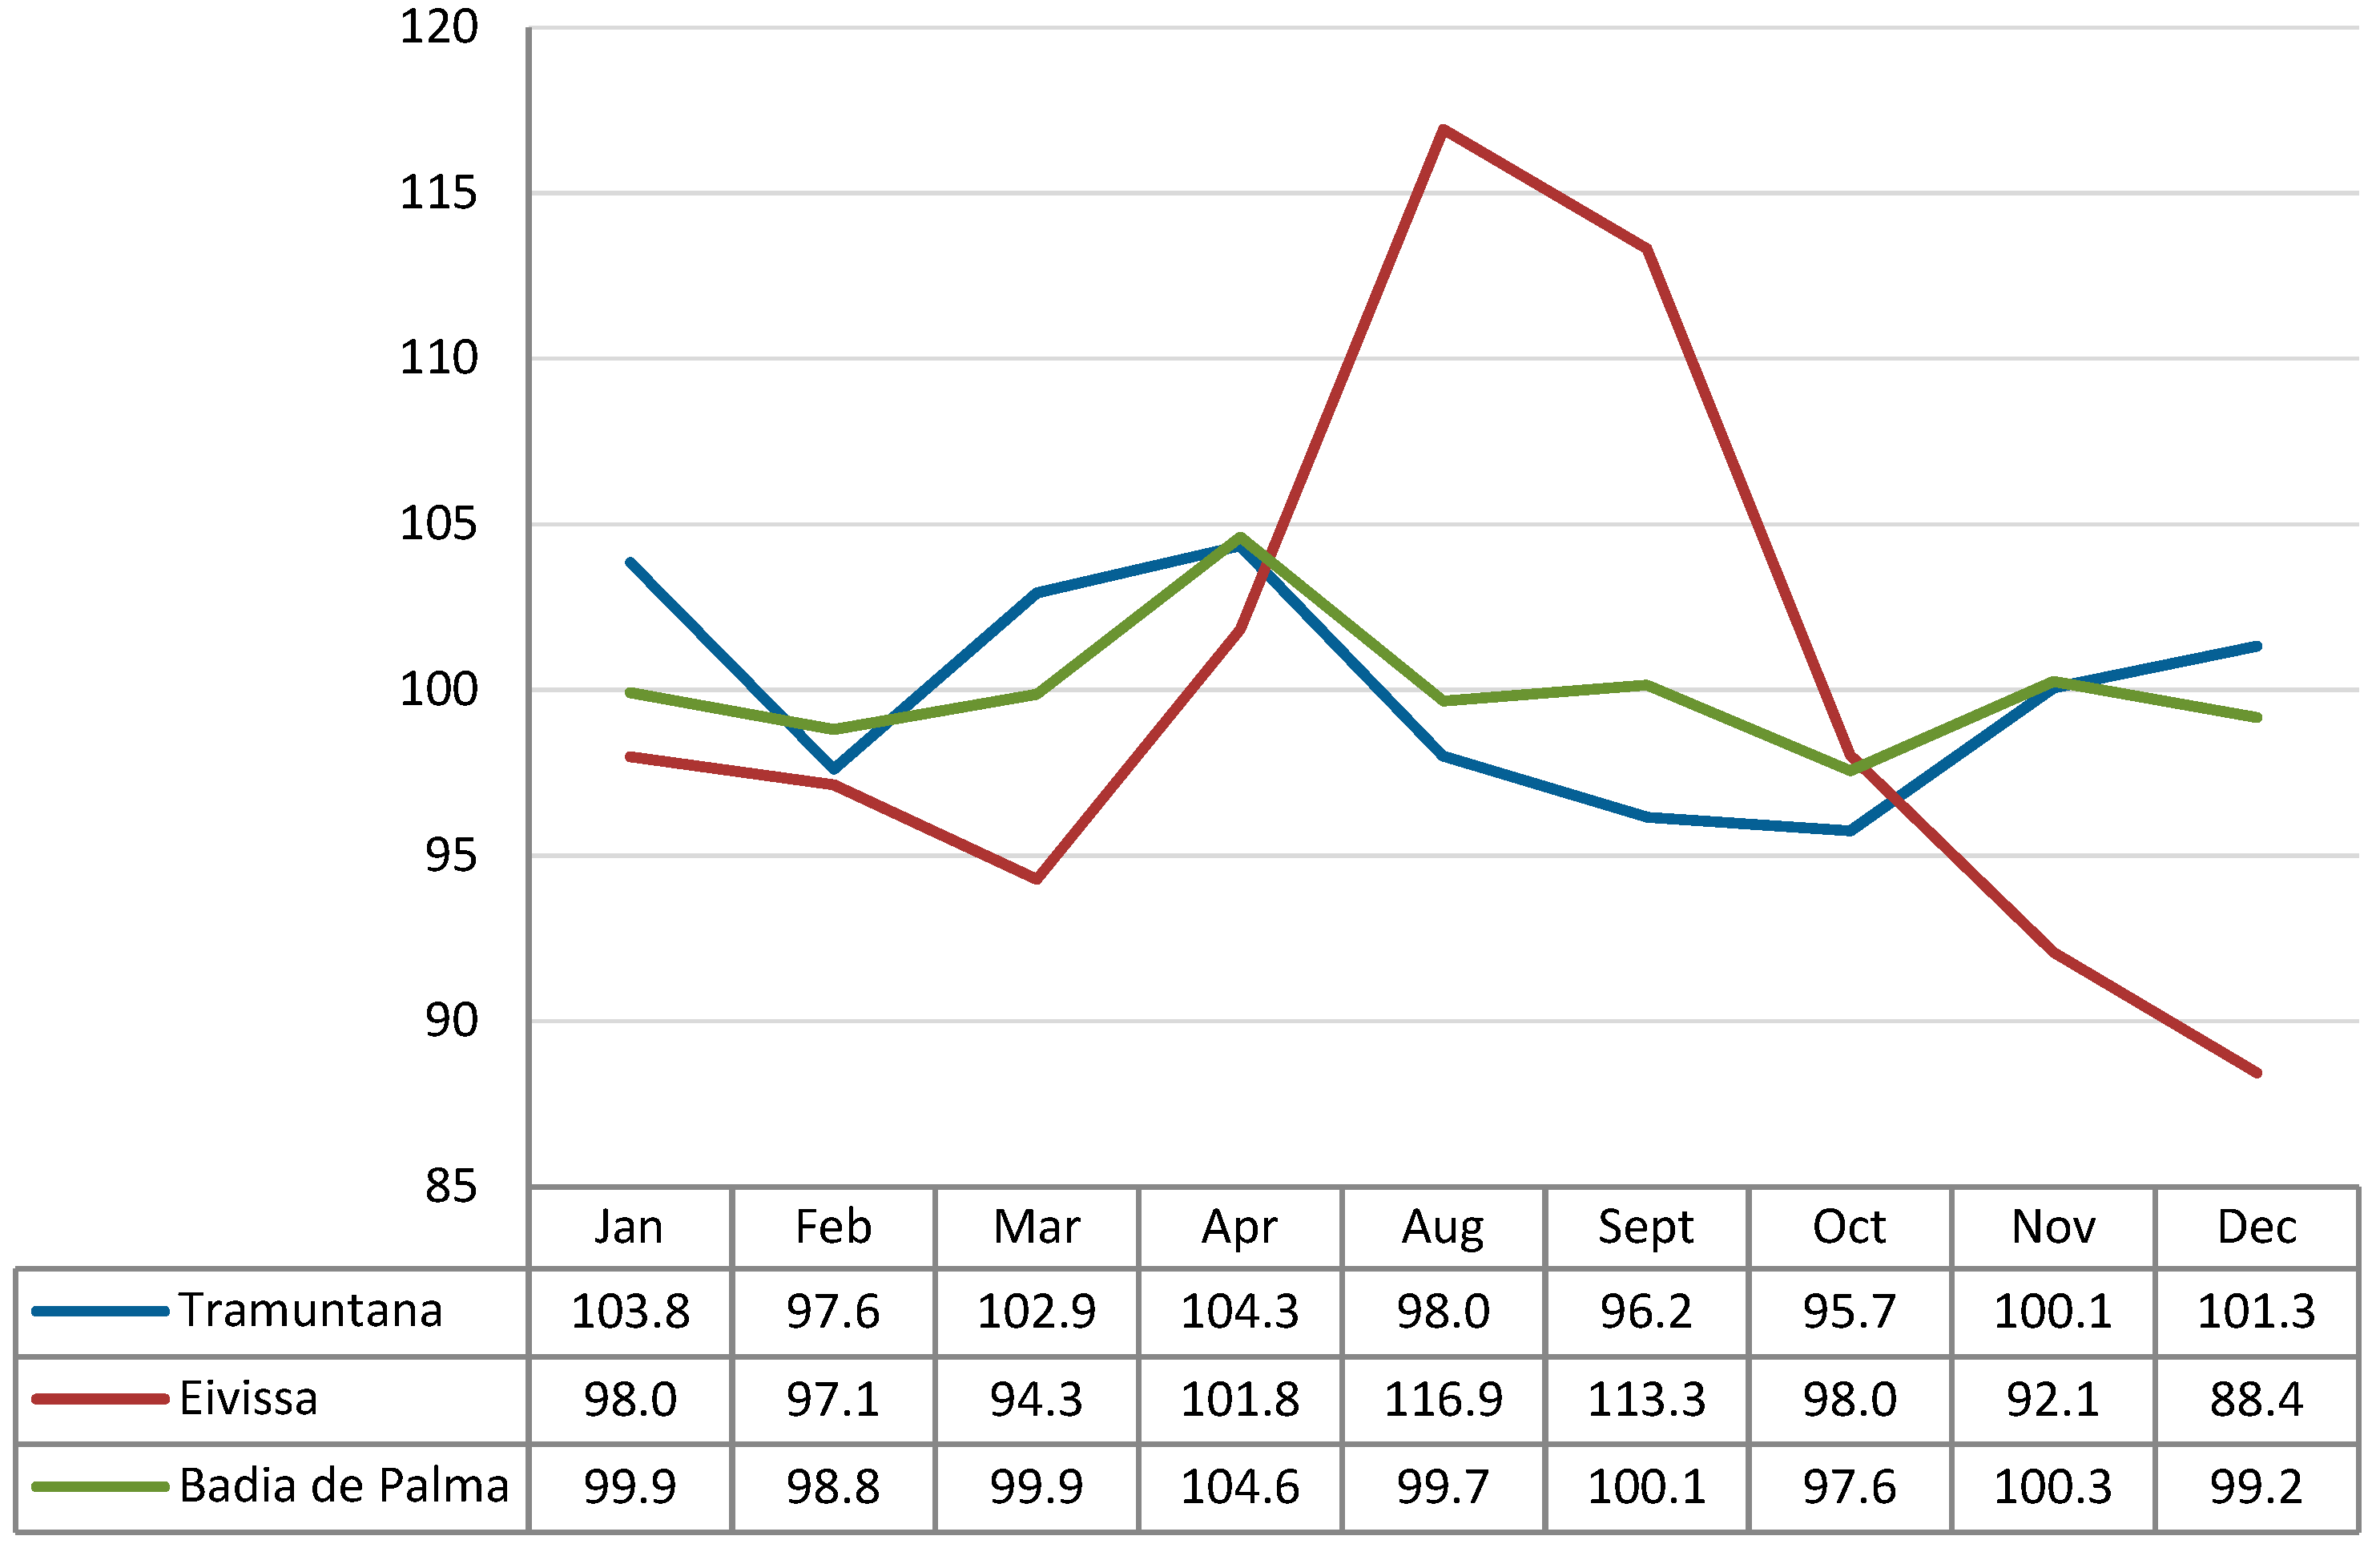
It is useful to verify these results by analyzing the differentiated behavior of the various areas of the Balearic territory (islands and districts) with respect to the whole. Thus, the ten areas under consideration can be divided into three groups, according to their seasonal behavior. First, the most numerous group would comprise the islands of Formentera, Eivissa and Menorca, as well as the areas of Nord, Llevant, and Sud in Mallorca. These areas, with behavior that would most closely reflect seasonal tourism, are characterized by very high values on the 100 index from April to September and lower ones from October to December. Overall, we could classify them as districts marked by tourism. This seasonal behavior contrasts with the relative stability of the Badia de Palma, the biggest urban hub in Mallorca. Finally, a third group, comprising mountains and the interior of Mallorca—Raiguer, Tramuntana, and Pla—present a more erratic behavior. The following figure shows three examples of this contrasting seasonal behavior.
The tendency of certain territories to give off more light in the summer months of tourist activity is thus verified, as it has been in other Mediterranean islands, but it would also be interesting to establish the sensitivity of the fluctuations in brightness to the seasonal nature of the activity, for a similar case on some Greek islands, see [33]. This involves contrasting the evolution of the data obtained from the nighttime satellite images with specific socioeconomic indicators.
To do this, we have collated the variations in the number of workers affiliated to the Social Security, as these are registered on a monthly basis on a municipal scale. On the basis of data supplied by the Ministry of Labor and Social Security on workers signed up with the Social Security on the final days of each month in 2017. It should be noted, however, that although the data on Social Security affiliation cover all workers on a monthly basis, the municipalities in which they are recorded correspond to their employers’ contribution center, which in many cases does not physically coincide with the location of their workplace. This would be the case, for example, when a hotel chain has a single provincial contribution center in which all its workers are registered, even though they are spread over hotels in various municipalities within a province. Despite this limitation, a comparison between this variable and nighttime brightness proves to be of value, as we shall see.
To make this comparison, we first grouped together all the affiliated workers from all the municipalities in each of the areas (islands and districts) used in the brightness analysis for all the months of 2017 for which data on nighttime brightness were available. We then calculated the differences in the 100 index in each district with respect to the mean number of workers in these 9 months. An examination of the districts and their relationship with the affiliated workers shows that for the islands as a whole this is 0.689. A more detailed analysis, in line with the typology of the areas studied above, shows that areas with the most intense tourist activity present an even more significant relationship (0.8507) (Table 3).
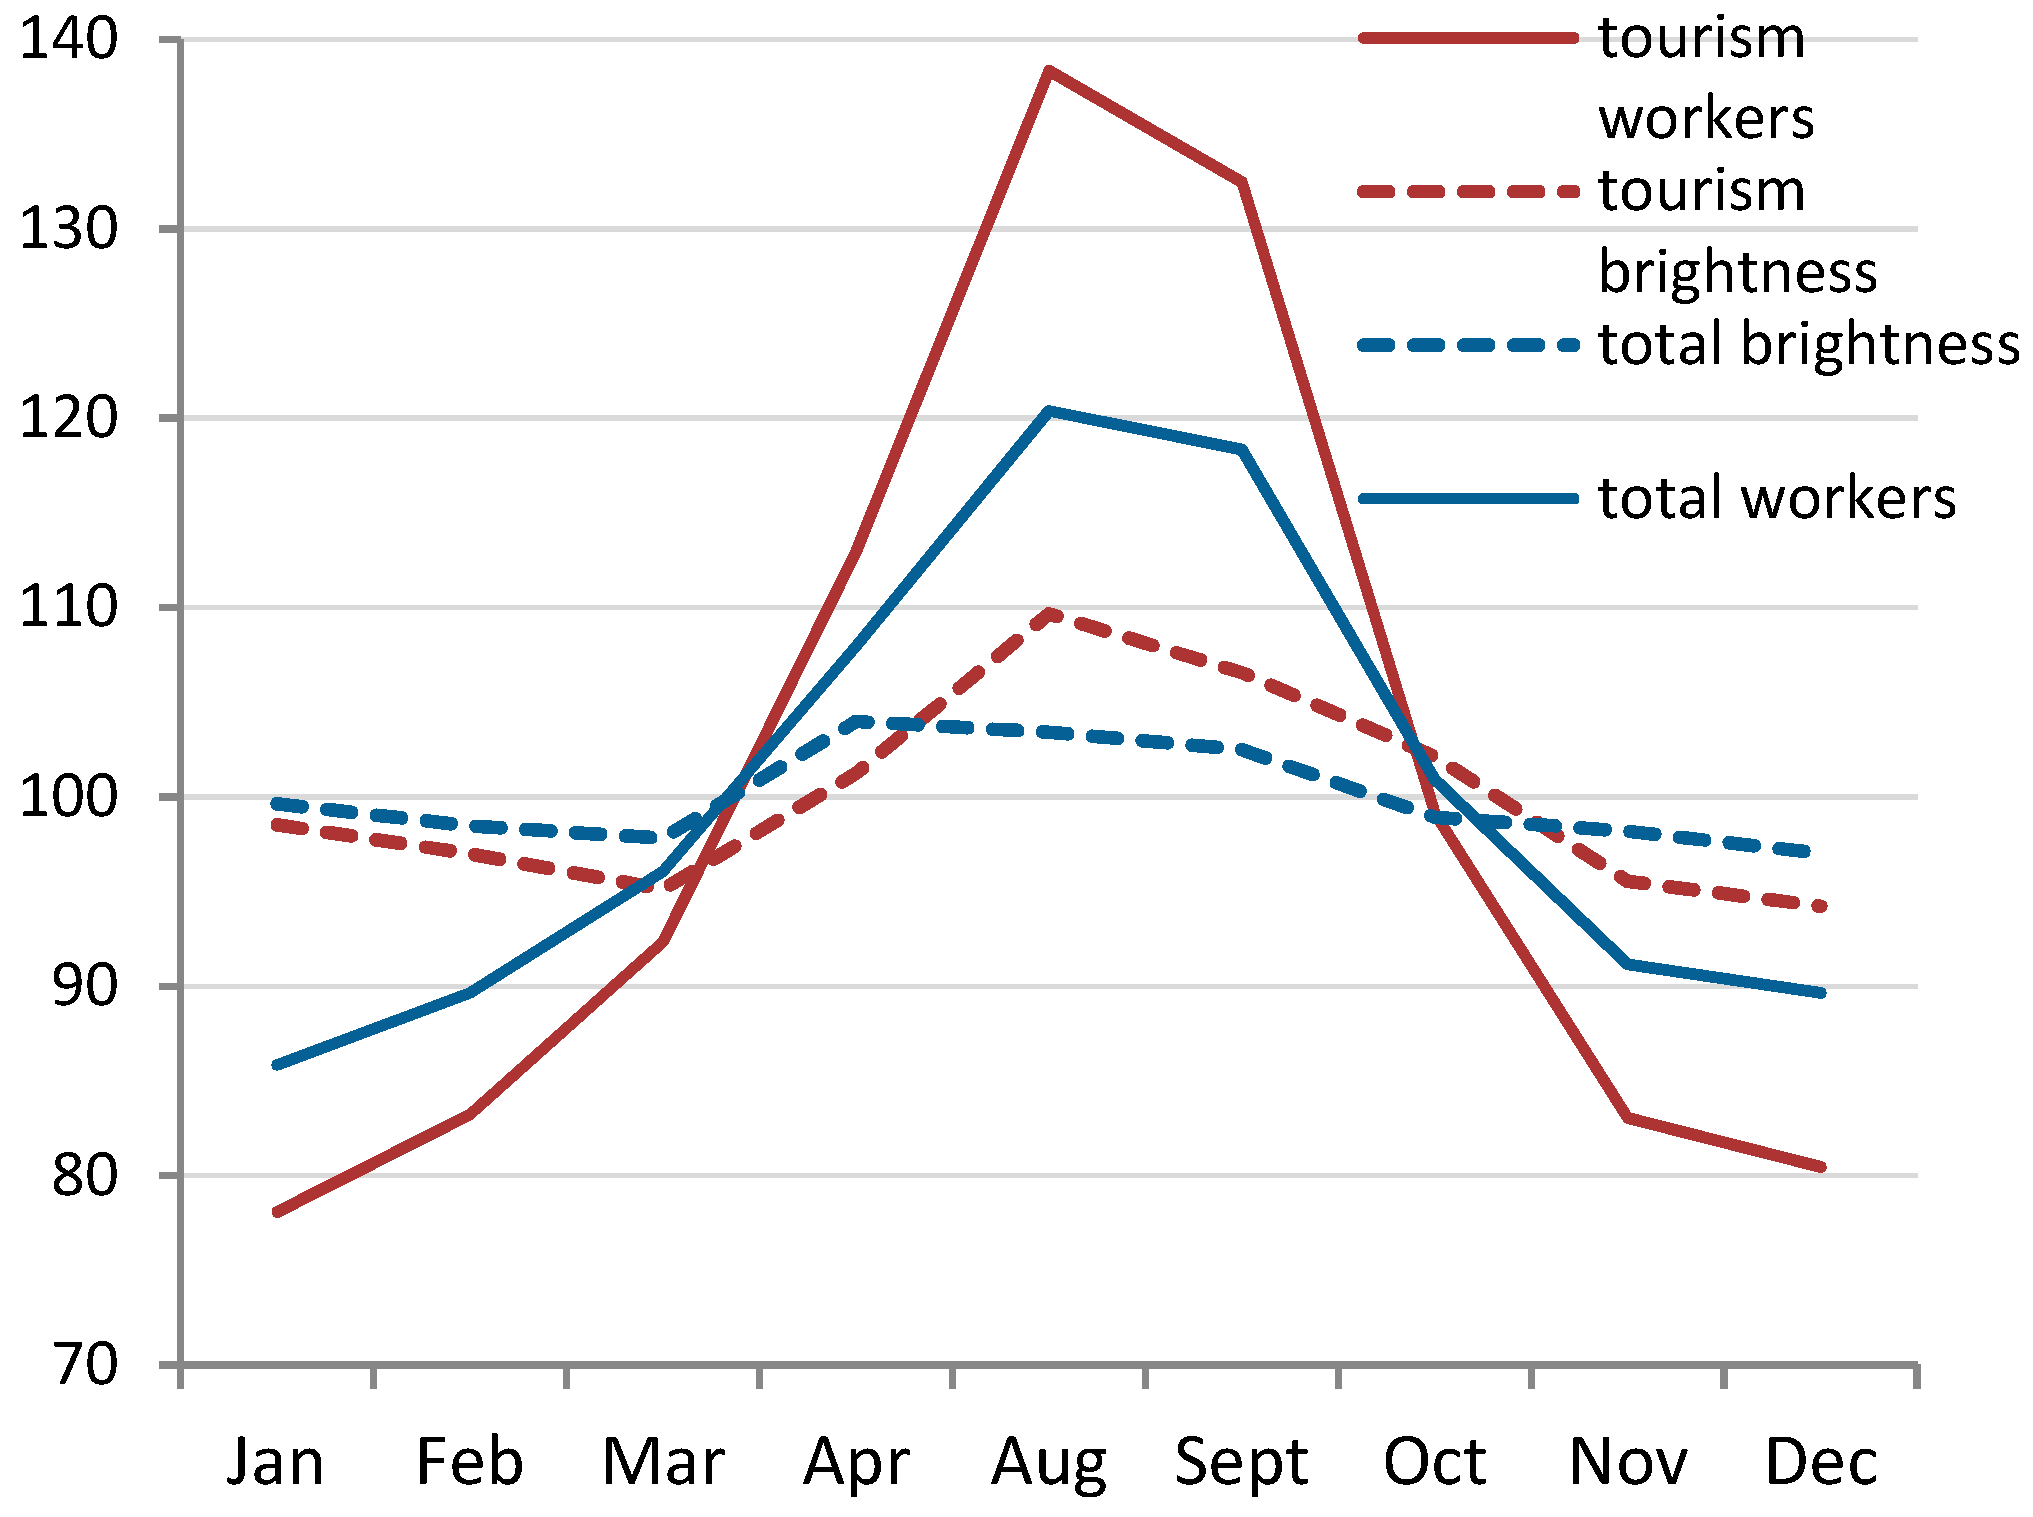
Despite this clear relationship, however, the variations in brightness are considerably less marked than changes in occupation (Figure 9). Whilst there are only 16 points (in indexed numbers) separating the months with the most and least brightness, the monthly difference in terms of affiliated workers is 60 points. Brightness is therefore sensitive to seasonal variations but it is also subject to great inertia over the course of the year. This lack of precise correlation between the intensities of light and activity is, we believe, a very significant finding, with respect to both analytical procedures and energy and environmental policies.
4. Conclusions
As stated above, this research contributes to our understanding of the urbanization process, understood not just as mere artificialization of land but also as integration and commercialization of space. This process is currently embracing the whole planet, but it obviously presents notable local differences in intensity, in terms of both space and time. The Iberian Mediterranean coastline is a good example of this phenomenon.
From a methodological viewpoint, our research has enabled us to verify that nighttime satellite images are a useful source for studying the extension, intensity and seasonality of the urban uses of territory. The most obvious conclusions can be summarized in the following six points:
- (a)
- The new sources of nighttime satellite images provide a level of detail in the analysis that is greatly superior to that of even the most recent series previously available. This makes it possible, for example, to fine-tune the correlation between artificialized land and areas with degrees of urban brightness, even though this correlation may partly be due to data from different areas compensating for each other.
- (b)
- As regards the spatial intensity of urbanization, the study of brightness shows that those districts with the greatest extensions of urban light do not necessarily correspond with the most densely populated areas.
- (c)
- Similarly, the absence of urban brightness does not automatically indicate an absence of urban uses. In contrast, areas deprived of this light intensity are in fact characterized by the presence of uses such as energy production activities related to tourism—activities which result from their integration in and interdependence with the urbanization process.
- (d)
- Light intensity can serve as an indicator of efficiency, as regards use of territory and resources, distribution of population and production of goods and services. The diversity of the situations detected on the Mediterranean coastline attests to this.
- (e)
- As regards the intensity of urban uses over time, brightness can again serve as a good indicator. The variations in the intensity of light in territories primarily devoted to tourism makes this clear. Deepening the study of the relationship between spatial intensity and time intensity of urban luminosity is without a doubt, one of the most interesting challenges that this line of research will face in the future.
- (f)
- However, brightness, despite its evident relationship with the evolution of socioeconomic variables (for example, seasonal variations in employment) presents a limited sensitivity to these variations, which suggests that there is still much work to be done on measures aimed at adjusting the intensity of brightness to that of activity.
Nighttime satellite images therefore represent, despite their limitations, an instrument with great potential for both the study of the urbanization process and the provision of information that could underpin territorial, environmental and energy policies.
Author Contributions
Both authors intervened in the conceptualization and general outline of the paper. J.C. was in charge of data correction and preparing the original draft that was their reviewed and edited by both authors.
Funding
This research was funded by Institut d’Estudis Catalans (IEC) as part of the project In Lumine Sapientia. The urbanization process in Catalonia, Valencian Community and the Balearic Islands in the light of nighttime satellite images of the Earth.
Conflicts of Interest
The authors declare no conflict of interest.
References
- Benevolo, L.; Erbani, F. La Fine della Città; Laterza: Bari, Italy, 2011. [Google Scholar]
- Hohenberg, P.; Lees, L.H. The Making of Urban Europe, 1000–1950; Harvard University Press: Cambridge, MA, USA, 1985. [Google Scholar]
- Capel, H. La Definicion de lo Urbano. Estudios Geográficos 1975, 138–139, 265–301. [Google Scholar]
- Nel·lo, O. Los Confines de la Ciudad sin Confines. Estructura Urbana y Límites Administrativos en la Ciudad Difusa. In La Ciudad Dispersa. Suburbanización y Nuevas Periferias; Monclús, F.J., Ed.; Centre de Cultura Contemporània de Barcelona: Barcelona, Spain, 1998; p. 223. [Google Scholar]
- Harvey, D. Cities or Urbanization? City 1996, 1, 38–61. [Google Scholar] [CrossRef]
- Gambi, L. Ragionando di Confini della Città. In La Città e il Limite; Paba, G., Ed.; La Casa Usher: Firenze, Italy, 1990. [Google Scholar]
- Indovina, F. La Città Diffusa; Istituto Universitario di Architettura di Venezia. Dipartimento di Analisi Economica e Sociale del Territorio: Venice, Italy, 1990. [Google Scholar]
- Nel·lo, O. Ciutat de Ciutats: Reflexions Sobre el Procés d’urbanització a Catalunya; Editorial Empúries: Barcelona, Spain, 2001. [Google Scholar]
- Nel·lo, O.; López, J. El Procés d’urbanització. In Raó de Catalunya.La Societat Catalana al Segle XXI; Giner, S., Homs, O., Eds.; Institut d’Estudis Catalans/Enciclopèdia Catalana: Barcelona, Spain, 2016. [Google Scholar]
- Soja, E.W. Regional Urbanization and the End of the Metropolis Era. In Cities in the 21st Century; Nel·lo, O., Mele, R., Eds.; Routledge: New York, NY, USA, 2016; pp. 41–56. [Google Scholar]
- Brenner, N. Implosions/Explosions: Towards a Study of Planetary Urbanization; Jovis: Berlin, Germany, 2014. [Google Scholar]
- Soja, E. Postmetropolis: Critical Studies of Cities and Regions; Blackwell: Oxford, UK, 2003. [Google Scholar]
- Indovina, F. La Metropoli Europea: Una Prospettiva; Franco Angeli: Milano, Italy, 2014. [Google Scholar]
- Aubrecht, C.; León, J. Evaluating Multi-Sensor Nighttime Earth Observation Data for Identification of Mixed vs. Residential Use in Urban Areas. Remote Sens. 2016, 8, 114. [Google Scholar] [CrossRef]
- Bennett, M.M.; Smith, L.C. Advances in Using Multitemporal Night-Time Lights Satellite Imagery to Detect, Estimate, and Monitor Socioeconomic Dynamics. Remote Sens. Environ. 2017, 192, 176–197. [Google Scholar] [CrossRef]
- Jing, X.; Shao, X.; Cao, C.; Fu, X.; Yan, L. Comparison between the Suomi-NPP Day-Night Band and DMSP-OLS for Correlating Socio-Economic Variables at the Provincial Level in China. Remote Sens. 2016, 8, 17. [Google Scholar] [CrossRef]
- Miller, S.; Straka, W.; Mills, S.; Elvidge, C.; Lee, T.; Solbrig, J.; Walther, A.; Heidinger, A.; Weiss, S. Illuminating the Capabilities of the Suomi National Polar-Orbiting Partnership (NPP) Visible Infrared Imaging Radiometer Suite (VIIRS) Day/Night Band. Remote Sens. 2013, 5, 6717–6766. [Google Scholar] [CrossRef] [Green Version]
- Nel·lo, O.; López, J.; Martín, J.; Checa, J. Energy and Urban Form. The Growth of European Cities on the Basis of Night-Time Brightness. Land Use Policy 2017, 61, 103–112. [Google Scholar] [CrossRef]
- Shi, K.; Yu, B.; Huang, Y.; Hu, Y.; Yin, B.; Chen, Z.; Chen, L.; Wu, J. Evaluating the Ability of NPP-VIIRS Nighttime Light Data to Estimate the Gross Domestic Product and the Electric Power Consumption of China at Multiple Scales: A Comparison with DMSP-OLS Data. Remote Sens. 2014, 6, 1705–1724. [Google Scholar] [CrossRef] [Green Version]
- Boira, V.J. L’Eix Mediterrani: Entre les Dinàmiques Locals i la Perspectiva Megaregional. Documents d’Anàlisi Geogràfica 2010, 56, 91–109. [Google Scholar]
- Nel·lo, O. El Arco Mediterráneo: Un Corredor de Luz. In Grandes Temas de la Vanguardia. El Corredor del Mediterráneo; Una Apuesta de Futuro: Barcelona, Spain, 2017; pp. 56–64. [Google Scholar]
- NOAA. Earth Observation Group. Version 1 VIIRS Day/Night Band Nighttime Lights. Available online: https://ngdc.noaa.gov/eog/viirs/download_dnb_composites.html (accessed on 20 November 2017 ).
- Elvidge, C.D.; Baugh, K.E.; Zhizhin, M.; Hsu, F.-C. Why VIIRS Data Are Superior to DMSP for Mapping Nighttime Lights. Proc. Asia-Pac. Adv. Netw. 2013, 35. [Google Scholar] [CrossRef]
- Small, C.; Elvidge, C.D.; Baugh, K. Mapping Urban Structure and Spatial Connectivity with VIIRS and OLS Night Light Imagery. In Proceedings of the 2013 Joint Urban Remote Sensing Event (JURSE), Sao Paulo, Brazil, 21–23 April 2013; pp. 230–233. [Google Scholar]
- Levin, N.; Zhang, Q. A Global Analysis of Factors Controlling VIIRS Nighttime Light Levels from Densely Populated Areas. Remote Sens. Environ. 2017, 190, 366–382. [Google Scholar] [CrossRef]
- Liao, L.B.; Weiss, S.; Mills, S.; Hauss, B. Suomi NPP VIIRS Day-Night Band on-Orbit Performance. J. Geophys. Res. Atmos. 2013, 118, 12705–12718. [Google Scholar] [CrossRef]
- Kyba, C.C.M.; Kuester, T.; Sánchez de Miguel, A.; Baugh, K.; Jechow, A.; Hölker, F.; Bennie, J.; Elvidge, C.D.; Gaston, K.J.; Guanter, L. Artificially Lit Surface of Earth at Night Increasing in Radiance and Extent. Sci. Adv. 2017, 3, e1701528. [Google Scholar] [CrossRef] [PubMed]
- Alcott, B. Jevons’ Paradox. Ecol. Econ. 2005, 54, 9–21. [Google Scholar] [CrossRef]
- Elvidge, C.D.; Falchi, F.; Hsu, F.-C.; Baugh, K.E.; Ghosh, T. National Trends in Satellite-Observed Lighting 1992–2012. In Global Urban Monitoring and Assessment through; Weng, Q., Ed.; Earth Observation. CRC Press: Boca Raton, FL, USA, 2014. [Google Scholar]
- Nel·lo, O.; López, J.; Martín, J.; Checa, J. La Luz de la Ciudad. El Proceso de Urbanización En España a Partir de Las Imágenes Nocturnas de La Tierra; Grup d’Estudis sobre Energia i Territori. Universitat Autònoma de Barcelona: Bellaterra, Spain, 2016. [Google Scholar]
- Instituto Nacional de Estadística. Available online: http://www.ine.es/ (accessed on 12 March 2018).
- Levin, N. The Impact of Seasonal Changes on Observed Nighttime Brightness from 2014 to 2015 Monthly VIIRS DNB Composites. Remote Sens. Environ. 2017, 193, 150–164. [Google Scholar] [CrossRef]
- Stathakis, D.; Baltas, P. Seasonal Population Estimates Based on Night-Time Lights. Comput. Environ. Urban Syst. 2018, 68, 133–141. [Google Scholar] [CrossRef]
- Mestre, M. Ciutat i Territori a Mallorca. Una Aproximació a la RelacióeEntre Palma i el Sistema Urbà Mallorquí; Universitat Autònoma de Barcelona: Barcelona, Spain, 2016. [Google Scholar]
- Pons, A. Turisme, Illeïtat i Urbanització a les Illes Balears (1956–2006); Universitat de les Illes Balears: Palma, Spain, 2016. [Google Scholar]
- Rullan, O. L’ordenació Territorial a les Balears: Segles XIX-XX; Edicions Documenta Balear: Palma de Mallorca, Spain, 2007. [Google Scholar]
- Rullán, O. La Construcció Territorial de Mallorca; Moll: Palma de Mallorca, Spain, 2002. [Google Scholar]
- Aguiló, E.; Sastre, A. La Medición de la Estacionalidad del Turismo el Caso de Baleares. Estudios Turísticos 1984, 81, 79–88. [Google Scholar]
- Ginard, X.; Murray, I. El Metabolismo Socioeconómico de las Islas Baleares, 1996–2010. In El Metabolismo Económico Regional Español; Carpintero, Ó., Ed.; FUHEM Ecosocial: Madrid, Spain, 2015; pp. 307–383. [Google Scholar]
- López, J.M.; López, L.M. La Concentración Estacional en las Regiones Españolas desde una Perspectiva de la Oferta Turística. Rev. Estud. Reg. 2006, 7585, 75–106. [Google Scholar]
Figure 1.
Study area, and the boundaries of the districts.

Figure 2.
VIIRS/DNB image April 2012, study area.

Figure 3.
Light level (nW/cm2/sr) 2012 and urban land cover in Catalonia (Centre de Recerca Ecològica i Aplicacions Forestals (CREAF)) 2009.
Figure 3.
Light level (nW/cm2/sr) 2012 and urban land cover in Catalonia (Centre de Recerca Ecològica i Aplicacions Forestals (CREAF)) 2009.

Figure 4.
Absolute (km2) and relative (%) values of the surface areas with levels of urban brightness per district for the mean of the months of October 2012–2017. Data for the 15 districts with the highest and lowest values of lit surface area.
Figure 4.
Absolute (km2) and relative (%) values of the surface areas with levels of urban brightness per district for the mean of the months of October 2012–2017. Data for the 15 districts with the highest and lowest values of lit surface area.

Figure 5.
Surface area of urban brightness (>10), mean for the months of October.

Figure 6.
Weighted mean brightness, mean for the months of October (2012–2017).

Figure 7.
Total light emitted/radiant intensity (>2 nW/sr). Monthy means 2012–2017. Balearic Islands. In indexed numbers (annual mean = 100).
Figure 7.
Total light emitted/radiant intensity (>2 nW/sr). Monthy means 2012–2017. Balearic Islands. In indexed numbers (annual mean = 100).

Figure 8.
Total monthly emitted light (>2 nW/cm2/sr). Monthly means 2012–2017. Serra de Tramuntana, Eivissa, and Badia de Palma. In indexed numbers (annual mean for each territory = 100).
Figure 8.
Total monthly emitted light (>2 nW/cm2/sr). Monthly means 2012–2017. Serra de Tramuntana, Eivissa, and Badia de Palma. In indexed numbers (annual mean for each territory = 100).

Figure 9.
Annual evolution of workers affiliated to the Social Security and total emitted light with respect to its annual mean on the 100 index for the Balearic Islands and their tourist districts. Source: Based on VIIRS images and affiliated workers, according to the Ministry of Labor and Social Security.


Table 1.
Main characteristics of the data, VIIRS-DNB (Visible Infrared Imaging Radiometer Suite Day/Night Band).
Table 1.
Main characteristics of the data, VIIRS-DNB (Visible Infrared Imaging Radiometer Suite Day/Night Band).
| Characteristic | Description |
|---|---|
| Temporary series | April 2012–present (monthly) |
| Area coverage | Between the latitudes −65° to 75° |
| Quantization | 14 bits/16.384 DN |
| Pixel brightness values | 0 to 300 range of normals values (nanoWatts/(cm2·sr) |
| Saturation | Without saturation |
| Pixel size | 15 s of arc (350 × 350 m our latitude) |
| Radiometric calibration | On board |
| Low light imaging bandpass | Pancromatic 500–900 nm |
| Nighttime overpass | ~01:30 |
| Low light imaging detection limit | ~2 × 10⁻¹¹ Watts/cm2/sr |
| Swath | 3000 km |
Table 2.
Determination of the reference threshold between the luminosity and the urban land cover of CREAF (2009) for the whole of Catalonia.
Table 2.
Determination of the reference threshold between the luminosity and the urban land cover of CREAF (2009) for the whole of Catalonia.
| Area (km2) | % Considered | ||||||||
|---|---|---|---|---|---|---|---|---|---|
| Radiance (nW/cm2/sr) Starting from | Brightness | Urban Uses CREAF | Intersection | CREAF No Intersection | Brightness Not Intersected | Total Area | Intersection/Total Area × 100 | Urban Uses | of Brightness |
| 0 | 32,102.7 | 1914.8 | 1914.8 | 0.0 | 30,187.9 | 32,102.7 | 5.96 | 100 | 5.96 |
| 1 | 9089.8 | 1914.8 | 1741.8 | 173.0 | 7348.0 | 9262.8 | 18.80 | 90.97 | 19.16 |
| 2 | 5614.6 | 1914.8 | 1589.3 | 325.5 | 4025.3 | 5940.1 | 26.76 | 83.00 | 28.31 |
| 3 | 4495.8 | 1914.8 | 1496.7 | 418.1 | 2999.1 | 4913.9 | 30.46 | 78.16 | 33.29 |
| 4 | 3834.5 | 1914.8 | 1423.5 | 491.3 | 2411.0 | 4325.9 | 32.91 | 74.34 | 37.12 |
| 5 | 3355.6 | 1914.8 | 1358.2 | 556.7 | 1997.4 | 3912.3 | 34.72 | 70.93 | 40.47 |
| 6 | 2998.1 | 1914.8 | 1298.4 | 616.4 | 1699.7 | 3614.5 | 35.92 | 67.81 | 43.31 |
| 7 | 2711.1 | 1914.8 | 1245.1 | 669.7 | 1466.0 | 3380.8 | 36.83 | 65.03 | 45.93 |
| 8 | 2470.0 | 1914.8 | 1192.5 | 722.3 | 1277.5 | 3192.3 | 37.36 | 62.28 | 48.28 |
| 9 | 2273.1 | 1914.8 | 1148.0 | 766.8 | 1125.1 | 3040.0 | 37.76 | 59.95 | 50.50 |
| 10 | 2108.8 | 1914.8 | 1105.8 | 809.0 | 1003.0 | 2917.8 | 37.90 | 57.75 | 52.44 |
| 11 | 1957.6 | 1914.8 | 1066.0 | 848.9 | 891.6 | 2806.4 | 37.98 | 55.67 | 54.45 |
| 12 | 1838.7 | 1914.8 | 1031.4 | 883.4 | 807.3 | 2722.1 | 37.89 | 53.86 | 56.09 |
| 13 | 1732.1 | 1914.8 | 998.1 | 916.7 | 734.0 | 2648.8 | 37.68 | 52.13 | 57.62 |
Table 3.
Relationship between monthly variations in total emitted light and variations in the number of total workers affiliated per month per district.
Table 3.
Relationship between monthly variations in total emitted light and variations in the number of total workers affiliated per month per district.
| District | r2 | Pearson |
|---|---|---|
| Eivissa | 0.889 | 0.943 |
| Menorca | 0.815 | 0.903 |
| Formentera | 0.785 | 0.886 |
| Nord | 0.670 | 0.819 |
| Llevant | 0.317 | 0.563 |
| Sud | 0.303 | 0.550 |
| Badia de Palma | 0.068 | 0.260 |
| Raiguer | 0.116 | −0.340 |
| Tramuntana | 0.132 | −0.363 |
| Pla | 0.316 | −0.562 |
© 2018 by the authors. Licensee MDPI, Basel, Switzerland. This article is an open access article distributed under the terms and conditions of the Creative Commons Attribution (CC BY) license (http://creativecommons.org/licenses/by/4.0/).
Share and Cite
MDPI and ACS Style
Checa, J.; Nel·lo, O. Urban Intensities. The Urbanization of the Iberian Mediterranean Coast in the Light of Nighttime Satellite Images of the Earth. Urban Sci. 2018, 2, 115. https://doi.org/10.3390/urbansci2040115
AMA Style
Checa J, Nel·lo O. Urban Intensities. The Urbanization of the Iberian Mediterranean Coast in the Light of Nighttime Satellite Images of the Earth. Urban Science. 2018; 2(4):115. https://doi.org/10.3390/urbansci2040115
Chicago/Turabian StyleCheca, Joan, and Oriol Nel·lo. 2018. "Urban Intensities. The Urbanization of the Iberian Mediterranean Coast in the Light of Nighttime Satellite Images of the Earth" Urban Science 2, no. 4: 115. https://doi.org/10.3390/urbansci2040115