

Abstract
Many solar photovoltaic (PV) energy projects are currently being planned and/or developed in West Africa to sustainably bridge the increasing gap between electricity demand and supply. However, climate change will likely affect solar power generation and the atmospheric factors that control it. For the first time, the state-of-the-art CMIP climate models (CMIP6) are used to investigate the potential future evolution of solar power generation and its main atmospheric drivers in West Africa. A multi-model analyses carried out revealed a decrease of solar PV potential throughout West Africa in the 21st century, with an ensemble mean reduction reaching about 12% in southern parts of the region. In addition, the variability of future solar PV production is expected to increase with a higher frequency of lower production periods. The projected changes in the solar PV production and its variability are expected to be predominant in the June to August season. We found the decrease in the solar PV potential to be driven by a decrease of surface irradiance and an increase of near-surface air temperature. However, the decrease of the surface irradiance accounted for a substantially larger percentage of the projected solar PV potential. The decrease in surface irradiance was further linked to changes in both cloud cover and aerosol presence, although generally much more strongly for the former.
Export citation and abstract BibTeX RIS

Original content from this work may be used under the terms of the Creative Commons Attribution 4.0 license. Any further distribution of this work must maintain attribution to the author(s) and the title of the work, journal citation and DOI.
1. Introduction
In West Africa (WA), the conversion of solar irradiance into electricity with photovoltaic (PV) panels is gradually increasing in many countries. To reduce the energy deficit due to increasing populations and electricity demand in the region, solar electricity generation is further projected to increase significantly in the coming years (DeGhetto et al 2016). The interest in solar electricity generation became apparent after the Paris Agreement during which many WA countries committed to develop and utilize solar energy in the region. Although expected to increase, the present contribution of solar PV power (PVP) to total electricity generation is less than 1% in all of sub-Saharan Africa (IEA 2019). By the end of 2015, the total solar PV installation in all of Africa stood at just 2100 MW with more than 60% in southern Africa (IRENA 2016). Nevertheless, there are plans to construct large solar farms across the region (Moner-Girona et al 2017).
While the solar resource is abundant in WA (Hermann et al 2014), climate factors may reduce it or affect its conversion to energy (Dajuma et al 2016, Danso et al 2020). Intense cloudiness, higher temperatures, and dust which negatively affect solar PVP are all abundant in WA (Knippertz and Todd 2012, Gbobaniyi et al 2014, Danso et al 2019). Some recent studies have investigated the current potential (e.g. Yushchenko et al 2018) of solar PVP as well as the direct impacts of atmospheric conditions on the solar resource over historical periods in the region (e.g. Bonkaney et al 2017). However, climate change is expected to modify the atmospheric conditions that influence solar PVP. It is therefore important to account for the potential climate change impacts in the long-term solar PVP development, generation, and management planning in the region.
Presently in WA and even across the entire African continent, only a few studies have attempted to address the issue of climate change impacts on solar energy potential (Bichet et al 2019, Soares et al 2019, Sawadogo et al 2020). These studies estimated a decrease in the future solar PVP potential in WA. Most of them were based on the historical and some representative concentration pathway (RCP) future scenarios from climate models included in the Coupled Model Intercomparison Project Phase 5 (CMIP5) (Taylor et al 2012). However, climate model projections are evolving with the inclusion of updated and more inclusive future emission and land use scenarios (Riahi et al 2017, Meinshausen et al 2020). In the new CMIP6 (Eyring et al 2016), future projections produced in the Scenario Model Intercomparison Project (ScenarioMIP) (O'Neill et al 2016) are based on human and societal development possibilities incorporated into the RCPs. The new set of human and societal development possibilities known as the shared socioeconomic pathways (SSPs) (O'Neill et al 2014) are based on updated data on recent emission trends. Moreover, CMIP6 has been shown to perform better than CMIP5 in the representation of the historical climate in many regions around the world (Gusain et al 2020, Luo et al 2021, Thorarinsdottir et al 2020, Wang et al 2021), although this has not been shown yet in WA.
In addition, most of the previous studies are only focused on estimating changes in the solar PVP potential. For example, solar PVP potential in WA is projected to decrease by about 4% in an extreme warming scenario (Sawadogo et al 2020). However, the physical atmospheric drivers associated with the projected changes are not investigated.
In the context presented above, the goal of this study is to assess the changes in potential solar PVP in WA based on a relatively large variety of CMIP6 climate models. We will focus on the changes to the mean, and to some extent, the variability of solar PVP. We will also investigate changes in some of the main climate factors (irradiance, temperature, cloud cover, and dust.) that may influence the projected PVP changes.
A description of the study area, data, and methodology is presented in section 2. Section 3 will present the different global climate model (GCM) projections of solar PVP changes and their associated climate drivers in WA. Section 4 will discuss the results and conclude the study.
2. Data and methodology
2.1. Study area
This study is performed over the whole of WA (figure 1); however, we emphasize some results over specific areas in the region (rectangular windows in figure 1). These areas are located in the Guinea (also called Guinea Coast) and Sahel climate zones of WA; these two areas are chosen for their distinct climate conditions (Gbobaniyi et al 2014) and because they contain numerous solar PV energy projects (Moner-Girona et al 2017).
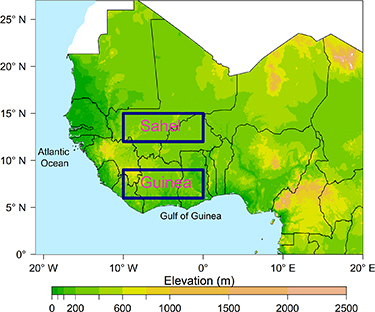
Figure 1. Map of West Africa showing selected key areas for further analysis.
Download figure:
Standard image High-resolution imageSolar PV energy is seen as a viable option to supply part of the rising electricity demand in WA. While the current contribution of solar PVP to total electricity generation is significantly lower than 1%, many working scenarios, including the African Agenda 2063 (DeGhetto et al 2016) project a significant increase in its share by the middle of the 21st century.
2.2. Data
Fourteen CMIP6 climate models (table 1) are selected to assess the potential impact of climate change on future solar PVP and its atmospheric drivers in WA. The selection of the 14 climate models was primarily based on the availability of the main variables used in the estimation of solar PVP at a three-hourly temporal resolution for both the historical and future periods. The 14-model ensemble size has been deemed large enough in a similar study for wind energy in WA (Akinsanola et al
2021). The main variables used in PVP estimation are the global horizontal irradiance, GHI (in  ) and the near-surface air temperature, Ta (in °C). We first performed an evaluation of these variables with satellite and reanalysis data for all models and the multi-model ensemble mean (hereafter ensemble mean) in the historical period (see figures S1 and S2 in supplementary material available online at stacks.iop.org/ERL/17/044016/mmedia). We further analyse some cloud and aerosol variables to investigate the drivers of the solar PVP change. However, these additional variables were available at monthly timescale.
Table 1. Selected CMIP6 GCMs used for the study, and their resolutions.
| Model | Resolution | Reference |
|---|---|---|
| ACCESS-CM2 | 1.875° × 1.25° | Bi et al (2020) |
| AWI-CM-1-1-MR | 0.938° × 0.935° | Semmler et al (2020) |
| BCC-CSM2-MR | 1.125° × 1.121° | Wu et al (2019) |
| CanESM5 | 2.812° × 2.791° | Swart et al (2019) |
| CMCC-CM2-SR5 | 1.25° × 0.942° | Cherchi et al (2018) |
| CMCC-ESM2 | 1.25° × 0.942° | Cherchi et al (2018) |
| CNRM-CM6-1 | 1.406° × 1.401° | Voldoire et al (2019) |
| EC-Earth3 | 0.703° × 0.702° | Döscher et al (2021) |
| GFDL-ESM4 | 1.25° × 1° | Dunne et al (2020) |
| IITM-ESM | 1.875° × 1.905° | Krishnan et al (2019) |
| MPI-ESM1-2 h | 0.938° × 0.935° | Müller et al (2018) |
| MRI-ESM2-0 | 1.125° × 1.121° | Yukimoto et al (2019) |
| NESM3 | 1.875° × 1.865° | Yang et al (2020) |
| TaiESM1 | 1.25° × 0.942° | Lee et al (2020) |
The future solar PVP potential is estimated under the new SSP5-8.5 scenario. This scenario is an update of the RCP8.5 in CMIP5, which was used in many climate impacts studies over WA in the last decade (e.g. Ajayi and Ilori (2020); Diedhiou et al (2018); Klutse et al (2018)). With a radiative forcing trajectory close to the highest RCP8.5, the SSP5-8.5 is at the upper end of all the CMIP6 scenarios in terms of fossil fuel use, energy consumption, food demand and greenhouse gas emissions, leading to high socio-economic challenges to be addressed with more ambitious climate targets. According to Kriegler et al (2017), the SSP5-8.5 scenario provides useful reference points for the study of future climate change and its impact, and for assessing adaptation and mitigation measures.
Since the focus of the study is on changes in solar PVP, we base our computations on only periods when solar radiation is available. As a result, only daytime hours are used in the computations of solar PVP. The computations are made for the historical (1980–2014) and future (2015–2084) periods. The future period is divided into two: the near-future from 2015 to 2049 and the far-future from 2050 to 2084.
2.3. Estimation of changes in potential solar PVP generation
There are many models for estimating solar PVP generation, ranging from simple models that take a few climate parameters as inputs (e.g. Perpiñan et al (2007)) to more complex models that take more than a few parameters (e.g. Jerez et al (2015)). Here, we implement a model that estimates the solar PVP generation using the effective surface irradiance received,  (
( ), at an optimal tilt angle and near-surface air temperature
  (°C) (François et al
2016).
(°C) (François et al
2016).  is computed using the CMIP6 models' GHI and following the method described by McPherson et al (2017). At a given time t in a grid box i, solar PVP is given as:
where B is an efficiency coefficient defined as the product of the surface area (m2
) of the solar PV array and the efficiencies of the solar PV generator and inverter.  and C are the temperature and radiation dependent efficiency reduction factors respectively. These two are specific to a given PV technology and ensure that PV cell efficiency changes due to temperature and irradiance are accounted for.
  (25 °C) is the PV cell temperature corresponding to standard test conditions. We note that B,
  , and C are likely to change in future due to technological developments. However, without any specific information on future development, we maintain these parameters constant; the results here are thus independent of technological advances.
Solar PVP was estimated for a generic PV array with a peak power of 1 kW (characteristics provided in supplementary material). For our analysis, the solar PVP time series from 1980 to 2084 is normalized such that the mean value for the entire period is 1 (i.e. each element is divided by the mean of the time series). Relative to the historical period, the change in potential future solar PVP generation ( ) is estimated as:
where,  and
and  are the historical and future solar PVP generations respectively. The statistical significance of the estimated changes is assessed using the student's t-test. The absolute (unnormalized) annual mean solar PVP produced with the generic solar PV array for the historical and future periods as well as their differences are provided in the supplementary material.
The individual contributions of Is and Ta to the future changes in PVP are also estimated. This is simply achieved by computing the future PVP generation by keeping either of Is and Ta fixed to the historical period (i.e. using its historical time series) while the future time series of the other variable is used. In other words, to estimate the individual contribution of Is, the historical Is and the future scenario Ta are used for the future scenario PVP computation. Then, for the individual contribution of Ta, the historical Ta and the future scenario Is are used for the future scenario PVP computation:
where  and
and  are the first order future changes in PVP generation due to changes in irradiance (
 ) and air temperature (
 ) respectively. These are estimated as:
where  and
and  are the historical and future irradiance time series respectively and
  and
and  are the historical and future air temperature time series respectively.
3. Results
3.1. Changes in future solar PVP generation
Relative to the historical period, solar PVP generation is projected to decrease over the 21st century across the entire WA (figure 2). The ensemble mean (for all 14 models) change for the two future periods indicates that the reduction in solar PVP will be stronger during the second part of the century and especially over the southern part of the region where it is projected to decrease between 10%–12% in some places (figures 2(a) and (b)); note that projections of annual average change made by the individual climate models over the entire region can be found in the supplementary material (figures S3 and S4). Although the reduction of solar PVP agrees with previous studies (Bichet et al 2019, Soares et al 2019, Sawadogo et al 2020), it is important to note that the magnitude of the estimated decrease in this study is at least twice. This can be attributed to the new and updated emission trends used in the CMIP6 climate models.
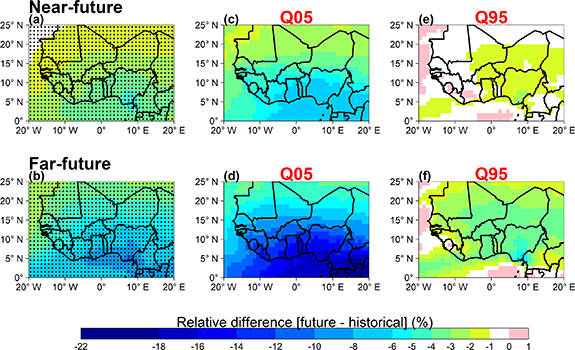
Figure 2. Multi-model ensemble (14 models) mean annual potential solar PVP change (%) for the (a) near-future (2015–2049) and (b) far-future (2050–2084) under the SSP5-8.5 relative to the historical period (1980–2014). Areas where changes are significant at a 95% confidence interval are indicated with a dot. Also shown are the interpercentile range of the change, (c), (d) Q05 and (e), (f) q95 across all models in the ensemble.
Download figure:
Standard image High-resolution imageAcross the individual climate models, the sign of the annual average change in solar PVP is largely consistent over the land areas of WA. This is shown by the 5th and 95th interpercentile range of change across the different models (figures 2(c)–(f); bounds of the 90% confidence interval). In both future periods, the CMIP6 climate models project solar PVP decreases over most parts of the region except a few areas in southwestern WA where an increase of up to 1% can be seen in some models (figures 2(e) and (f)). On the other hand, the results show that the decrease in annual average solar PVP potential can be much intense in some models than the ensemble mean (figures 2(c) and (d)). This is especially noticeable in the second part of the 21st century during which solar PVP reduction in southern WA can reach more than 22% in some models.
We further analysed the evolution of solar PVP in two key sub-regions. Figures 3(a)–(c) show the temporal evolution of the ensemble mean solar PVP potential in the Guinea and Sahel areas respectively. From 1980 to 2084, solar PVP potential in both areas steadily decreases, presenting significant downward trends. However, the Guinea area presents a slightly steeper downward trend, reducing at a rate of 0.001 yr−1 (normalized value) compared to 0.0008 yr−1 in Sahel.

Figure 3. Time evolution including trend lines (top row) and violin plots showing the distribution (bottom row; for the historical, near- and far-future periods) of the normalized solar PVP in the Guinea and Sahel areas of West Africa. The white dot and * symbols on the violin plots represent the distributions' median and mean values respectively. The green box is the interquartile range.
Download figure:
Standard image High-resolution imageIn addition, figures 3(b)–(d) show the distribution of the normalized monthly mean solar PVP with violin plots for the three periods. This choice of graphical representation was used since it makes it possible to compare the distributions of PVP for the different periods and regions, (i.e. the overlaid density plots on the boxplots) in addition to having a normal boxplot. The downward trends as shown previously lead to a decrease in the mean and median values (white star and dot) in both areas, moving from historical to the future periods. In general, the shape of the distribution does not change so much from one period to the other. In the Guinea area for instance, the upper limit of the monthly solar PVP production is not much different for all three periods. In addition, the skewness of the distribution is conserved from the historical to future periods (i.e. mean is always less than the median in Guinea (negatively skewed); opposite for the Sahel area). However, the lower limit for the historical period is much higher when compared to the future periods. This indicates that the frequency of periods with lower productions will increase in the future; it explains the lower mean and median values in the future. This is also true for the Sahel area. It is also interesting to note that the length of the interquartile range (green box) increases from the historical to future period, indicating an increasing variability of solar PVP production. It should however be noted that the observed increase in solar PVP variability could be due to increased variations in the inter-annual and/or annual cycles but could be dominated by the latter. This is because the monthly solar PVP values which have a strong annual variation (see figure S5), were normalized with respect to the long-term mean of all months.
We further investigated the seasonality of the distributions. Figure 4 presents the distributions of the solar PVP for the MAM (March, April, May) and JJA (June, July, August) seasons. We only focused on these seasons because (1) the highest solar PVP production in the entire WA occurs in MAM (figure S5) due to the high incoming solar radiation (Danso et al 2020) and (2) the JJA season is the cloudiest in WA which leads to the lowest solar PVP production in the Guinea region (not necessarily in Sahel). In Guinea, the mean and median appear to not change from the historical to the future periods MAM (figure 4(a)). In addition, there is no clear change in the length of the interquartile range between the three periods. On the other hand, there are clear differences in the mean and median values during JJA (figure 4(b)). This is perhaps an indication that cloud cover in the Guinea area will increase more in the future during JJA. Moreover, the variability of solar PVP production will increase more in future during JJA as shown by the longer lengths of the interquartile range in the future periods. In the Sahel area, both seasons present a clear decrease of the mean and median values from the historical to the future periods (figures 4(c) and (d)). In JJA however, there is an obvious change in the shape of the distribution as well as an increase in the variability of solar PVP production.
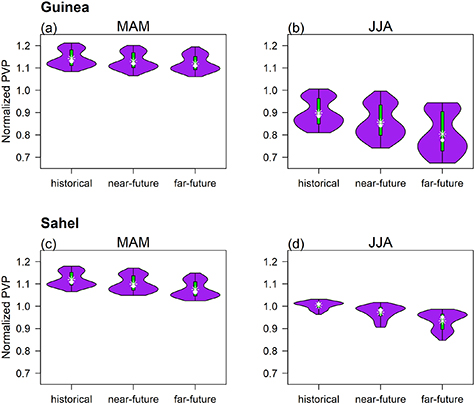
Figure 4. Same as figures 3(b)–(d) but for the MAM (March to May) and JJA (June to August) seasons.
Download figure:
Standard image High-resolution imageThe large reduction in the JJA solar PVP potential is seen further in figure 5 which shows the projected ensemble mean change in the annual cycle (solid curves) and the spread among the different climate models (shaded areas). The ensemble mean change is negative (decreasing potential) throughout the cycle for both future periods in the Guinea and Sahel areas. However, the largest reductions occur from June through to October with a change of up to about −15% (−7%) and −11% (−5%) during the far-future (near-future) in Guinea and Sahel respectively. This period also presents the largest uncertainty of change as indicated by the large spread among the individual climate models. On the other hand, the spread is less and remains fairly constant for all other periods in the average annual cycle. Although some individual models may present positive change projections in parts of the cycle, the amplitude of the change's spread is largely in the negative range.
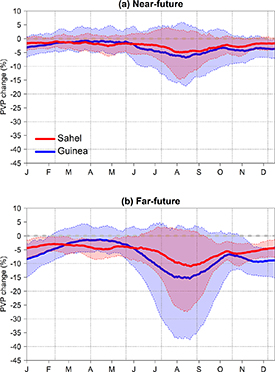
Figure 5. Relative changes in the mean annual cycle of potential solar PV generation in the Guinea and Sahel areas of West Africa under the SSP5-8.5. Solid curves represent the multi-model ensemble mean whereas the shaded regions represent the spread across all the models in the ensemble (Q05 and q95).
Download figure:
Standard image High-resolution imageFigure 6 presents the estimated annual average change of solar PVP potential for the individual climate models in the two sub regions and the statistical significance. All models project an overall average annual reduction for both future periods in the two areas. Although all models agree on the sign of change, there is a wide inter-model variability of the magnitude. However, all models project statistically significant reduction in the solar PVP potential except in the case of TaiESM1 in the Guinea region.
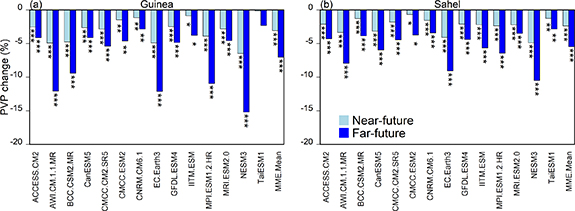
Figure 6. Annual mean solar PVP change (%) for all GCMs and the multi-model ensemble (MME) mean in the Guinea and Sahel areas for the (a) near-future (2015–2049) and (b) far-future (2050–2084) under the SSP5-8.5 relative to the historical period (1980–2014). Stars next to values show the levels of significance (i.e. (*) p-value < 0.05, (**) p-value < 0.01, (***) p-value < 0.001). Values with no stars are not significant.
Download figure:
Standard image High-resolution image3.2. Drivers of projected changes in solar PVP
The projected change in future solar PVP is driven by changes in the underlying atmospheric physical parameters that could impact the production. Here, we first explore the direct impacts of the changes in incoming solar irradiance and air temperature on future solar PVP production under the SSP5-8.5. Changes in other atmospheric parameters such as wind speed and humidity may also affect solar PVP but their impacts in WA are very small as shown by Bichet et al (2019) and Sawadogo et al (2020), hence, they were not considered. We then explore the impact of changes in cloudiness and aerosols on changes in solar PVP.
3.2.1. Surface irradiance and temperature
Figure 7 presents the ensemble mean change in the solar PVP potential that is directly induced by changes in near-surface air temperature (a–b) and surface irradiance (c–d) over the entire WA for the two future periods. Temperature changes in the near-future have almost no impact the solar PVP potential over the entire region. On the other hand, changes in surface irradiance induce a larger impact, reducing the solar PVP potential up to about 6% in the south and 2% in the north of WA. In the far-future, the impact of temperature changes on solar PVP potential is larger than in the near-future, inducing a reduction of up to 2% in the entire north of WA and large portions of the south. Nevertheless, the change in the solar PVP potential induced by solar irradiance is far larger. It is largest in southern WA where solar irradiance changes can lead to a reduction upwards of 10% in some areas.

Figure 7. Multi-model ensemble (14 models) mean annual potential solar PV power generation change (%) induced by projected changes in the (a), (b) near-surface air temperature only, and (c), (d) surface irradiance only. The changes are estimated for the near- (2015–2049) and far-future (2050–2084) periods under the SSP5-8.5 relative to the historical period (1980–2014). Areas where changes are significant at a 95% confidence interval are indicated with a dot.
Download figure:
Standard image High-resolution imageWhile the temperature-induced future change in solar PVP potential is small, this does not necessarily imply that the future temperature change will not be significant, especially for the far-future. Indeed, the 14-model ensemble mean projects increasing temperatures over the entire region in the 21st century (figure S6). In both near and far-future periods, the northern part of the region will experience a higher increase than the south. In the far-future, the air temperature is expected to increase upwards of 3.5 °C in large parts of northern WA under the SSP5-8.5. In contrast, solar irradiance will decrease over the entire region with the largest reduction over southern WA. Both of these situations negatively affect solar PVP production; higher temperatures reduce the efficiency of the PV cells and the lower irradiance will lead lower PV energy. However, as already shown in figure 7 the projected surface irradiance decrease will be the predominant cause of solar PVP potential reduction rather than the temperature increase. The predominance of surface irradiance over temperature on the projected changes in solar PVP potential is true for most of the climate models included in the ensemble (figure S7).
3.2.2. Cloudiness and aerosols
The irradiance received on the surface depends on the variability of atmospheric reflectivity and/or absorptivity due to cloud cover (Danso et al 2020) and suspended aerosol particles (Papadimas et al 2012) in the atmosphere. Future changes in the cloud and aerosol properties will thus drive the projected changes in surface irradiance. For clouds, we explore the relationship between the change in the cloud water path (CWP) and the change in surface irradiance. For aerosols, we explored the relationship between the change in the aerosol optical depth (AOD) at 550 nm and the change in surface irradiance. CWP is directly related to the optical depth of clouds that determines the amount of sunlight reflected by clouds. Thus, increasing CWP is expected to decrease the amount of incoming solar radiation. Similarly, aerosols directly absorb and/or scatter part of the incoming radiation (Kosmopoulos et al 2017) and also influence the radiative properties of the clouds in the region through the Twomey effect (Jose et al 2020).
We used multiple linear regression to determine the relationship (at monthly timescale) that change in solar irradiance has with changes in CWP and/or AOD between the historical and future periods. It was found that most models show a large adjusted R2 (figure S8) indicating that changes in CWP and AOD can largely explain the change in the incoming radiation. The coefficients from the multiple regression were further examined to determine the most dominant variable. Figure 8 presents the coefficients (slopes) from the regression between changes in CWP and AOD (predictor variables), and the change in surface irradiance (response variable) in Guinea and Sahel for the 7 climate models which have these variables for the historical period and SSP5-8.5. As expected, all models present negative coefficients between CWP and AOD changes and the surface irradiance changes in both future periods for the 2 sub-regions. This suggests that a unit increase in either CWP or AOD will lead to a reduction of the surface irradiance to some extent.

Figure 8. Coefficients (W m−2) estimated from multiple regression of cloud water path (βCWP) and aerosol optical depth (βAOD) changes with surface irradiance change for the near- and far-future relative to the historical period for some GCMs in the (a), (b) guinea and (c), (d) sahel areas. Only GCMs providing both AOD and CWP data are shown here.
Download figure:
Standard image High-resolution image
Although the signs of the coefficients are the same for the two variables across all models, the magnitudes differ. The results reveal that the coefficients of CWP have far larger magnitudes than AOD. This means that an increase in the CWP will generally trigger a considerably greater reduction in the irradiance than an increase in the AOD. These results suggest a larger impact of cloudiness than the aerosol load on the projected future decrease in surface irradiance. This true for all models with the exception of GFDL-ESM4 and MPI-ESM1-2HR which shows very similar coefficients for the two variables in the Guinea region in both future periods. There may be other factors that contribute to changes in irradiance in the future such as water vapour. Moreover, both the direct and indirect effects of aerosols could have different impacts on the incoming radiation. These are however not assessed in this study.
4. Discussion and conclusion
Under the SSP5-8.5 scenario, this study finds that the solar PVP generation in the 21st century over WA will decrease. This result is generally in agreement with findings of previous studies in the region (Bichet et al 2019, Sawadogo et al 2020) although the magnitude of the decreasing potential is substantially different. For example, the 14-model ensemble mean reveals up to about 12% decrease during the second part of the 21st century in parts of southern WA which is more than double when compared to previous findings. Individually, all climate models also project an annual average reduction in future solar PVP albeit a large inter-model spread.
In current climate conditions, solar PV has been shown to be cost-effective (Oyewo et al 2020, Moner-Girona et al 2021) among other sources in WA, although, the reliability can be location-dependent (Plain et al 2019). Moreover, recent development of PV markets in countries like Brazil, Chile, Jordan, Mexico, Peru and South Africa has shown that solar PV can now compete with fossil fuels in terms of levelized cost, even in the absence of financial support (IRENA 2016) which is perceived as the major barrier for large-scale PV installations in WA. Without considering political factors, it is thus surprising that with the abundance of solar resource, the current installation of PV plants is very low in the region. Additionally, it is unclear and presently an ongoing debate, whether the presently low development and utilization is due to current climate conditions or not. However, from the results of this study and previous findings, a question that arises in discussions is whether the projected changes in solar PVP potential will affect the growth of solar energy in the region.
It is of the view of the authors that the projected decreasing resource availability will not change much the cost-effectiveness of solar-PV projects in the region—even for the model with the largest reduction. This is because WA receives far more solar radiation than many regions in the world. In the current climate conditions, most countries in WA receive more than twice the solar radiation of many European countries. Nevertheless, countries like Germany have successfully implemented cost-effective utility-scale PV projects. Additionally, PV conversion technologies will likely improve in the future, although this was not considered. Therefore, we are of the view that with the right policies, which remains a key obstacle in the solar industry in WA (Adenle 2020), and robust planning in place, successful implementation can be made in future regardless of the projected decrease in the solar resource. These could mean improving the predictability of the solar resource in the region and investigating how it will change in the future.
The impact of changing climate on the reliability of PV production in future becomes one of the critical points to consider. Danso et al (2020) showed that moving from one year to another in the current climate, the solar radiation received during JJAS is associated with a higher uncertainty than other periods in the year. Our results have shown that in the future, the variability of solar PVP will increase as shown by a longer interquartile range with the frequency of lower production periods further increasing (figure 3). However, the increase in variability and lower production frequency is mainly notable during the JJA season as shown in figure 4. Such a result implies that the reliability of solar PVP will decrease further in future for the JJA season.
For offgrid and/or micro-grid standalone PV systems, especially in rural areas, this may create significant challenges for power supply. This could be mitigated by investing greatly in energy storage systems. Studies are needed to further investigate how the persistence of low production periods may change in future climates. For grid-connected utility-scale PV systems, an increase in the power system flexibility may be enough to deal with this situation. Power system flexibility may come from energy storage and transport, demand-side management, diversity, and hydropower operations (Kies et al 2016, Weitemeyer et al 2016, Danso et al 2021). In future studies, it could thus be necessary to investigate how current system flexibility potential may also be impacted in the future climate. For both offgrid and grid-connected systems, it is also important to investigate how electricity demand, and its covariation with the multiscale variability of the solar resource will change in future.
This study is the first in WA to use the state-of-the-art CMIP6 climate models to contribute to the current portfolio of research on the future of solar energy. Our results are based on the future projections of the SSP5-8.5 scenario—the high-end scenario. Thus, the results provided here encapsulates the worst possible future outlooks. It is therefore important to also explore the future outlook of solar PVP based on other CMIP6 future scenarios in order to have a complete assessment of the uncertainty in future climate projections.
Acknowledgments
We are grateful to the Institute of Environmental Geosciences (IGE; University of Grenoble—Alpes, France) and to Laboratoire de Physique de l'Atmosphère et de Mécanique des Fluides (LAPA-MF; University Felix Houphouet Boigny, Côte d'Ivoire), who hosted the first author during his stay in Grenoble and Abidjan in the framework of the International Joint Laboratory NEXUS on Climate, Water, Land, Energy and Climate Services (LMI NEXUS). The authors are grateful to the World Climate Research Programme which is responsible for the CMIP6 project and ESGF for providing access to the models. We also appreciate the great efforts of various institutions and modelling groups that provided each of the climate models listed in table 1. We are also grateful to NASA and the ECMWF for providing the CERES satellite and ERA5 reanalyses products respectively, that were used for evaluating the climate models' performance.
Data availability statement
No new data were created or analysed in this study.
Financial support
This research has been supported by the France National Research Institute for Sustainable Development, IRD (Institut de Recherche pour le Développement, France).