

Abstract
Eurasian spring snow cover is widely considered as an important predictor of Asian summer monsoon rainfall, but its possible role in the formation of the north–south dipole structure of rainfall anomalies (NSDR)—a major mode of the eastern China summer rainfall variability—remains elusive. Here, we show that, there is a close connection between the western Eurasian spring snow cover (WESS) and NSDR during our research period 1967–2018, with less WESS tends to be accompanied by a wetter south-drier north pattern over eastern China, and vice versa. However, this relationship was not significant before the late 1990s, but has since become significant. Further analyses demonstrate that the shift in the WESS–NSDR relationship could be attributed to the modulation of summer North Atlantic Oscillation (SNAO). After the late 1990s, the WESS-related anomalous atmospheric circulations during summer are largely reinforced by the constructive superposition of those with same signs induced by SNAO, which in turn would intensify the impact of WESS and hence lead to a strong WESS–NSDR connection. In contrast, the influences of WESS are counteracted by those with opposite signs associated with SNAO before the late 1990s and thereby result in a weak snow–rainfall relationship. Our findings, along with the decline in Eurasian spring snow cover, provide a potential explanation for the recent 'South Flood–North Drought' pattern observed over eastern China.
Export citation and abstract BibTeX RIS

Original content from this work may be used under the terms of the Creative Commons Attribution 4.0 license. Any further distribution of this work must maintain attribution to the author(s) and the title of the work, journal citation and DOI.
1. Introduction
Over one billion people live in eastern China, where the climate regime has been renowned for being distinctly wet in the south and relatively dry in the north. This marked contrast hastened the construction of the huge South-to-North water diversion project to address northern water resource shortages. Moreover, an emergent meridional dipole structure of summer rainfall anomalies, known as the 'South Flood–North Drought' pattern (Ding et al 2008, Huang et al 2013, Sun and Wang 2015, He et al 2017), has further increased the uneven distribution of water resources over eastern China. An improved understanding of the formation of this dipole pattern is crucial for flood and drought disaster reduction and socioeconomic development in this densely populated region.
Eurasian spring snow cover offers some potential for prediction of Asian summer monsoon rainfall via snow–atmosphere coupling (Barnett et al 1989, Cohen and Rind 1991, Turner and Slingo 2011, Halder and Dirmeyer 2017). It has been suggested that a negative anomaly of spring snow cover over Eurasia can induce increased rainfall in southern China, and a rainfall deficit in northern and northeastern China, i.e. the 'South Flood–North Drought' pattern (Wu et al 2009). In this view, relatively excessive Eurasian spring snow cover before the late 1980s would have favored an opposite 'South Drought–North Flood' pattern, but such a dipole pattern was not seen during the 1970s and 1980s (Sun and Wang 2015, He et al 2017). This discrepancy implies that the nature of the snow–rainfall relationship over eastern China is not yet well understood. Furthermore, there is clear evidence to show that reduced snow cover due to climate warming, could weaken the relationship between snow cover and Indian summer rainfall (Kripalani et al 2003, Wu et al 2014, Zhang et al 2019). It remains unclear whether such a weakening is currently occurring over eastern China.
In this study, we aim to decipher the temporal evolution of the impact of Eurasian spring snow cover on eastern China summer rainfall, by using the longest available satellite-based records of snow cover data. The main purpose of this study is to clarify the reliability of using Eurasian spring snow cover to forecast seasonal eastern China summer rainfall, and give some clues as to the cause of the reported 'South Flood–North Drought' phenomenon over eastern China.
2. Data and methods
2.1. Datasets
The snow cover data used in this study is the widely used Northern Hemisphere EASE-Grid 2.0 weekly snow cover and sea ice extent (version 4), provided by the National Snow and Ice Data Center (NSIDC) (Brodzik and Armstrong 2013). The NSIDC snow cover data is the currently longest satellite derived snow data covering the period from 1966 to the present, which has been approved to appropriate for the large-scale climate research (Brodzik and Armstrong 2013). Although NSIDC data has some uncertainties near the boundary of the continental snowpack, there is large-scale agreement between it and other products for the most of the snow season and most regions (Frei et al 2012, Bormann et al 2018). The original snow cover data are stored in flat binary files indicating the presence or absence of snow in a specific week. The raw data are provided in the polar stereographic projection at a spatial resolution of 25 km. To facilitate comparison with other data, we converted the data to a regular 1° × 1° longitude-latitude grid. Here, we used the snow cover fraction (SCF) to represent the variability of snow cover. The monthly SCF is calculated by summing the number of weeks in that month for which snow was present for a pixel and expressing this number as a fraction of the total number of weeks in that month (Bamzai and Shukla 1999). In this study, the average of March, April and May is referred to as spring and the average of June, July and August as summer.
The monthly mean precipitation data used in this study was derived from the Climate Research Unit, University of East Anglia (CRU TS v4.03) which has a spatial resolution of 0.5° × 0.5° and is available for 1901 to the present (Harris et al 2014). The monthly atmospheric variables, such as geopotential height, horizontal wind, vertical velocity, specific humidity, and sensible heat flux were obtained from the National Centers for Environmental Prediction–National Center for Atmospheric Research (NCEP–NCAR) reanalysis 1 (Kalnay et al 1996) for 1948 to the present, at a horizontal resolution of 2.5° × 2.5°. The leaf area index (LAI) data derived from the LAI3gV1 (Zhu et al 2013), which has a 1/12° spatial resolution and spans the period 1982–2018.
The monthly indices of Arctic Oscillation (AO) and El Niño Southern Oscillation (ENSO, Niño 3.4 region) were provided by the US National Oceanic and Atmospheric Administration Climate Prediction Center. The indices of El Niño Modoki and Indian Ocean Dipole (IOD) were obtained from the Japan Agency for Marine Science and Technology. The North Atlantic Oscillation (NAO) index was defined as the difference in normalized zonally averaged sea level pressure between 35° N and 65° N over the region ranging from 80° W to 30° E (Li and Wang 2003). This index has been recognized as the optimal representation of the spatial–temporal variability associated with the NAO on all timescales in a comparison with other indices (Li and Wang 2003). Following Chen and Zhai (2015), the East Asia/Pacific (EAP) teleconnection pattern (also known as the Pacific–Japan teleconnection) index was defined based on three key anomaly center points, the Sea of Okhotsk (OK, 60° N, 130° E), East Asia (EA, 37.5° N, 120° E), and the western Pacific (WP, 20° N, 120° E) (Chen and Zhai 2015, Li et al 2018):
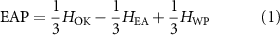
where HOK, HEA, and HWP denote the normalized 500 hPa geopotential heights of OK, EA, and WP, respectively.
2.2. Calculation of water vapor flux and wave activity flux
To diagnose the moisture transport, the vertically integrated water vapor flux (Q) and its divergence (Qdiv) are calculated based on the monthly NCEP–NCAR reanalysis data as follows:
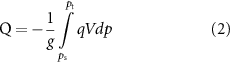
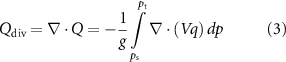
where g, q, p, V denote the gravitational acceleration, specific humidity, pressure, and horizontal wind components (u, v), respectively. The water vapor flux was integrated from the surface (ps), 1000 hPa, to the top layer (pt), 300 hPa, assuming negligible water vapor above 300 hPa.
The wave activity flux (WAF) proposed by Takaya and Nakamura (1997, 2001) was used to indicate the propagation of stationary Rossby waves. The horizontal components of WAF were defined as follow:
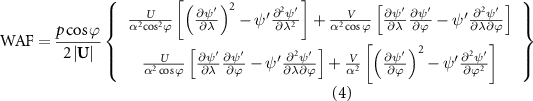
where |U| represents the climatological magnitude of winds, α is the mean radius of the earth, p denotes the pressure scaled by 1000 hPa, ϕ and λ are latitude and longitude, U and V denote the climatological zonal and meridional wind, respectively, and ψ' is the perturbed geostrophic streamfunction, which was defined as the anomalies obtained by regression onto the involved time series.
2.3. Statistical analysis
We performed an empirical orthogonal function (EOF) analysis on the normalized rainfall anomalies to derive the spatiotemporal variability of eastern China summer rainfall. Here eastern China was defined as the region east of 105° E. Since we only focus on interannual variability, a 9 year highpass Lanczos filter (Duchon 1979) was applied to all original variables before analyses, to avoid the potential contamination of interannual relationships by decadal signals. In addition, linear correlation and regression analyses are used to detect the statistical connections between variables. The significance of all the analyses was determined by the standard two-tailed Student's t-test.
3. Results
3.1. Emerging Eurasian spring snow impact on rainfall dipole in Eastern China
Eastern China summer rainfall features a complex spatiotemporal variability. We performed an EOF analysis to extract the dominant mode of the interannual variation of summer (June–August) rainfall in eastern China for the period 1967–2018. The first EOF mode (EOF1), which explains 19.3% of the total variances, characterizes the south–north dipole structure, with rainfall anomalies of opposite sign over the south of the Yangtze River and in northern and northeastern China (figures 1(a) and S1 (available online at stacks.iop.org/ERL/16/054012/mmedia)). Similar results are also found when using the station rainfall dataset (figure S2). The positive phase of EOF1 represents greater than normal rainfall over northern and northeastern China and lower than normal rainfall over southern China. The corresponding principal component of EOF1 is used as an index for the north–south dipole structure of rainfall anomalies (NSDR) to elucidate the snow–rainfall relationship.

Figure 1. Relationship between Eurasian spring snow cover and eastern China summer rainfall during 1967–2018. (a) The first EOF mode of eastern China summer (June–August) rainfall, which shows an NSDR. (b) Spatial distribution of the correlation coefficients (R) of Eurasian spring (March–May) SCF with the NSDR (represented by the PC1 of the EOF1 mode). Hatched areas indicate where R is significant at the 95% confidence level. The black box denotes western Eurasia (10° E–45° E, 45° N–65° N). (c) Time series of the normalized WESS and NSDR.
Download figure:
Standard image High-resolution imageFigure 1(b) shows the spatial distribution of the correlation coefficients between NSDR and gridded spring SCF over Eurasia during the period 1967–2018. Positive correlations occur over the western Eurasia, central Siberia, and the Tibetan Plateau, while sparse patches of negative correlations are found on the north coast of eastern Siberia. Next, we considered spring snow cover only over western Eurasia (the black box in figure 1(b), 10° E–45° E, 45° N–65° N), a region including eastern Europe and the area around the Baltic Sea, where the most significant positive correlation occurs. We found that western Eurasia spring snow cover (WESS) variability, defined as the time series of spring SCF averaged over this region, could explain a significant fraction of the NSDR variance (RWESS–NSDR = 0.44, P < 0.01, figure 1(c)) during the period 1967–2018. Specifically, in years with below-normal spring snow cover over western Eurasia, northern China is anomalously dry but southern China is anomalously wet during the summer, and vice versa.
To examine the temporal stability of the WESS–NSDR correlation, we further analyzed the decadal change in RWESS–NSDR calculated with a 19 year moving window. The results show that RWESS–NSDR is small and not statistically significant until after the late 1990s (figure 2(a)). Thus, we suggest a strengthened impact of WESS on NSDR since the late 1990s. This result is robust to the choice of different lengths for the moving window (15, 17, 21 and 23 years) (figure S3). To facilitate further inspection, we selected two separate 19 year epochs: 1973–1991 and 2000–2018, which represent the weakest (RWESS–NSDR = 0.11, P > 0.1) and the strongest (RWESS–NSDR = 0.69, P < 0.01) periods of the relationship between WESS and NSDR, respectively. The shift in the snow–rainfall relationship is also clearly illustrated in the spatial pattern, with an evident north–south dipole structure of summer rainfall anomalies over eastern China in the later epoch (figures 2(c) and S4(b)), in response to WESS anomalies. In contrast, such a dipole pattern is not discernible in the earlier epoch (figures 2(b) and S4(a)).

Figure 2. Shift in the relationship between WESS and eastern China summer rainfall. (a) 19 year sliding correlation (R) between NSDR and WESS. The gray dashed line denotes the 95% confidence level. (b) and (c) Show the anomalies of eastern China summer rainfall obtained by regression onto WESS for 1973–1991 and 2000–2018, respectively. Significant rainfall anomalies at the 95% confidence level are hatched.
Download figure:
Standard image High-resolution image3.2. Dynamic interpretation of the shift in the snow–rainfall relationship
Numerous observational and modeling studies suggested that the delayed snow hydrological effect acts as a crucial role in linking the spring snow cover and summer atmospheric circulations through regulating the soil moisture (e.g. Xu and Dirmeyer 2013, Halder and Dirmeyer 2017, Zhang et al 2017a, 2019). The anomaly of soil moisture induced by the spring snowmelt could persist into the following season, providing a lagged influence on the summer atmospheric circulations through its effects on the surface energy balance and the resultant atmospheric thermal condition. Here, we show that following the positive anomaly of spring snow cover over the western Eurasia, the significantly increased soil moisture are observed over this region during both spring and subsequent summer (figures S5(a) and (b)). The wetter soil consumes more energy to evaporate the excessive moisture and results in less energy (figures S5(c) and (d)) being used to heat the atmosphere, thereby leading to the decrease of air temperature at surface and mid troposphere (figures S5(e)–(h)), which then would induce the anomalous atmospheric circulations.
We interpreted the emerging influence of WESS on NSDR from above perspective, through statistical regression analyses of large-scale circulation and moisture fields onto WESS in the two epochs (figure 3). Following positive anomalies of WESS in the later epoch, there is an obvious wave train pattern with alternate positive and negative geopotential height anomalies at 500 hPa over the northern mid-high latitudes (figure 3(b)). The WAFs show this wave train extending eastwards from eastern Europe to northern Siberia, then southeastwards to the Lake Baikal region and to the Yangtze River valley (figure 3(b)), indicating that the snow cover variability signal over western Eurasia can propagate to downstream areas through this teleconnection. As a result, at 850 hPa, there is a prominent anomalous anticyclone centered over the southeast coast of China and an anomalous cyclone to the east of Lake Baikal (figure 3(d)), indicating a quasi-barotropic structure. On the one hand, the anomalous anticyclone over southern China leads to an anomalous descending motion (figure 3(d)) and moisture divergence (figure 3(f)), which is responsible for the lower-than-normal rainfall to the south of Yangtze River (figure 2(c)). On the other hand, the anomalous southwesterly flow, on the northwest flank of the anticyclone, transports abundant moisture from lower latitudes to north and northeast China, which then converges with the anomalous westerly flow on the southeastern flank of the cyclone centered to the east of Lake Baikal (figures 3(d) and (f)). Such convergence results in an anomalous ascending motion and moisture convergence that ultimately contributes to the higher-than-normal rainfall over north and northeast China (figure 2(b)).

Figure 3. WESS-related circulation anomalies for 1973–1991 (left panel) and 2000–2018 (right panel). (a) and (b) Anomalies of 500 hPa geopotential height (shading) and the associated WAF (vectors; m2 s−2) in summer (June–August) obtained by regression against the WESS. Geopotential height anomalies that reached the 95% confidence level are outlined by dashes. WAFs with magnitude less than 0.05 m2 s−2 are not shown. (c) and (d) Same as (a) and (b) except for the 850 hPa wind (vectors; m s−1) and 500 hPa vertical velocity (shading). (e) and (f) Same as (a) and (b) but for vertical integrated water vapor flux (vectors; kg m−1 s−1) and its divergence (shading). Green dots and black vectors indicate values significant at the 95% confidence level.
Download figure:
Standard image High-resolution imageIn contrast, in the earlier epoch with non-significant RWESS–NSDR, there is no clear wave train pattern in response to the WESS anomalies (figure 3(a)). The signal of snow cover anomalies over western Eurasia is not able to propagate to downstream areas, resulting in no significant anomalies of circulations and rainfall over eastern China (figures 3(c) and (e)). We suggest that the shift in the snow–rainfall relationship may result from changes in WESS-related anomalous circulations.
3.3. Mechanisms responsible for the shift in the snow–rainfall relationship
A crucial issue that needs to be addressed is what contributed to the changes in WESS-related circulation anomalies before and after the late 1990s. We found that the anomalous atmospheric circulations responsible for the formation of NSDR, exhibit a wave-train like pattern originating from the North Atlantic, where the dipole structure of geopotential height anomalies closely resembles the spatial pattern of the summer NAO (SNAO) (Hurrell et al 2003, Folland et al 2009) (figure S6). The SNAO could exert a notable impact on the eastern Asian climate through a wave train teleconnection over Eurasia (Linderholm et al 2011, Sun and Wang 2012). Here, we find that the correlation coefficient between SNAO and NSDR is 0.47 (significant at the 99% confidence level), suggesting a possible contribution of SNAO to the formation of NSDR during the period 1967–2018. Interestingly, a partial correlation analysis indicates that RWESS–NSDR becomes statistically significant (R= 0.53, P < 0.05) in the earlier epoch if the effect of SNAO is removed, suggesting a modulation effect of SNAO on RWESS–NSDR.
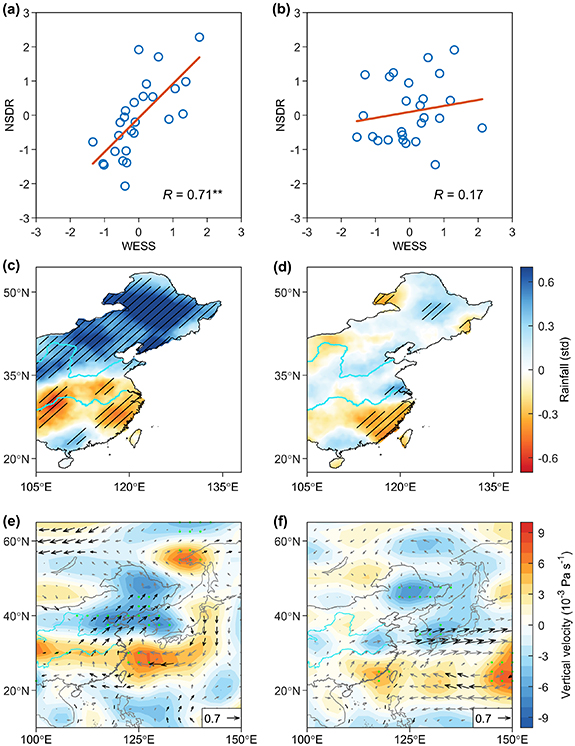
How does SNAO contribute to the shift in RWESS–NSDR? In response to the positive phase of the SNAO, there is a wave train circulation at 500 hPa extending from the North Atlantic to east Asia (figure S7(a)), which induces an anomalous cyclone over Lake Baikal and an anomalous anticyclone over eastern China (figure S7(b)). This circulation pattern is conducive to the formation of the meridional dipole pattern of rainfall anomalies over eastern China (figure S7(c)). More importantly, the SNAO-related anomalous patterns of circulation and rainfall are consistent with those induced by WESS (figures 2(c), 3(b) and 3(d)). Such a result leads to the hypothesis that, if SNAO occurs in-phase with WESS, it will amplify the impact of WESS on NSDR, while, if out-of-phase, it will counteract the impact. We confirmed this hypothesis by analyzing the relationship between WESS and NSDR in two groups of years when SNAO occurred in-phase and out-of-phase with WESS. After applying a 9 year high-pass filter to the original WESS and SNAO time series, the in-phase (out-of-the-phase) group was defined to include the years having the same (opposite) sign of filtered WESS and SNAO (table S1). For the in-phase group, RWESS–NSDR can reach as high as 0.71 (significant at the 99% confidence level) (figure 4(a)). In this group, following the positive WESS anomalies, there is a wave train propagating from the northern Siberia to the vicinity of Lake Baikal and then to the Yangtze River basin (figure S8(a)). Correspondingly, an obvious anomalous anticyclone over eastern China and a cyclone over the Lake Baikal region are observed (figure 4(e)), which then form a pronounced meridional dipole structure of rainfall anomalies over eastern China (figures 4(c) and S4(c)). For the out-of-phase group, the RWESS–NSDR is only 0.17 (P = 0.40) (figure 4(b)), and there is no clear rainfall anomaly pattern (figures 4(d) and S4(d)) because of weak circulation anomalies (figures 4(f) and S8(b)).
Figure 4. Snow–rainfall relationship in the years when WESS and SNAO are in-phase (left panel) and out-of-phase (right panel). (a) and (b) Scatterplots of WESS with NSDR. Two asterisks indicate that R is significant at the 99% confidence level. (c) and (d) Summer rainfall anomalies obtained by regression against the WESS. Significant rainfall anomalies at the 95% confidence level are hatched. (e) and (f) Anomalies of 850 hPa wind (vectors; m s−1) and 500 hPa vertical velocity (shading) in summer obtained by regression onto WESS. Green dots and black vectors indicate values significant at the 95% confidence level.
Download figure:
Standard image High-resolution image
Using a bootstrap sampling method, we estimated that, in the earlier epoch, 77% of years have the out-of-phase relationship between the WESS and SNAO, with the remaining 23% having the in-phase relationship (figure S9). For the later epoch, the relevant values were 20% for out-of-phase and 80% for in-phase. Therefore, in the later epoch, the WESS-related anomalous circulations would be largely reinforced by the constructive superposition of the frequently occurring same-sign circulation anomalies associated with SNAO. A strengthened anomalous circulation is then formed, which favors a pronounced meridional dipole structure of rainfall anomalies over eastern China, leading to a statistically significant snow–rainfall relationship. In contrast, in the earlier epoch, the WESS associated circulation anomalies would be largely counteracted by the destructive superposition of the opposite-sign anomalous circulation induced by SNAO. The WESS-related dipole pattern of rainfall anomalies would then be cancelled out by the opposite sign dipole mode caused by SNAO, thus leading to a weak snow–rainfall relationship. Moreover, an empirical statistical model indicates that the prediction skill would substantially improve when both the WESS and SNAO indices are used to predict the NSDR time series in comparison with that using only the WESS index (figure S10), further suggesting the important role of the SNAO in the connection between WESS and NSDR.
4. Discussion and conclusion
We also explored other possible mechanisms that might contribute to the shift in RWESS–NSDR. First, the ENSO, an important source of inter-annual climate variability over east Asia (Wang et al 2000, Xie et al 2009, Zhang et al 2017b). To examine the possible effect of ENSO on RWESS–NSDR, we conducted a partial correlation analysis between WESS and NSDR, whilst statistically controlling for the effect of ENSO. Our results show that the observed shift in RWESS–NSDR still persists after removing the ENSO signal (table S2). Similar results were found when the IOD, EAP teleconnection pattern, and AO were considered (table S2). Second, the Tibetan Plateau provides an elevated heat source for the atmosphere, and its thermal forcing plays a crucial role in summer precipitation variation over eastern China (Wu et al 2007, 2015). There is evidence to show that recent reductions in the intensity of the Tibetan Plateau heat source could contribute to the 'South Flood–North Drought' pattern over eastern China (Duan and Wu 2008, Duan et al 2013). However, our partial correlation analysis shows that the shift in RWESS–NSDR is still observed after excluding the effect of spring thermal forcing (table S2). Third, one particularly conspicuous land surface change in eastern China over the past three decades is human land-use management induced vegetation greening (Chen et al 2019). Such greening could affect local and downwind precipitation through enhanced evapotranspiration and changes in atmospheric circulation (Piao et al 2020). The possible impact of greening on the snow–precipitation relationship requires investigation, particularly as a prominent greening trend has emerged over South China in the last two decades (Chen et al 2019). We used the first two leading EOFs of LAI over eastern China to represent different modes of the vegetation greening pattern. After removing the covarying effect of each mode with rainfall through a partial correlation analysis, changes in the vegetation greening pattern did not explain the observed shift in RWESS–NSDR (table S2).
In addition, some inter-decadal oscillation of SST anomalies such as Pacific Decadal Oscillation and Atlantic Multidecadal Oscillation experienced a phase transition around the 1990s and contributed to the decadal change in the eastern China summer rainfall (Zhu et al 2015, Si and Ding 2016). However, the relatively short time period of observations hinders any attempt to distinguish the possible impact of such multi-decadal variations on the shift in the snow–rainfall relationship. Although these issues could be principally addressed through perturbed or sensitivity simulations, a better representation of snow–atmosphere coupling is required than that in the current generation of coupled models which are fraught with snow-related deficiencies.
In summary, we have combined observational and reanalysis data sets to reveal a strengthened connection between western Eurasian spring snow cover (WESS) and the meridional dipole structure of the summer rainfall anomalies over eastern China since the late 1990s. Such an amplified snow–rainfall relationship, along with the decline in Eurasian spring snow cover, constitutes a possible reason behind the 'South Flood–North Drought' pattern observed in eastern China since the 1990s. Our finding is exactly the opposite of a previously reported result on the Indian summer monsoon, which showed a weakened snow–rainfall relationship since the 1990s (Peings and Douville 2010, Wu et al 2014, Zhang et al 2019). We thus suggest a different paradigm for understanding the impact of Eurasian spring snow cover on the Asian summer monsoon, with south and eastern Asian subsystems.
Acknowledgments
This study was supported by Key Research and Development Programs for Global Change and Adaptation (2017YFA0603604 and Y7Jk011001), Preliminary research on Three Poles Environment and Climate Change (2019YFC1509103), and the National Natural Science Foundation of China (41871104, 41530528).
Data availability statement
All data that support the findings of this study are included within the article (and any supplementary files).