 Claude Alain Kouadio1,2
 Kouakou Lazare Kouassi3
 Arona Diedhiou1,4*
 Salomon Obahoundje1
 Ernest Amoussou5Bamory Kamagate6Jean-emmanuel Paturel7Talnan Jean Honoré Coulibaly2
 Houebagnon Saint Jean Patrick Coulibaly8
 Regis Sacre Didi1Issiaka Savane2
- 1African Centre of Excellence on Climate Change, Biodiversity and Sustainable Agriculture, University Felix Houphouet-Boigny, Abidjan, Côte d'Ivoire
- 2Laboratory of Geosciences and Environmental Sciences, University Nangui Abrogoua, Abidjan, Côte d'Ivoire
- 3Laboratory of Environmental Sciences and Technologies, Unité de Formation et de Recherche (UFR) Environment, University Jean Lorougnon Guédé, Daloa, Côte d'Ivoire
- 4Institut des Géosciences de l'Environnement, Université Grenoble Alpes, Saint Martin d'Hères, France
- 5Department of Geography and Territory Management, University of Parakou, Parakou, Benin
- 6Unité de Formation et de Recherche Sciences Géologiques et Minières, University of Man, Man, Côte d'Ivoire
- 7HydroSciences Montpellier (HSM), University of Montpellier, IRD, Montpellier, France
- 8African Centre of Excellence on Climtate Change, Biodiversity and Sustainable Agriculture, University Félix Houphouët-Boigny, Abidjan, Côte d'Ivoire
An assessment of hydropower potential at the watershed scale was conducted at the White Bandama Watershed (WBW) in Côte d'Ivoire (West Africa). The method used involves the application of a hydrological model [Soil and Water Assessment Tool (SWAT)] coupled with a Quantum Geographic Information System (QGIS), denoted as QSWAT, to assess the water resource availability and hydropower potential of streams and determine potential hydropower sites for future hydropower development in the watershed. Geospatial data about the topography, soil types, land use/land cover, weather, and discharge were considered in hydrological and hydro-geomorphological characterization of the watershed. Streamflow and climate data-enabled model operation and simulation of the hydrology of the watershed. The model performance and robustness were confirmed with the p-factor, r-factor, coefficient of determination R2, and Nash–Sutcliffe (NS) efficiency coefficient. The hydropower potential of streams was evaluated by considering the simulated streamflow and water head. A total of 22 future hydropower sites was identified, geolocated, and classified with an estimated total production capacity of 538.56 MW.
Introduction
Hydropower is considered as a clean, renewable, and environmentally friendly energy source (Berga, 2016; Kayastha et al., 2018) depending on the size of the plant. Hydropower is a technically mature and economically competitive renewable energy source that can provide notable advantages in the operation and stability of energy systems (International Hydropower Association, 2018). This energy source can contribute to a reduction in greenhouse gas (GHG) emissions and can better facilitate energy security assurance (Kusre et al., 2010). A record amount of 4,185 TWh of hydropower electricity was generated in 2017, avoiding up to 4 billion tons of GHGs and harmful pollutants (International Hydropower Association, 2018).
In Côte d'Ivoire, a study conducted by the National Action Plan for Renewable Energies of Côte d'Ivoire (PANER) revealed that the country contains a high renewable energy potential (National Action Plan for Renewable Energies of Côte d'Ivoire, 2016). Hydropower is one of the potential energy sources and remains largely untapped in Côte d'Ivoire (Sakellariou et al., 2018; Deshaies and Kouadio, 2019). Hydropower development in Côte d'Ivoire is not proportional to its potential. The contribution of hydropower to the energy mix in Côte d'Ivoire is low, at ~20% (Ivorian Company of Electricity, 2016). The impacts of hydroclimatic variability on surface water, as determined in previous White Bandama Watershed (WBW) studies (Kouame et al., 2019; Kouadio et al., 2020) and the increasing need for rural electrification with rapid population growth in Côte d'Ivoire have resulted in the need for additional hydropower generation sites. It is therefore important to evaluate the hydropower potential and plan future hydropower development sites. Hydropower potential assessment could contribute to the provision of affordable and less polluting electricity to local communities (Korkovelos et al., 2018). Previous studies in hydropower projects proposed a methodology to investigate hydropower potential. The researchers such as Dudhani et al. (2006), Belmonte et al. (2009), Rojanamon et al. (2009), and Yi et al. (2010) highlighted the importance of GIS technology, geospatial analysis and remote sensing data in the selection of potential sites for future development of hydropower, particularly for small hydropower projects. However, they did not include hydrological analysis. Furthermore, the studies conducted by Kusre et al. (2010), Pandey et al. (2015), Zarfl et al. (2015) and Al-Juboori and Guven (2016) suggested a methodology based on hydrological modeling and GIS. These studies confirmed that the coupling of hydrological model and GIS is suitable to assess the hydropower potential and to determine future sites. Sustainable development of hydropower contributes to increase the share of energy generated from renewable sources. In the climate change mitigation policies, small hydropower is actively promoted. It has grown in popularity and continues to grow. Small hydropower may support the transition from fossil fuels to more sustainable electricity systems (Kelly-Richards et al., 2017). Therefore, hydropower plays an important role in the renewable energy and in electricity generation for future. Hydropower is the largest renewable energy source in terms of electricity generation and will remain the main energy source of renewable energy (International Energy Agency, 2019; Doso and Gao, 2020). The investigation of scientific literature showed that the development of hydropower plants should undergo adequate environmental requirements. Rigorous planning and management concerning the selection of sites are needed to reduce the ecological impacts of hydropower projects (Kuriqi et al., 2021). Thus, this study is a new contribution to implement a methodology using an integrated hydrological modeling and a geospatial analysis to assess the hydropower potential. The scope of this article is to adopt a hydrological model combined with a geographic information system (GIS) to assess the hydropower potential of the White Bandama River (WBR) and to determine probable sites for future hydropower generation. This article is structured as follows: after the general introduction which presents the background and the objectives of this study, Section Material and Methods describes the Material and Methods used, the key results and discussion are presented in Section Results and Discussion. This manuscript end-up with the take-away message in Section Conclusion.
Materials and Methods
Study Area
The study area is the WBW, which is located in central-northern Côte d'Ivoire (West Africa), between latitudes 6°30′ and 10°30′ N and longitudes 5° and 6°30′ W, with an area of ~32,400 km2 (Figure 1). The WBW is an elongated basin with a perimeter of ~1,020 km and a Gravelius compactness index KG value of 1.59 (Kouadio et al., 2020). The source of the WBR is situated in the northern part of Côte d'Ivoire between Boundiali and Korhogo at an altitude of 480 m. The basin is under the influence of two climates, namely, the Baoulean or equatorial transitional climate and the Sudanese or tropical transitional climate (Goula et al., 2007). The Baoulean climate extends from the south to the center of the WBW. This climate type is characterized by four seasons, namely, two rainy seasons and two dry seasons with the annual precipitation varying between 1,000 and 1,600 mm on average. The Sudanese climate in the north is characterized by one rainy season and one dry season, with the annual precipitation varying between 1,000 and 1,200 mm, thereby exhibiting a unimodal distribution (Soro et al., 2017).
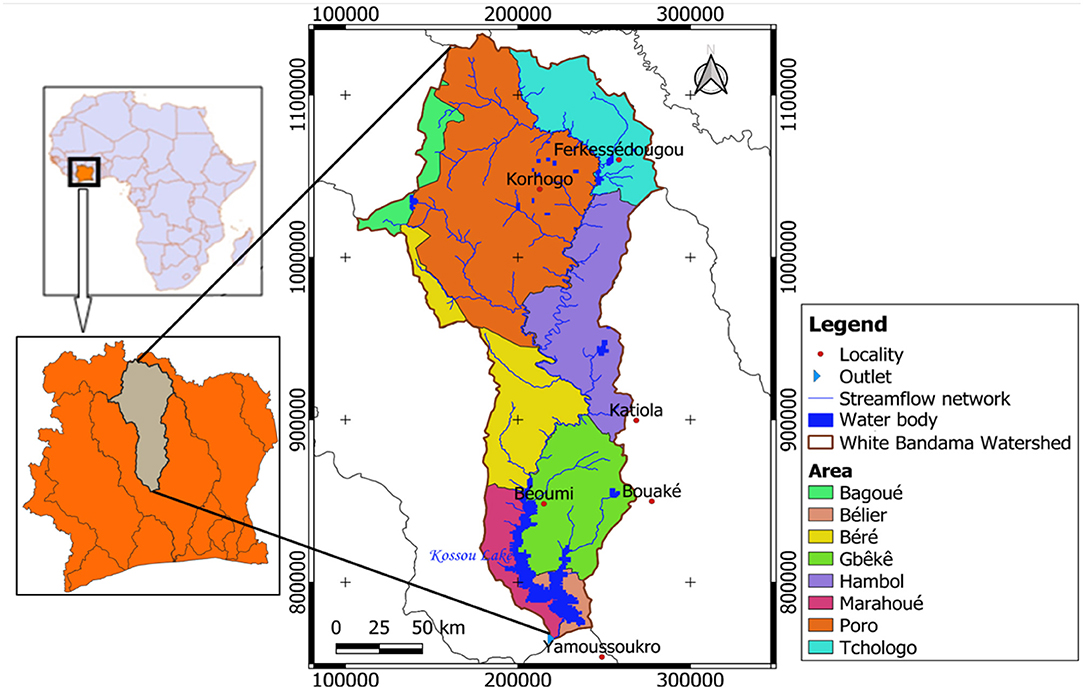
Figure 1. Location of the WBW.
The WBW contains an important hydrographic network of the dendritic type according to Strahler's classification (Koffi et al., 2011). In the WBW, the Kossou hydropower dam was built in 1971 and completed in 1972 (FAO, 2002). The dam reservoir exhibits a volume of approximately 28.8 billion m3 and an area of 1,855 km2 (Anoh et al., 2017). The Kossou hydropower dam is one of the major hydropower plants in Côte d'Ivoire. This dam has an installed capacity of 174 MW, i.e., which represents ~20% of the total hydropower generation of Côte d'Ivoire (Ivorian Company of Electricity, 2016).
Description of the Hydrological Model
In this study, an agro-hydrological model, i.e., the Soil and Water Assessment Tool (SWAT), coupled with a GIS interface in QGIS software, denoted as QSWAT, was applied in the WBW. This tool was developed by researchers from the Agricultural Research Service (ARS) of the United States Department of Agriculture (USDA) (Arnold et al., 1993, 1998). The adopted model is a physically-based, basin-scale, spatially distributed, and computationally efficient hydrological model with continuous daily time steps (Gassman et al., 2007). This model was developed to simulate the impact of land use and management practices on the water quantity and quality and to quantify sediment and agricultural chemical yields in large and complex watersheds with changing soil, land use, and management conditions over long periods (Neitsch et al., 2005, 2011). This model can be employed to simulate a single watershed or a system of multiple hydrologically connected watersheds (Winchell et al., 2013). The SWAT model divides the watershed into sub-basins, which are further divided into hydrological response units (HRUs). HRUs are unique soil, land use, and slope combinations used to describe the spatial heterogeneity within a given watershed. Thus, in the simulation process, flows are computed daily in each HRU and summed to provide an overall value at the sub-basin outlet (Anoh et al., 2017). According to Neitsch et al. (2005, 2011) and Dile et al. (2016), the SWAT hydrological modeling process can be split into land and routing phases. The land phase controls the water quantity and sediment, nutrient, and pesticide loads in each sub-basin and is based on the following water balance equation:
where:
SWt: final soil water content (mm),
SW0: initial soil water content on day i (mm),
t: time (days),
Ri: amount of precipitation on day i (mm),
Qsi: amount of surface runoff on day i (mm),
Ei: amount of evapotranspiration on day i (mm),
Wi: amount of water entering the vadose zone from the soil profile on day i (percolation) (mm), and
Qri : amount of return flow on day i (mm).
The model estimates the surface runoff amount based on the Soil Conservation Service (SCS) curve number (CN) method considering daily rainfall data. Detailed descriptions of the SWAT model can be found in Arnold et al. (1993, 1998, 2011, 2012) and Neitsch et al. (2005, 2011).
Several data points are required to set up and operate the WBW SWAT model and simulate streamflows. The Digital Elevation Model (DEM) data were retrieved from the Shuttle Radar Topography Mission (SRTM). These data were freely obtained from the United States Geological Survey (USGS) website (https://earthexplorer.usgs.gov). The data are available at a 30-m spatial resolution and cover the entire WBW. This study required the acquisition and fusion of nine layers. The topography and slope of the WBW were extracted from the acquired DEM-SRTM data with GIS technology.
Soil and land use/land cover maps are essential for model operation. A WBW soil map of 1-km spatial resolution and corresponding physico-chemical properties originating from the Harmonized World Soil Database (HWSD) were provided by the Food and Agriculture Organization (FAO), the International Center for Soil Reference and Information (ISRIC) and, International Soil Science Society (ISSS) (FAO, 1999). These properties included the soil type, number of soil layers, and texture. The land use/land cover map used was obtained from the European Space Agency (ESA) website (http://due.esrin.esa.int/page_globcover.php) for 2006 and has a spatial resolution of 300-m. This map contained physico-chemical and biological properties for simulation purposes.
Daily reanalysis climate data retrieved from 1980 to 2013 (34-years) were adopted. These data of about 38-km grid resolution entirely covered the WBW and included precipitation, temperature (minimum and maximum), solar radiation, wind and relative humidity data. They were obtained from the National Centers for Environmental Prediction (NCEP).
Daily and monthly hydrometric data originating from 4 gauging stations in the WBW were employed: Badikaha, Tortiya-amont, Marabadiassa, and Tortiya-aval. Missing streamflow data were corrected through linear interpolation according to the criteria described by Ardoin-Bardin (2004).
Model Setup and Functioning
The GIS interface of the SWAT model applied in this study is QSWAT. QSWAT is an effective tool for geospatial analysis. The application of QSWAT facilitates access to variables and parameters. This contributes to the management of raster, vector and alphanumeric data. QSWAT was adjusted considering the WBW. In this study, we could distinguish three (3) steps in the QSWAT setup process:
• The first step involved considering the acquired DEM-SRTM data in the automatic extraction of the hydrographic network. In this step, the D8 algorithm (Jenson and Domingue, 1988) was employed for the extraction of the WBW streamflow network and delimitation of the basin and sub-basins from the DEM data. The WBW outlet was defined at Kossou Lake. The threshold was set to 100 km2 in the model. During operation, the D8 algorithm considers eight flow directions following unidirectional flow in eight connections. This algorithm considers all eight neighboring cells of the considered point (Figure 2). First, the D8 algorithm determines the flow direction based on the DEM. Then, the algorithm calculates the slope to determine the flow direction. Finally, the flow direction is determined along the direction of the highest slope. The algorithm assigns a code to the considered point according to the relative position of the cell with the lowest altitude. A flow direction matrix is thus obtained. According to the flow direction, the algorithm determines the direction of flow accumulation, which is finally considered in hydrographic network extraction.
• The second step comprised the integration of the soil and land use/land cover maps of the WBW and soil physico-chemical properties in QSWAT to divide the basin into HRUs that constitute the basic spatial units in hydrological modeling with the SWAT model. HRUs represent a combination of land use, soil type and slope. In this step, the model considers potential evapotranspiration (PET) values for each type of crop, soil type and crop management.
• The last step entailed the integration of daily climate data in streamflow simulation. Daily climate data are the last data to be integrated into the model. These data included the precipitation, temperature, solar radiation, wind and relative humidity at 33 stations covering the WBW. PET was calculated according to the Penman–Monteith equation (Allen et al., 1998, 2005). The variable storage method developed by Williams (1969) was chosen for the streamflow calculation process. This method calculates the difference between the inflow and outflow as a function of the time elapsed following prism water storage. Runoff was calculated with the CN method. The simulation period was defined from 1980 to 2013 (a 34-year simulation period) with a warming period of 2 years.
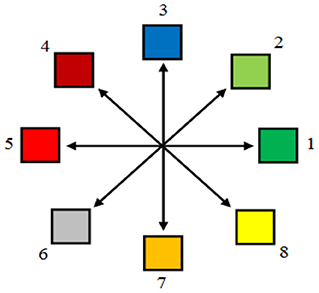
Figure 2. Computation directions of the D8 algorithm (Coulibaly et al., 2016). Directions: 1—east, 2—north-east, 3—north, 4—north-west, 5—west, 6—south-west, 7—south, 8—south-east.
Model Sensitivity Analysis, Calibration, and Validation
Sensitivity analysis, calibration and validation of the WBW model were automated at monthly time steps in SWAT-Calibration Uncertainty Program (CUP) software through the Sequential Uncertainty Fitting version 2 (SUFI-2) algorithm (Schuol and Abbaspour, 2006; Abbaspour, 2015; Abbaspour et al., 2018). The SUFI-2 algorithm was chosen in this study because of its wider use in simulation studies with the SWAT model. This algorithm has been verified to be quite effective for complex models associated with long computation times. In addition, the effectiveness of this algorithm has already been demonstrated based on satisfactory sensitivity analysis, calibration and validation result in several basins. The SUFI-2 algorithm was employed for WBW QSWAT model calibration and validation according to the method described by Arnold et al. (2012), Abbaspour (2015), and Abbaspour et al. (2018). Model calibration and validation are important to perform a comparative analysis of observed and simulated data. Nineteen parameters were selected based on the literature and previous studies conducted in Côte d'Ivoire (Anoh et al., 2017; Koua et al., 2019) (Table 1). Sensitivity analysis, encompassing 500 simulations, was performed through model operation while varying a particular value of a given model parameter within a prescribed range. The calibration and the validation of the model were carried out on periods where the data are complete on the four gauging stations. Calibration was performed from 1982 to 1985 with five iteration steps for a total of 2,500 simulations, and validation was performed from 1986 to 1989 with one iteration step for a total of 500 simulations. The observed and simulated streamflows at four gauging stations in the WBW were compared in SWAT-CUP software.
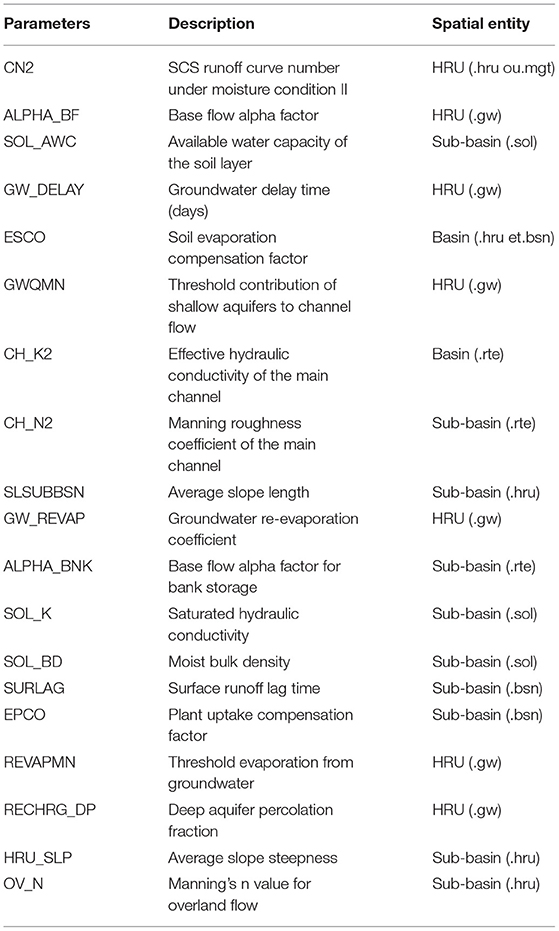
Table 1. List of parameters analyzed with the SUFI-2 algorithm.
In this study, two objective functions were employed for calibration: the Nash–Sutcliffe (NS) coefficient and the coefficient of determination (R2). Santhi et al. (2001) and Coffey et al. (2004) recommended the joint application of R2 and NS as a method to analyze and evaluate simulations at monthly time steps. The performance of the model was therefore evaluated considering quality statistics based on these two objective functions.
where:
Qo: observed or measured streamflow;
Qs: simulated streamflow;
average value of the observed or measured streamflows;
: average value of the simulated streamflows; and
i is the ith observed/measured or simulated data.
In addition, two statistical parameters were determined to quantify the calibration and validation results (the simulation uncertainty in particular), namely, the p-factor and r-factor.
where:
k: number of observed or measured data points;
XP1: cumulative distribution percentage of the simulated points corresponding to 2.5%;
XP2: cumulative distribution percentage of the simulated points corresponding to 97.5%; and
σx: standard deviation of measured quantity X.
The NS coefficient value ranges from –∞ (reflecting a very weak adjustment between the observed and simulated values) to 1 (reflecting a very strong adjustment). An NS value <0 could indicate that the mean variable value could be the best model prediction result. A model is generally deemed unsatisfactory for NS ≤ 0.5. Moreover, 0.5 < NS ≤ 0.65 indicates a satisfactory performance, 0.65 < NS ≤ 0.75 indicates a good performance, and 0.75 < NS ≤ 1 indicates a very good performance. The R2 value varies between 0 and 1 for a perfect model. An R2 value > 0.5 indicates a good agreement between the observed and simulated data. The best simulation results exhibit a p-factor value approaching 1 and an r-factor value approaching 0. Thus, in acceptable simulations, a suitable balance between these parameters must be achieved. According to Abbaspour (2011, 2015), a p-factor value of at least 0.7 and an r-factor value <1.5 are acceptable for model calibration and validation purposes. The p-factor is the fraction of measured data bracketed by the 95PPU band and varies from 0 to 1 (where 1 indicates 100% bracketing of the measured data within model prediction uncertainty). Xp2 and Xp1 are, respectively, the upper and lower boundary of the 95PPU. The quantity (1 - p-factor) could hence be referred to as the model error. The r-factor is the ratio of the average width of the 95PPU band and the standard deviation of the measured variable (Abbaspour et al., 2015).
Assessment of the Hydropower Potential
In this study, the gross hydropower potential was assessed along each stream branch in the WBW. This parameter typically depends on the streamflow and water head and was assigned a weighting coefficient. The hydropower potential was calculated and assigned to each branch of the streamflow network considering the flow volume generated by the watercourse branch from upstream to downstream of the sub-basin and elevation difference. The water head was determined from the DEM based on the difference in height between the start and end of the stream section. The hydropower potential P (in W) can be calculated with the equation of Maher and Smith (2001), as follows:
where:
ρ: density of water (1,000 kg/m3),
g: gravitational acceleration (9.81 m/s2);
Q: discharge (m3/s); and
h: difference in elevation (water head) (m).
Selection of Future Hydropower Potential Sites
Potentially exploitable sites for future hydropower development were selected with a geospatial tool in GIS software. Certain criteria linked to environmental, topographical, and hydrological restrictions were considered to select probable future sites (Table 2). These criteria were superimposed in GIS software, and geospatial analysis was performed to select probable future hydropower sites. A search distance of 10 km is used assuming that the minimum distance between consecutive hydropower sites should not be smaller than 10 km. The hydropower sites are searched from upstream to downstream of the stream based on the criteria defined on the gross hydropower. The search for potentially exploitable sites terminates when the site respects the set restriction criteria. These criteria are very similar to those reported by Kusre et al. (2010), Pandey et al. (2015), Tarife et al. (2017) and Korkovelos et al. (2018). A filter was employed in the GIS-based on these criteria to identify future hydropower potential sites. The hydropower production ratio (Rph) was calculated per linear kilometer. This ratio represents the linear density of hydropower production given by:
where:
Rph: linear production density (W/km or kW/km);
PHexp: exploitable potential (W or kW); and
L: stream length (km).
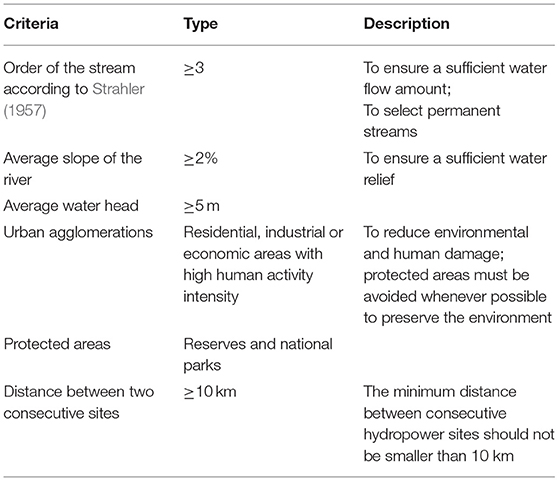
Table 2. List of the restriction criteria for hydropower potential evaluation.
Figure 3 summarizes the methodology used for the hydropower potential assessment and the identification of the potentially exploitable sites. The figure shows the input and output data of the whole framework.
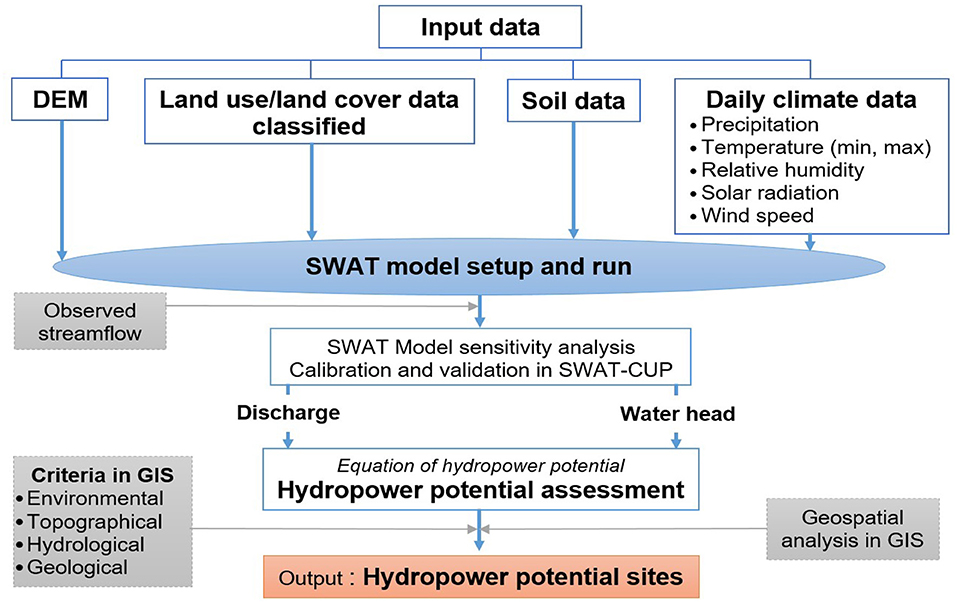
Figure 3. Methodological framework for hydropower potential assessment.
Results and Discussion
Model Calibration and Validation
The WBW SWAT model was calibrated at monthly time steps, with 5 iteration steps for a total of 2,500 simulations at 4 stations in the sub-basins of Badikaha (SB 62), Tortiya-amont (SB 97), Tortiya-aval (SB 135), and Marabadiassa (SB 137) from 1982 to 1985 (4 years). The best calibration parameters were applied in model validation without any other changes. A single iteration step of 500 simulations was enough to validate the WBW model from 1986 to 1989 (4 years). Model performance and robustness evaluation parameters (NS, R2, p-factor, and r-factor) were calculated for each station during calibration and validation. Figure 4 shows the calibration/validation results for the SWAT model. Figures 5, 6 show the correlation between the observed and simulated monthly streamflows during the calibration and validation periods, respectively. Model calibration and validation in the 4 sub-basins yielded R2 and NS values >0.5. The p-factor values ranged from 0.70 to 0.81 for the calibration period and from 0.63 to 0.73 for the validation period. The statistical tests of p-factor indicated that 70–81% and 63–73% of observed streamflow, respectively, over the calibration and validation period, are framed by the 95PPU band with model errors estimated between 19 and 30%. These p-factor values being close to 1 (100%), they are satisfactory. The r-factor values ranged from 0.49 to 0.71 for the calibration period and from 0.32 to 0.54 for the validation period. These values were <1.5 and quite close to 0, respectively. The p- and r-factor values for the calibration/validation periods were acceptable. There existed a good correlation between the observed and simulated monthly streamflows during the calibration/validation periods. The model attained a good performance and robustness regarding streamflow simulation in the WBW. The SUFI-2 algorithm considers model uncertainties. The SWAT parameters adopted to evaluate the model performance and robustness are summarized in Table 3.
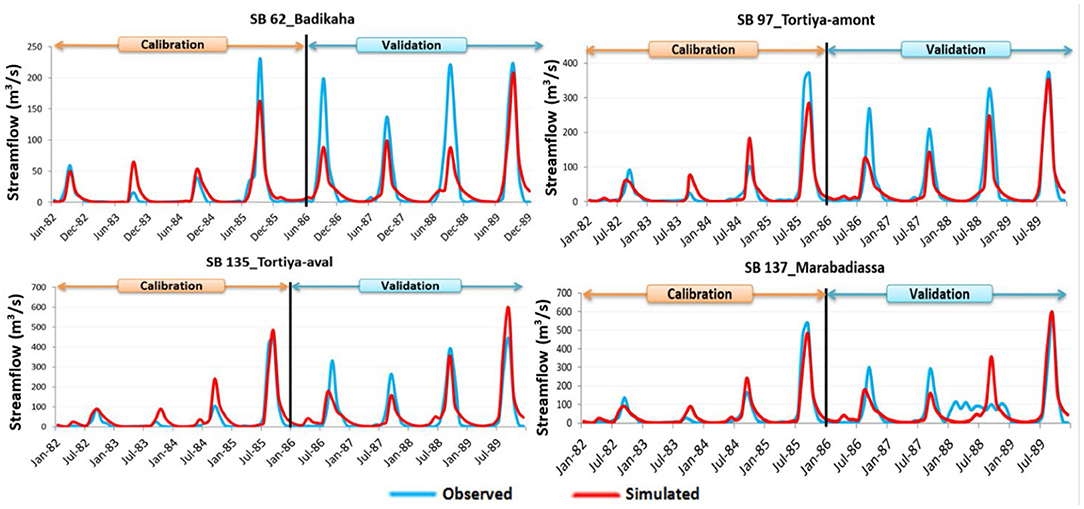
Figure 4. Calibration and validation of the WBW SWAT model in SB 62 (Badikaha station), SB 97 (Tortiya-amont station), SB 135 (Tortiya-aval station), and SB 137 (Marabadiassa station).
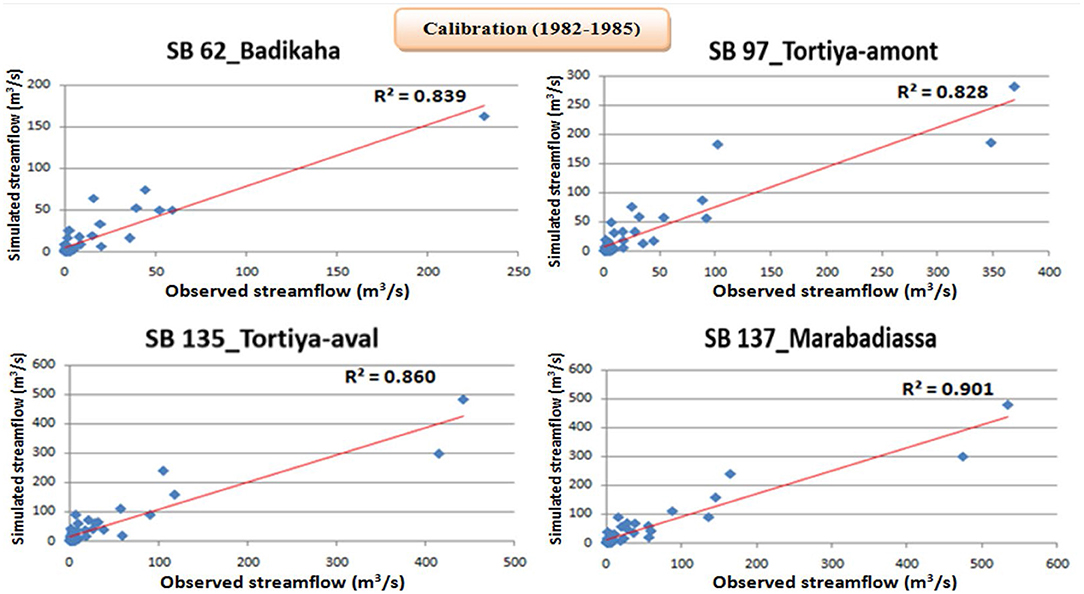
Figure 5. Correlation between the observed and simulated monthly average streamflows in SB 62 (Badikaha station), SB 97 (Tortiya-amont station), SB 135 (Tortiya-aval station), and SB 137 (Marabadiassa station) during the calibration period 1982–1985.
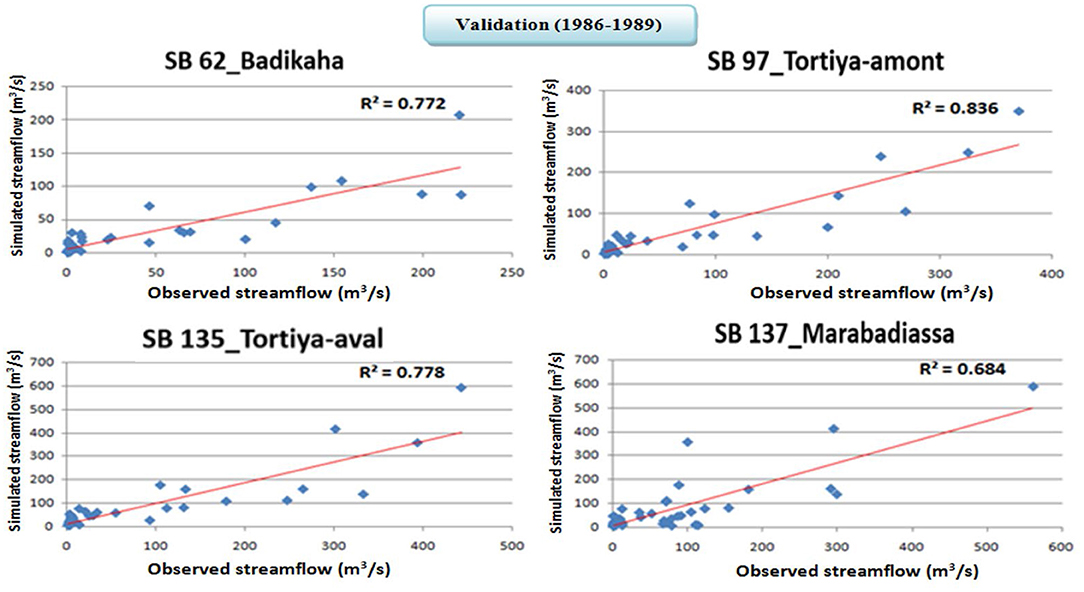
Figure 6. Correlation between the observed and simulated monthly average streamflows in SB 62 (Badikaha station), SB 97 (Tortiya-amont station), SB 135 (Tortiya-aval station), and SB 137 (Marabadiassa station) during the validation period 1986–1989.
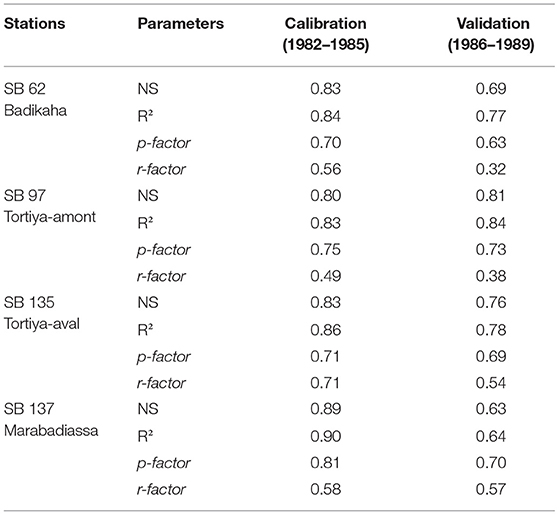
Table 3. WBW model performance/robustness parameters during the calibration and validation periods.
Hydrological and Hydrogeomorphological Characterization of the WBW
DEM processing yielded hydrological and hydrogeomorphological characteristics of the basin. Figure 7 shows the streamflow network, watershed outline, and sub-basins extracted from the DEM with the SWAT model coupled to geospatial tools.
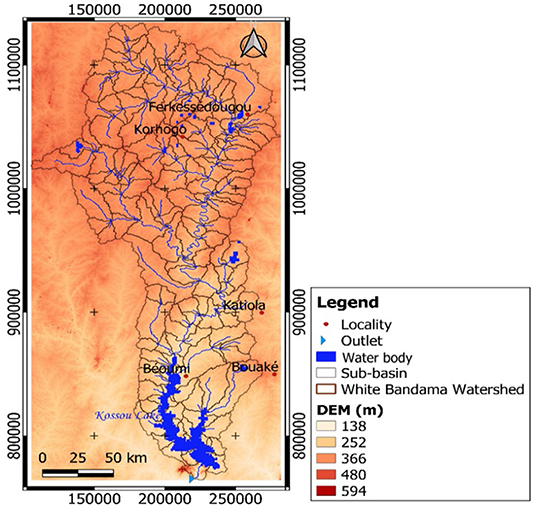
Figure 7. Automatic extraction of the streamflow network, watershed outline, and sub-basins in the study area.
The hydrographic network of the study area was extracted considering the watershed outlet at Kossou and threshold, which was set to 100 km2. This threshold resulted in a network with a total length of ~2,605 km. The mainstream length was ~736.3 km. The total area of the WBW estimated with the model covered ~32,898 km2. The results indicated that the network of the WBW is quite dense, and drainage is quite important. This could comprise a considerable asset for hydropower generation in the basin.
A total of 185 HRUs was discretized. An HRU is a small unit, representing a combination of land use, soil type, and slope in SWAT hydrological modeling. Figure 8 shows a spatial distribution of the discretized HRUs.
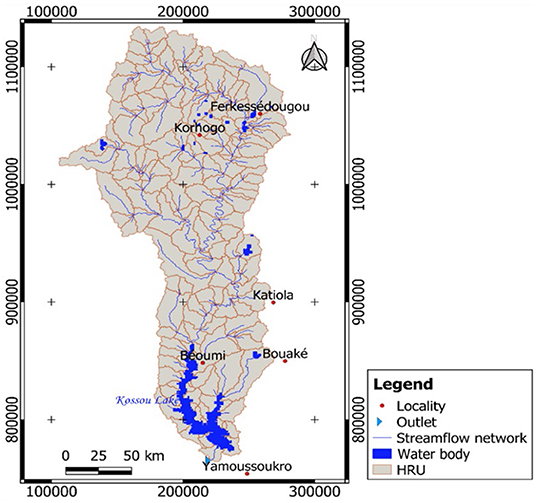
Figure 8. Spatial distribution of the extracted HRUs in the WBW.
Analysis of the HRUs in the basin indicates that savannah plants constituted the dominant vegetation type in more than 88% of all HRUs. In addition, the dominant soil types in over 81% of all HRUs included Acrisols (Ferric, Plinthic, and Orthic Acrisols). The proportion of surface water reached ~6%. The slopes were relatively low, and in 60% of all HRUs, the slope varied between 0 and 6%.
Water Availability
The discharge flow of the WBR was assessed from 1980 to 2013. Figure 9 shows the hydrological modules of the WBR for this period. The model synthesizes the average annual river flows over at least 30 years high discharge values occurred in Kossou and Yamoussoukro. The northern basin generally attained lower discharge values than those of the southern basin. Simulated average discharge values were considered to assess the hydropower potential of the WBW.
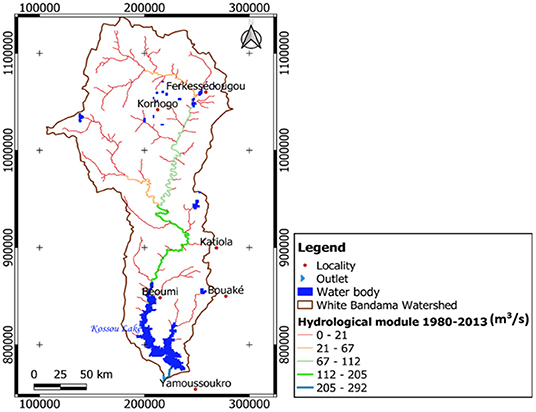
Figure 9. Assessment of the hydrological module of the WBW from 1980 to 2013.
Hydropower Potential and Future Sites
First, the gross hydropower potential of the WBW was assessed without limitations or constraints on the entire hydrographic network (Figure 10). Then, the exploitable hydropower potential was determined with geospatial tools and via superimposition of criteria linked to environmental, topographical, hydrological, and geological restrictions in GIS software (the order of the streamflow network, average stream slope, difference in level or water head, and protected areas such as national parks and reserves) (Figure 11).
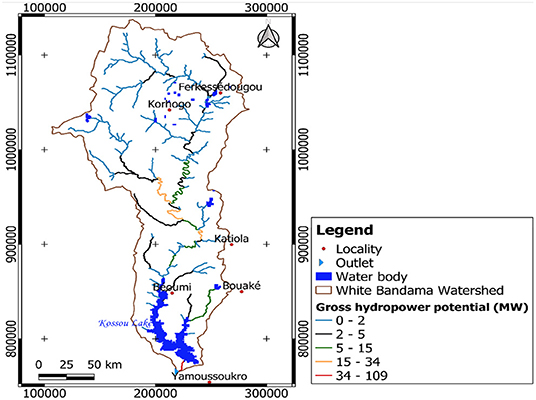
Figure 10. Assessment of the gross hydropower potential of the WBW.
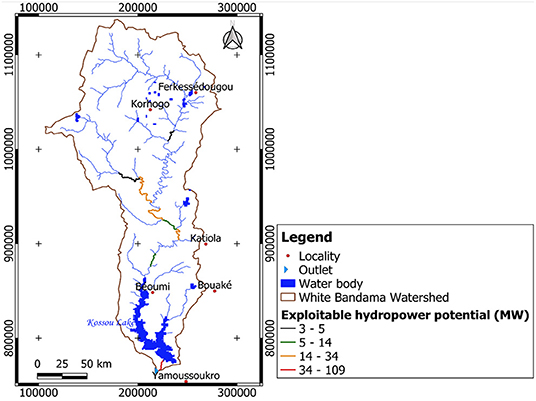
Figure 11. Assessment of the exploitable hydropower potential of the WBW.
Finally, in geospatial analysis, the criterion involving a distance of at least 10 km between two exploitable sites enabled the identification of 22 potentially exploitable sites spread across 8 sub-basins, with an estimated total hydropower production capacity of ~538.56 MW. Figure 12 shows these potential sites for future hydropower deployment and their geospatial location in the WBW.
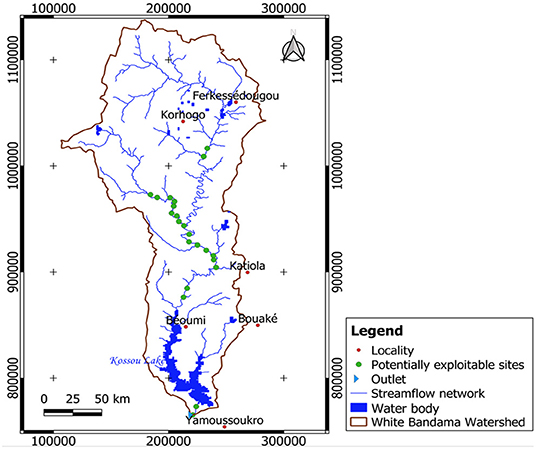
Figure 12. Geospatial location of the potentially exploitable sites for future hydropower deployment in the WBW.
Table 4 provides a summary of these potentially exploitable sites by the sub-basin. The total hydrographic network of hydroelectric production is ~238.29 km, covering an area of 2,450.7 km2 or ~7.45% of the total area of the WBW.
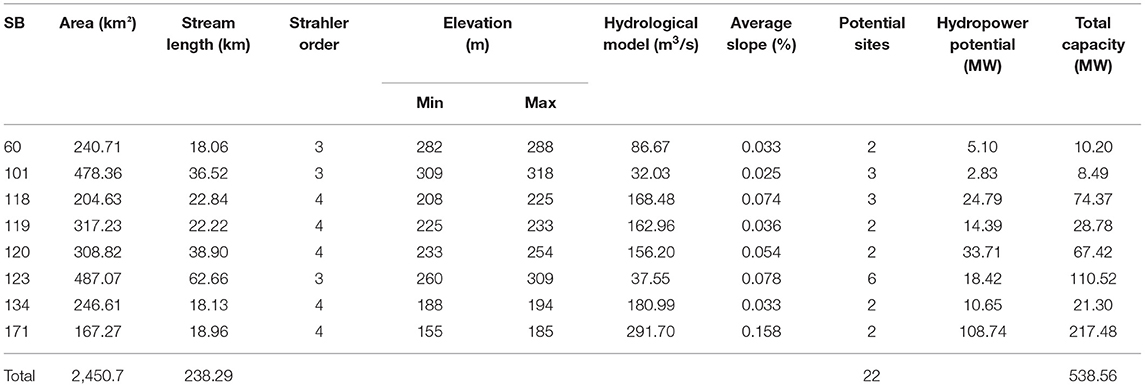
Table 4. Distribution of the potentially exploitable sites by the sub-basin.
The hydropower generation ratio (linear production density per kilometer) was also determined in the WBR (Table 5). This ratio is necessary to better appreciate the hydroelectric production capacity of each stream in the sub-basin considered.
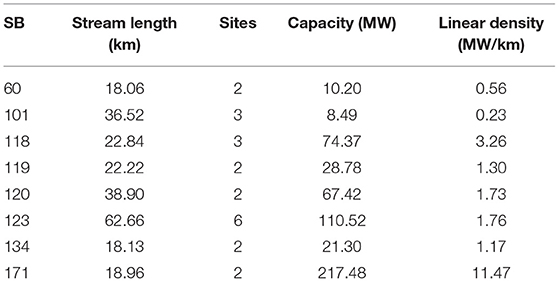
Table 5. Linear density of hydroelectric generation by the sub-basin.
Analysis of the results revealed that SB 171 exhibited the highest linear density of hydroelectric generation per kilometer, at 11.47 MW/km. SB 171 could represent the most productive SB of the WBW. SB 101 was the least productive sub-basin, with the lowest linear production density value of 0.23 MW/km. The 22 hydropower potential sites were classified according to their production capacity. The results indicated three (3) types of hydropower potential sites in the WBW: small-hydropower potential sites accounting for 82% of all hydropower potential sites, medium-hydropower potential sites accounting for 9% of all hydropower potential sites, and large-hydropower potential sites accounting for 9% of all hydropower potential sites (Figures 13, 14).
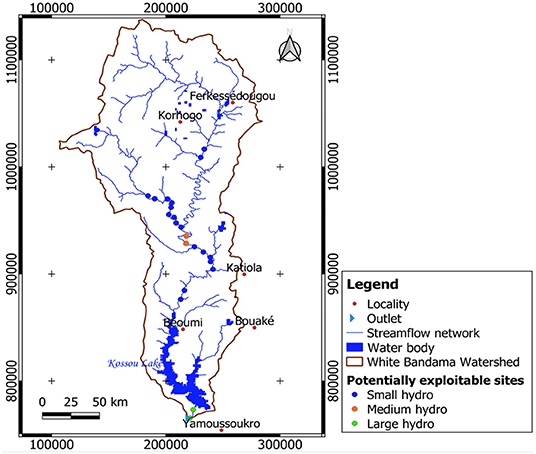
Figure 13. Classification of the exploitable hydropower potential sites by the production capacity.
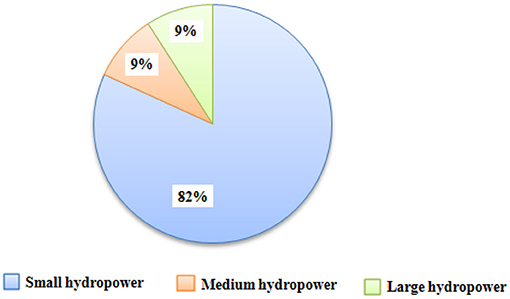
Figure 14. Share of the hydropower potential by the site type in the WBW.
Discussion
In this study, the applicability and performance of a distributed agro-hydrological model of the WBW, namely, QSWAT, were assessed. Agrohydrological models coupled to GIS tools are of great interest not only for the integration of different data sources into a single system but also for model output processing. This is also important within the context of multi-objective analysis. The results obtained via WBW modeling confirm that the model can simulate the hydrology of the WBW. The streamflow network automatically extracted from the DEM is similar to that reported in the literature (Lehner et al., 2008; Dallaire et al., 2019). This confirms the QSWAT performance and applicability in future hydro-morphological basin studies. However, the model underestimated the peak flows at the four hydrometric stations both over the calibration and validation period. This underestimation of peaks could be linked to the quality of the input data (Tan et al., 2021), to the parameterization, or a limit of the SWAT model (Koua, 2014).
Notably, the results are satisfactory with NS coefficient and R2 values >0.5. In our study, the comparison of the results between the observed and simulated streamflows demonstrates that there exists a good correlation between the observation and simulation values during both the calibration and validation periods. The NS and R2 values are acceptable according to Santhi et al. (2001) and Coffey et al. (2004). Additionally, the p-factor value approaches 1, and the r-factor value is <1.5. According to Abbaspour (2011, 2015), these values are considered acceptable to validate the SWAT model. Overall, the model is accurate.
The hydropower potential of the basin was assessed by coupling the above agro-hydrological model and geospatial tools. The equation considered to assess the potential is that developed by Maher and Smith (2001). This equation does not consider the overall system efficiency, which already assumes the installation of a turbine, transformer, generator, and/or pump. In contrast, this equation is based on the assessment of the gross theoretical potential of the hydrographic network. Depending on the restriction criteria defined, this study identified 22 potentially exploitable sites for future hydropower deployment. These sites were divided into small, medium- and large -hydropower potential sites. Small-hydropower potential sites dominated the basin with an estimated proportion of 82%. The total production capacity was estimated at ~538.56 MW. The hydropower potential assessment methodology was quite similar to that of Kusre et al. (2010). However, although noteworthy, this approach suffers limitations and requires other more in-depth socio-economic and technical analysis approaches. The restriction criteria for the identification of potentially exploitable sites included parameters that are only partially described in this work. Other important parameters should be considered (Korkovelos et al., 2018), such as economic feasibility, social acceptability, legal/geopolitical constraints, and water use conflicts. Overall, the results indicated that the WBW contains an important hydropower potential, the exploitation of which could provide electricity to various populations, especially those in remote areas.
The geospatial distribution of sites in GIS software comprises the basis in the process of establishing a hydroelectric information system with spatial references, which could be employed as a decision-making tool. The efficiency and performance of this tool depend on good-quality data and constant updating. Although the results of this study are interesting, they impose certain reserves. Any modeling study may show many uncertainties related to the quality of the model input data, observation data for model calibration/validation, and the model itself. Instead, these results provide a basis for further improvements. The hydropower potential values obtained in the WBW could present imperfections and/or inaccuracies due to the combination of several data of different spatial or temporal resolutions. However, they should be considered as indicators of the effective availability of hydropower in the basin. The identification of future sites for hydroelectricity by basin is important and would be an asset for decentralized hydroelectricity supply. These results could be served as an initial step for a practical site selection process at a watershed scale. Moreover, the methodology can be applied to other basins to estimate the hydropower potential. Hydropower deployment is an efficient solution to rural electrification and serves as an electrification option in today's electrification challenge.
Conclusion
The purpose of this study was to apply a hydrological model combined with GIS technology (QSWAT) to assess the hydropower potential and identify probable hydropower sites for future hydropower development.
The coupled hydrological QSWAT model enabled the extraction of physical, hydrological, and agro-pedological basin parameters: basin contour, sub-basins, hydrographic network, order of the rivers, level difference, HRUs, land use, and soil types.
Model calibration and validation at monthly time steps were carried out at four WBW stations. The obtained p-factor, r-factor, R2, and NS values were considered to evaluate the performance and robustness of the WBW SWAT model. The results demonstrated that there exists a good correlation between the observed and simulated monthly flows, with p-factor values approaching 1, an r-factor value <1.5, and R2 and NS values between 0.6 and 1. The calibrated and validated model was applied in flow simulation and evaluation of the hydropower potential of the WBW. Hydropower potential assessment identified 8 sub-basins containing 22 potentially exploitable sites, and the total production capacity was estimated at 538.56 MW. The total hydrographic network of hydroelectric production reached ~238.29 km, covering an area of 2,450.7 km2 in the WBW. Hydrological modeling enabled geolocation of potentially exploitable sites for future hydropower deployment. In addition, the results indicated that the basin was dominated by small-hydropower potential sites, accounting for 82% of all sites, followed by medium- and large-hydropower potential sites, each accounting for 9% of all sites. The methodology and obtained results could serve as a basis for the creation of a hydroelectric information system with spatial references, which could be employed as a decision-making tool in energy matters. This approach could be adopted to support electrification decentralization and thus guarantee energy security.
Considering this study, additional work to assess the hydropower potential should include, in the applied approach, an assessment of the impacts of climate change combined with several scenarios of land use at different climatic horizons. In addition, other aspects should be considered in future research to identify potentially exploitable hydropower generation sites, namely, economic feasibility, social acceptability, legal/geopolitical constraints, and water use conflicts.
Data Availability Statement
Publicly available datasets were analyzed in this study. This data can be found here: http://due.esrin.esa.int/page_globcover.php.
Author Contributions
CK and AD: conceptualization and writing—original draft. CK, KK, and AD: data curation and analysis, formal analysis, and methodology. CK and KK: validation. CK, KK, SO, BK, EA, JP, TC, RD, HC, and IS: writing—review and editing. All authors have read and agreed to the published version of the manuscript.
Funding
The research leading to this publication was co-funded by IRD (Institut de Recherche pour le Développement, France, Grant Number: UMR IGE Imputation 252RA5) and Agence Nationale de la Recherche (ANR Grant Number: 400914/00) to support SUSTAINDAM project implemented in the frame of the Belmont Forum collaborative actions on transdisciplinary research for pathways to sustainability.
Conflict of Interest
The authors declare that the research was conducted in the absence of any commercial or financial relationships that could be construed as a potential conflict of interest.
Publisher's Note
All claims expressed in this article are solely those of the authors and do not necessarily represent those of their affiliated organizations, or those of the publisher, the editors and the reviewers. Any product that may be evaluated in this article, or claim that may be made by its manufacturer, is not guaranteed or endorsed by the publisher.
Abbreviations
ARS, Agricultural Research Service; CIE, Ivorian Company of Electricity; CN, Curve Number method; DEM, Digital Elevation Model; ESA, European Space Agency; GHG, Greenhouse Gas; GIS, Geographic Information System; HRU, Hydrological Response Units; HWSD, Harmonized World Soil Database; IHA, International Hydropower Association; ISRIC, International Center for Soil Reference and Information; ISSS, International Soil Science Society; NCEP, National Centers for Environmental Prediction; NS, Nash–Sutcliffe; PANER, National Action Plan for Renewable Energies of Côte d'Ivoire; PET, Potential Evapotranspiration; PPU, Percentage Prediction Uncertainty; QGIS, Quantum Geographic Information System; SB, sub-basin; SCS, Soil Conservation Service; SRTM, Shuttle Radar Topography Mission; SUFI-2, Sequential Uncertainty Fitting version 2; SWAT, Soil and Water Assessment Tool; SWAT-CUP, SWAT-Calibration Uncertainty Program; USDA, United States Department of Agriculture; USGS, United States Geological Survey; WBR, White Bandama River; WBW, White Bandama Watershed.
References
Abbaspour, K., Vaghefi, S., and Srinivasan, R. (2018). A guideline for successful calibration and uncertainty analysis for soil and water assessment: a review of papers from the 2016 international SWAT conference. Water 10, 6. doi: 10.3390/w10010006
Abbaspour, K.C.. (2011). SWAT-CUP2: SWAT Calibration and Uncertainty Programs Manual Version 2. Duebendorf, Switzerland: Eawag. Swiss Federal Institute of Aquatic Science and Technology, Department of Systems Analysis. Integrated Assessment and Modeling (SIAM), 106p
Abbaspour, K. C., Rouholahnejad, E., Vaghefi, S., Srinivasan, R., Yang, H., and Kløve, B. (2015). A continental-scale hydrology and water quality model for Europe: calibration and uncertainty of a high-resolution large-scale SWAT model. J. Hydrol. 524, 733–752. doi: 10.1016/j.jhydrol.2015.03.027
Al-Juboori, A. M., and Guven, A. (2016). Hydropower plant site assessment by integrated hydrological modeling, gene expression programming and visual basic programming. Water Resources Manage. 30, 2517–2530. doi: 10.1007/s11269-016-1300-3
Allen, R. G., Pereira, L. S., Raes, D., and Smith, M. (1998). Crop Evapotranspiration: Guidelines for Computing Crop Water Requirements, FAO irrigation and Drainage Paper. Rome: Food and Agriculture Organization of the United Nations.
Allen, R. G., Walter, I. A., Elliot, R. L., Howell, T. A., Itenfisu, D., Jensen, M. E., et al. (2005). “The ASCE standardized reference evapotranspiration equation,” in American Society of Civil Engineers. In Microclimate: the Biological Environment (Idaho: John Wiley & Sons), 59p.
Anoh, K.A., Koua, T.J.J., Kouam,é, K.J., Jourda, J.P., and Laurent, F. (2017). Modelling water flow in a complex watershed in humid a tropical area using SWAT: a case study of Taabo watershed in Ivory Coast. Int. J. River Basin Manage. 16, 157–167. doi: 10.1080/15715124.2017.1387122
Ardoin-Bardin, S.. (2004). Variabilité hydroclimatique et impacts sur les ressources en eau de grands bassins hydrographiques en zone soudano-sahélienne (phdthesis). Montpellier: Université Montpellier II - Sciences et Techniques du Languedoc.
Arnold, J.G., Allen, P.M., and Bernhardt, G. (1993). A comprehensive surface-groundwater flow model. J. Hydrol. 142, 47–69. doi: 10.1016/0022-1694(93)90004-S
Arnold, J.G., Kiniry, J.R., Srinivasan, R., Williams, J.R., Haney, E.B., and Neitsch, S.L. (2011). SWAT Input/Output File Documentation, Version 2009. Texas Water Resources Institute Technical Report. Temple, Texas: Texas water Resources Institute.
Arnold, J.G., Moriasi, D.N., Gassman, P.W., Abbaspour, K.C., White, M.J., Srinivasan, R., Santhi, C., Harmel, R.D., Van Griensven, A., and Van Liew, M.W. others (2012). SWAT: model use, calibration, and validation. Trans. ASABE 55, 1491–1508. doi: 10.13031/2013.42256
Arnold, J.G., Srinivasan, R., Muttiah, R.S., and Williams, J.R. (1998). Large area hydrologic modeling and assessment part I: model development1. J. Am. Water Resources Assoc. 34, 73–89. doi: 10.1111/j.1752-1688.1998.tb05961.x
Belmonte, S., Núñez, V., Viramonte, J. G., and Franco, J. (2009). Potential renewable energy resources of the Lerma Valley, Salta, Argentina for its strategic territorial planning. Renewable Sustain. Energy Rev. 13, 1475–1484. doi: 10.1016/j.rser.2008.09.014
Berga, L.. (2016). The role of hydropower in climate change mitigation and adaptation: a review. Engineering 2, 313–318. doi: 10.1016/J.ENG.2016.03.004
Coffey, M.E., Workman, S.R., Taraba, J.L., and Fogle, A.W. (2004). Statistical procedures for evaluating daily and monthly hydrologic model predictions. Trans. ASAE 47, 59. doi: 10.13031/2013.15870
Coulibaly, T.J.H., Coulibaly, N., Kouadio, K.C.A., Deroin, J.P., Camara, M., and Savane, I. (2016). Development of assisted road navigation by the drainage network. Model. Earth Syst. Environ. 2, 37. doi: 10.1007/s40808-016-0090-1
Dallaire, C.O., Lehner, B., Sayre, R., and Thieme, M. (2019). A multidisciplinary framework to derive global river reach classifications at high spatial resolution. Environ. Res. Lett. 14, 024003. doi: 10.1088/1748-9326/aad8e9
Deshaies, M., and Kouadio, A. (2019). Les enjeux du développement des énergies renouvelables pour la production d'électricité en Côte d'Ivoire. Espace Géographique et Société Marocaine, Abidjan (Côte d'Ivoire), 26p.
Dile, Y., Srinivasan, R., and George, C. (2016). QGIS Interface for SWAT (QSWAT). Version 1.3. Step by Step Setup for the Robit Watershed, Lake Tana basin Ethiopia, Texas (USA). Available online at: https://swat.tamu.edu/media/115179/qswat-manual_v13.pdf (accessed December 16, 2021).
Doso, O., and Gao, S. (2020). An overview of small hydro power development in India. AIMS Energy 8, 896–917. doi: 10.3934/energy.2020.5.896
Dudhani, S., Sinha, A. K., and Inamdar, S. S. (2006). Assessment of small hydropower potential using remote sensing data for sustainable development in India. Energy Policy 34, 3195–3205. doi: 10.1016/j.enpol.2005.06.011
FAO (2002). Profil de pauvreté des communautés riveraines du lac de Kossou en Côte d'Ivoire. Programme pour des moyens d'existence durables dans la pêche GCP/INT/735/UK. Unité de Coordination Nationale de la Côte d'Ivoire. Population (French Edition) 5:764. Available online at: URL https://www.fao.org/fishery/docs/DOCUMENT/sflp/SFLP_publications/French/rpt17.pdf (accessed December 16, 2021).
FAO ISRIC, and ISSS. (1999). Base de reference mondiale pour les ressources en sols, (update from 1999 to 2012). Rome.
Gassman, P. W., Reyes, M. R., Green, C. H., and Arnold, J. G. (2007). The soil and water assessment tool: historical development, applications, and future research directions. Trans. ASABE 50, 1211–1250. doi: 10.13031/2013.23637
Goula, B. T. A., Konan, B., Brou, Y. T., Issiaka, S., Fadika, V., and Srohourou, B. (2007). Estimation des pluies exceptionnelles journalières en zone tropicale: cas de la Côte d'Ivoire par comparaison des lois lognormale et de Gumbel. Hydrol. Sci. J. 52, 49–67. doi: 10.1623/hysj.52.1.49
International Energy Agency (2019). Renewables 2019. Market analysis and forecast from 2019 to 2024. Fuel report-October. Available online at: https://iea.blob.core.windows.net/assets/a846e5cf-ca7d-4a1f-a81b-ba1499f2cc07/Renewables_2019.pdf (accessed January 17, 2022).
International Hydropower Association (2018). Hydropower Status Report. Available online at: https://www.hydropower.org/publications/2018-hydropower-status-report?utm_source=eshot&utm_medium=email&utm_campaign=Pressrelease(allpresscontacts):2018HydropowerStatusReportshowsrecordriseincleanelectricity (accessed January 5, 2020).
Jenson, S.K., and Domingue, J.O. (1988). Extracting topographic structure from digital elevation data for geographic information system analysis. Photogrammetric engineering and remote. Sensing 54, 1593–1600.
Kayastha, N., Singh, U., and Dulal, K.P. (2018). A GIS Approach for Rapid Identification of Run-of-River (RoR) Hydropower Potential Site in Watershed: A case study of Bhote Koshi Watershed. Nepal.
Kelly-Richards, S., Silber-Coats, N., Crootof, A., Tecklin, D., and Bauer, C. (2017). Governing the transition to renewable energy: A review of impacts and policy issues in the small hydropower boom. Energy Policy 101, 251–264. doi: 10.1016/j.enpol.2016.11.035
Koffi, Y. B., Ayral, P. A., Kouassi, A. M., and Johannet, A. (2011). Modélisation des débits des rivières en région tropicale humide: application des réseaux de neurones et du modèle GR2M au Bandama blanc (Côte d'Ivoire). Rev. Ivoir. Sci. Technol 17, 151–171. Available online at: https://revist.net/REVIST_17&18/REVIST_17_12.pdf
Korkovelos, A., Mentis, D., Siyal, S., Arderne, C., Rogner, H., Bazilian, M., et al. (2018). A geospatial assessment of small-scale hydropower potential in Sub-Saharan Africa. Energies 11, 3100. doi: 10.3390/en11113100
Koua, T., Anoh, K., Eblin, S., Kouassi, K., Kouamé, K., and Jourda, J. (2019). Rainfall and runoff study in climate change context in the Buyo lake watershed (Southwest Côte d'Ivoire). LARHYSS J. 30, 229–258. Available online at: http://larhyss.net/ojs/index.php/larhyss/article/view/680
Koua, T. J.-J.. (2014). Apport de la modélisation hydrologique et des Systèmes d'Information Géographique (SIG) dans l'étude du transfert des polluants et des impacts climatiques sur les ressources en eau : cas du bassin versant du lac de Buyo (Sud-ouest de la Côte d'Ivoire). Thèse de doctorat, Université Félix Houphouët Boigny, Abidjan (Côte d'Ivoire), 166. Available online at: https://inveniov1.uvci.edu.ci/record/7905/
Kouadio, K. C. A., Amoussou, E., Coulibaly, T. J. H., Diedhiou, A., Coulibaly, H. S. J. -P., Didi, R., et al. (2020). Analysis of hydrological dynamics and hydropower generation in a West African anthropized watershed in a context of climate change. Model. Earth Syst. Environ. 6, 2197–2214. doi: 10.1007/s40808-020-00836-4
Kouame, Y. M., Obahoundje, S., Diedhiou, A., François, B., Amoussou, E., Anquetin, S., et al. (2019). Climate, land use and land cover changes in the Bandama Basin (Côte D'Ivoire, West Africa) and incidences on hydropower production of the Kossou Dam. Land 8, 103. doi: 10.3390/land8070103
Kuriqi, A., Pinheiro, A. N., Sordo-Ward, A., Bejarano, M. D., and Garrote, L. (2021). Ecological impacts of run-of-river hydropower plants—Current status and future prospects on the brink of energy transition. Renew. Sustain. Energy Rev. 142, 110833. doi: 10.1016/j.rser.2021.110833
Kusre, B.C., Baruah, D.C., Bordoloi, P.K., and Patra, S.C. (2010). Assessment of hydropower potential using GIS and hydrological modeling technique in Kopili River basin in Assam (India). Appl. Energy 87, 298–309. doi: 10.1016/j.apenergy.2009.07.019
Lehner, B., Verdin, K., and Jarvis, A. (2008). New global hydrography derived from spaceborne elevation data. Eos Trans. Am. Geophys. Union 89, 93–94. doi: 10.1029/2008EO100001
Maher, P., and Smith, N. (2001). Pico hydro for village power: A practical manual for schemes up to 5 kW in hilly areas. Ranchi: Intermediate Technology Publications.
National Action Plan for Renewable Energies of Côte d'Ivoire (2016). Available online at: https://www.se4all-africa.org/fileadmin/uploads/se4all/Documents/Country_PANER/CO%CC%82TE_D%E2%80%99IVOIRE_Plan_d_Actions_National_pour_les_Energies_Renouvelables.pdf (accessed December 16, 2021).
Neitsch, S. L., Arnold, J. G., Kiniry, J. R., and Williams, J. R. (2011). Soil and Water Assessment Tool Theoretical Documentation Version 2009. Texas: Scientific Research Publishing (Scirp).
Neitsch, S. L., Arnold, J. G., Kiniry, J. R., Williams, J. R., and King, K. W. (2005). Soil and water assessment tool theoretical documentation version 2005. Temple, TX: Grassland. Soil and Water Research Laboratory, Blackland Research Center.
Pandey, A., Lalrempuia, D., and Jain, S. K. (2015). Assessment of hydropower potential using spatial technology and SWAT modelling in the Mat River, southern Mizoram, India. Hydrol. Sci. J. 60, 1651–1665. doi: 10.1080/02626667.2014.943669
Rojanamon, P., Chaisomphob, T., and Bureekul, T. (2009). Application of geographical information system to site selection of small run-of-river hydropower project by considering engineering/economic/environmental criteria and social impact. Renew. Sustain. Energy Rev. 13, 2336–2348. doi: 10.1016/j.rser.2009.07.003
Sakellariou, N., Paco, D., GIZ, L.M.-T., GIZ, M. Y. S., Weisman, N., Owusu-Nyantekyi, N. B., et al. (2018). Rapport de Progrès Régionaux sur les Énergies Renouvelables, l'Efficacité Énergétique et l'Accès à l'Énergie dans la région de la CEDEAO Année de suivi: 2016.
Santhi, C., Arnold, J. G., Williams, J. R., Dugas, W. A., Srinivasan, R., and Hauck, L. M. (2001). Validation of the SWAT Model on a large Rwer Basin with point and nonpoint sources. J. Am. Water Resources Assoc. 37, 1169–1188. doi: 10.1111/j.1752-1688.2001.tb03630.x
Schuol, J., and Abbaspour, K.C. (2006). Calibration and uncertainty issues of a hydrological model (SWAT) applied to West Africa. Adv. Geosci. 9, 137–143. doi: 10.5194/adgeo-9-137-2006
Soro, G. E., Yao, A. B., Kouame, Y.M., and Bi, T. A. G. (2017). Climate change and its impacts on water resources in the Bandama basin, Côte D'ivoire. Hydrology 4, 18. doi: 10.3390/hydrology4010018
Strahler, A. N.. (1957). Quantitative analysis of watershed geomorphology. Eos Trans. Am. Geophys. Union 38, 913–920. doi: 10.1029/TR038i006p00913
Tan, M. L., Gassman, P. W., Liang, J., and Haywood, J. M. (2021). A review of alternative climate products for SWAT modelling: sources, assessment and future directions. Sci. Total Environ. 795:148915. doi: 10.1016/j.scitotenv.2021.148915
Tarife, R. P., Tahud, A. P., Gulben, E. J. G., Macalisang, H. A. R. C. P., and Ignacio, M. T. T. (2017). Application of geographic information system (GIS) in hydropower resource assessment: a case study in Misamis Occidental, Philippines. Int. J. Environ. Sci. Dev. 8, 507. doi: 10.18178/ijesd.2017.8.7.1005
Williams, J. R.. (1969). Flood routing with variable travel time or variable storage coefficients. Trans. ASAE 12, 100–0103. doi: 10.13031/2013.38772
Winchell, M., Srinivasan, R., Di Luzio, M., and Arnold, J. (2013). ArcSWAT interface for SWAT2012: User's Guide. Texas: Blackland Research and Extension Center, Texas Agrilife Research. Grassland. Soil and Water Research Laboratory, USDA Agricultural Research Service, 3p.
Yi, C. S., Lee, J. H., and Shim, M. P. (2010). Site location analysis for small hydropower using geo-spatial information system. Renew. Energy 35, 852–861. doi: 10.1016/j.renene.2009.08.003
Keywords: hydrological modeling, hydropower potential, GIS, SWAT, White Bandama Watershed, West Africa, hydropower
Citation: Kouadio CA, Kouassi KL, Diedhiou A, Obahoundje S, Amoussou E, Kamagate B, Paturel J-e, Coulibaly TJH, Coulibaly HSJP, Didi RS and Savane I (2022) Assessing the Hydropower Potential Using Hydrological Models and Geospatial Tools in the White Bandama Watershed (Côte d'Ivoire, West Africa). Front. Water 4:844934. doi: 10.3389/frwa.2022.844934
Received: 29 December 2021; Accepted: 14 February 2022;
Published: 15 March 2022.
Edited by:
Yizi Shang, China Institute of Water Resources and Hydropower Research, ChinaReviewed by:
Xiang Li, China Institute of Water Resources and Hydropower Research, ChinaAlban Kuriqi, Universidade de Lisboa, Portugal
Ziyao Xu, Ministry of Water Resources of China, China
Copyright © 2022 Kouadio, Kouassi, Diedhiou, Obahoundje, Amoussou, Kamagate, Paturel, Coulibaly, Coulibaly, Didi and Savane. This is an open-access article distributed under the terms of the Creative Commons Attribution License (CC BY). The use, distribution or reproduction in other forums is permitted, provided the original author(s) and the copyright owner(s) are credited and that the original publication in this journal is cited, in accordance with accepted academic practice. No use, distribution or reproduction is permitted which does not comply with these terms.
*Correspondence: Arona Diedhiou, arona.diedhiou@ird.fr