
Abstract
This letter assesses the quality of temperature and rainfall daily retrievals of the European Climate Assessment and Dataset (ECA&D) with respect to measurements collected locally in various parts of the Euro-Mediterranean region in the framework of the Hydrological Cycle in the Mediterranean Experiment (HyMeX), endorsed by the Global Energy and Water Cycle Experiment (GEWEX) of the World Climate Research Program (WCRP). The ECA&D, among other gridded datasets, is very often used as a reference for model calibration and evaluation. This is for instance the case in the context of the WCRP Coordinated Regional Downscaling Experiment (CORDEX) and its Mediterranean declination MED-CORDEX. This letter quantifies ECA&D dataset uncertainties associated with temperature and precipitation intra-seasonal variability, seasonal distribution and extremes. Our motivation is to help the interpretation of the results when validating or calibrating downscaling models by the ECA&D dataset in the context of regional climate research in the Euro-Mediterranean region.
Export citation and abstract BibTeX RIS
1. Introduction
Climate modeling has been developed and used for both climate understanding and prediction of future climate trends. Great progress has been achieved using global climate models (GCMs) to reconstruct the global climate with a horizontal resolution of few hundred kilometers, allowing the explicit simulation of global to synoptic scale atmospheric circulation. With increasing computer resources and performance, the simulation of the climate system at much finer resolution (typically around a few tens of kilometers) has become a realistic objective and a major issue to investigate the contribution of mesoscale meteorological systems (breezes, orographic wind, cyclones, etc) to the regional climate.
Hence, climate downscaling techniques have been developed based on two distinct approaches. A first technique is dynamical downscaling (DD), based on the use of regional climate models (RCMs) which solve the conservation equations on a highly resolved mesh grid (see, e.g., Maraun et al 2010 for a review). RCM initial and boundary conditions are provided by GCM outputs. Nudging can also be applied for long-term RCM simulations to maintain consistency between the RCM large-scale dynamics and that of the driving GCM (see, e.g., Salameh et al 2010, Omrani et al 2012a, 2012b). A second technique is statistical downscaling (SD), based on the determination of a statistical relationship between local measurements and GCM outputs over a calibration period. It is used for local projection of the GCM outputs (see Wilby et al 2002 for a review).
The use of gridded observations has become particularly popular for the calibration and evaluation of downscaling techniques (see, e.g., Quadrelli et al 2001, Jacob et al 2007, Schmidli et al 2007, Hertig and Jacobeit 2008). In particular for SD, gridded datasets allow us to overpass one major drawback. Indeed, SD generally suffers from a lack of spatial representativeness due to the need of local measurements for calibration (see, e.g., Salameh et al 2009, Lavaysse et al 2011, Vrac et al 2011). Gridded datasets allow production by the SD technique of local climate information on a grid similar to the numerical grid of DD, favoring the comparison between the two downscaling techniques. However, these gridded datasets are statistical extrapolations of surface observations and are thus the products of more or less sophisticated assimilating or interpolating systems (e.g. CRU dataset for monthly products at global scale—Mitchell and Jones 2005; ECA&D for daily outputs over the Euro-Mediterranean area—Haylock et al 2008; SAFRAN for three-hourly outputs over France—Quintana Seguí et al 2010). As a result, gridded observations are not 'local measurements' but a product which can be seen as the best fit to the observations. Thus they should be used with caution, since significant uncertainties might cause misinterpreted results (Santos et al 2007, Hofstra et al 2009).
In this letter, we give special attention to the Mediterranean region as one of the two 'hot spots' of climate change (Giorgi 2006). The Mediterranean climate presents a very complex seasonal cycle with extreme events governed by cyclones, severe storms and heat-waves. These regional atmospheric processes are studied within the Hydrological Cycle in the Mediterranean Experiment (HyMeX), aiming at a better understanding of the regional water cycle and its variability, trend and extremes in a changing climate (Drobinski et al 2010, 2009b, 2009a, 2011). In addition, the Coordinated Regional Climate Downscaling Experiment (CORDEX; Giorgi et al 2009) and its Mediterranean declination (MED-CORDEX; Ruti et al 2012) of the World Climate Research Program (WCRP) is a program aiming at providing a quality controlled dataset of regional climate downscaling based information for both recent past and 21st century projections. These downscaled data are produced at horizontal resolutions of 50 km or less, and their evaluation relies very much on gridded datasets.
The European Climate Assessment and Dataset (ECA&D) provides daily data of temperature and rainfall since 1950 at fine resolution (∼25 km), covering the Euro-Mediterranean area. Hence, ECA&D is very adequate for the evaluation and calibration of both DD and SD for the needs of climate research in the frame of HyMeX and MED-CORDEX. In this study we aim at quantifying the uncertainties of the daily temperature and rainfall gridded dataset of ECA&D. Our motivation is to help the interpretation of the results of DD and SD models when calibrated or compared to this gridded database. For this reason, ECA&D is compared to local measurements, collected at the HyMeX stations labeled by the Global Energy and Water Cycle Experiment (GEWEX) of WCRP8.
After this introduction, the ECA&D daily temperature and rainfall gridded dataset and the HyMeX local observations are described in section 2. Section 3 quantifies and discusses the uncertainty of the ECA&D gridded dataset regarding specific local climates of different regions of the Mediterranean area. Finally, section 4 summarizes the discussion and gives perspectives for future work.
2. Data and methodology
The ECA&D dataset (fourth version) contains 26 061 series of observations for 12 elements at 4823 meteorological stations throughout Europe and the Mediterranean. It covers Europe, North Africa and the Middle East with a horizontal resolution of 0.25° × 0.25° (Klein Tank et al 2002, Haylock et al 2008). Daily 2 m temperature and total rainfall are available from 1950. They have been widely used for regional climate studies (e.g. Haylock and Goodess 2004, Santos et al 2007) and climate model evaluation (e.g. Frei et al 2003, Räisänen et al 2004, Kjellström et al 2010).
The meteorological stations used to evaluate the ECA&D dataset are the GEWEX labeled research stations of the HyMeX network. Only three HyMeX stations out of the 24 used in this study are contained in the ECA&D. The stations collect hourly measurements; 12 stations are located in the coastal region of Southern France, ten in Northern Italy in the Alps and two in Israel. To better assess the ECA&D dataset we separate the stations into four categories: (i) semi-arid climate stations, (ii) mid-latitude coastal stations, (iii) mid-latitude low elevation stations and (iv) mid-latitude high elevation stations. Stations are characterized as low (high) elevation stations if they are located at altitudes below (exceeding) 1000 m. Table 1 provides information on the altitude, the measurement period and the station characteristics. Figure 1 displays the locations of the HyMeX stations, the stations contained in the ECA&D and the ECA&D dataset grid points. The terrain elevation is also displayed as key information to better understand the local climate specificities and their possible impact on the analysis of the data. In Southern France most HyMeX stations are coastal and located in plains at low altitude (below 500 m elevation) and three of them (2, 10, 11) have any nearby stations contained in ECA&D. The Italian stations are located in the Alps at altitudes which may exceed 1000 m. In the Alps, the ECA&D assimilated stations are fairly densely distributed, but the spatial coverage is significantly less dense in the area where the HyMeX stations are located. Only stations 4 and 6 are contained in the ECA&D. Finally, the HyMeX Israeli stations are located at low altitude in a semi-arid environment, where only station IS-1 is contained in the ECA&D dataset.
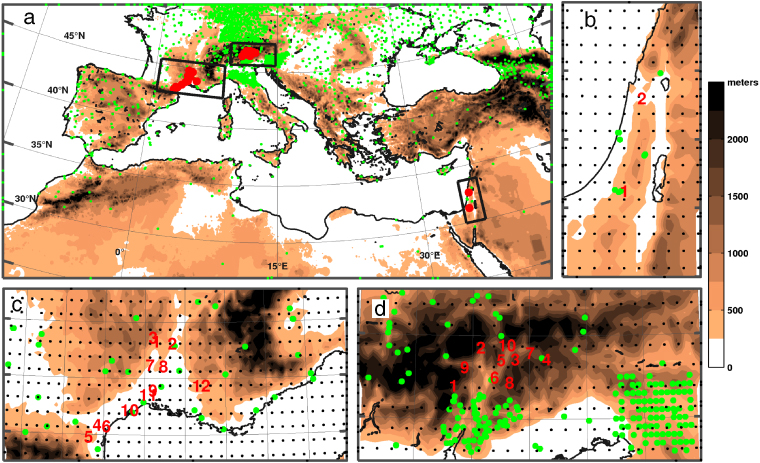
Figure 1. Maps of the Mediterranean domain and the sub-regions investigated in this study. The locations of the HyMeX stations are indicated with red dots (the numbers are used to identify the stations; see table 1). The locations of the surface weather stations for which data are assimilated in ECA&D reanalysis are indicated with green dots. Finally, the black dots show the locations of the grid points of the ECA&D dataset. (a) The Mediterranean domain used for the CORDEX climate simulations; (b) a zoom over the Israeli HyMeX stations; (c) a zoom over the French HyMeX stations; (d) a zoom over the Italian HyMeX stations.
Download figure:
Standard imageTable 1. HyMeX station names (left column), period of observations (middle column) and altitude of the HyMeX station (right column). The acronym SA stands for semi-arid, CO for coastal, LE for low elevation and HE for high elevation. Asterisks indicate the stations contained in the ECA&D dataset.
| Station | Observation period | Altitude (m) |
|---|---|---|
| IS-1/SA* | 2003–10 | 280 |
| IS-2/CO | 2003–10 | 265 |
| FR-1/CO | 2004–10 | 480 |
| FR-2/CO | 2004–09 | 650 |
| FR-4/CO | 2003–09 | 60 |
| FR-5/CO | 2005–09 | 538 |
| FR-6/CO | 2003–09 | 112 |
| FR-7/CO | 2003–09 | 499 |
| FR-8/CO | 2003–09 | 318 |
| FR-9/CO | 2005–09 | 41 |
| FR-10/CO | 2003–09 | 30 |
| FR-11/CO | 2005–09 | 85 |
| FR-12/CO | 2003–09 | 142 |
| IT-3/LE | 2004–10 | 560 |
| IT-6/LE* | 2004–10 | 254 |
| IT-7/LE | 2004–10 | 821 |
| IT-9/LE | 2004–10 | 718 |
| IT-10/LE | 2004–10 | 948 |
| FR-3/LE | 2004–09 | 1240 |
| IT-1/HE | 2005–09 | 2669 |
| IT-2/HE | 2004–09 | 1716 |
| IT-4/HE* | 2004–10 | 1250 |
| IT-5/HE | 2004–10 | 1450 |
| IT-8/HE | 2004–10 | 1700 |
The assessment of the ECA&D dataset is performed on daily 2 m temperature and accumulated daily rainfall. Both variables are calculated as in the ECA&D dataset: mean temperature is the average of the maximum temperature measured between 0600 UTC and 1800 UTC and the minimum temperature measured between 1800 UTC of the day before and 0600 UTC, while the total daily rainfall is the sum of rainfall from 0600 UTC of the current date to 0600 UTC of the day after. For the periods covered by each station (table 1), the ECA&D values compared to the measurements correspond to the grid points which are closest to each of the HyMeX stations. A different approach was also tested by interpolating bilinearly the ECA&D dataset values to the stations' locations. Similar results were obtained by the two approaches. The cumulative distribution functions (CDFs) of temperature and rainfall are then produced for winter (December to February) and summer (June to August) for HyMeX station measurements and ECA&D interpolated values. The comparison is performed for the 50th (median value) and the fifth and 95th quantiles (extreme low and high values) of the CDFs. For precipitation only the rainy days are considered, defined as the days with accumulated rainfall exceeding 0.5 mm.
The significance of the results was tested through a paired Student t-test of the null hypothesis that the difference of the ECA&D dataset minus the measurements is a random sample from a normal distribution with zero mean and unknown variance, against the alternative that the mean is not zero. A confidence level of 95% of rejection of this null hypothesis has been applied. For temperature the null hypothesis is rejected for all stations and for both seasons. However, correlation between consecutive temperature measurements can be high and invalidate the application of a Student t-test. Indeed, correlation drops below the significant level (around 20% on average) after 3 days. The Student t-test has thus been applied on subsets of the whole temperature dataset, keeping only the measurements every 3, 4, 5 and up to 10 days, without affecting the Student t-test. The t-test is thus passed with high robustness at all HyMeX stations. On the other hand, for rainfall, the null hypothesis is not rejected for all stations. Non-rejection reflects a rather good performance of the ECA&D dataset, showing that the ECA&D analyzed values do not differ significantly, under the null hypothesis, from the measurements. Regarding rainfall, time series display high day-to-day variability and so only relatively large differences can be found significant (Morin 2011).
3. Results
Figures 2 and 3 ((a) and (b)) display, as boxplots, the CDFs of the daily 2 m temperature and rainfall, respectively, computed from the HyMeX stations and the ECA&D time series. In a similar way, figures 2 and 3 ((c) and (d)) show the CDFs of the bias between the ECA&D values and the HyMeX measurements for temperature and rainfall, respectively. For rainfall, the ECA&D dataset and the HyMeX measurements do not have the same rainy days so a negative bias can be due to rainfall underestimation or to the absence of rain in ECA&D. In order to reduce interpretation problems that may arise from this sampling effect, the CDF of the rainfall bias was computed only for the days when rainfall was present in both ECA&D and at the HyMeX stations. The number of rainy days in ECA&D and in HyMeX observations is indicated over the boxplots in panels (a) and (b) of figure 3, and the number of common rainy days is indicated over the boxplots in panels (c) and (d) of figure 3.
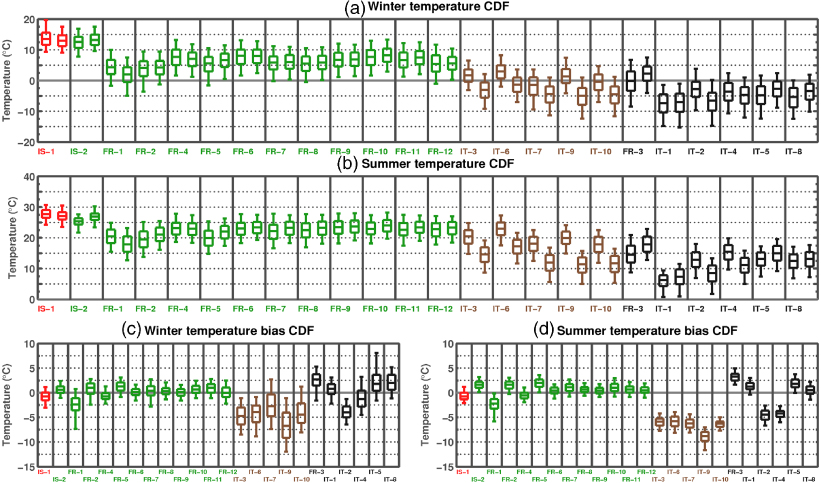
Figure 2. Boxplots showing the CDFs of the near surface temperature ((a) and (b)) and the CDF of the temperature difference between the ECA&D dataset and the measurements at the HyMeX stations. The boxplots in red correspond to the stations located in a semi-arid environment. The boxplots in green correspond to the coastal stations. The boxplots in brown and in black correspond to the stations located at low and high elevation, respectively (below/above 1000 m height; see table 1). The lower and upper limits of the boxes show the temperature values of the 25th and the 75th quantiles. The horizontal line within the boxes shows the median temperature (50th quantile); the ends of the vertical lines extending below and above the boxes indicate the fifth and the 95th temperature quantiles, respectively. (a) Boxplots of the ECA&D dataset and HyMeX surface stations for winter (for each station the left hand boxplot corresponds to the HyMeX station data and the right hand boxplot to the ECA&D data). (b) Similar to (a) for summer. (c) Boxplots of the temperature bias for winter (ECA&D temperature minus HyMeX station observation). (d) Similar to (c) for summer.
Download figure:
Standard image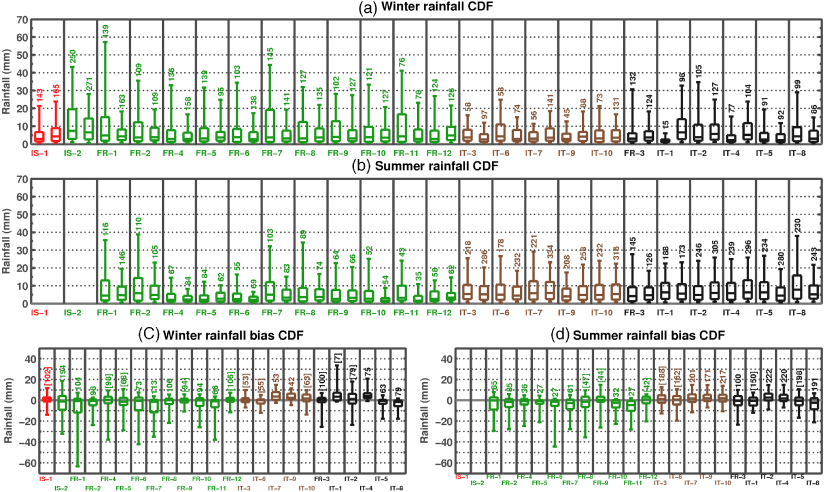
Figure 3. The same as figure 2 for rainfall. The number of rainy days used for computing the CDFs is indicated above the boxplots. If the number of rainy days is in brackets, the null hypothesis of the Student t-test is not rejected.
Download figure:
Standard image3.1. Stations in semi-arid environment
The first Israeli station (IS-1) is the only station available in a semi-arid environment. The ECA&D dataset reproduces accurately the winter temperature median and extremes with less than 1 °C difference (figure 2(a)). In summer the results are similarly good (figure 2(b)). The performance of ECA&D for station IS-1 should not come as a surprise since this station is assimilated. Figures 2(c) and (d) show the CDFs of the winter and summer temperature biases (ECA&D values minus HyMeX observations). Station IS-1 displays a systematic negative bias. This bias is on average about 1 °C but can reach up to 2.5 °C.
Regarding winter rainfall (figure 3(a)), the ECA&D CDF for IS-1 seems to be very close to the HyMeX observations. Accordingly, the rainfall bias for the same station displays a very small interquartile range, centered about 0 (figure 3(c)). As a consequence, the ECA&D dataset captures the seasonal variability of rainfall and reproduces accurately the rainfall amount. Even though ECA&D seems to perform fairly well, we might be surprised that there are 'only' 60–70% common rainy days with the HyMeX observations. Indeed, there are 102 common rainy days, out of 165 events in ECA&D and 143 in the observations.
3.2. Coastal stations
At the Israeli station IS-2, the ECA&D dataset temperature seems to be in fair agreement with the HyMeX observations only in winter, while in summer it overestimates the median by approximately 2.5 °C with a systematic positive bias. At the French coastal HyMeX stations, the winter temperature ranges from 0 to 10 °C with the median value at about 5 °C (figure 2(a)). In summer, the temperature CDF is similar, with however a shift of approximately + 15 °C (figure 2b). The ECA&D performs fairly well for all stations, except for FR-1, FR-2 and FR-5. Figures 2(c) and (d) display the CDFs of the temperature bias, where results are very similar in winter and summer. Stations FR-4, FR-6, FR-8 and FR-9 display an interquartile range lower than 1 °C, which is centered around 0 °C in winter, and slightly biased in summer (of the order of 0.5 °C). The ECA&D temperatures at the other stations generally display a significant positive bias (>1 °C for the median bias); however, the interquartile range of temperature bias is always smaller than 2 °C, suggesting small temperature variability in the ECA&D dataset, except for station FR-1. Station FR-1 is by far the location where ECA&D data compare worst with the HyMeX observations. The bias between the ECA&D temperature and the measured temperature is in 50% of the cases lower than − 2.5 °C and negative most of the time (95% of the cases in winter and 100% in summer). The absence of assimilated data immediately downstream of the Massif Central can explain part of the strong departure of the ECA&D data from the observations. Indeed, this region is very peculiar in the presence of northerly wind, which produces strong, dry and cool orographic channeled flow such as the tramontane and mistral. In these situations, which occur on average 10 days per month, station FR-1 is in the wake of the Massif Central, which creates a sheltered zone preventing the cold air from reaching the area (see, e.g., Drobinski et al 2005).
Regarding the CDFs of the ECA&D rainfall at all stations, there is an overall excellent agreement with the local measurements for 25th and 50th quantiles, whatever the season (except in summer for IS-2, where no rainfall is observed by either HyMeX or ECA&D). Regarding the larger rainfall amount (75th and 95th quantiles), they are always underestimated by the ECA&D dataset in winter (except for station FR-12 for the 75th quantile) and in slightly better agreement with the observations in summer. As for temperature, station FR-1 shows by far the worst agreement with the local measurements. In particular, in winter a 10 mm bias is found for the 75th rainfall quantile and a 40 mm bias for the 95th rainfall quantile. Figures 3(c) and (d) show that the 50th quantile of the rainfall bias is almost zero for all stations, while the interquartile range is lower than 5 mm in winter for stations FR-2, FR-4, FR-5, FR-8, FR-9 and FR-12 and in summer for stations FR-4, FR-5, FR-6, FR-9 and FR-12. For all other stations it remains within a reasonable range (below 10 mm). It is noteworthy that the winter bias for IS-2 is similar in structure to the semi-arid station IS-1, but nevertheless the bias has a wider range, from − 25 to 20 mm.
3.3. Low elevation stations
The stations of low altitude, i.e. below 1000 m, are all located in Italy (table 1). Figures 2(a) and (b) show that whatever the season the temperature from the ECA&D dataset is underestimated with respect to the HyMeX observations at all stations. In winter, the minimum shift is 2 °C at station IT-7 and the maximum is 8 °C at station IT-9, with an average of 5 °C. In summer, the temperature underestimation in the ECA&D dataset is even larger, with an average shift of 6 °C. The CDFs of the temperature bias (figures 2(c) and (d)) show evidence of the visible bias in figures 2(a) and (b). However, in contrast to the temperature CDFs, the CDFs of the temperature bias totally differ in summer and in winter. In summer, the interquartile range is very small (about 2 °C), and even accounting for the cold and hot extremes the distribution remains very narrow (figure 2(d)). This suggests a very good match between the temperature time series of the ECA&D dataset and that measured at the HyMeX weather stations. Conversely, in winter, the boxplots of the temperature bias are very large. The interquartile range is about 5 °C and the difference between the 95th and fifth quantiles is equal to 8 °C for stations IT-3 and IT-6 and equal to 10 °C for stations IT-7, IT-9 and IT-10. Despite the good similarity of the temperature distribution in winter (figure 2(a)), the day-to-day comparison between the ECA&D and measured temperatures is not as good as in summer (figures 2(c) and (d)).
Regarding rainfall, the ECA&D product is also of better quality in summer than in winter, with a perfect agreement of the ECA&D and observed CDFs up to the 75th rainfall quantile (figure 3(b)). The 95th rainfall quantile is underestimated by about 5 mm at stations IT-3, IT-6 and IT-7 and overestimated by about 5 mm at station IT-9. At station IT-10, the ECA&D and observed CDFs are nearly the same. Generally in this region, the stronger and more frequent precipitations occur in summer, and hence it is in this season that the CDFs of the ECA&D rainfall and the HyMeX station rainfall differ more significantly. In contrast to the temperature, the boxplots of the rainfall bias are slightly larger in summer than in winter, but whatever the season the interquartile range never exceeds 8 mm, suggesting a fairly good match between the rainfall time series of the ECA&D dataset and that measured at the HyMeX weather stations.
Even at relatively low altitude, the proximity of the Alps induces a complex environment in which rainfall is very spatially variable in terms of occurrence and intensity. The station location is crucial in this region, where topography is very complex and forces precipitation (Frei and Schär 1998). It is by the assimilation of a dense observation network that one may obtain accurate results; however, figure 1 shows a rather scarce network. Table 1 shows that the data of station IT-6 are assimilated in this area. However, the comparison between the closest ECA&D grid and the station location produces rather disappointing results, as seen in figures 3(a) and (b). This was not the case for the semi-arid station IS-1, where the regional topography is smoother. The insufficient number of assimilated weather stations in such a complex area induces at all stations an overestimation of the number of rainy days, which generally correspond to a small rainfall amount. For instance, at station IT-7 there is an excess of 113 rainy days (334 days instead of 221) in the ECA&D dataset, which corresponds to an overestimation of the lower quantiles (fifth and 25th quantiles) but does not affect the median and the 75th quantile. In contrast, there is an underestimation of the rainfall extremes, probably due to a too strong smoothing effect of the assimilation or interpolation of a too sparse network.
3.4. High elevation stations
For the Italian stations in the Alps (IT-1, IT-2, IT-4, IT-5 and IT-8), temperatures are clearly lower with respect to the stations at low elevation. Hence, winter and summer median temperatures are approximately − 5 °C and 10 °C, respectively. The CDFs of the temperature from the ECA&D dataset and the HyMeX observations are in better agreement at high than at low elevation. This is even more evident during summer. For instance, at stations IT-1, IT-5 and IT-8, the 50th quantile of the summer ECA&D temperature overestimates the 50th quantile of HyMeX observations by at most 2.5 °C. This must be compared to the Italian low elevation stations, where ECA&D underestimation reaches at least 5 °C. Regarding the interquartile range, the shapes of the boxplots are very similar to those of the low elevation stations, while conversely they are much closer to the 0 °C temperature bias (figures 2(c) and (d)). Accordingly, for both seasons the FR-3 station displays similar CDF with respect to the other French coastal stations but with a median value of about 0 °C in winter and 15 °C in summer, due to the higher elevation (figures 2(a) and (b)).
Regarding rainfall, the CDFs of ECA&D and HyMeX data behave very similarly to those at the Italian low elevation stations. In general, the CDFs of ECA&D and HyMeX rainfall are very similar in summer (figure 3(b)), whereas they differ significantly during winter (figure 3(a)). Special attention must be given to station FR-3, which is very close to station FR-1, identified as a coastal station (table 1). ECA&D dataset represents FR-1 and FR-3 rainfall with approximately the same CDFs for both seasons. However, the measurements display very different rainfall CDFs, notably for the 75th quantile and extremes (95th quantiles). This is due to the fact that the two stations are very close and associated with the same ECA&D grid points, which are not influenced by any nearby assimilated station as shown in figure 1.
4. Conclusion
The ECA&D data in complex environments such as coastal areas and mountainous regions have to be addressed with much care. For instance, in Northern Italy, temperature and rainfall biases of ECA&D can take significantly large values and day-to-day comparison of temperature and rainfall can display large departures. In particular, for rainfall, it has been shown that the ECA&D and the HyMeX observations do not have the same rainy days and the amplitude of extreme rainfall is generally significantly smaller than observed at HyMeX stations. However, such differences should be expected between the very local HyMeX observations and the gridded dataset, which are different datasets in nature. One cannot expect extreme rainfall to be equally represented by a very local station and a gridded 25 km × 25 km average, even if data assimilation or interpolation is 'perfect'. In this letter we compare the rainfall and temperature statistical characteristics between the gridded dataset of ECA&D and local stations to quantify the differences between the ECA&D gridded data and the closest local weather station data and estimate the associated uncertainties.
In the context of the MED-CORDEX and HyMeX, simulations have been performed over 1989–2008 and other simulations will be conducted in the near future over the HyMeX long observation period (2010–20). Furthermore, downscaling of the global simulations of the recent past and future climates will be conducted in the frame of the Fifth Climate Model Intercomparison Project (CMIP5). These simulations will be directly compared to gridded datasets, and more specifically to the ECA&D dataset for the Euro-Mediterranean region. Especially for SD, the ECA&D will also serve to calibrate statistical models. A proper interpretation of downscaling results has to take into account not only all sources of model uncertainties but also the uncertainties associated with the validation, or calibration, dataset.
Acknowledgments
We are grateful to the Israeli meteorological service for providing the Israeli station measurements, as also to the Ev-K2-CNR Committee, which provided measurements from the Italian stations collected within the SHARE project thanks to contributions from the Italian National Research Council and the Italian Ministry of Foreign Affairs. This research has received funding from ANR MEDUP and GIS 'Climat–Environnement–Société' MORCE-MED projects and from the HyMeX program through INSU MISTRALS support. We acknowledge the E-OBS dataset from the EU-FP6 project ENSEMBLES ( http://ensembles-eu.metoffice.com) and the data providers in the ECA&D project ( http://eca.knmi.nl)
Footnotes
- 8
Some of the Italian stations are also part of the 'High Elevation' regional hydroclimate project of GEWEX.