Climatological and Hydrological Observations for the South American Andes: In situ Stations, Satellite, and Reanalysis Data Sets
 Thomas Condom1*
  Rodney Martínez2
  José Daniel Pabón3
  Felipe Costa2
  Luis Pineda4 Juan Jose Nieto2 Freddy López2
  Marcos Villacis5
- 1Institut des Geosciences de l’Environnement – UMR 5001, IRD, CNRS, Université Grenoble Alpes, Grenoble, France
- 2Department of Climate Services, Centro Internacional para la Investigación del Fenómeno de El Niño, Guayaquil, Ecuador
- 3Department of Geography, Universidad Nacional de Colombia, Bogota, Colombia
- 4Escuela de Ciencias de la Tierra, Energía y Ambiente, Universidad Yachay Tech, Urcuquí, Ecuador
- 5Departamento de Ingeniería Civil y Ambiental, Escuela Politécnica Nacional, Quito, Ecuador
Modern hydrology relies on multiple sources of information combined with climatological, hydrological and glaciological data. These data can be collected through various sources such as private initiatives by companies, research programs, and both national and international organisms. They also vary by types, e.g., in situ measurements, satellite, reanalysis and simulated data. Recently the ANDEX research project, as a GEWEX regional program, was created to understand the processes related to the hydrological cycle and energy fluxes in the Andean region from Colombia to Patagonia. It is quite challenging to carry out this program given the complex orography and diversity of climates from tropical to sub-polar climates. This review article is a compilation of the various databases that are useful for hydrometeorological research in the South American Andes. The National Meteorological and Hydrological Services in Bolivia, Chile, Colombia, Ecuador, Peru, Venezuela and Argentina provide a large amount of data however the high-elevation areas are poorly instrumented and the number of stations varies greatly between the countries. National databases are only partially shared with the international bodies responsible for summarizing the existing data; this causes problems in term of data product assimilation. Across the entire continent, too few radiosondes are being used despite the fact that these data are crucial for validating and identifying problems in the atmospheric models. An increasing number of satellite data are available but it is difficult to assimilate them into the hydroclimatological models suited to the adjusted spatial and temporal resolutions. Specifically, for precipitation, we recommend merged products that account for the high spatial and temporal variability across the Andes. Finally, the international ANDEX program could be an excellent opportunity to increase the knowledge of the hydrological processes in the Andes.
Introduction
Modern hydrology relies on multiple sources of information given that, in recent decades, data availability has increased thereby contributing to a new paradigm with data intensive science (Butler, 2014; Chen and Wang, 2018). This study is related to the ANDEX a prospective Regional Hydrological Project (RHP) of the Global Energy and Water Cycle Experiment (GEWEX1) project of the World Climate Research Program (WCRP2). This RHP aims to understand the processes related to the hydrological cycle and energy fluxes in the Andean region that extends from Venezuela to Patagonia and cover a large range of climates from tropical to sub-polar (Garreaud et al., 2009; Sarricolea et al., 2017).
To accomplish this, ANDEX requires bio-geophysical data, such as air temperature, precipitation, evaporation, evapotranspiration, runoff, as well as data on the vegetation, glaciers, etc. Due to the complex physiographic characteristics of the region, additional high resolution data are needed on the topography, soils, land cover and land use. This would allow for a more detailed and accurate representation of the hydrological processes in basins. Therefore, it is necessary to create an inventory of the sources of data and information. The goal of this review is to compile the existing hydrological and meteorological information for the South American Andes. The assessment of the data and observations is based on publications by the World Meteorological Organization (WMO) (WMO, 2007, 2010), the portals of various international and national institutions or universities, as well as information provided by the National Meteorological and Hydrological Services (NMHSs) from Bolivia, Chile, Colombia, Ecuador, Peru, Venezuela and Argentina. With the exception of Colombia, information taken from private networks was not included in this study, mainly because this information was not available or reported by the NMHSs. In addition to these in situ measurements, we present a compilation of the satellite based products and reanalysis data useful for climatological and hydrological purposes in the Andes. The purpose of this article is to provide a concise review of the available sources of information that are useful or relevant for the objectives of the ANDEX program. This inventory besides showing the data availability, also identifies the gaps to be filled and the current limitations that must be addressed, in order to implement new research programs on the water cycle and energy balance in the Andean region. The available data sources and information are separated according to their types: in situ observations and measurements from the current hydrometeorological network operated by governmental institutions (Section 2); remote sensing data (satellite sensors) (Section 3); re-analysis data (Section 4); physiographic and morpho-topographic data (Section 5). The main knowledge gaps and some research are presented in Section 6. Finally, we conclude with research opportunities through the ANDEX program (Section 7). Although this is a renewed effort to update the inventory of existing observations, it cannot be considered as complete. The data relative to future climatological and hydrological scenarios for the Andes are beyond the scope of this article.
In Situ Observation and Measurements
The following information is available for different time periods and different spatial and temporal resolutions. On the one hand, data for some places and regions have been obtained through regular observations or measurements over long periods, while other data are obtained by specific research programs over a limited time period. Regular observations/measurements of hydrometeorological variables have been made by governmental institutions in countries in this region under the standard methods used by the WMO for its operational Integrated Global Observing System (WIGOS). These observations include, among others, the Regional Basic Synoptic Network (RBSN) and the Regional Basic Climatological Networks (RBCN). A description of the whole Integrated Global Observing System may be found in WMO (2017). For the Andes, these regional networks are operated by Argentina, Bolivia, Chile, Colombia, Ecuador, Peru and Venezuela; i.e., countries that are members of the WMO Regional Association III (RA-III) (WMO, 2018).
Observing Systems Capability Analysis and Review Tool – OSCAR
The official information from the NMHSs is compiled in the Observing Systems Capability Analysis and Review Tool (OSCAR)1. This database is developed by the WMO at the global scale in support of Earth Observation applications, and provides physical variables related to weather, water and climate. Additionally, the portal details information concerning all earth observation satellites. However, for South America, OSCAR has a limited number of observations included by the NMHSs. For the seven Andean countries mentioned, there are only 451 stations that collect hydrometeorological variables. In Table 1, the stations reported to OSCAR are broken down by country (NMHS) and by variable. Argentina is the country with the highest number of stations in the system with 147 stations, while Bolivia has the lowest number of stations with 39. In general, almost all of the stations reported temperature and precipitation measurements with different time steps (hourly, daily, and monthly). Argentina, Chile, Colombia and Venezuela measure the Potential Evaporation and Solar Insolation while Ecuador just measures the Potential Evaporation, Peru measures the Insolation and Bolivia does not include these variables in the OSCAR system. This could be due to the lack of records or because the data was not downloaded in the OSCAR system. Very few glaciers are reported in the database along the Andes from Colombia to Patagonia. None of the Andean countries reported river/lake level and discharge observations to OSCAR, indicating a lack of information for these two critical hydrological components.
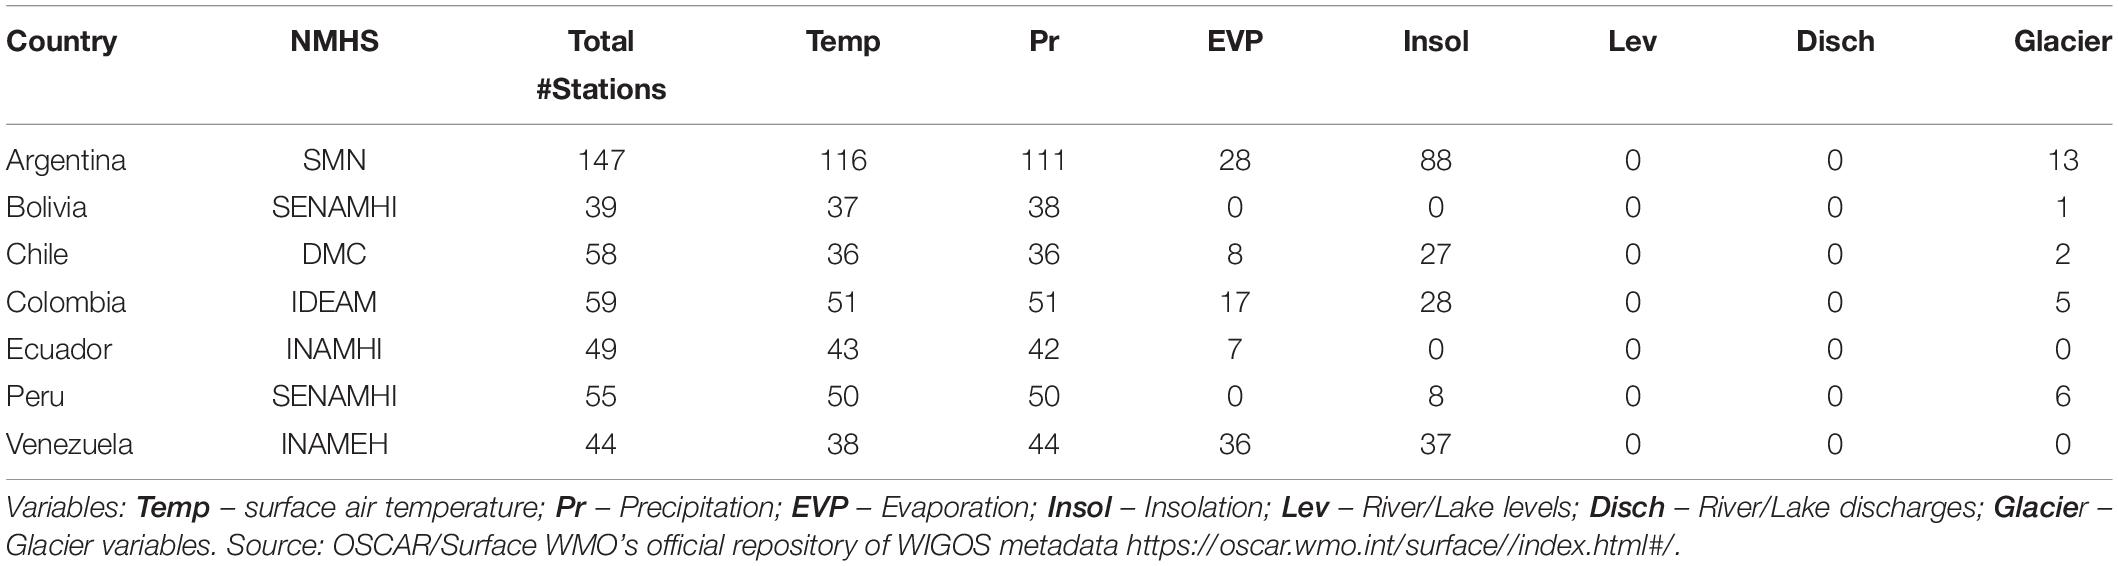
Table 1. Number of surface hydrometeorological stations operated by the National Meteorological and Hydrological Services in the Andean Region reported in OSCAR.
National Meteorological and Hydrological Services Data
OSCAR is an official repository but there is a lack of meteorological and hydrological data for South America. To estimate the available information in western South American countries, the direct information provided by the NMHS and through their official website has been compiled. The summary of this information from Bolivia, Chile, Colombia, Ecuador, Peru, Venezuela and Argentina indicate a total of 14,595 stations (meteorological and hydrological), which is much higher than the number of stations reported to OSCAR. The details of this compilation, broken down by country and altitude range, are presented in Table 2. The stations are distributed as follows: 7,471 stations between an altitude of 0 and 1,000 m; 3,053 stations between 1,001 and 2,000 m; 2,436 stations between 2,001 and 3,000 m and 1,635 stations above an altitude of 3,000 m. Colombia has a total of 8,858 stations, representing 60.7% of the total stations. It is the sole country to have made records from the available private stations, which explains the difference with the other countries. Peru follows with 2,236 stations (15.3%); Ecuador is the third country with 1,447 stations (9.9%); Chile has 959 stations (6.6%); Venezuela has 820 stations (5.6%); next comes Bolivia with a total of 166 stations, representing 1.1% of the total and Argentina rank last with a total of 109 stations, which represents 0.7% of the total. In general terms, the spatial density of the stations could be determined by considering the local geographical such as the presence of deserts and extended plains and how easy is to access these areas to acquire data.
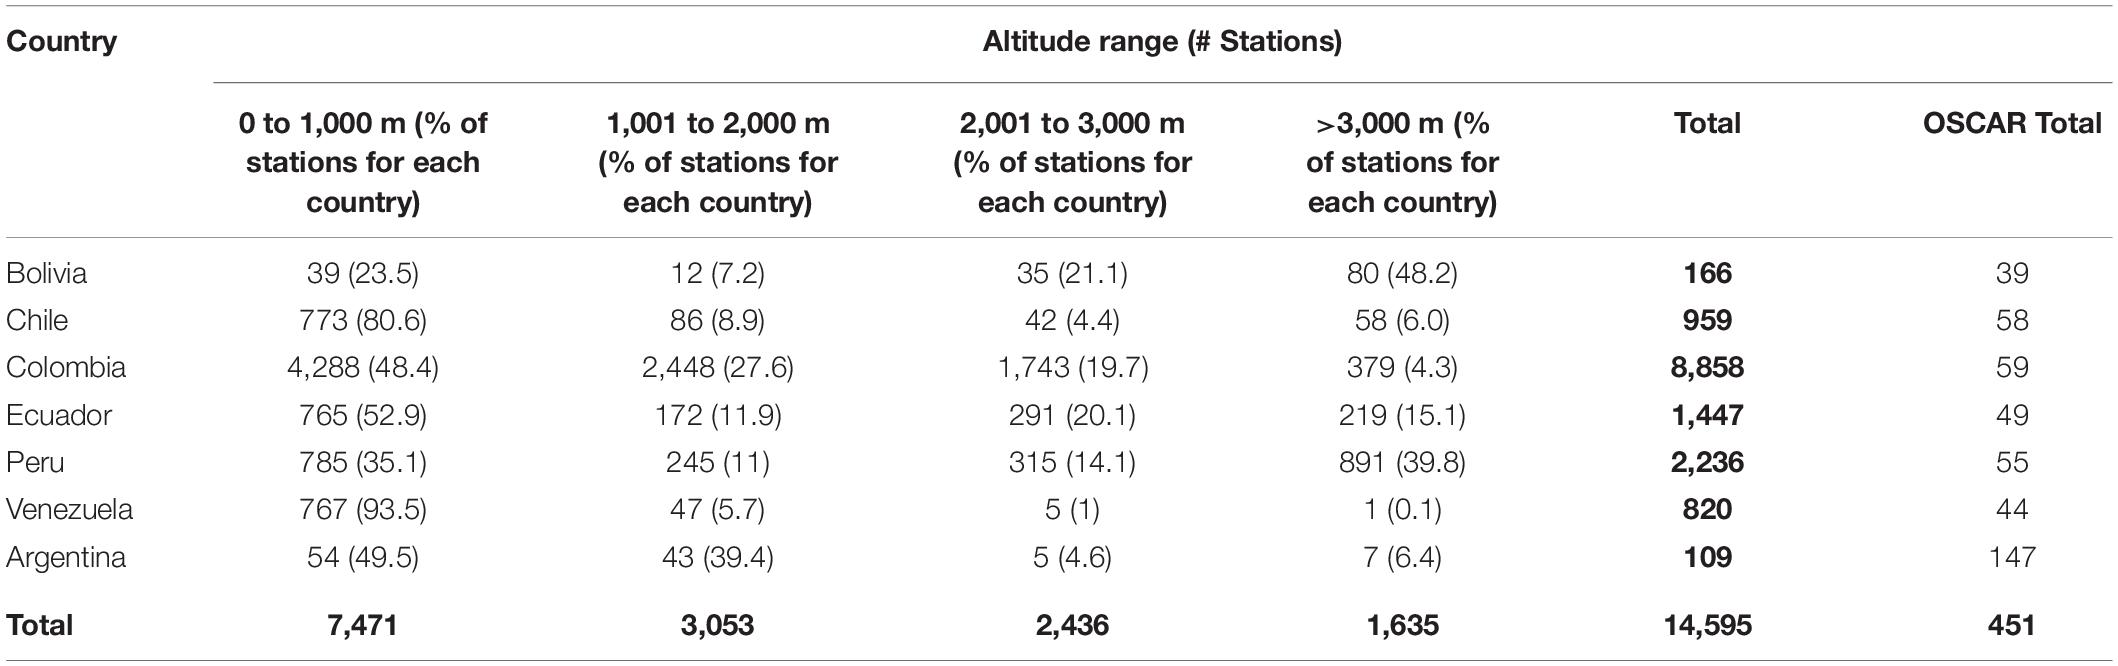
Table 2. Total number of stations (meteorological and hydrological) per country and altitude range based on the reports received from the NMHSs in Bolivia, Colombia, Chile, Ecuador, Peru, Venezuela, and Argentina.
Observations Between 0 and 1,000 m
The percentage of stations between 0 to 1,000 m in comparison with the total per country is given in Table 2. Chile, Ecuador, Peru and Venezuela have very similar values at this level, representing close to 10% for each country. Colombia has the highest number of stations at this altitude range with 57.4% of the total stations, while Bolivia and Argentina represent less than 1.0%. For Chile, Colombia, Ecuador and Venezuela, the majority of the stations are located in the 0–1,000 altitude range. For Venezuela and Chile, this range is important as it represents 93.5 and 80.6%, respectively, of its total stations. The spatial distribution of the stations between 0 and 1,000 m is shown in Figure 1. In this altitude range, a good coverage is found in the Caribbean basins (Colombia and Venezuela) and on the western slope of the Andean mountains to the coast. This dense meteorological station network contrasts with the network on the eastern slope and the Orinoco and Amazon basins. The same pattern is observed in Ecuador and Peru, where most of the stations are located from the western slope of Andes to the coast and only few stations are located in the Amazon Basin. In Bolivia, the density of stations is relatively low with major gaps depending on the region. Chile shows a lower density of stations in the northern and southern regions in comparison with the central region of the country. The highest density of stations in Argentina is in the central-western region.
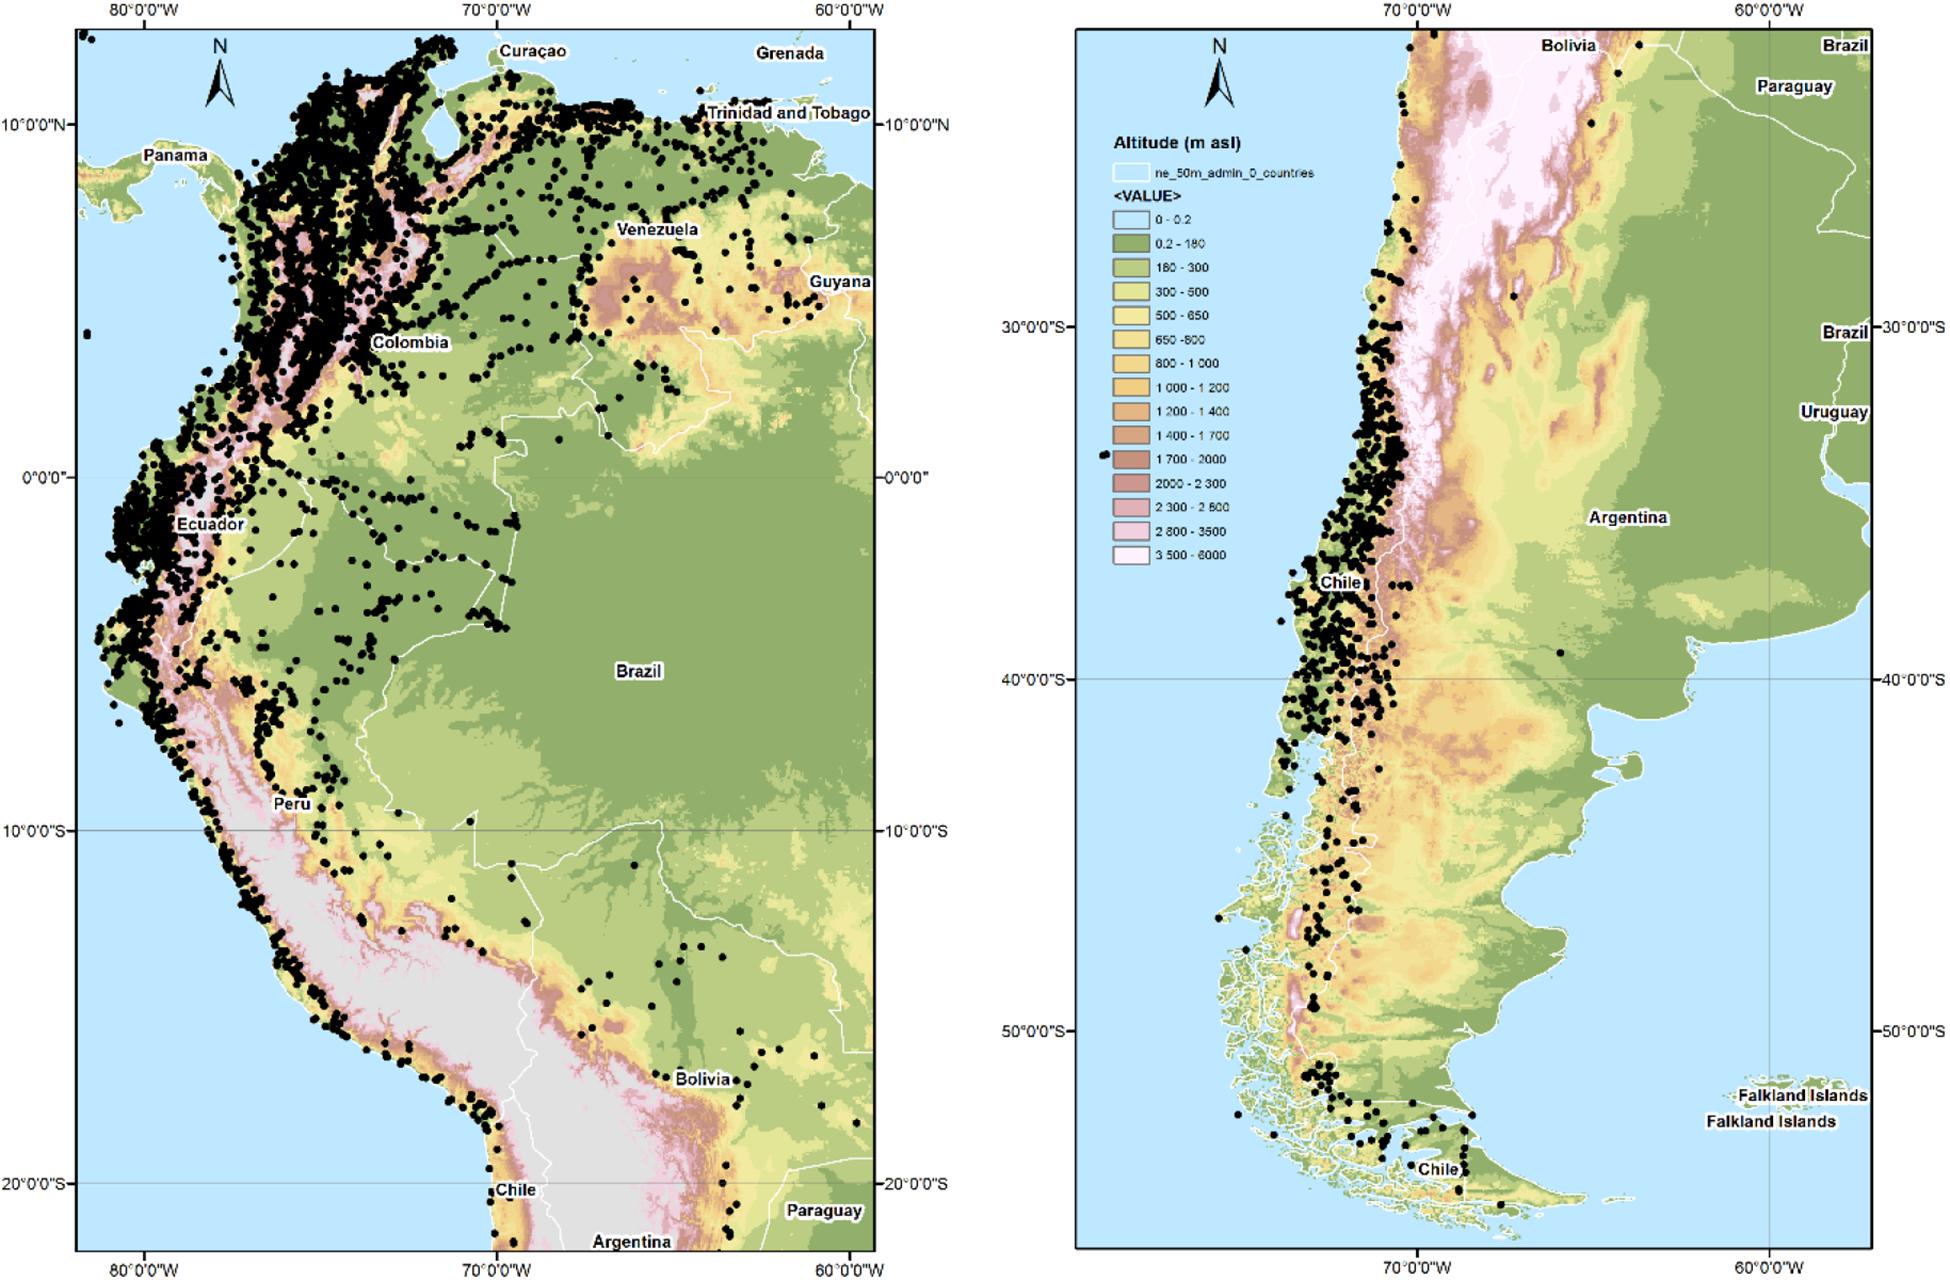
Figure 1. Total number of surface stations (meteorological and hydrological) between 0 and 1000 m. Source: National Meteorological and hydrological Services from Bolivia, Chile, Colombia, Ecuador, Peru, Venezuela, and Argentina.
Observations Between 1,001 and 2,000 m
Once again, Columbia has the highest percentage of stations between 1,001 and 2,000 m out of the total number for the Andean region compared to the other countries. The spatial distribution of the stations for this altitude range is shown in Figure 2, where we observe a good coverage with a dense network of stations for Colombia. A significant gap exists over the Guiana Shield (“Macizo Guayanés”) located in southern Venezuela. A low density is also observed in the Andean region of Ecuador, and the southern Andes of Peru and Bolivia and Chile. Once again, Argentina shows a higher density of stations in its western-central region, on the eastern side of the Andes.
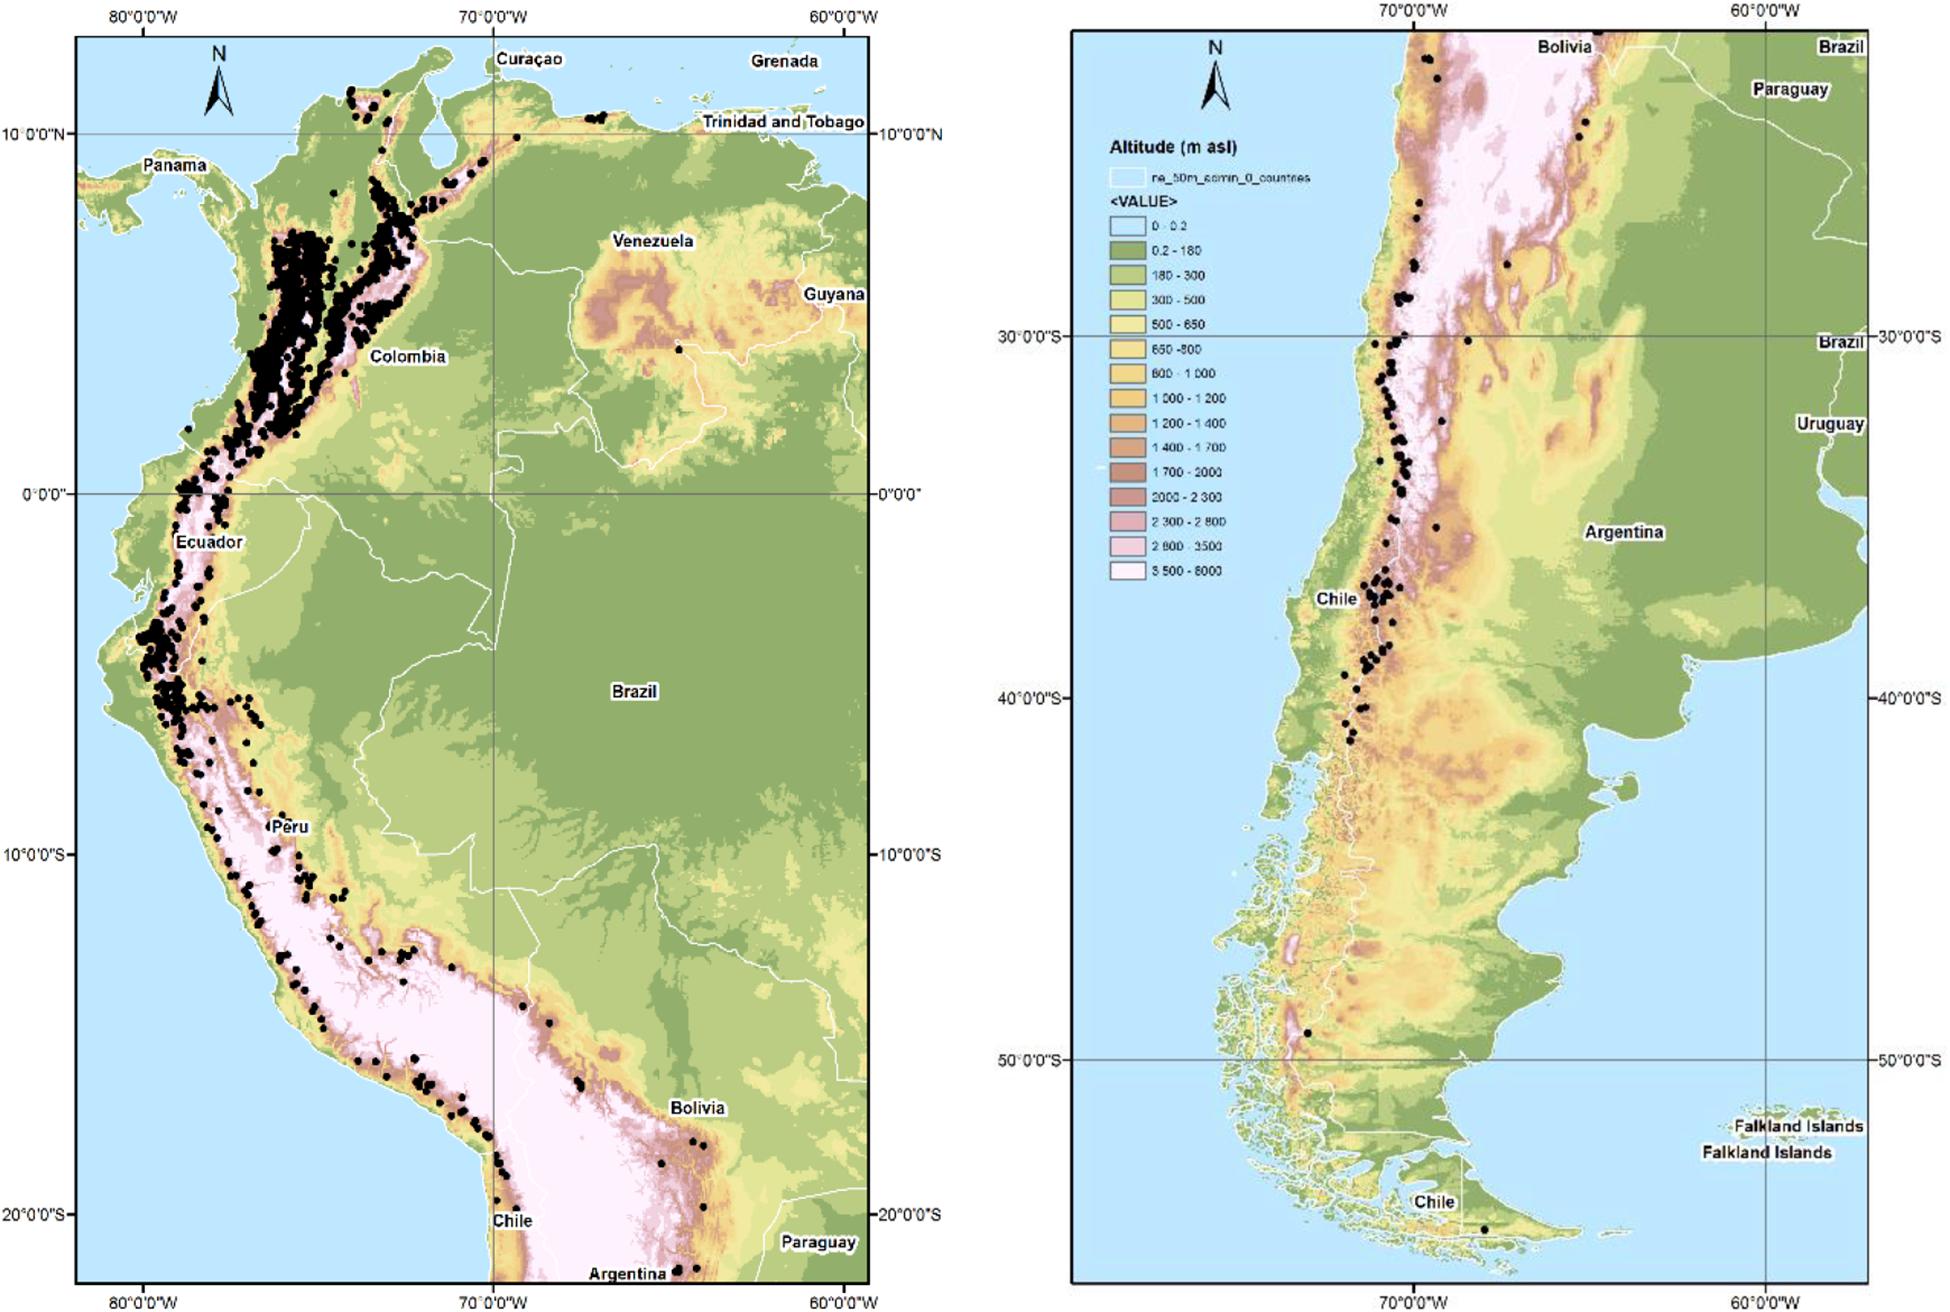
Figure 2. Total number of surface stations (meteorological and hydrological) between 1,001 to 2,000 m. Source: National Meteorological and hydrological Services from Bolivia, Chile, Colombia, Ecuador, Peru, Venezuela, and Argentina.
Observations Between 2,001 and 3,000 m
The percentage of stations between 2,001 to 3,000 m is shown in Table 2. For this altitude range, the countries with the fewest number of stations at this range, compared to the other ranges, are Chile, Argentina and Venezuela. Conversely, Colombia stands out as having the highest percentage compared with the other countries (71.5% of the total). The spatial distribution of the stations for this altitude range is shown in Figure 3 and there is a lack of stations over the Andean Cordillera in Bolivia, Chile and Venezuela. On the contrary, there is a high density of stations over the Andean Cordillera in Colombia, Ecuador and Peru.
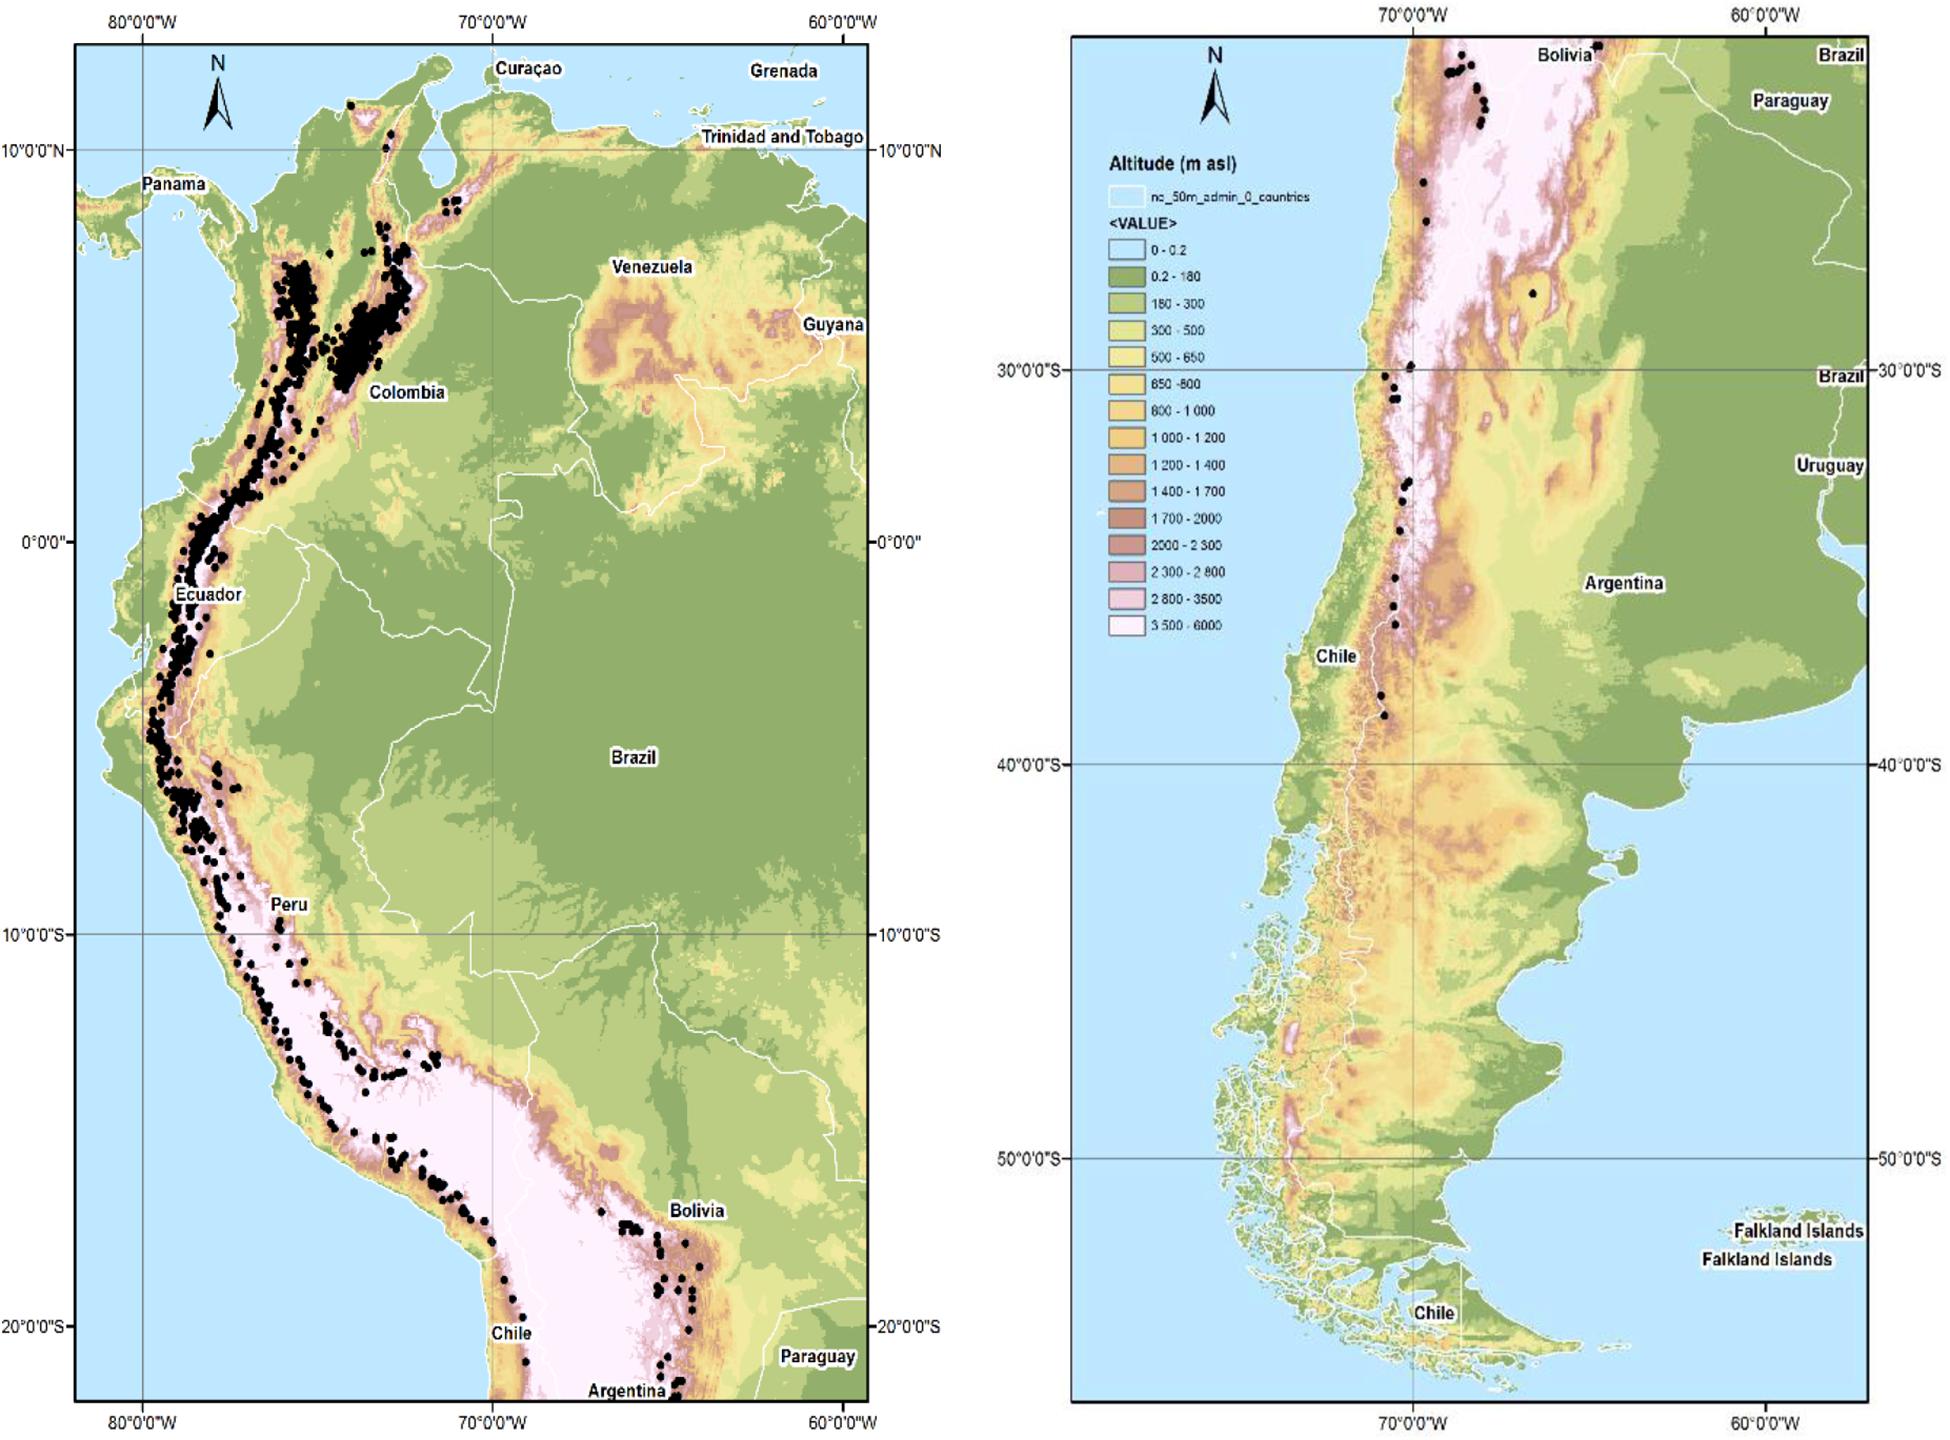
Figure 3. Total of surface stations (meteorological and hydrological) between 2,001 to 3,000 m. Source: National Meteorological and hydrological Services from Bolivia, Chile, Colombia, Ecuador, Peru, Venezuela, and Argentina.
Observations Above 3,000 m
In general very few stations exist above 3,000 m along the Andes. Nevertheless, this percentage represents 48.2% of Bolivia’s total number of stations, and 39.8% of Peru’s total number of stations. In contrast, Argentina, Colombia and Venezuela have the fewest number of stations in this range with a total of 6.4, 4.3, and 0.1% in each country, respectively. Colombia still has more stations than Argentina, Bolivia, Chile Ecuador and Venezuela (with only one station) in this altitude range. The spatial distribution of stations above 3,000 m is illustrated in Figure 4 where we generally note a low density of stations. In the case of Chile, the stations are only located in the northern region due to the orography.
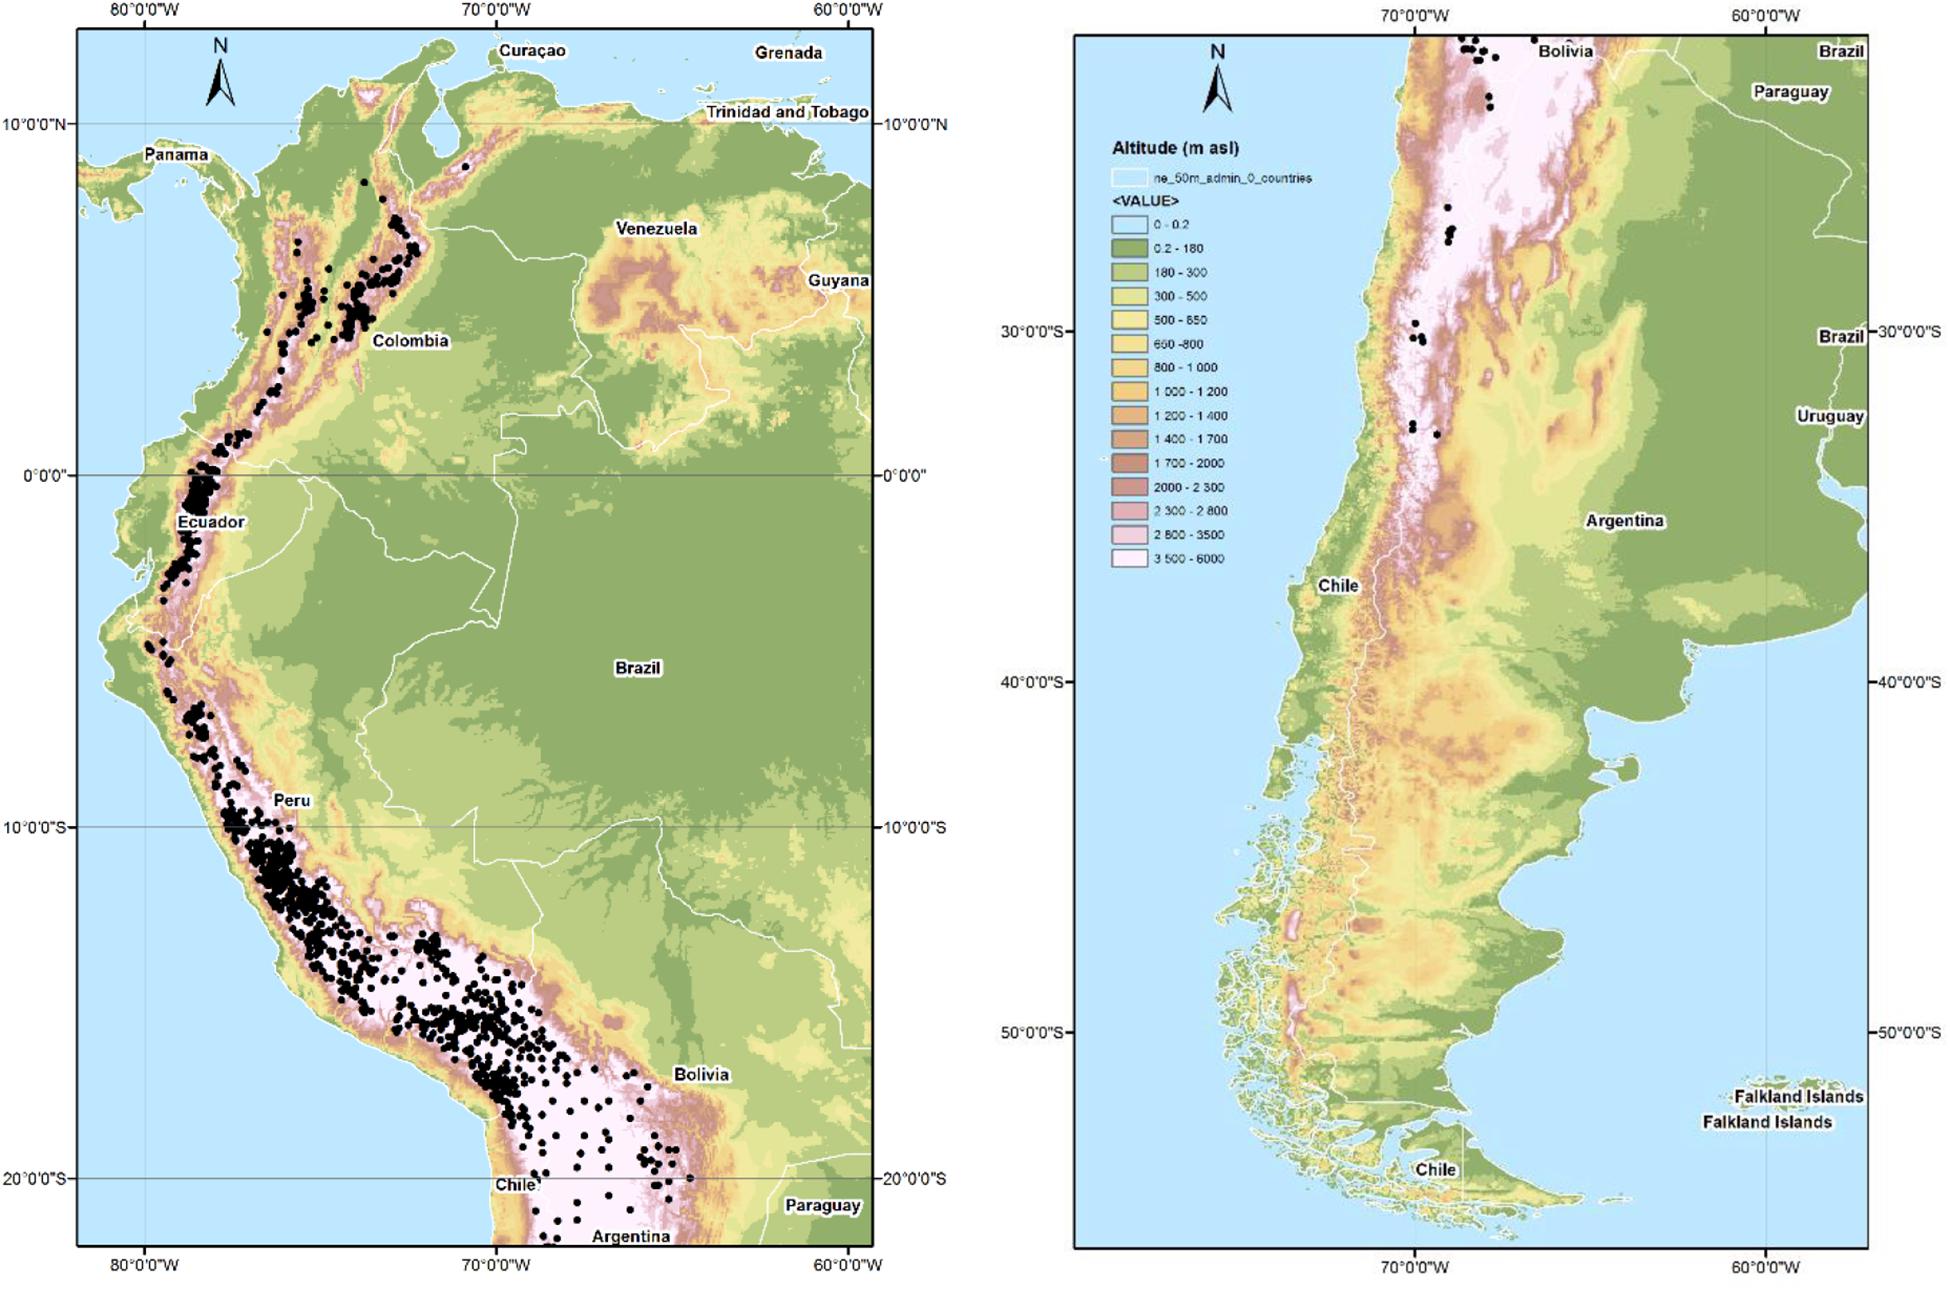
Figure 4. Total number of surface stations (meteorological and hydrological) above 3000 m. Source: National Meteorological and hydrological Services from Bolivia, Chile, Colombia, Ecuador, Peru, and Venezuela.
Reported Observations for the WMO Information System
CLIMAT is an additional database in which each station has a code for reporting the monthly climatological data assembled at land-based meteorological surface observation sites to data centers. Each NMHS exchanges data via the Global Telecommunication System (GTS) (WMO, 2017). The stations reported in CLIMAT are a subset of the NMHS’s stations mentioned in the previous section. Figure 5 shows the percentage of stations that are part of the Global Climate Observing System Surface Network (GSN)2 and which report data to the CLIMAT3 database from June 2018 to May 2019. Although the observational capacity in the Andean countries has increased over time, the availability of data transmitted through the CLIMAT Reports is limited in countries such as Ecuador, Peru and Venezuela. This example illustrates how the number of available stations and the existing gaps could be exacerbated by the operational limitations.
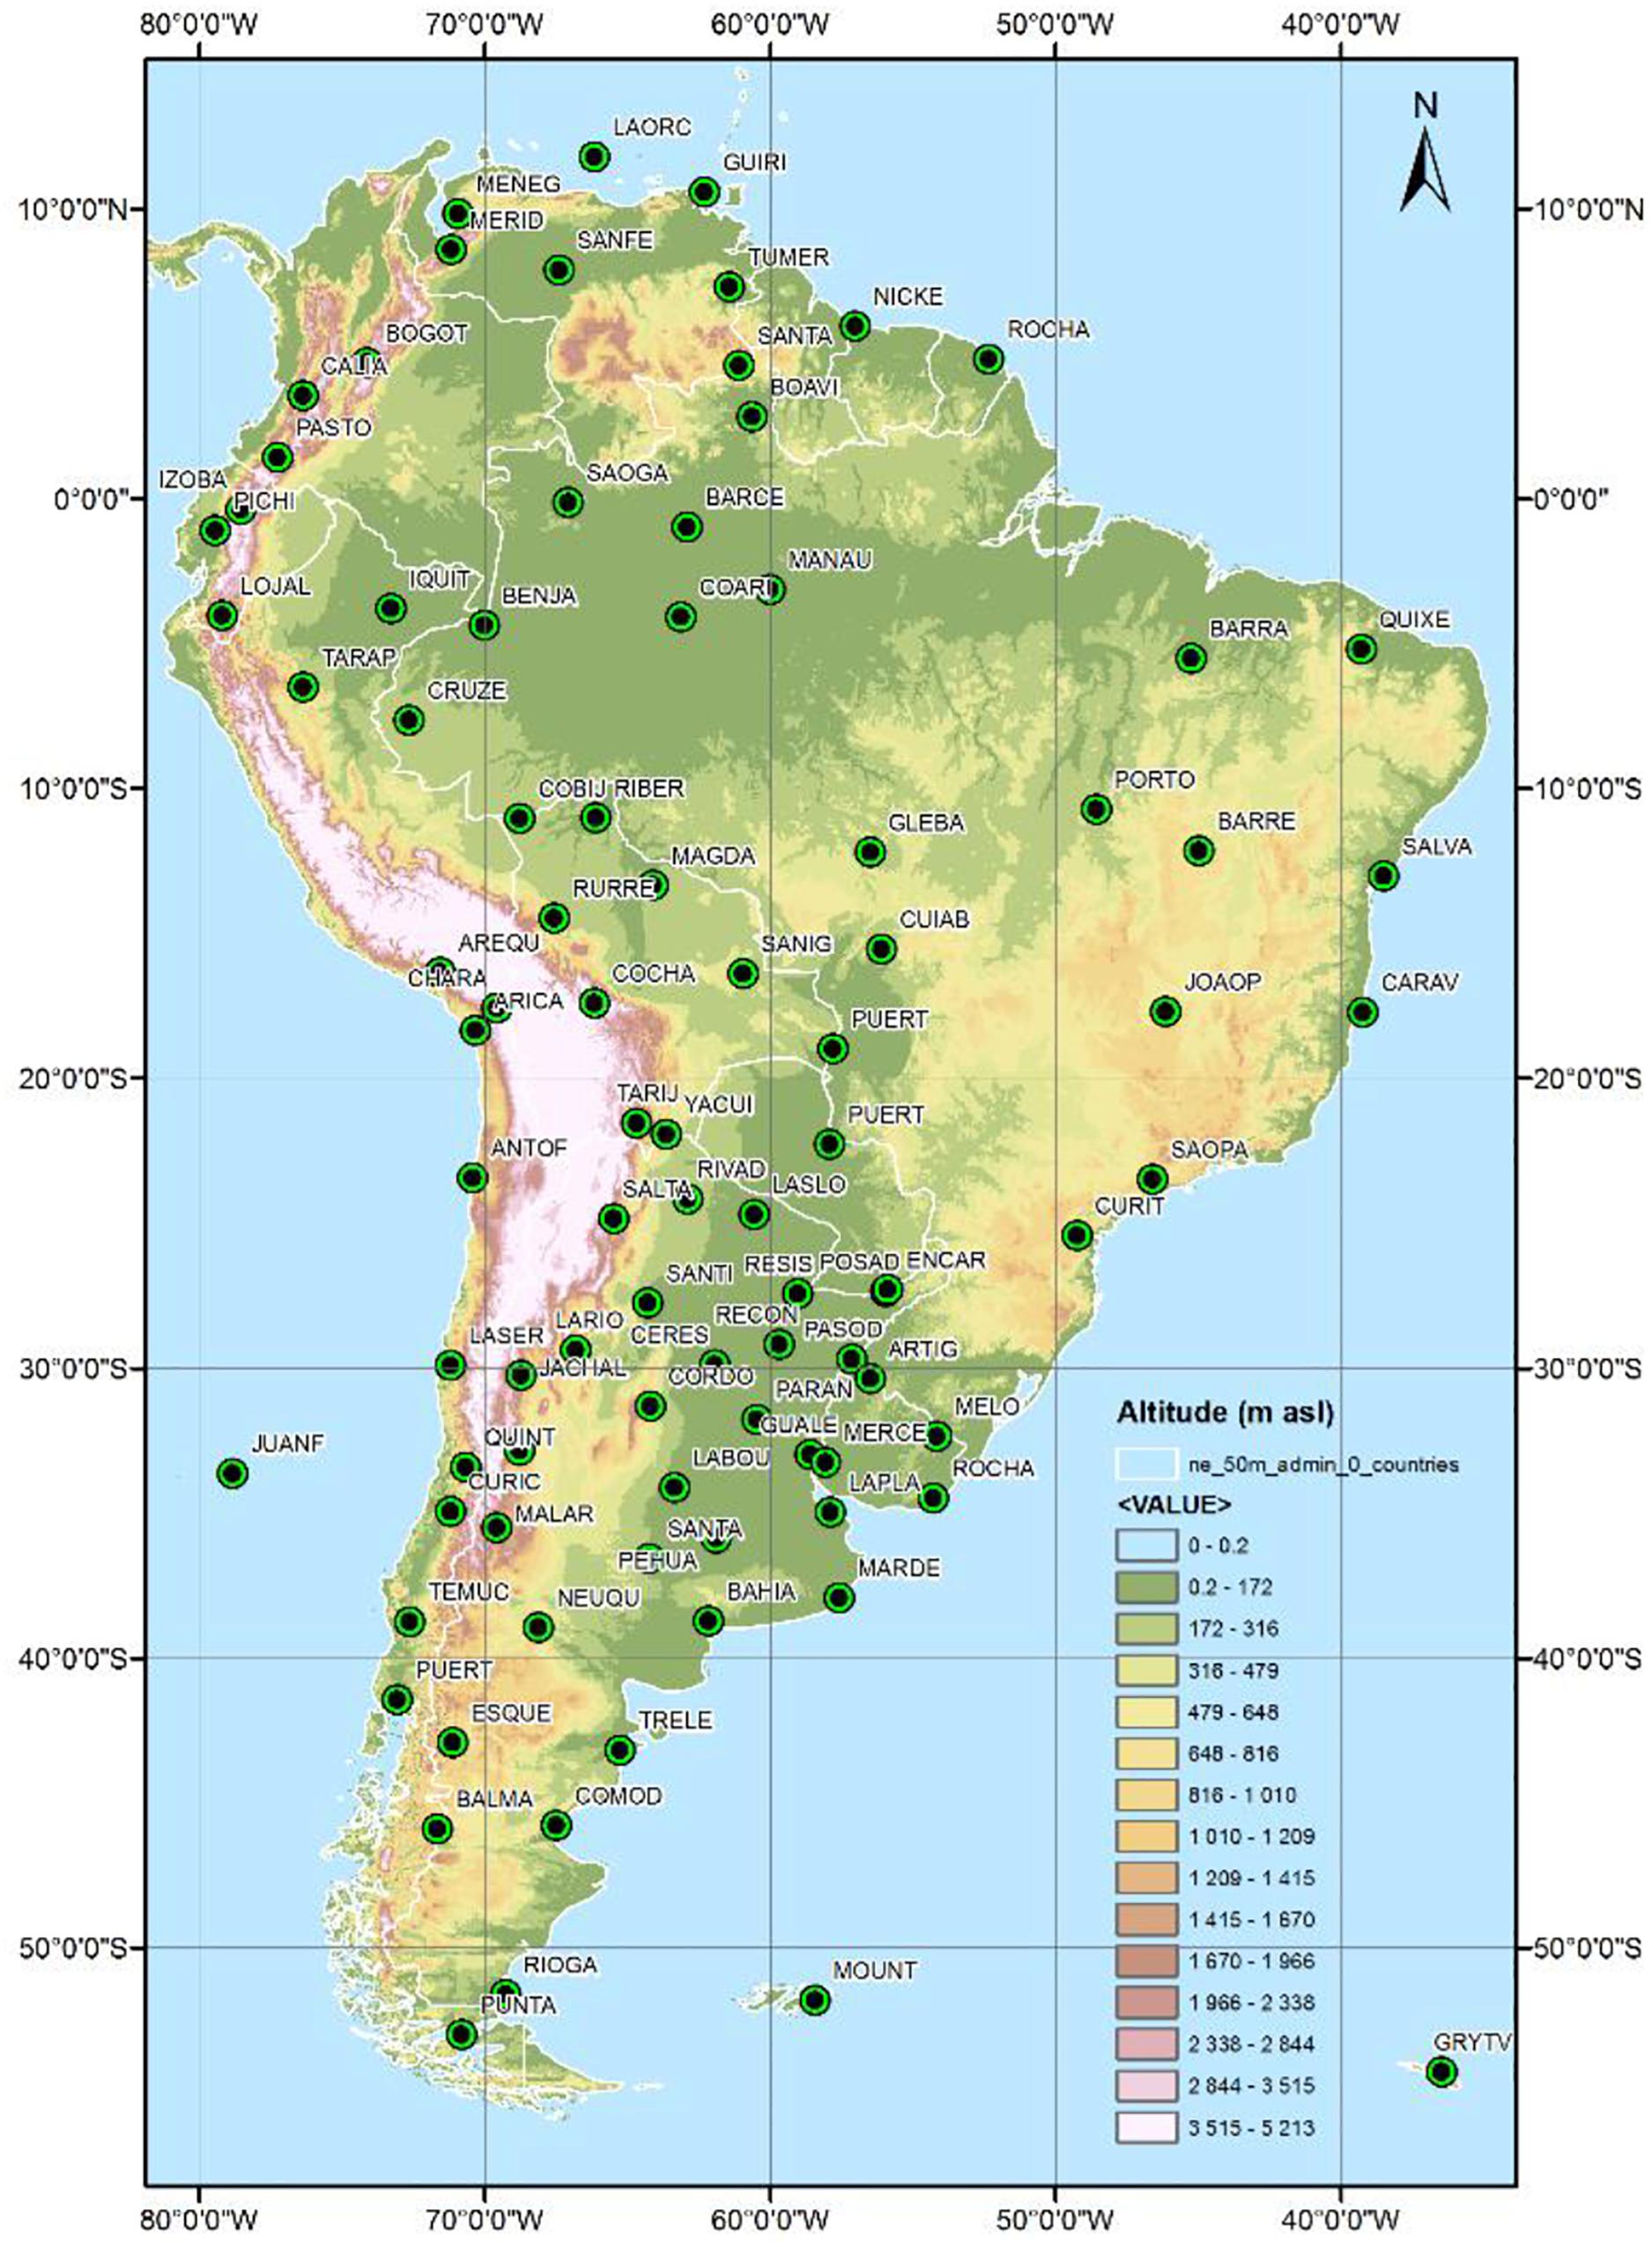
Figure 5. GSN-stations (black points) in the CLIMAT database.
Global Precipitation Climatology Centre – GPCC
The GPCC provides three datasets (Schneider et al., 2011). The first quality-controlled dataset compiles the information from 7,000 stations and covers the period from 2007 to the present. The second one is a quality-controlled dataset from 67,200 stations worldwide with recording duration of at least 10 years over the 1901–2013 period (Full Data Product, V7). This product contains the gridded monthly rainfall with spatial resolutions of 0.5°, 1.0°, and 2.5°. The last product, a near real-time first guess, is a gridded product with spatial resolution of 1.0° at daily time-scale. The problem is that it is based on a limited number of stations. These three gridded products are not yet bias-corrected for systematic gauge measurements, e.g., wind undercatch. Nevertheless, the GPCC provides the number of gauges used to generate the grids as well as the climatological estimates of error. All of the products can be downloaded on the GPCC3 portal. A limitation of the GPCC dataset in South America, and the Andes in particular, is the number of stations used for the gauge interpolation. The number of stations has declined considerably during the last two decades (Figures 6A,B). Figure 6B illustrates the scarcity of data along the Andes. It can be seen that more data are available in the Northern Andes. Because gauges are scarce in this region, this has implications for the gridded product which could be non-homogeneous. Problems can be observed in mountainous areas when the satellite-based rainfall estimates (SREs), such as TMPA (TRMM Multi-satellite Precipitation Analysis), use GPCC to adjust their estimates. Finally, this could degrade the results of the hydrological modeling using this data.
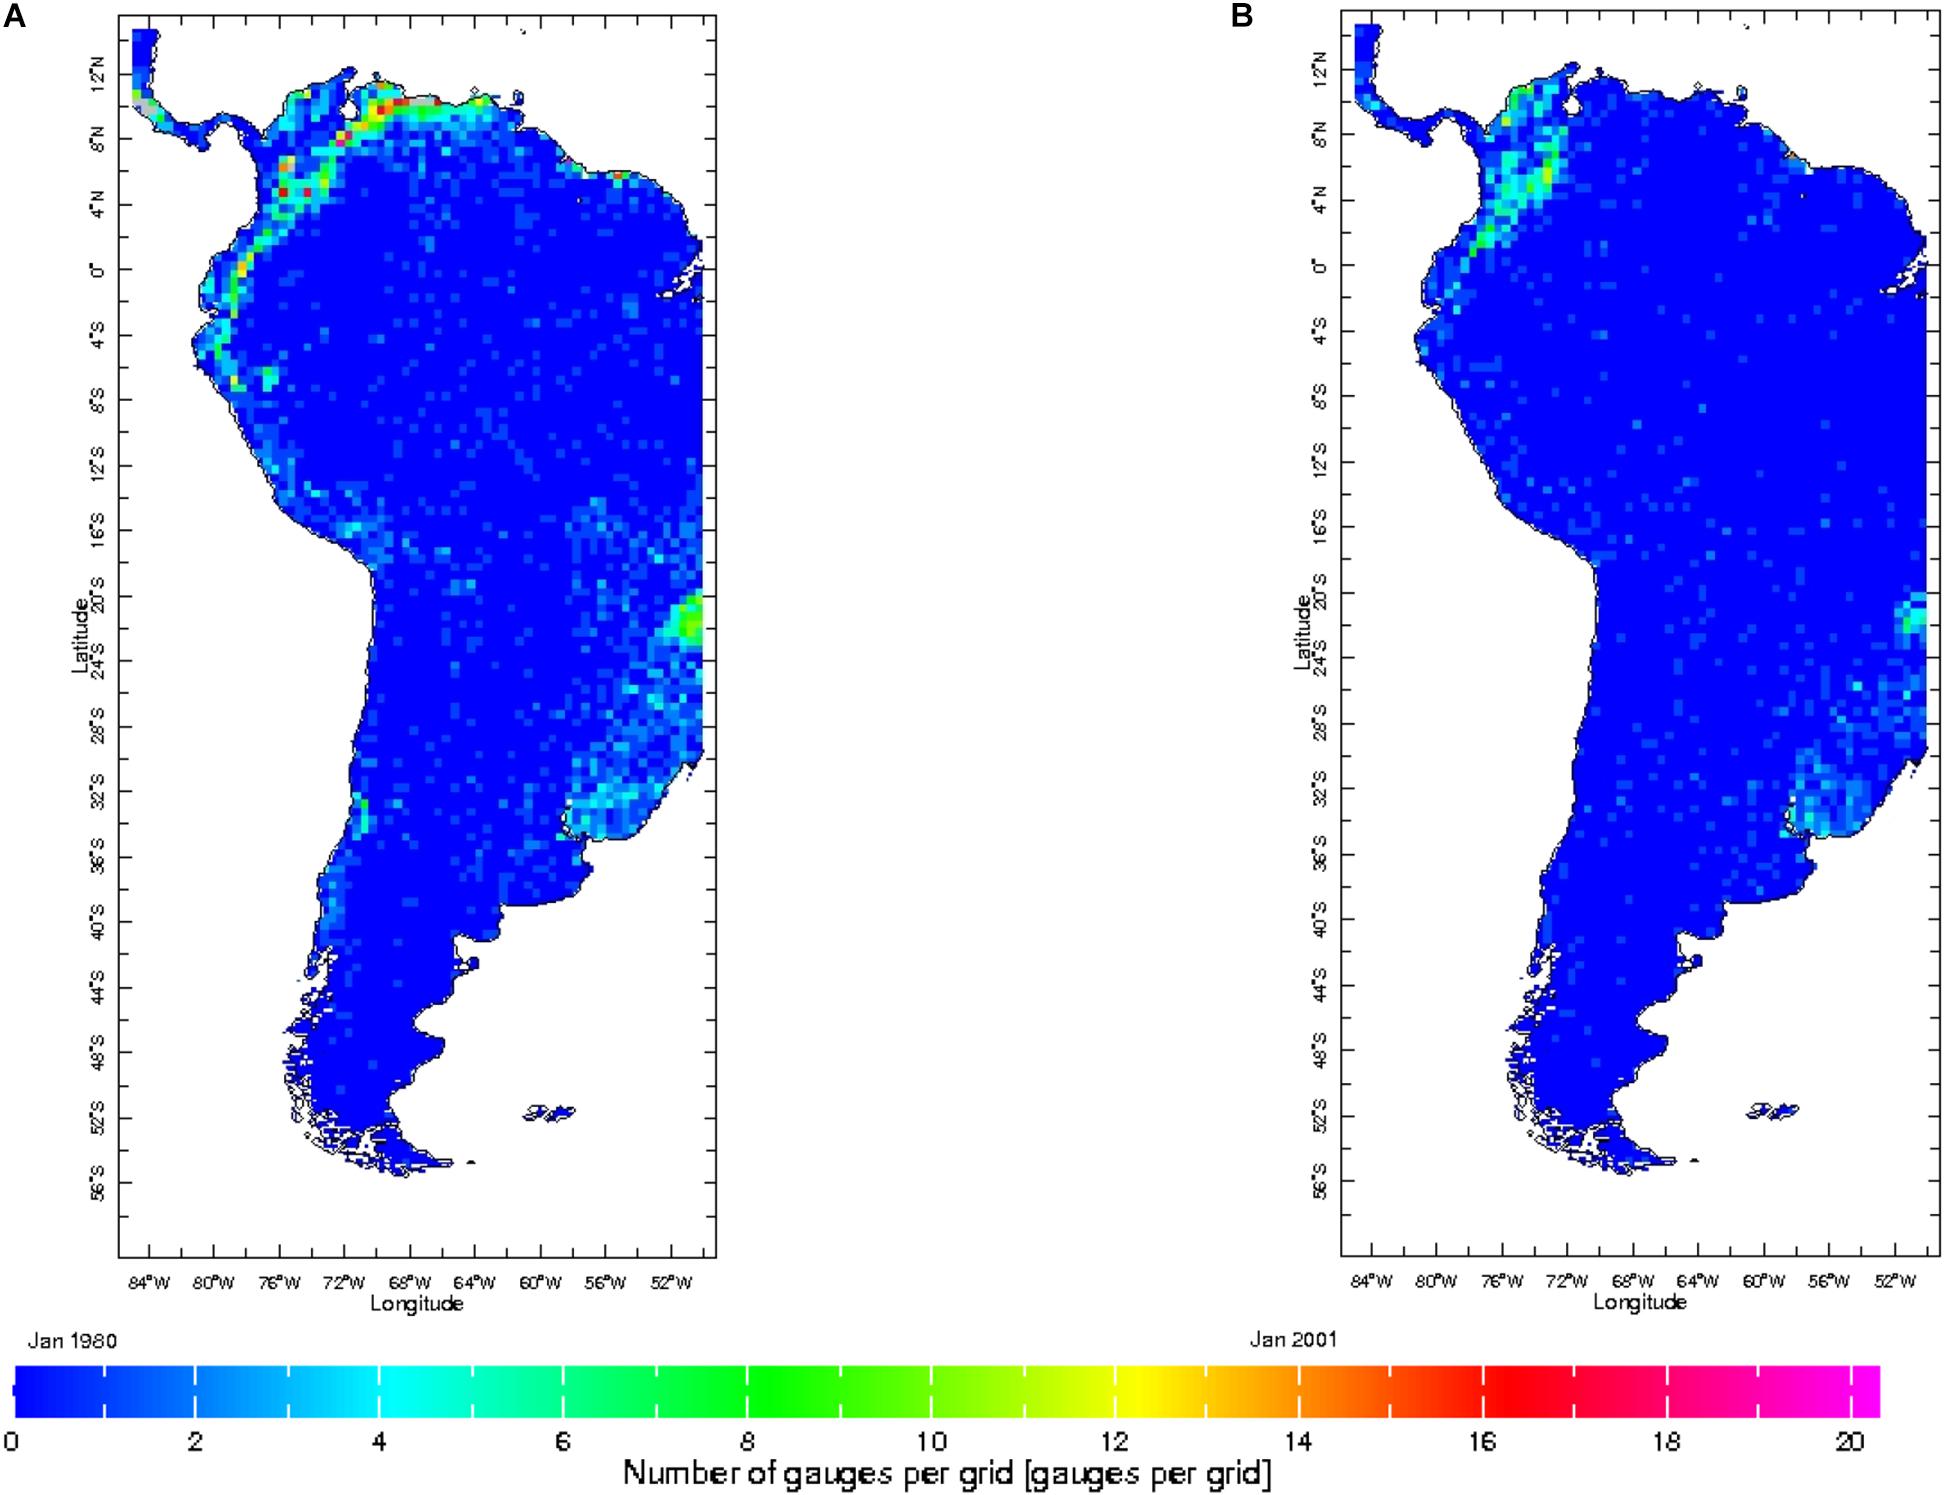
Figure 6. Spatial distribution of the average number of rain gauges per grid used in GPCC4 over the period (A) 1980–2000 and (B) 2001–2018.
Radiosonde
The punctual upper-air measurements for a given time and date can be taken using a radiosonde. This instrument, carried by a balloon through the troposphere, is equipped with devices to measure one or several meteorological variables (pressure, temperature, humidity, horizontal wind) at different altitudes, and is equipped with a radio transmitter for sending this information to the observing station usually at a fixed location (WMO, 2014). Radiosondes take measurements at one location, ideally twice a day, up to heights of roughly 25 to 35 km. The ascending velocities are comprised between 5 and 8 m s–1. Biases exist for each variable: 1 hPa for pressure, 0.4 to 1 K for temperature and 5 to 14% for relative humidity, respectively. One of the strengths of this data is its precise location into the atmospheric column. These data are used in forecast models as well as in reanalysis. Some limitations for sending the radiosondes exist due to high and labor-intensive costs. In the Andean region and nearby adjacent areas there are only 16 points for five countries with regular upper air measurements with a mean frequency equal to 1 per day (Table 3). Generally, the launch time is at 12Z. Data from these radiosonde stations may be accessed in each NMHS or through the University of Wyoming5, by searching in South America or using the station code number. Only five stations are launched at an altitude higher than 1000 meters above sea level, demonstrating the need for developing more scientific projects and programs in the Andes. If intensive radiosonde campaigns were to be carried out in the Andean region, this would lead to a better understanding of the vertical structure of precipitation events and cloud microphysical processes (Perry et al., 2014).
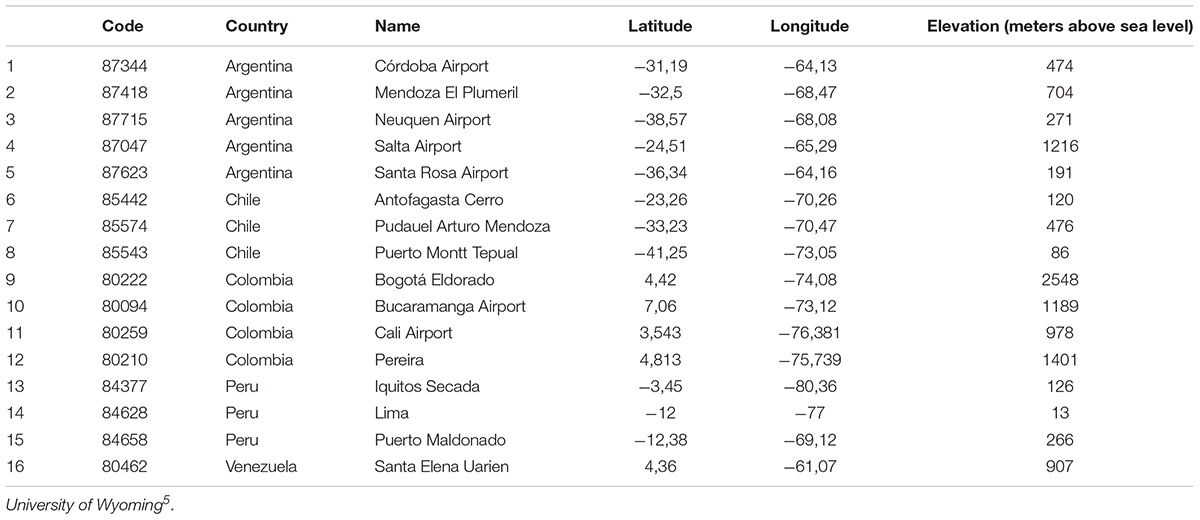
Table 3. Stations with upper air measurements located in the Andes region or in nearby adjacent areas.
Hydrological Data
The hydrological used and disseminated by the NMHS are also collected, processed and analyzed according to the WMO’s standard methodologies as part of the WMO Hydrological Observing System (WHOS6), the hydrological component of WIGOS. The concept of this resource is to pool and share historical and real-time data from water information systems. In the web portal3 is possible to have access to each NMHS database and the corresponding website. In addition to the NMHS, other institutions and specific research programs also operate hydrometeorological stations based on the concept of citizen science, which implies that stakeholders help to define the research or application objectives for this kind of network. For example, few years ago, Celleri et al. (2010) proposed an Andean Network of Research for a participatory-based (or collaborative) hydrological monitoring network, including the collection, processing, storage and dissemination of data for research and application purposes; this network should include (a) densely-instrumented basins for identifying and quantifying hydrological processes and their spatial variability and (b) baseline instrumented basins managed by local stakeholders. More recently, Ochoa-Tocachi et al. (2017) presented the initial results of the Regional Initiative for Hydrological Monitoring of Andean Ecosystems (iMHEA), a network with over 30 local stakeholders at 15 sites located in Bolivia, Ecuador, Peru and Venezuela. iMHEA has produced data for precipitation, stream flows, meteorological variables (temperature, humidity and wind speed/direction), soil properties, geological characterizations, land use and tracer monitoring. The data and analyses tools generated by iMHEA are freely available on internet (Ochoa-Tocachi et al., 2018). Other initiatives in Chile spearheaded by the Center for Climate and Resilience Research share a free extensive hydro-meteorological database through their portal7. These data can be used to improve knowledge about hydrological processes in a much detailed manner than the scale provided by the NMHS. The Global Runoff Data Centre (GRDC8) provides another free hydrological database compiling runoff data at the global scale. The GRDC is an international data center operating under the auspices of the World Meteorological Organization (WMO) that was established in 1988 to support research on global and climate change and integrated water resources management. Furthermore, cryosphere monitoring provides relevant information for hydrology, especially in the Andean region. To share this information, the WMO created an international mechanism for supporting in situ and remote sensing observations: the Global Cryosphere Watch (GCW), which is also a component of WIGOS. The objective is to group and share the raw data, information and analyses on the past, present and future state of the cryosphere. As part of WMO, data obtained from extensive monitoring are collected through standardized measurements9.
Regional Climate Centers of South America
In addition to the NMHS, South America has two Regional Climate Centers (RCC): the RCC for Western South America (RCC-WSA10), which includes Bolivia, Chile, Colombia, Ecuador, Peru and Venezuela and is coordinated by the International Research Center on El Niño (CIIFEN11); and the RCC for Southern South America (RCC-SSA12) coordinated by the National Meteorological Service of Argentina and the National Institute of Meteorology of Brazil, that have Bolivia, Chile, Paraguay and Uruguay as active members. These institutions are WMO members, which they have a series of obligatory functions to create regional climate products, including prediction, and to support climate activities at regional and national scales. In western South America, a relevant source of information is the Latin American Climate Assessment & Dataset (LACA&D13) that receives data from nine member countries with 1,225 weather stations. They present information on rainfall rates, rainfall extremes and climatic trends. These data are shared by the NMHSs from their official databases. RCC-WSA also is responsible for receiving and publishing the seasonal prediction made by the NMHS with monthly in situ measured data. Similarly, the RCC-SSA has their own database with information from the meteorological stations of the member countries. This information is updated on a monthly basis and can be used to analyze the climate diagnosis. The historical information in this database may be also used for hydroclimatological studies. Additionally, both institutions develop climate analyses from global and regional data in order to provide a better understanding of the impacts of extreme climate events and climate variability and change in the region.
The present challenges for the different Centers are: (i) to have a system of data rescue and to provide high quality essential climate variables datasets up to date; (ii) to create new gridded time series products merging station data, reanalysis and satellite observations; (iii) to work with sector-based research team to develop applications models.
Data From Satellite Sensors
In addition to the data produced by in situ observations and measurements, data are also generated by remote sensors placed in satellite platforms. By scanning the Earth’s surface and atmosphere, these devices produce data on the surface temperature, soil and air moisture, water vapor, cloudiness, precipitation and several indices that represent the vegetation and the soil. This methodology provides new and useful information for monitoring and modeling hydroclimatic variables, due to the higher spatial resolution and longer time ranges of the data generated. Considering that huge amounts of data are becoming increasingly available, cloud computing is becoming increasingly necessary as a result. These data can be accessed through portals such as Google Earth Engine, NASA Earth Exchange (NEX) and/or Earth Observation Data for Water Resources Monitoring (EODC) (Chen and Wang, 2018). Satellite-derived precipitation estimates use indirect data and do not accurately represent the precipitation in mountainous areas where orography plays an important role (Derin and Yilmaz, 2014). The article published by Sun et al. (2018) gives a review of Global Precipitation Data Sets, witch estimated 30 different products and highlighted that large differences exist, particularly in complex mountain areas. One recent study Nijzink et al. (2018) highlights the advantage of taking various information sources into account in order to better understand the hydrological processes. Using five different conceptual hydrological models applied to 27 catchments with areas comprised between 91 and 1587 km2, these authors demonstrated that the models became more accurate with an increasing number of data sources include Advanced Microwave Scanning Radiometer, Earth Observing System and Advanced Scattermeter soil moisture, gravity measurements and Moderate Resolution Imaging Spectroradiometer (MODIS) data. Table 4, modified from McCabe et al. (2017), compiles the most used satellite data to study the water cycle and we detail each of them in sections 3.1 to 3.6.
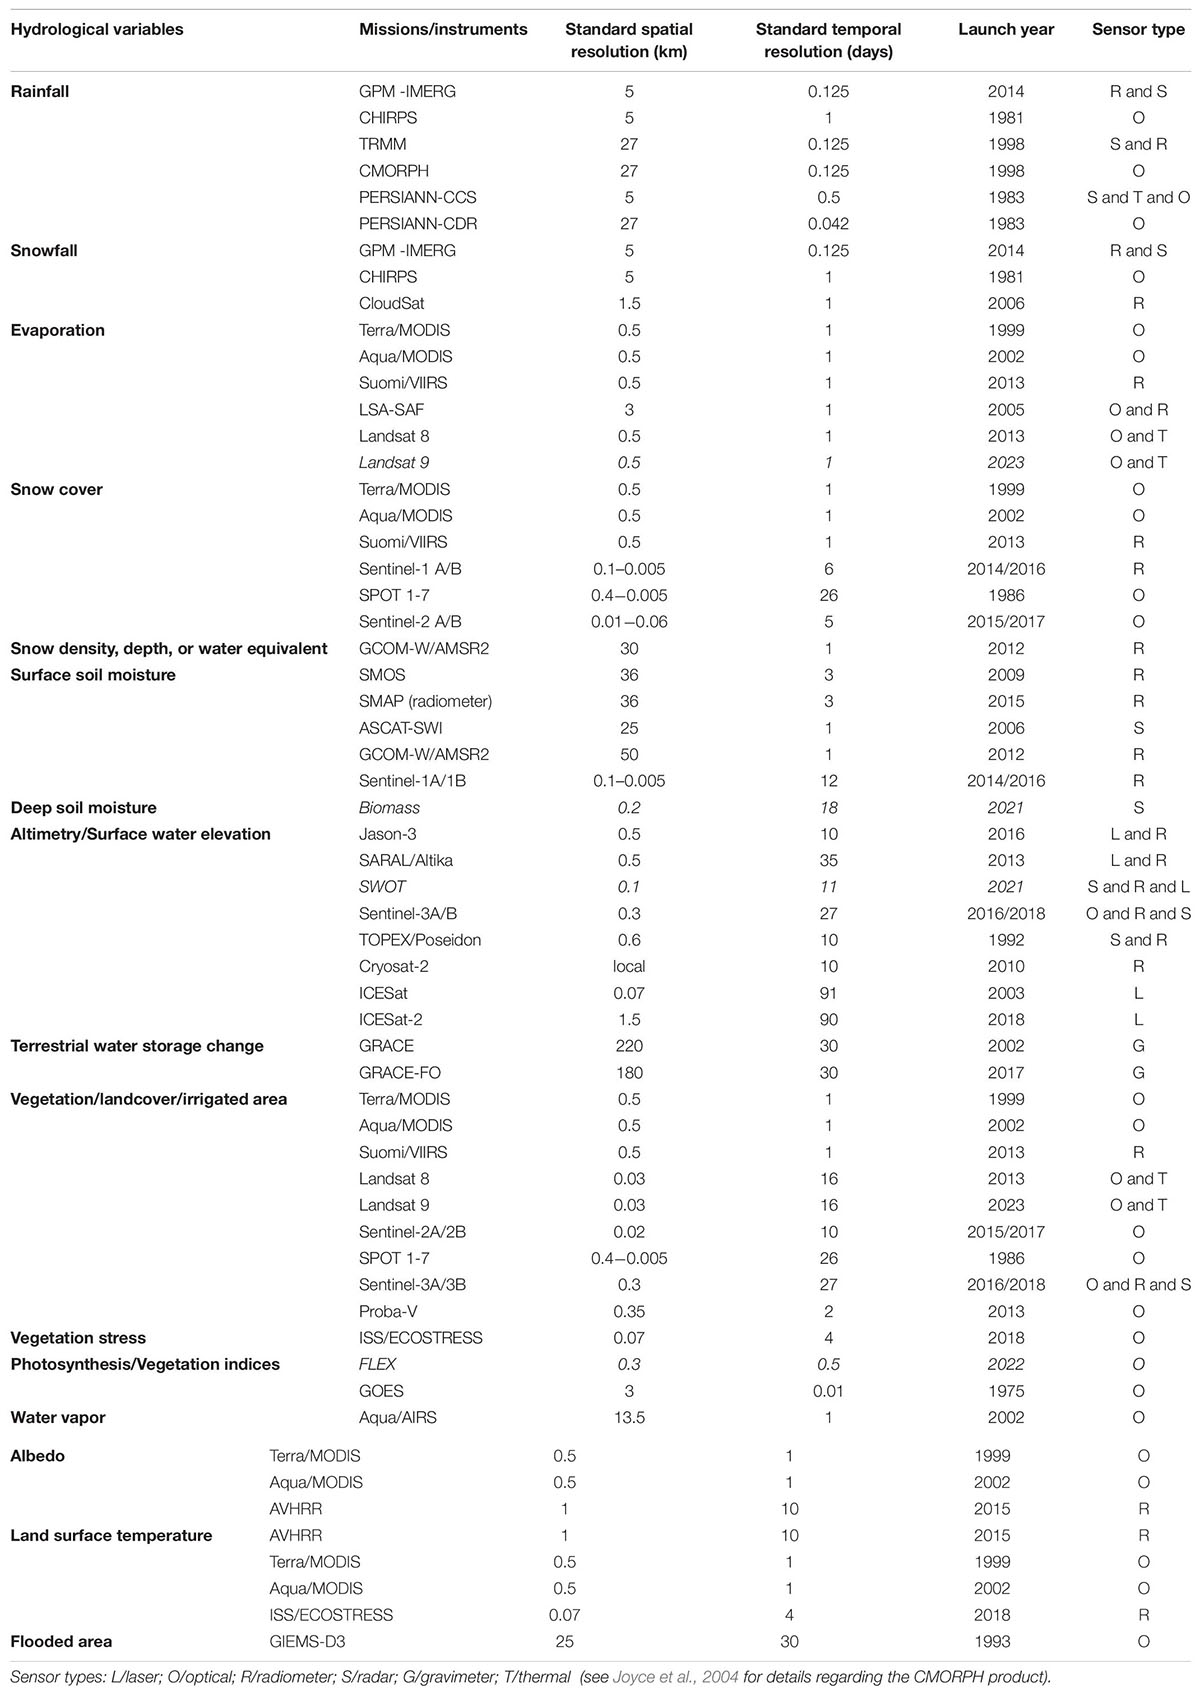
Table 4. (non-exhaustive overview) Hydrological variables corresponding to current and planned (in italic) satellite remote sensing missions.
Details are provided regarding the most used satellite precipitation based products and the MODIS data (Table 5). These devices are on board the Terra (EOS AM-1) and Aqua (EOS PM-1) satellites. Since the early 1990s, they have been producing data on the land, oceans and lower atmosphere. Until now, data time series are available for these variables over a 25 year period, with a spatial resolution from 500 meters to 1 kilometer. Some of the variables measured by these different components are presented in the Table 4.
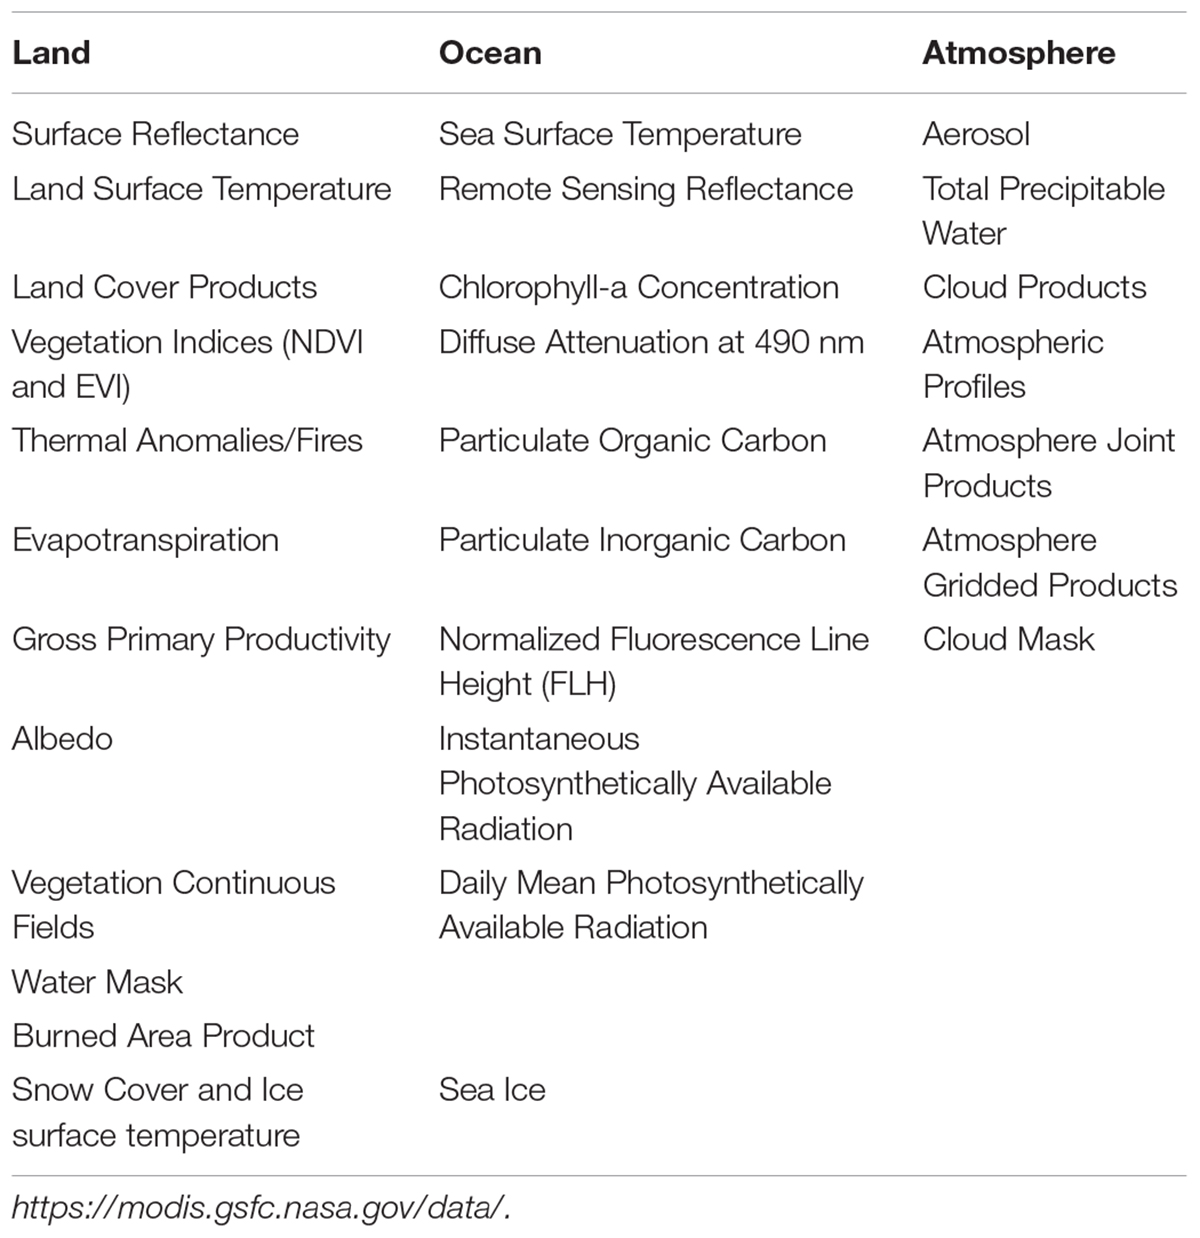
Table 5. Available products from MODIS.
Rainfall, Snowfall, Land Surface Temperature, and Evaporation
Tropical Rainfall Measuring Mission (TRMM) and Global Precipitation Measurement – Integrated Multi-SatellitE Retrievals (GPM – IMERG)
A highly valuable source of data for hydroclimate studies is the Tropical Rainfall Measuring Mission (TRMM), a joint program of the National Aeronautics and Space Administration (NASA) and the Japan Aerospace Exploration Agency (JAXA) (Huffman et al., 2007). The use of a Microwave Sounder Unit (MSU) emplaced in a research satellite, covering tropical and subtropical regions, generated operational data on the total available precipitation. There is 3-hourly data points over a 25-year period with a spatial resolution of 0.5° × 0.5°. There are several versions of TRMM data and many studies have been conducted on the Andes to determine their usefulness for hydrological applications (Collischonn et al., 2008). Depending on the TRMM product, some corrections for the high zones are needed (Condom et al., 2011). A relevant study from Zulkafli et al. (2014) demonstrates the interest of version 7 of the TRMM 3B42 precipitation estimates (or TRMM Multi-satellite Precipitation Analysis – TMPA) as forcing data for hydrological modeling in Andean-Amazon River Basins. The TRMM 3B43-V7 product is also able to reproduce the spatio-temporal variability of the precipitation for the Pacific slope of Ecuador but tends to overestimate the ground observation (Erazo et al., 2018).
In addition, Ochoa et al. (2014) found that for the Pacific-Andean River Basins in Ecuador, TMPA accurately represents the rainfall amounts related to advective-convective precipitation regimes in southern Ecuador. The TMPA data are available on the Precipitation Measurement Mission’s (PMM) web page14. Manz et al. (2017) showed that the Integrated Multi-satellitE Retrievals for GPM (IMERG) has better detection levels and can provide better quantitative rainfall intensity estimates than TMPA (TRMM Multi-satellite Precipitation Analysis), particularly in the high Andes of Ecuador and Peru. However, IMERG did not show any improvement in terms of either rainfall detection or rainfall rate estimation along the dry Peruvian coastline. Another study carried out by Palomino-Angel et al. (2019) aims to evaluate the TRMM-3B42V7 (from 2012 to 2015) and IMERG (from 2014 to 2017) daily precipitation products over the northwestern South America Andean region (Colombia) using in situ observations from 185 rain-gauges. Both products are able to capture the spatial and temporal distribution of the daily mean precipitation however the amounts are biased with an overestimation over the Andes Mountains and an underestimation in areas with medium to low altitudes that also correspond to areas with very high levels of precipitation near the coast of the Pacific Ocean. Over southern South America (Chile/Argentina) Hobouchian et al. (2017) carried out a systematic evaluation of satellite estimates of the daily precipitation in relation to terrain complexity. Over a period of 7 years and using more than 400 in situ weather stations as a reference, they found that CMORPH, TRMM3B42RT (real-time version) and TRMM3B42-V7 (research version) are able to reproduce the spatio-temporal variability of the precipitation with more accurate estimates in the wettest and coldest season (June-July-August). The bias is not the same depending on the altitude with an underestimation at low land elevations and an overestimation at high altitudes. More generally, the best performances of the estimate are found downwind of the terrain. These studies underlined the necessity to evaluate the bias for the different satellite precipitation estimates for each Andean region (from Venezuela to Patagonia) and eventually correct them before using these estimates in hydrological models.
Climate Hazards Group InfraRed Precipitation With Station (CHIRPS)
CHIRPS15 is a global (maximum latitudes of 50°N-50°S) precipitation dataset from 1981 to the present. The dataset is a combination of a climatology developed from predictors of precipitation such as topography, elevation, geography, and estimated precipitation data from meteorological stations and satellites with current in situ data from stations and satellites. The result is a blended gridded dataset with a spatial resolution of 0.05° and temporal resolution of 1 day. The CHIRPS station blending procedure is a modified Inverse Distance Weighting (IDW) algorithm that has several unique characteristics. The first version of these is the use of climatology to define a local decorrelation distance; this distance is where the estimated point-to-point correlation is zero (Funk et al., 2015). This dataset has a rapid preliminary version followed by a final version made available at a slightly later time. The first version is available within a 1 day, while the final version is available sometime after the 15th of the following month. Similar to the GPCC, the limitation of CHIRPS is also the number of stations included in the blended final data, especially for South America. However, as a quasi-global dataset, it can be used to carry out an analysis at a regional scale (Segura et al., 2019).
Precipitation Estimation From Remotely Sensed Information Using Artificial Neural Networks-Climate Data Record (PERSIANN-CDR)
The PERSIAN-CDR16 product is developed in two steps, first by applying a PERSIANN algorithm using an artificial neural network on the Gridded Satellite Infrared Data (GridSat-B1) and secondly by correcting the bias with the 2.5° grid of monthly Global Precipitation Climatology Project (GPCP) (Sorooshian et al., 2000; Ashouri et al., 2015). The final product covers the major part of the world (60°S–60°N), has a daily time-step and has a spatial resolution of 0.25°. The data are available through the Climate Data Record of the National Oceanic and Atmospheric Administration’s (CDR NOAA) website17.
Snowfall
Snowfall estimates are still challenging in mountainous regions. This is particularly true for estimating precipitation from space. Three main satellite estimates can be used to quantify this variable: CHIRPS, GPM-IMERG and CloudSat. In the following part, we will focus on the last two products because CHIRPS has a poor ability of detecting snowfall (Bai et al., 2018). Through its design with a dual-wavelength precipitation radar (DPR) at 13.6 and 35.5 GHz, GPM was designed to have high sensitivity to detect low amounts of precipitation and to discriminate solid precipitation from liquid precipitation (You et al., 2017). For CloudSat, at a global scale, Kulie et al. (2016) propose a separation between the different kinds of clouds generating snowfalls, i.e., shallow cumuliform or nimbostratus clouds. Only a few regions are investigated in detail (e.g., Greenland, inland Russia, among others). As there have been no evaluations comparing this with ground measurements, they conclude that the next steps should be to use reanalysis and ground based observational datasets to identify and quantify the dataset biases. Skofronick-Jackson et al. (2019) compare active and passive snowfall estimates for GPM and CloudSat at the global scale with an exhaustive analysis of the differences arising from classification, sampling, instrumentation and algorithm differences and they propose a unified approach to evaluate the global snowfall datasets. Furthermore, they also concluded that it is necessary to validate the GPM and CloudSat estimates with ground-based observations over contrasting regions and with different kinds of surfaces. At the Andean scale, the problem with this is that such data are scarce. Kidd and Levizzani (2019) recently provide an exhaustive analysis of the Precipitation Estimation from the Earth Observation Satellite. These authors highlight the good accuracy and mention that the resolution (spatial and temporal) is suitable for hydrological modeling and water resource assessment. They also list the future improvements that are needed. The TRMM PR and CloudSat radar systems will be added to the upcoming radars on the GPM-core satellites and the European Space Agency’s Clouds, Aerosol and Radiation Explorer (EarthCare). Finally, to improve the identification and quantification of frozen precipitation, effort should be made to correctly quantify the radiative transfer modified by the snow particles. This would be possible by combining both active and passive radar observations. The high variability of the surface ground state (rugosity, type of soil cover and humidity) will have to be considered.
Land Surface Temperature and Evaporation
In the hydrological cycle, the Land Surface Temperature (LST) is essential for discerning the physical processes occurring on the Earth’s surface at the regional and global scale. The variability of LST is due to soil-surface-atmosphere interactions and is important for environmental studies and water management (Li et al., 2013). More specifically, LST can be used to quantify climate warming. In this context, MODIS LST is commonly used to estimate the air temperature (Zhang et al., 2016b) because Terra and Aqua satellites both pass over land at approximately the same local time each day data and therefore, the data representing the daylight conditions are comparable between days (Mao et al., 2017). Nevertheless, caution should be taken with cloudy scenes because the cloud cover affects the relationship between LST and air temperature (Zhang et al., 2016b). Aguilar-Lome et al. (2019) used MODIS LST on the Andes (between 7 and 20°S) over 2000–2017 period at a resolution of 1 km with monthly data to characterize the regional air temperature trends and determine the altitude dependence. They limit their study to the austral winter (June-July-August) to avoid problems with the clouds. The main conclusions are that, at the regional scale, the temperature trend is positive in most areas with an average rate of 1.0°C/decade and that this increase is dependent on the elevation and is more pronounced for higher elevations. This kind of analysis could be planned for the whole Andean regions as temperature changes affect Andean ecosystems. Basically, the actual evaporation (E) and evapotranspiration (ET) are calculated using the atmospheric states (T°, humidity, wind, etc.), the land cover type (vegetation, bare soil, bare rocks, open water, etc.) and the soil moisture. Three approaches are used to calculate the actual evapotranspiration from remote sensing imagery (Zhang et al., 2016a): (i) Land Surface Temperature Vegetation Index (LST-VI) space methods; (ii) empirical methods; and (iii) Surface Energy Balance (SEB) methods. Chen and Liu (2020) propose a review of these methods and one of their conclusions is the need to improve the regional ET in situ monitoring capacity. Two satellites are mostly used to calculate E and ET: MODIS and Landsat (7 and 8). Olivera-Guerra et al. (2020) propose a simple model to estimate the daily root zone soil moisture as well as ET with Landsat 7 and 8 data and show that the model is suitable at a monthly time scale but has some limits due to the frequency of the Landsat images. MODIS is more suitable at the regional scale and can be used to calculate daily ET (Zou et al., 2020). All of the methods based on remote sensing imagery to estimate ET require a large amount of storage and calculating capacities. New efforts are being made to parallelize the algorithm that can be used on either public or private clouds (Cunha et al., 2020). Furthermore, future requirements to refine the hydrological modeling would include reducing the revisit time satellites that will be launched in the future.
Snow Cover
At high altitudes, snowfall, accumulation and melt are important in the hydrological cycle. Remote sensing data are useful in snow cover evolution estimates and the main satellites for this field are MODIS, VIIRS, SPOT, Landsat and SENTINEL, among others. The major advantage of MODIS is the time step, resolution and duration of the time series that could be use to calculate the climatic trends. For instance, over the 2000–2016 period for the Andes (8 to 36°S), Saavedra et al. (2018) identify a significant rising of the snowline by approximately 10–30 m.y–1 south of 30°S. Concerning the snow persistence (the fraction of time with snow cover for 1 year) over the same period, a distinction should be made between the region situated to the north of 29°S which has limited snow cover and areas found between 29 and 36°S that have significant seasonal snow cover. For this region, the season presents a decrease of 5 days over the period. Malmros et al. (2018) provide details concerning the central Chilean and Argentinean Andes for the same period. They use the MODIS MOD10A1 C6 daily snow product in a hydrological model. The Snow Cover Extent (SCE) and the snow persistence decrease by an average of ± 2% and 43 ± 20 days. Snapir et al. (2019) used a data fusion technique with MODIS and Sentinel-1 data for a huge Himalayan catchment extending 55,000 km2 over ∼2.5 years to characterize the changed in the snow cover area as well as its fraction of wet snow. These kind of data are pertinent as input data to feed hydrological models and will allow to improve runoff analyses (water resources, flood risk, etc.). This methodology could be applied in the Andean region when SENTINEL data are available. For the Andes in Bolivia, Chile and Argentina, Foster et al. (2009) used passive microwave satellite from the Scanning Multichannel Microwave Radiometer for the Nimbus-7 satellite and the Special Sensor Microwave Radiometer of the Defense Meteorological Satellite Program to quantify the snow cover and the snow mass evolutions over the 1979–2006 period. The results identify a significant inter-annual variability for these two variables but, contrary to other studies mentioned above, no long-term trend is detected.
Water Storage in Soils
Soil moisture evolutions and groundwater storage changes are a crucial component of the hydrological cycle and essential for water management. At a large spatial scale, two recent studies aimed to characterize the changes in water storage in the soil using GRACE data (Khaki and Awange, 2019; Ndehedehe and Ferreira, 2020). In the first study, South America is divided into 15 major catchments and the water balance is calculated for each one using a hydrological model at a 3 × 3° spatial resolution and a monthly time step. In this model, the assimilation of GRACE and SMOS data improve the quality of the simulations. Nevertheless, this superior analysis cannot be completed for small mountainous catchments due to low temporal and spatial resolutions. In the second study, the groundwater changes in the floodplain is analyzed in detail but some discrepancies between the simulations and observations in the arid zone highlight the difficulty to quantify complex hydrogeological processes from space where an anthropogenic influence could play an important role.
Vegetation Indices and Land Cover Changes
Land use and land cover change affect regional climate through modifications in the water balance and energy budget. Remote sensing data offer a great opportunity to quantify these changes at the regional scale. For example, MODIS provides time series of vegetation indices (MODIS – VI) and a normalized difference vegetation index at 1 km and 500 m, respectively (Tucker et al., 2005). Huete et al. (2002), demonstrate the performance of these two indices with in situ measurements for the semi-arid grass, shrub, savanna and tropical forest biomes. For small mountainous catchments, some limitations exist due to the relatively low spatial resolution of the products. One possibility is to use the Landsat 5TM, Landsat 7ETM + and Landsat 8 data, as shown by López et al. (2017) which aims to investigate the connections between land use and climate variation at decadal time scale for the Cotopaxi region in Ecuador between 1976 and 2013. On the other hand, Salazar et al. (2015) propose an exhaustive analysis of the land use and land cover change at the continental scale over South America with a link to the climatic variability. The data used, MODIS and Landsat TM, can be used to precisely quantify where severe changes in the region occurred over the past few decades, e.g., the Amazon deforestation, the Chilean Matorral or the Atlantic forest. In the conclusion, they highlight the fact that more studies are needed in order to estimate the changes in non-Amazonian South America and to ascertain the link with the duration and intensity of climate extremes.
Data Produced by Re-Analysis and Modeling
Reanalysis is a systematic approach to produce datasets for climate monitoring and this option can be used in hydroclimatic studies (Van den Hurk, 2012). Reanalysis are created by processing observational data with an assimilation scheme and by models, which ingest all available observations every 3–6–12 h over the period being analyzed. Produced data in a grid for a given spatial resolution provides a dynamically consistent estimate of the climate state at each time step. However, it is necessary to know the technical specifications and to be aware of the limitations (Parker, 2016). The main reanalysis products are detailed in the following section (see Sun et al., 2018 for an exhaustive list).
European Centre for Medium-Range Weather Forecast (ECMWF; ERA-Interim and ERA5 Data)
The European Centre uses its forecast systems to generate global data sets for the atmosphere, land, surface and oceans. The reanalysis data highlighted for this institution are ERA-Interim and ERA5 data. ERA-INTERIM are global atmospheric data with a 6-h analysis window, a spatial resolution of approximately 80 km and a time period of 1979–2019. These reanalysis products are updated once a month with a delay of 2 months to guarantee quality and to correct any possible technical problems. In 2017, a new version of the ECMWF reanalysis data (ERA5) was released, with a spatial resolution of 30 × 30 km and with improved data quality, which includes information about uncertainties for all variables. Compared with ERA-Interim data, this new data has a higher spatial and temporal resolution, a better tropospheric description, a better global balance between precipitation and evaporation, better precipitation over land and in the tropical zone, better soil moisture and more consistent Sea Surface Temperature and sea ice. It also covers a longer time from 1950 until the present. ERA5 data will eventually replace ERA-Interim and uncertainty estimate for ERA5 can be found in Laloyaux et al. (2018). These data can be downloaded on the Copernicus webpage18.
NCEP/NCAR Reanalysis 1 Project
The NCEP/NCAR reanalysis is available from 1948 to the present with a temporal resolution equal to 6 h intervals. This reanalysis is produced by an analysis/forecast system with the assimilation of in situ data. However, the data from 1948 to 1957 are different compared with the rest of the time series due to time step differences. The data and related technical specifications can be found on the PSD webpage19.
JRA-55 Japanese Reanalysis
The Japanese global atmospheric reanalysis project covers 55 years, extending back to 1958. The data were produced in a regular latitude-longitude Gaussian grid (320 latitudes by 640 longitudes, nominally 0.56 degree). For detailed information about this project, see Kobayashi et al. (2015). JRA-55 data and technical information can be consulted on the University Corporation for Atmospheric Research (UCAR) webpage20.
Multi-Source Weighted-Ensemble Precipitation (MSWEP)
Another important precipitation dataset developed for hydrology is the Multi-Source Weighted-Ensemble Precipitation (MSWEP; Beck et al., 2017). The latest version of MSWEP provides a fully global historic precipitation dataset (1979–2017) with a 3-hourly temporal and 0.1° spatial resolution. The key feature of the MSWEP product is that it provides a precipitation estimate worldwide merging seven complementary precipitation estimates with three satellite remote sensing, two gauge observations and two atmospheric reanalysis datasets. For each grid cell, the weight assigned to the gauge-based estimates is calculated from the gauge network density, while the weights assigned to the satellite and reanalysis based estimates are calculated from their comparative performance at the surrounding gauges21.
The long-term mean of MSWEP is based on Climate Hazards Group’s Precipitation Climatology (CHPclim) dataset. It includes also a correction for gauge under-catch and orographic effects.
Modern-Era Retrospective Analysis for Research and Applications Version 2 (MERRA-2)
The MERRA-2 product, provided by the NASA’s Global Modeling and Assimilation Office (GMAO), has a spatial resolution of 50 km, an hourly temporal resolution, and is available from 1980 to the present. Assimilation observation types (GPS-Radio, GEOS model, among others) are assimilated into MERRA-2. Data are available at the Goddard Space Flight Center22 and detailed information concerning this product can be found in Gelaro et al. (2017).
Global Land Evaporation Amsterdam Model (GLEAM v3)
GLEAM is a set of algorithms that separately estimate the different components of land evaporation at the global scale. The eight products are: (i) transpiration, (ii) bare-soil evaporation, (iii) interception loss, (iv) open-water evaporation, (v) sublimation, (vi) surface and root-zone soil moisture, (vii) potential evaporation, and (viii) evaporative stress conditions. Basically, the algorithm, based on the Priestley and Taylor equation, uses observations of surface net radiation and near-surface air temperature to calculate the potential evaporation of the tall and short canopy and the land fractions of bare soil. Then, these potential evaporation estimates are converted into actual evaporation using a multiplicative evaporative stress factor based on observations of microwave Vegetation Optical Depth (VOD) and estimates of root-zone soil moisture. Two recent products are available at daily resolution and 25 km spatial resolution: GLEAM v3.3a (1980–2018 period) and GLEAM v3.3b (2003–2018), which are mainly based on satellite data. Some limitations are inherent to this kind of global product for mountainous regions due to the spatial resolution and the limited knowledge of the soil properties. Details concerning the data can be found in Miralles et al. (2011) and Martens et al. (2017) and data can be download on the GLEAM website23.
Physiographic and Morpho-Topographic Data
Several global and open datasets are available to estimate physiographic data relevant for hydrology. Recently, land cover and land use data with a 30-meter resolution was released by the Global Land Cover Characterization (GLCC) Project. This land cover map is one of the best available open datasets. GLCC is based on 1-year Advanced Very High Resolution Radiometer (AVHRR) using an unsupervised classification. Data are available on the GISGeography webpage24. Simultaneously, most of the physiographic catchment characteristics can be estimated from the European Space Agency (ESA) Climate Change Initiative (CCI) program or from the NASA among others. The global databases cover the principal physical controlling factors of the hydrological cycle with land cover characteristics, soils properties, glaciers, water bodies (lakes, rivers, etc.) and flooded areas. These databases are listed in Table 6 (non-exhaustive list).
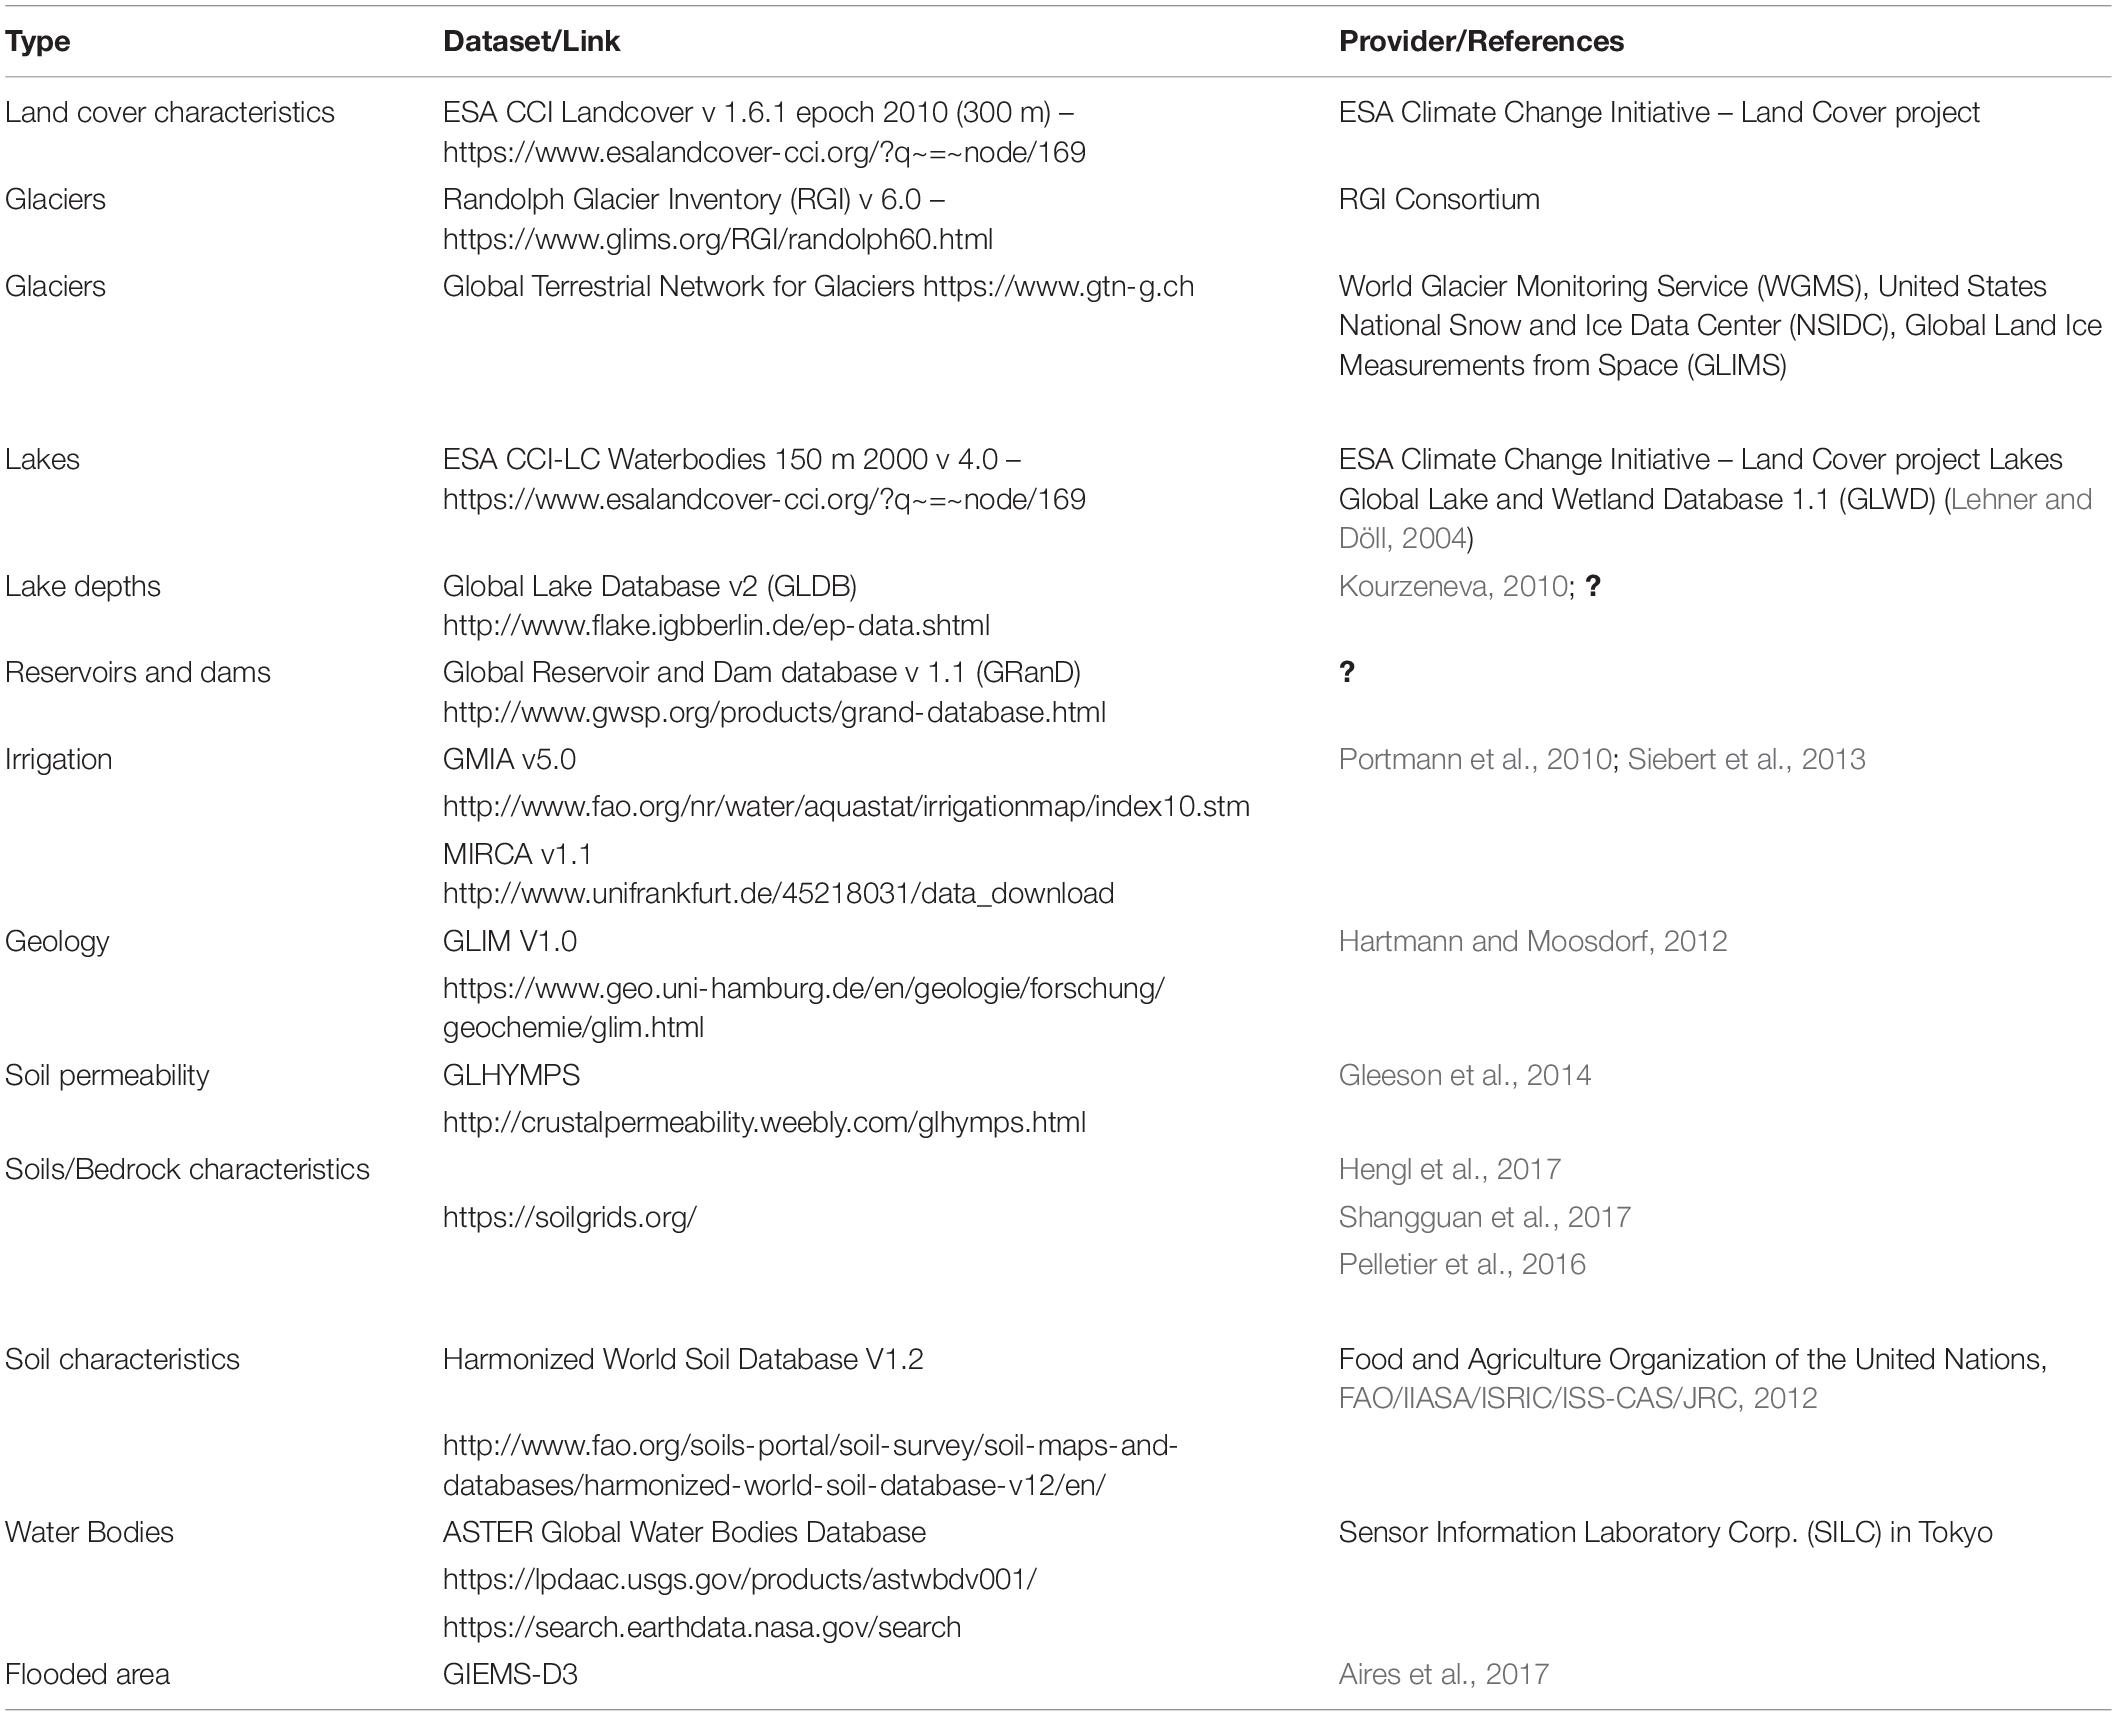
Table 6. Datasets available for the physiographic data estimation.
In addition, Digital Elevation Models (DEM) are crucial in climatological and hydrological studies; they can be used to delineate the catchment limits, to determine flow routings, aspects, etc. The most common DEMs are: (i) the Global Digital Elevation Model - GDEM v2, with a resolution of 30 m; (ii) the Shuttle Radar Topographic Mission - SRTM v4 with a resolution of 90 m (Satgé et al., 2015); (iii) the JAXA’s Global ALOS 3D world with a resolution of 30m; and (iv) the TanDEM-X DEM with a resolution of 12 m distributed by the German Aerospace Center DLR3. Since 2010, higher spatial resolution DEMs at the decimetric scale can be obtained with the Pleiades satellites. In addition, the Global Width Database for Large Rivers (GWD-LR) with a resolution of three arcseconds (Yamazaki et al., 2014) can be used for flow routing.
Knowledge Gaps and Next Steps
A recent evaluation of multiple satellite products in Chile reported that CHIRPS and MSWEP data are quite promising when compared with other satellite-based rainfall estimates. CHIRPSv2 was found to be the best performing SRE and is recommended for use in hydrology because it has a low latency (1 day–3 weeks, depending on the product), a long data record (1981-present), and high spatial resolution (0.05°). The MSWEP also performed well, particularly in southern Chile. In contrast, an adjusted version of PERSIANN for Chile, the PERSIANN-CCS-Adj, near real-time data was considered to be less suitable for use in hydrological applications due to large biases when validated against observations. This is probably due to the fact that it has been corrected using only the regional climatology (Zambrano-Bigiarini et al., 2017). Another recent study compared and evaluated 12 different satellite-based precipitation products with gauges measurements in the central Andes (71°W–68°W/14°S–17°S) and used these products for the hydrological modeling of four mountainous catchments (Satgé et al., 2019). These authors identified CHIRP v.2, CHIRPS v.2, CMORPH-BLD v.1, MSWEP v2.1, PERSIANN-CDR, and TMPA-Adj v.7 as the best products for a good representation of the hydrological processes. This region-specific methodology could be extended to other Andean regions in order to see if the same ranking between the different products exists along the Andes. More generally, other initiatives exist, with different regional high-resolution data-sets produced within the framework of research projects and experimental field campaigns (Poveda et al., 2007; Nunes, 2012).
It is still challenging to study precipitation in a mountainous context not only because of the frequency and intensity needed but also due to the partitioning between solid and liquid precipitation. It is difficult to quantify precipitation due to the complex terrain, high altitudes, large climatic gradients and both sparse and scarce data.
One way to address the complexity of spatio-temporal patterns is to use dynamical downscaling in global climate models for South America as done in the CORDEX/CLARIS project (Solman, 2013). It is also possible to use the Weather Research Forecast Model (WRF) as done in the study by Armenta-Porras and Pabón Caicedo (2016) where a data-set of meteorological and hydrological variables was produced for the northern Andes at a horizontal resolution of 10 × 10 kilometers, over 39 levels, and a 3-hourly time step. Finally this kind of Regional Climate Model can be used to describe the spatio-temporal variability of the precipitation, the orography taking into account (Trachte et al., 2018); however any biases should be corrected before using these data in hydro-glaciological models (Mourre et al., 2016). A recent atmospheric modeling framework was proposed over the Himalayas and Middle Eastern mountains at the kilometer scale and can be used to reproduce the effect of the orography on atmospheric flow (Van Niekerk et al., 2018). This kind of methodology could guide future studies at the scale of the Andes. To date, the development of precipitation products tends to combine the strengths of multiple and complementary data sources: gauge, satellite and reanalysis-based data, as well as model simulations in order to produce reliable precipitation estimates (Heredia et al., 2018). Combined products with local weather stations and TRMM data can also integrate the normalized difference vegetation index as shown by Yarleque et al. (2016) in the Peruvian Andes.
Conclusion and Perspectives
Despite the asymmetries among countries and capabilities in the Andean region, there is strong evidence of increasing observational capacity and data availability. However, in several meetings of the RA III (WMO, 2018), the NMHS identified that some of the current limitations on weather and climate prediction are related with the limited understanding of the physical processes that define weather and climate in particular regions. Data availability could be increased by identifying and prioritizing scientific questions so that a sound research agenda for the region can be put into place where the NMHSs would acquire the data and sent it to the OSCAR database. Since one of the main challenges in the region is the sustainability of the observations networks and the increase in available data for applications and research, potential activities should be focused on promoting and facilitating meeting points between the operational community represented by the NMHS and the scientific community in the region. ANDEX could be a suitable opportunity to foster this approach in order to discuss all together the relevance and urgent need to address the societal needs, save lives, reduce the adverse impacts of hydrometeorological hazards and adapt to a changing climate. This is particularly challenging in the Andean region where many scientific questions are still open with the subsequent impact on prediction and early warnings limitations.
The international context provides a unique opportunity to moving forward. The new WCRP Strategic Plan 2019–2029, the recently approved WMO Strategy and the current reform in the organization aim to promote a better and more efficient interaction between the operational and research communities with a strong focus in the regions. The current Regional Climate centers operating in South America: CIIFEN/RCC-WSA and RCC-SSA are suitable infrastructures which could be used by ANDEX to work together and foster hydroclimate research. It is highly recommended to meet the operational and the research community to work together and demonstrate the relevance of ANDEX to the Governments and funding agencies. This will help maintain and enhance the NMHS’s capabilities and will help obtain the necessary funding to foster research activities in this field. Considering the increasing GSM network, future efforts should be made to obtain more remote data transmission. This would be a prerequisite for near-real time forecasts in climatology and hydrology. Data on the physical processes involved in the climatological processes in mountainous regions could be improved if there were more radiosondes in the area. In addition, from a hydrological point of view, scientific programs could focus on a better understanding of groundwater and water use data as this is crucial in the hydrological cycle but is still poorly known.
Notes
(1) OSCAR – https://www.wmo-sat.info/oscar/
(2) GSN – https://gcos.wmo.int/en/networks/atmospheric/gsn
(3) CLIMAT – https://library.wmo.int/index.php?lvl=notice_display&id=11989
(4) GPCC data – https://opendata.dwd.de/climate_environment/GPCC/html/download_gate.html
(5) University of Wyoming – http://weather.uwyo.edu/upperair/sounding.html
(6) WHOS – http://www.wmo.int/pages/prog/hwrp/chy/whos/index.php
(7) http://www.cr2.cl/bases-de-datos/
(8) GRDC – https://www.bafg.de/GRDC/EN/Home/homepage_node.html
(9) GCW – https://globalcryospherewatch.org/
(10) RCC-WSA http://crc-osa.ciifen.org
(11) CIIFEN – www.ciifen.org
(12) RCC-SSA – www.crc-sas.org/
(13) LACA&D – http://lacad.ciifen.org/
(14) PMM – https://pmm.nasa.gov/data-access/downloads/trmm
(15) CHIRPS – https://earlywarning.usgs.gov/fews/datadownloads/Global/CHIRPS%202.0
(16) PERSIAN-CDR – www.ncdc.noaa.gov/cdr/operationalcdrs.html
(17) CDR NOAA – https://www.ncdc.noaa.gov/cdr/atmospheric/precipitation-persiann-cdr
(18) Copernicus webpage – https://www.ecmwf.int/en/forecasts/datasets/browse-reanalysis-datasets
(19) PSD webpage – https://www.esrl.noaa.gov/psd/data/gridded/data.ncep.reanalysis.html
(20) University Corporation for Atmospheric Research webpage – https://rda.ucar.edu/datasets/ds628.0/
(21) Multi-Source Weighted-Ensemble Precipitation – http://www.gloh2o.org/
(22) Modern-Era Retrospective analysis for Research and Applications version 2 – https://gmao.gsfc.nasa.gov/reanalysis/MERRA-2/
(23) GLEAM v3 – https://www.gleam.eu/
(24) GISGeography webpage – https://gisgeography.com/free-global-land-cover-land-use-data/
Author Contributions
RM requested station data from the NMHSs in Bolivia, Colombia, Chile, Ecuador, Peru, Venezuela, and Argentina. He also analyzed the collected data. JP helped describe the hydrological data and the hydrometeorological Andean network. FC incorporated and described the OSCAR data. FL generated the maps with GIS processing. LP, TC, and JN incorporated the satellite information and physiographic datasets used in hydrology. All of the authors helped writing the article.
Conflict of Interest
The authors declare that the research was conducted in the absence of any commercial or financial relationships that could be construed as a potential conflict of interest.
Funding
This review paper has been achieved as part of the ANDEX program (www.gewex.org/project/andex/), which is a prospective Regional Hydroclimate Project (RHP) of the GEWEX Hydroclimatology Panel (GHP). This study was supported by the ‘Centro Internacional para la Investigación del Fenómeno de El Niño,’ the ‘Universidad Nacional de Colombia,’ the ‘Universidad Yachay Tech,’ the ‘Escuela Politécnica Nacional,’ and the French ‘Institut de Recherche pour le Développement’ (IRD) through the Andean part of the French glacier observatory service, GLACIOCLIM (https://glacioclim.osug.fr/spip.php?rubrique30&lang=en). It was conducted in the framework of the International Joint Laboratory GREAT-ICE, a joint initiative of the IRD and universities and institutions in Bolivia, Peru, Ecuador, and Colombia.
Acknowledgments
All the contributing authors acknowledge the contribution of NMHSs of Bolivia, Chile, Colombia, Ecuador, Peru, Venezuela, and Argentina.
Footnotes
References
Aguilar-Lome, J., Espinoza-Villar, R., Espinoza, J. C., Rojas-Acuña, J., Willems, B. L., and Leyva-Molina, W. M. (2019). Elevation-dependent warming of land surface temperatures in the Andes assessed using MODIS LST time series (2000-2017). Int. J. Appl. Earth Obs. Geoinform. 77, 119–128. doi: 10.1016/j.jag.2018.12.013
Aires, F., Miolane, L., Prigent, C., Pham, B., Fluet-Chouinard, E., Lehner, B., et al. (2017). A global dynamic long-term inundation extent dataset at high spatial resolution derived through downscaling of satellite observations. J. Hydrometeorol. 18, 1305–1325. doi: 10.1175/JHM-D-16-0155.1
Armenta-Porras, G. E., and Pabón Caicedo, J. D. (2016). “Producing high spatial resolution climate scenarios for tropical America using WRF model,” in Proceedings of the International Conference on Regional Climate CORDEX-2016, Stockholm, 197.
Ashouri, H., Hsu, K. L., Sorooshian, S., Braithwaite, D. K., Knapp, K. R., Cecil, L. D., et al. (2015). PERSIANN-CDR: daily precipitation climate data record from multisatellite observations for hydrological and climate studies. Bull Ame.Meteorol. Soc. 96, 69–83.
Bai, L., Shi, C., Li, L., Yang, Y., and Wu, J. (2018). Accuracy of chirps satellite-rainfall products over Mainland China. Remote Sens. 10:362. doi: 10.3390/rs10030362
Beck, H. E., van Dijk, A. I. J. M., Levizzani, V., Schellekens, J., Miralles, D. G., Martens, B., et al. (2017). MSWEP: 3-hourly 0.25° global gridded precipitation (1979–2015) by merging gauge, satellite, and 771 reanalysis data. Hydrol. Earth Syst. Sci. 21, 589–615. doi: 10.5194/hess-21-589-2017
Celleri, R., Buytaert, W., De Bièvre, B., Tobón, C., Crespo, P., Molina, J., et al. (2010). “Understanding the hydrology of tropical andean ecosystems through an andean network of basins,” In: Status and Perspectives of Hydrology in Small Basins Proceedings of the Workshop held at Goslar-Hahnenklee, Germany: IAHS Publ. 336, 209–212.
Chen, J. M., and Liu, J. (2020). Evolution of evapotranspiration models using thermal and shortwave remote sensing data. Remote Sens. Environ. 237:111594. doi: 10.1016/j.rse.2019.111594
Chen, L., and Wang, L. (2018). Recent advance in earth observation big data for hydrology. Big Earth Data 2, 86–107. doi: 10.1080/20964471.2018.1435072
Choulga, M., Kourzeneva, E., Zakharova, E., and Doganovsky, A. (2014). Estimation of the mean depth of boreal lakes for use in numerical weather prediction and climate modelling. Tellus A: Dyn. Meteorol. Oceanogr. 66:1. doi: 10.3402/tellusa.v66.21295
Collischonn, B., Coollischonn, W., and Tucci, C. E. M. (2008). Daily hydrological modeling in the Amazon basin using TRMM rainfall estimates. J. Hydrol. 360, 207–216.
Condom, T., Rau, P., and Espinoza, J. C. (2011). Correction of TRMM 3B43 monthly precipitation data over the mountainous areas of Peru during the period 1998–2007. Hydrol. Process. 25, 1924–1933.
Cunha, J., Pereira, T. E., Pereira, E., Rufino, I., Galvão, C., Valente, F., et al. (2020). A high-throughput shared service to estimate evapotranspiration using Landsat imagery. Comput. Geosci. 134. doi: 10.1016/j.cageo.2019.104341
Derin, Y., and Yilmaz, K. K. (2014). Evaluation of multiple satellite-based precipitation products over complex topography. J. Hydrometeorol. 15, 1498–1516.
Erazo, B., Bourrel, L., Frappart, F., Chimbrazo, O., Labat, D., Dominguez-Granda, L., et al. (2018). Validation of satellite estimates (tropical rainfall measuring mission, TRMM) for rainfall variability over the pacific slope and coast of ecuador. Water 10:213. doi: 10.3390/w10020213
Foster, J. L., Hall, D. K., Kelly, R. E. J., and Chiu, L. (2009). Seasonal snow extent and snow mass in South America using SMMR and SSM/I passive microwave data (1979–2006). Remote Sens. Environ. 113, 291–305. doi: 10.1016/j.rse.2008.09.010
Funk, C., Peterson, P., Landsfeld, M., Pedreros, D., Verdin, J., Shukla, S., et al. (2015). The climate hazards infrared precipitation with stations—a new environmental record for monitoring extremes. Sci. Data 2:150066. doi: 10.1038/sdata.2015.66
Garreaud, R. D., Vuille, M., Compagnucci, R., and Marengo, J. (2009). Present-day South American climate. Palaeogeogr. Palaeoclimatol. Palaeoecol. 281, 180–195.
Gelaro, R., McCarty, W., Suárez, M. J., Todling, R., Molod, A., Takacs, L., et al. (2017). The modern-era retrospective analysis for research and applications, version 2 (MERRA-2). J. Clim. 30, 5419–5454.
Gleeson, T., Moosdorf, N., Hartmann, J., and van Beek, L. P. H. (2014). A glimpse beneath earth’s surface: global hydrogeology MaPS (GLHYMPS) of permeability and porosity. Geophys. Res. Lett. 41:GL059856. doi: 10.1002/2014gl059856pdf
Hartmann, J., and Moosdorf, N. (2012). The new global lithological map database GLiM: a representation of rock properties at the Earth surface. Geochem. Geophys. Geosys. 13:Q12004. doi: 10.1029/2012GC004370
Hengl, T., Mendes, de Jesus, J., Heuvelink, G. B. M., Ruiperez Gonzalez, M., Kilibarda, M., et al. (2017). SoilGrids250m: global gridded soil information based on machine learning. PLoS One 12:e0169748. doi: 10.1371/journal.pone.0169748
Heredia, M. B., Junquas, C., Prieur, C., and Condom, T. (2018). New Statistical Methodologies of precipitation bias correction applied to WRF model simulations in the antisana region (Ecuador). J. Hydrometeorol. 19, 2021–2040. doi: 10.1175/JHM-D-18-0032.1
Hobouchian, M. P., Salio, P., Skabar, Y. G., Vila, D., and Garreaud, R. (2017). Assessment of satellite precipitation estimates over the slopes of the subtropical Andes. Atmosph. Res. 190, 43–54. doi: 10.1016/j.atmosres.2017.02.006
Huete, A., Didan, K., Miura, T., Rodriguez, E. P., Gao, X., and Ferreira, L. G. (2002). Overview of the radiometric and biophysical performance of the MODIS vegetation índices. Remote Sens. Environ. 83, 195–213.
Huffman, G. J., Bolvin, D. T., Nelkin, E. J., Wolff, D. B., Adler, R. F., Gu, G., et al. (2007). The TRMM Multisatellite Precipitation Analysis (TMPA): quasi-global, multiyear, combined-sensor precipitation estimates at fine scales. J. Hydrometeorol. 8, 38–55.
Joyce, R., Janowiak, J. E., Arkin, P. A., and Xie, P. (2004). CMORPH : a method that produces global precipitation estimates from passive microwave and infrared data at high spatial and temporal resolution. J. Hydrometeorol. 5, 487–503. doi: 10.1175/1525-7541(2004)005<0487:CAMTPG>2.0.CO;2
Khaki, M., and Awange, J. (2019). Improved remotely sensed satellite products for studying Lake Victoria’s water storage changes. Sci. Total Environ. 652, 915–926. doi: 10.1016/j.scitotenv.2018.10.279
Kidd, C., and Levizzani, V. (2019). “Chapter one – quantitative estimation from satellite observations, book chapter,” in Extreme Hydroclimatic Events and Multivariate Hazards in a Changing Environment, eds V. Maggioni and C. Massari (Amsterdam: Elsevier), 3–19.
Kobayashi, S., Ota, Y., Harada, Y., Ebita, A., Moriya, M., Onoda, H., et al. (2015). The JRA-55 reanalysis: general specifications and basic characteristics. J. Met. Soc. Jap. 93, 5–48. doi: 10.2151/jmsj.2015-001
Kourzeneva, E. (2010). External data for lake parameterization in numerical weather prediction and climate modeling. Boreal Environ. Res. 15, 165–177.
Kulie, M. S., Milani, L., Wood, N. B., Tushaus, S. A., Bennartz, R., and L’Ecuyer, T. S. (2016). A shallow cumuliform snowfall census using spaceborne radar. J. Hydrometeor. 17, 1261–1279. doi: 10.1175/JHM-D-15-0123.1
Laloyaux, P., de Boisseson, E., Balmaseda, M., Bidlot, J., Broennimann, S., Buizza, R., et al. (2018). CERA-20C: a coupled reanalysis of the twentieth century. J. Adv. Model. Earth Syst. 10, 1172–1195. doi: 10.1029/2018MS001273
Lehner, B., and Döll, P. (2004). Development and validation of a global database of lakes, reservoirs and 879 wetlands. J. Hydrol. 296, 1–22. doi: 10.1016/j.jhydrol.2004.03.028
Lehner, B., Reidy Liermann, C., Revenga, C., Vorosmarty, C., Fekete, B., Crouzet, P., et al. (2011). Global Reservoir and Dam Database, Version 1 (GRanDv1): Dams, Revision 01. Palisades, NY: NASA Socioeconomic Data and Applications Center (SEDAC). Available online at: https://doi.org/10.7927/H4N877QK
Li, Z., Tang, H., Wu, H., Ren, H., Yan, G., Wan, Z., et al. (2013). Satellite derived land surface temperature: current status and perspectives. Remote Sens. Environ. 131, 14–37.
López, S., Wright, C., and Costanza, P. (2017). Environmental change in the equatorial Andes: linking climate, land use, and land cover transformations. Remote Sens., Appl. Soc. Environ. 8, 291–303. doi: 10.1016/j.rsase.2016.11.001
Malmros, J. K., Mernild, S. H., Wilson, R., Tagesson, T., and Fensholt, R. (2018). Snow cover and snow albedo changes in the central andes of chile and argentina from daily MODIS observations (2000–2016). Remote Sens. Environ. 209, 240–252. doi: 10.1016/j.rse.2018.02.072
Manz, B., Páez-Bimos, S., Horna, N., Buytaert, W., Ochoa-Tocachi, B., Lavado-Casimiro, W., et al. (2017). Comparative ground validation of IMERG and TMPA at variable spatiotemporal scales in the tropical andes. J. Hydrometeor. 18, 2469–2489. doi: 10.1175/JHM-D-16-0277.1
Mao, K. B., Ma, Y., Tan, X. A., Shen, X. Y., Liu, G., Li, Z. L., et al. (2017). Global surface temperature change analysis based on MODIS data in recent twelve years. Adv. Space Res. 59, 503–512.
Martens, B., Miralles, D. G., Lievens, H., van der Schalie, R., de Jeu, R. A. M., Fernández-Prieto, D., et al. (2017). GLEAM v3: satellite-based land evaporation and root-zone soil moisture. Geosci. Model Dev. 10, 1903–1925. doi: 10.5194/gmd-10-1903-2017
McCabe, M. F., Rodell, M., Alsdorf, D. E., Miralles, D. G., Uijlenhoet, R., Wagner, W., et al. (2017). The future of Earth observation in hydrology. Hydrol. Earth Syst. Sci. 21, 3879–3914. doi: 10.5194/hess-21-3879-2017
Miralles, D. G., Holmes, T. R. H., de Jeu, R. A. M., Gash, J. H., Meesters, A. G. C. A., and Dolman, A. J. (2011). Global land-surface evaporation estimated from satellite-based observations. Hydrol. Earth Syst. Sci. 15, 453–469. doi: 10.5194/hess-15-45.
Mourre, L., Condom, T., Junquas, C., Lebel, T., Sicart, J.-E., Figueroa, R., et al. (2016). Spatio-temporal assessment of WRF, TRMM and in situ precipitation data in a tropical mountain environment (Cordillera Blanca, Peru). Hydrol. Earth Syst. Sci. 20, 125–141.
Ndehedehe, C. E., and Ferreira, V. G. (2020). Assessing land water storage dynamics over South America. J. Hydrol. 580:124339. doi: 10.1016/j.jhydrol.2019.124339
Nijzink, R. C., Almeida, S., Pechlivanidis, I. G., Capell, R., Gustafssons, D., Arheimer, B., et al. (2018). Constraining conceptuel hydrological models with multiple information sources. Water Ressour. Res. 54, 8332–8362. doi: 10.1029/2017WR021895
Nunes, A. (2012). Regional Reanalysis for Climate Research Applications: South American Hydroclimate Reconstruction. Geneva: Gewex News.
Ochoa, A., Pineda, L., Crespo, P., and Willems, P. (2014). Evaluation of TRMM 3B42 precipitation estimates and WRF retrospective precipitation simulation over the Pacific–Andean region of Ecuador and Peru. Hydrol. Earth Syst. Sci. 18, 3179–3193. doi: 10.5194/hess-18-3179-2014
Ochoa-Tocachi, B. F., Buytaert, W., Antiporta, J., Acosta, L., Bardales, J. D., Célleri, R., et al. (2018). High-resolution hydrometeorological data from a network of headwater catchments in the tropical Andes. Sci. Data 5:180080. doi: 10.1038/sdata.2018.80
Ochoa-Tocachi, B. F., Buytaert, W., and De Bièvre, B. (2017). “Chapter 6: participatory monitoring of the impact of watershed interventions in the tropical andes,” in Andean Hydrology, eds D. A. Rivera, A. Godoy-Faundez, and M. Lillo Saavedra (Taylor: CRC Press), 126–163.
Olivera-Guerra, L., Merlin, O., and Er-Raki, S. (2020). Irrigation retrieval from Landsat optical/thermal data integrated into a crop water balance model: a case study over winter wheat fields in a semi-arid region. Remote Sens. Environ. 239:111627. doi: 10.1016/j.rse.2019.111627.b
Palomino-Angel, S., Anaya-Acevedo, J. A., and Botero, B. A. (2019). Evaluation of 3B42V7 and IMERG daily-precipitation products for a very high-precipitation region in northwestern South America. Atmos. Res. 217, 37–48. doi: 10.1016/j.atmosres.2018.10.012
Parker, W. S. (2016). Reanalysis and observations: what’s the difference? Am. Met. Soc. 97, 1565–1572. doi: 10.1175/BAMS-D-14-00226.1
Pelletier, J. D., Broxton, P. D., Hazenberg, P., Zeng, X., Troch, P. A., Niu, G. Y., et al. (2016). A gridded global data set of soil, immobile regolith, and sedimentary deposit thicknesses for regional and global land surface modeling. J. Adva. Model., Earth Sys. 8, 41–65.
Perry, B., Seimon, A., and Kelly, G. M. (2014). Precipitation delivery in the tropical high Andes of southern Peru: new findings and paleoclimatic implications. Inte. J. Climatol. 34, 197–215.
Portmann, F. T., Siebert, S., and Döll, P. (2010). MIRCA2000 – Global monthly irrigated and rainfed 925 crop areas around the year 2000: a new high-resolution data set for agricultural and hydrological 926 modeling. Global. Bio. Cycles 24:GB1011.
Poveda, G., Mesa, O. J., Vélez, J. I, Mantilla, L., Ramirez, J. L., Hernández, O. O., et al. (2007). HidroSIG: an interactive digital atlas of Colombia’s hydro-climatology. J. Hydroinform. 9, 145–156.
Saavedra, F. A., Kampf, S. K., Fassnacht, S. R., and Sibold, J. S. (2018). Changes in andes snow cover from MODIS data, 2000–2016. Cryosphere 12, 1027–1046.
Salazar, A., Baldi, G., Hirota, M., Syktus, J., and McAlpine, C. (2015). Land use and land cover change impacts on the regional climate of non-Amazonian South America: a review. Global Planet. Change 128, 103–119. doi: 10.1016/j.gloplacha.2015.02.009
Sarricolea, P., Herrera-Ossandon, M., and Meseguer-Ruiz, O. (2017). Climatic regionalisation of continental Chile. J. Maps 13, 66–73. doi: 10.1080/17445647.2016.1259592
Satgé, F., Bonnet, M. P., Timouk, F., Calmant, S., Pillco, R., Molina, J., et al. (2015). Accuracy assessment of SRTM v4 and ASTER GDEM v2 over the Altiplano watershed using ICESat/GLAS data. Int. J. Remote Sens. 36, 465–488. doi: 10.1080/01431161.2014.999166
Satgé, F., Ruelland, D., Bonnet, M. P., Molina, J., and Pillco, R. (2019). Consistency of satellite-based precipitation products in space and over time compared with gauge observations and snow-hydrological modelling in the Lake Titicaca region. Hydrol. Earth Syst. Sci. 23, 595–619. doi: 10.5194/hess-23-595-2019
Schneider, U., Andreas, B., Peter, F., Anja, M.-C., Bruno, R., et al. (2011). GPCC Full Data Reanalysis Version 6.0 at 0.5°: Monthly Land-Surface Precipitation From Rain-Gauges Built on GTS-Based and Historic Data. Silver Spring, MA: NOAA.
Segura, H., Junquas, C., Espinoza, J. C., Vuille, M., Jauregui, Y., Rabatel, A., et al. (2019). New insights into the rainfall variability in the tropical Andes on seasonal and interannual time scales. Clim. Dyn. 53, 405–426. doi: 10.1007/s00382-018-4590-8
Shangguan, W., Hengl, T., de Jesus, J. M., Yuan, H., and Dai, Y. (2017). Mapping the global depth to bedrock for land surface modeling. J. Adv. Model. Earth Syst. 9, 65–88.
Siebert, S., Henrich, V., Frenken, K., and Burke, J. (2013). Global Map of Irrigation Areas Version 5. Rheinische 944. Bonn: Friedrich-Wilhelms-University.
Skofronick-Jackson, G., Kulie, M., Milani, L., Munchak, S. J., Wood, N. B., and Levizzani, V. (2019). Satellite estimation of falling snow: a global precipitation measurement (GPM) core observatory perspective. J. Appl. Meteor. Climatol. 58, 1429–1448. doi: 10.1175/JAMC-D-18-0124.1
Snapir, B., Momblanch, A., Jain, S. K., Waine, T. W., and Holman, I. P. (2019). A method for monthly mapping of wet and dry snow using Sentinel-1 and MODIS: application to a Himalayan river basin. Int. J. Appl. Earth Observ. Geoinform. 74, 222–230. doi: 10.1016/j.jag.2018.09.011
Solman, S. S. (2013). Regional climate modeling over south america: a review. Adv. Meteorol. 2013, 504357. doi: 10.1155/2013/504357
Sorooshian, S., Hsu, K. L., Gao, X., Gupta, H. V., Imam, B., et al. (2000). Evaluation of PERSIANN System Satellite-Based Estimates of Tropical Rainfall. Bulletin of the. American Meteorological Society, 81.
Sun, Q., Miao, C., Duan, Q., Ashouri, H., Sorooshian, S., and Hsu, K.-L. (2018). A review of global precipitation data sets: data sources, estimation, and intercomparisons. Rev. Geophys. 56, 79–107. doi: 10.1002/2017RG000574
Trachte, K., Seidel, J., Figueroa, R., Otto, M., and Bendix, J. (2018). Cross-scale precipitation variability in a semiarid catchment area on the western slopes of the central andes. J. Appl. Meteorol. Climatol. 57, 675–694. doi: 10.1175/JAMC-D-17-0207.1
Tucker, C. J., Pinzon, J. E., Brown, M. E., Slayback, D. A., Pak, E. W., Mahoney, R., et al. (2005). An extended AVHRR 8-km NDVI dataset compatible with MODIS and SPOT vegetation NDVI data. Int. J. Remote Sens. 26, 4485–4498.
Van den Hurk, B. (2012). Reanalysis and Their Applicability for Climate Research. Geneva: Gewex News.
Van Niekerk, A., Sandu, I., and Vosper, S. (2018). The circulation response to resolved versus parametrized orographic drag over complex mountain terrains. J. Adv. Model. Earth Syst. 10, 2527–2547. doi: 10.1029/2018MS001417
WMO (2010). Manual on the Global Telecommunication System. Annex III to the WMO Technical Regulations. WMO-No. Geneva: WMO, 386.
WMO (2014). Updated in 2017, guide to meteorological instruments and methods of observation. WMO-No. 8 Geneva: WMO, 1177.
WMO (2018). Regional Association III (South America): Abridged Final Report of the Seventeenth Session. WMO-No. Geneva: WMO, 1128.
Yamazaki, D., O’Loughlin, F., Trigg, M. A., Miller, Z. F., Pavelsky, T. M., and Bates, P. D. (2014). Development of the global width database for large rivers. Water Resour. Res. 50, 3467–3480. doi: 10.1002/2013WR014664
Yarleque, C., Vuille, M., Hardy, D. R., Posadas, A., and Quroz, R. (2016). Multiscale assessment of spatial precipitation variability over complex mountain terrain using high-resolution spatiotemporal wavelet reconstruction method. J. Geophys. Res. Atmos. 121, 198–112. doi: 10.1002/2016JD025647
You, Y., Wang, N. Y., Ferraro, R., and Rudlosky, S. (2017). Quantifying the snowfall detection performance of the global precipitation measurement (GPM) microwave imager channels over land. J. Hydrometeorol. 18, 729–751. doi: 10.1175/JHM-D-16-0190.1
Zambrano-Bigiarini, M., Nauditt, A., Birkel, C., Verbist, K., and Ribbe, L. (2017). Temporal and spatial evaluation of satellite-based rainfall estimates across the complex topographical and climatic gradients of Chile. Hydrol. Earth Syst. Sci. 21, 1295–1320. doi: 10.5194/hess-21-1295-2017
Zhang, K., Kimball, J. S., and Running, S. W. (2016a). A review of remote sensing based actual evapotranspiration estimation. Wiley Interdiscip. Rev. Water 3, 834–853. doi: 10.1002/wat2.1168
Zhang, H., Zhang, F., Zhang, G., He, X., and Tian, L. (2016b). Evaluation of cloud effects on air temperature estimation using MODIS LST based on ground measurements over the Tibetan Plateau. Atmos. Chem. Phys. 16, 13681–13696.
Zou, J., Ding, J., Welp, M., Huang, S., and Liu, B. (2020). Using MODIS data to analyse the ecosystem water use efficiency spatial-temporal variations across Central Asia from 2000 to 2014. Environ. Res. 182:108985. doi: 10.1016/j.envres.2019.108985
Keywords: ANDEX program, South America, hydrology, climatology, mountain
Citation: Condom T, Martínez R, Pabón JD, Costa F, Pineda L, Nieto JJ, López F and Villacis M (2020) Climatological and Hydrological Observations for the South American Andes: In situ Stations, Satellite, and Reanalysis Data Sets. Front. Earth Sci. 8:92. doi: 10.3389/feart.2020.00092
Received: 31 October 2019; Accepted: 17 March 2020;
Published: 09 April 2020.
Edited by:
Alfonso Fernandez, University of Concepcion, ChileReviewed by:
Oliver Meseguer-Ruiz, Universidad de Tarapacá, ChileEric Sproles, Montana State University, United States
Copyright © 2020 Condom, Martínez, Pabón, Costa, Pineda, Nieto, López and Villacis. This is an open-access article distributed under the terms of the Creative Commons Attribution License (CC BY). The use, distribution or reproduction in other forums is permitted, provided the original author(s) and the copyright owner(s) are credited and that the original publication in this journal is cited, in accordance with accepted academic practice. No use, distribution or reproduction is permitted which does not comply with these terms.
*Correspondence: Thomas Condom, thomas.condom@ird.fr