

Abstract
Due to associated hydrological risks, there is an urgent need to provide plausible quantified changes in future extreme rainfall rates. Convection-permitting (CP) climate simulations represent a major advance in capturing extreme rainfall and its sensitivities to atmospheric changes under global warming. However, they are computationally costly, limiting uncertainty evaluation in ensembles and covered time periods. This is in contrast to the Climate Model Intercomparison Project (CMIP) 5 and 6 ensembles, which cannot capture relevant convective processes, but provide a range of plausible projections for atmospheric drivers of rainfall change. Here, we quantify the sensitivity of extreme rainfall within West African storms to changes in atmospheric rainfall drivers, using both observations and a CP projection representing a decade under the Representative Concentration Pathway 8.5 around 2100. We illustrate how these physical relationships can then be used to reconstruct better-informed extreme rainfall changes from CMIP, including for time periods not covered by the CP model. We find reconstructed hourly extreme rainfall over the Sahel increases across all CMIP models, with a plausible range of 37%–75% for 2070–2100 (mean 55%, and 18%–30% for 2030–2060). This is considerably higher than the +0–60% (mean +30%) we obtain from a traditional extreme rainfall metric based on raw daily CMIP rainfall, suggesting such analyses can underestimate extreme rainfall intensification. We conclude that process-based rainfall scaling is a useful approach for creating time-evolving rainfall projections in line with CP model behaviour, reconstructing important information for medium-term decision making. This approach also better enables the communication of uncertainties in extreme rainfall projections that reflect our current state of knowledge on its response to global warming, away from the limitations of coarse-scale climate models alone.
Export citation and abstract BibTeX RIS

Original content from this work may be used under the terms of the Creative Commons Attribution 4.0 license. Any further distribution of this work must maintain attribution to the author(s) and the title of the work, journal citation and DOI.
1. Introduction
Convective rainfall dominates rainfall extremes in many regions of the world, which are set to increase with or beyond the rate of increasing water vapour in the atmosphere in a warming climate (Allen and Ingram 2002, O'Gorman and Schneider 2009). Vigorous convective events can pose a serious threat to human health, urban infrastructure, and food security by causing flash floods (Lobell and Gourdji 2012, Engel et al
2017). Yet, projected changes in extreme rainfall remain highly uncertain (IPCC 2021). This is in part because traditional coarse-scale global climate models with horizontal resolutions commonly  100 km, such as those in the Climate Model Intercomparison Project (CMIP) ensembles, cannot explicitly capture convective processes. Instead, these models rely on convective parameterisations that tend to produce daily rainfall intensities that are too low and spread out, rendering projected changes in extreme precipitation questionable (Trenberth et al
2003, Stephens et al
2010). This severely limits the usefulness of climate projections in the context of local impacts of changes in extreme weather (e.g. Vischel et al
2007). Consequently, there is an urgent need for more reliable information on future trends in rainfall extremes, which can support the development of adaptation and mitigation strategies.
100 km, such as those in the Climate Model Intercomparison Project (CMIP) ensembles, cannot explicitly capture convective processes. Instead, these models rely on convective parameterisations that tend to produce daily rainfall intensities that are too low and spread out, rendering projected changes in extreme precipitation questionable (Trenberth et al
2003, Stephens et al
2010). This severely limits the usefulness of climate projections in the context of local impacts of changes in extreme weather (e.g. Vischel et al
2007). Consequently, there is an urgent need for more reliable information on future trends in rainfall extremes, which can support the development of adaptation and mitigation strategies.
In this context, convection-permitting (CP) simulations, which allow convection to develop explicitly, have been found to simulate more realistic rainfall characteristics in different convective environments (Prein et al 2015, Kendon et al 2017). However, such simulations are computationally expensive and therefore often conducted in a one-off manner, providing a single realisation of a possible future without capturing uncertainties intrinsic to future climate projections. Ensemble projections at CP scale are only just starting to emerge e.g. with a focus on the UK (Fosser et al 2020), or are still under planning e.g. within Coordinated Regional Climate Downscaling Experiment (CORDEX) Flagship Pilot Studies for Europe, South America, and High Mountain Asia (Coppola et al 2020, Lavin-Gullon et al 2021, Zhou et al 2021).
Currently, the best way to evaluate future rainfall extremes and related risks must be an expert-informed approach that combines the advantages of information from existing parameterised and CP climate model projections, together with understanding from observations. This study brings together these different state-of-the-art climate data to derive future extreme rainfall estimates.
We focus on West Africa, where we now have a single CP realisation of future climate (Stratton et al 2018, Senior et al 2021), which shows a greater increase in extreme rainfall than a parameterised version of the model, with greater intensification of convective updraughts (Berthou et al 2019, Kendon et al 2019, Fitzpatrick et al 2020, Jackson et al 2020). This CP simulation is a major advance given the dominance of large, organised thunderstorm-clusters in this region, which produce the majority of extreme rainfall (Mathon et al 2002). These so-called mesoscale convective systems (MCSs) however cannot be captured by CMIP models. We demonstrate an approach for combining the individual CP projection with rainfall-driver relationships from observations and with the uncertainty range from 64 CMIP simulations, based on their future changes in atmospheric MCS drivers.
Variability and change in extreme MCS rainfall predominantly depends on total column water (TCW), low-level vertical wind shear and convective available potential energy (CAPE). Higher TCW content in a warmer atmosphere is known to intensify storm dynamics and to strongly control increases in extreme rainfall (Roderick et al 2019, Fitzpatrick et al 2020, Lenderink et al 2021). Wind shear affects MCS organisation (Moseley et al 2016), the entrainment dilution of convection (Mulholland et al 2021) and the inflow of unstable air and hence latent heating (Alfaro 2017), thereby modifying MCS intensity (Mohr and Thorncroft 2006). Environmental CAPE is another important driver for changes in MCS intensities and size (Prein et al 2017, Maranan et al 2018), but strongly co-varies with TCW and is therefore excluded from the driver scaling here to avoid double-counting. We therefore focus on future TCW and wind shear changes in CMIP models to reconstruct probable and time-continuous extreme MCS rainfall intensities.
Future changes in extreme rainfall and associated uncertainty are key parameters for defining long-term adaptation strategies against hydrological risks. The design of hydraulic infrastructures (e.g. sewage systems, dams) and their management relies on statistical indicators such as intensitiy-duration-frequency curves, design rainfall or floods, whose estimation in a changing climate remains a major challenge (Francois et al 2019, Brunner et al 2021, Sharma et al 2021). This is particularly the case in West Africa, where hydraulic design tools are non-existent or obsolete (Sane et al 2018). We illustrate a way to use CP models in combination with observations to inform the use of coarse-scale climate model data for such estimations. To our knowledge, this is the first attempt to combine this mixture of models and observations to better understand the response of future rainfall extremes to its atmospheric drivers.
2. Datasets and method
2.1. Observation-based data
Following the methodology in Klein et al (2021), and drawing on previous West African studies (Arnaud et al 1992, Laing et al 1999, Mathon et al 2002), we use thermal-infrared imagery from the Meteosat series, which we combine with microwave rainfall estimates, and ERA5 reanalysis data over the West African monsoon season May–October 2004–2018 to relate MCS rainfall intensities to atmospheric drivers. Together, these datasets capture a broad range of MCS-driver variability under current climate conditions.
Based on 10.8 µm-band brightness temperatures of the Meteosat Second Generation (MSG; Schmetz et al
2002, EUMETSAT 2021), we identify MCSs as contiguous cloud  −50 ∘C regions larger than 5000 km2 between 16 and 1900UTC, the time when the frequency of MCSs reaches a maximum (e.g. Mathon and Laurent 2001), for a Sahelian domain (9∘–19∘ N, 10∘ W–15∘ E). Maximum MCS rainfall (P
 ) is sampled from matched-up 'high-quality precipitation' (HQprecipitation, merged microwave-only precipitation estimate) fields of the half-hourly Final Run V06B Integrated Multi-satellitE Retrievals for Global Precipitation Measurement (IMERG-HQ; Huffman et al
2019) dataset at ∼15 km resolution. MCS snapshots with P
) is sampled from matched-up 'high-quality precipitation' (HQprecipitation, merged microwave-only precipitation estimate) fields of the half-hourly Final Run V06B Integrated Multi-satellitE Retrievals for Global Precipitation Measurement (IMERG-HQ; Huffman et al
2019) dataset at ∼15 km resolution. MCS snapshots with P 1 mm h−1 are removed to exclude non-precipitating cloud shields. We thus obtain conditional maximum rain rates from 22 368 MCS snapshots, for which we identify pre-storm driver conditions.
Environmental TCW and wind shear, defined here as the 925–600 hPa zonal wind difference in m s−1, are sampled from ERA5 reanalysis hourly data (Hersbach et al 2020, CDS 2021) coarsened to 0.7∘ resolution at 1200UTC, preceding afternoon MCSs, and at the location of minimum MCS temperature. The 0.7∘ resolution for atmospheric drivers reflects the scale of smallest considered MCSs while ensuring better consistency with the coarse spatial resolution of CMIP model data. For brevity, we refer to the combination of MSG, IMERG-HQ and ERA5 data for analyses as observation-based (OBS).
2.2. Convection-permitting model
This study uses data from the CP4 simulation; a 4.4 km pan-African CP climate simulation based on the Met Office Unified Model and created within the Future Climate for Africa (FCFA) Improving Model Processes for African cLimAte (IMPALA) project (Stratton et al 2018, Kendon et al 2019). The modelled historical period (CP4H ) encompasses 1997–2006 with atmospheric boundary conditions provided by a prototype of the latest atmosphere-only UM global model GA7/GL7 at 25 km with sea-surface temperatures (SST) prescribed from observations (Reynolds et al 2007). The CP4 future projection (CP4F ) covers ten years representative of 2100 climate conditions. It uses GA7/GL7 atmospheric boundary conditions under increased greenhouse gas concentrations in line with the Representative Concentration pathway (RCP) 8.5 at the end of this century. Driving SSTs are adjusted from CP4H to reflect end-of-century SSTs by adding a climatological annual cycle of ΔT derived from a HadGEM2-ES climate projection (Jones et al 2011), while ozone and aerosol concentrations in CP4F remain the same as for CP4H .
At ∼4.4 km resolution, CP4 operates within the 'grey zone' for resolving convection (Field et al
2017), but has been confirmed to improve the intensity and distribution of precipitation across the Sahel (Berthou et al
2019). It also correctly captures climatological MCS distributions, albeit with underestimations in maximum MCS size and speeds together with an overestimation in MCS frequencies (Crook et al
2019). We extract simulated afternoon MCSs following the same approach as for OBS, converting outgoing longwave radiation into brightness temperatures and applying the  −50 ∘C temperature threshold. Filtering for
  5000 km2 rainy clouds gives 45 977 MCS snapshots for CP4H
and 35 975 snapshots for CP4F
with co-located atmospheric conditions sampled at 1200UTC and at 0.7∘ resolution. The smaller number of future MCSs is consistent with previous CP4 analyses, which found fewer but more intense rain events paired with longer dry spells across the Sahel for CP4F
(Berthou et al
2019, Kendon et al
2019). In line with IMERG-HQ rainfall, the modelled rainfall is coarsened to 15 km resolution before sampling MCS maximum rainfall. This averaging also reduces the overestimation of high-intensity rainfall CP4 shows at native resolution (cf supplementary figure S1, Berthou et al
2019).
5000 km2 rainy clouds gives 45 977 MCS snapshots for CP4H
and 35 975 snapshots for CP4F
with co-located atmospheric conditions sampled at 1200UTC and at 0.7∘ resolution. The smaller number of future MCSs is consistent with previous CP4 analyses, which found fewer but more intense rain events paired with longer dry spells across the Sahel for CP4F
(Berthou et al
2019, Kendon et al
2019). In line with IMERG-HQ rainfall, the modelled rainfall is coarsened to 15 km resolution before sampling MCS maximum rainfall. This averaging also reduces the overestimation of high-intensity rainfall CP4 shows at native resolution (cf supplementary figure S1, Berthou et al
2019).
2.3. CMIP models
We analyse driver changes in wind shear and TCW out to 2100 in simulations from 38 CMIP5 (Taylor et al 2012) and 26 CMIP6 models (Eyring et al 2016); one realisation per model i.e. 'r1i1p1' members (see supplementary table 1; available online at stacks.iop.org/ERL/16/104023/mmedia) for which data were available for both variables. Only simulations forced by the RCP 8.5 (Shared Socioeconomic Pathway 5-8.5 for CMIP6) are analysed, consistent with CP4. Three different 30-year time slices are considered; 2030–2059 ('2040'), 2050–2079 ('2060'), and 2070–2099 ('2080'). The reference period covers 1950–1999, which was driven by historical anthropogenic and natural forcings. The models were interpolated onto a common 1.25∘ latitude × 1.875∘ longitude grid and averaged for respective time slices. For the rainfall reconstruction, we use a seasonal average of the changes in atmospheric drivers during the peak monsoon months July–September (JAS), during which MCS activity is at a maximum in the Sahel (Lafore et al 2011, Nicholson 2018). For a subset of models, we also evaluate changes in 3-hourly and daily rainfall extremes, depending on availability (cf supplementary table 1).
2.4. Translating driver changes into changes in extreme rainfall
Using the identified MCSs from OBS and CP4, we define MCS extreme rainfall as the 95th percentile of the maximum MCS rainfall distribution ( ). We assume a linear relationship between changes in
  and atmospheric driver changes. The individual driver contribution is then defined as

and

where ΔTCW and Δshear denote the differences between JAS average future and historical conditions of the respective variable from either CMIP models or CP4. Reconstructed rainfall from JAS CP4-drivers will be used to evaluate our scaling approach in comparison to the CP4 modelled rainfall change.  and
and  represent the associated rainfall/driver relationships based on hourly atmospheric data, either as simulated by CP4 or derived from OBS. The change in driver-based
  is then reconstructed as a linear combination of individual driver contributions:

Our use of the driver scaling factors  and
and  depends on the precipitation/driver relationship remaining the same in the current and future climates, and on CP4 capturing the relationship under both climates. This will be discussed in the following.
3. Derived rainfall-driver relationships
3.1. Historical scaling of observed and modelled extreme rainfall with atmospheric drivers
We first evaluate how the rainfall-driver scaling compares between OBS and CP4H
for the atmospheric drivers TCW and shear. In figures 1(a) and (b), we stratify the MCS sample according to driver strength and compute the 95th percentile of the  distribution to obtain the intensity of the 5% most intense storms that can be supported by any joint TCW-shear combination (i.e.
  ). This allows us to ascertain how
  changes in response to one driver while the other remains approximately constant.

Figure 1. Comparison of extreme rainfall-driver scaling in observations and CP simulation. 2D-histograms of  intensity for pre-storm TCW (mm) versus zonal wind shear (m s−1) for (a) OBS (ERA5, IMERG) and (b) CP4H
. Bins with fewer than 10 MCSs are shaded grey. r2 gives explained
intensity for pre-storm TCW (mm) versus zonal wind shear (m s−1) for (a) OBS (ERA5, IMERG) and (b) CP4H
. Bins with fewer than 10 MCSs are shaded grey. r2 gives explained  variance from multi-linear regression of TCW and shear. Line plots are based on the histograms, depicting the
  relationship with (c) TCW only (d) shear only, for OBS (black) and CP4H
(blue). Shading spans the 10–90 percentile spread of (c) shear-related
relationship with (c) TCW only (d) shear only, for OBS (black) and CP4H
(blue). Shading spans the 10–90 percentile spread of (c) shear-related  across each TCW bin, and of (d) TCW-related
  across each shear bin. Legends give slopes of the linear fits (black dashed lines,
  0.01 except CP4H
shear fit) ± standard errors, weighted by MCS number per joint driver bin. Empty circles indicate bins cumulatively containing 80% of all MCSs.
0.01 except CP4H
shear fit) ± standard errors, weighted by MCS number per joint driver bin. Empty circles indicate bins cumulatively containing 80% of all MCSs.
Download figure:
Standard image High-resolution imageThere is a marked tendency for  to increase with higher TCW as well as with wind shear in OBS (figure 1(a)). This behaviour cannot be explained by any correlation between TCW and shear, which is negative for OBS (
 0.21,
0.21,  0.01). CP4H
similarly shows higher
0.01). CP4H
similarly shows higher  as TCW increases, but exhibits little sensitivity to ambient shear. Averaging across TCW-bins, figure 1(c) confirms that CP4H
 -scaling with TCW shows good correspondence with a rainfall change of 0.69 mm h−1 per unit increase in TCW (mm) compared to 0.71 mm h−1 for OBS. At the same time, CP4H
considerably underestimates the rainfall spread introduced by wind shear per TCW-bin (blue spread) and consequently does not reproduce the observed
-scaling with TCW shows good correspondence with a rainfall change of 0.69 mm h−1 per unit increase in TCW (mm) compared to 0.71 mm h−1 for OBS. At the same time, CP4H
considerably underestimates the rainfall spread introduced by wind shear per TCW-bin (blue spread) and consequently does not reproduce the observed  -increase of 0.78 mm h−1 per unit shear (m s−1) shown in figure 1(d).
This result is in line with previous studies of CP4, which found realistic MCS rainfall sensitivity to TCW but little shear dependency (Fitzpatrick et al 2020, Senior et al 2021). Our observation-based results however highlight the importance of shear for MCS maximum rainfall intensity on synoptic time scales; a relationship which is backed by theory (Alfaro 2017) and can be captured by idealised models below 1 km spatial resolution (Bickle et al 2021).
We will therefore rely on the historical absolute  -shear scaling as inferred from OBS following equation (2) with
  defined as
representing the absolute change in rainfall per unit shear from observations (figure 1(d)) ± standard error (SE). This is applied under the assumption that scaling of rainfall with wind shear remains constant across climates, which is supported by the good fit of the layer-lifting model of convection in Bickle et al (2021), since this model depends on MCS-relative flows of moisture and hence shear. For TCW on the other hand, CP4 shows realistic behaviour, which we exploit in the next step to derive the scaling of  with increasing TCW under global warming.
3.2. Future scaling of extreme rainfall with atmospheric moisture
Based on end-of-century projected changes by CP4, we now consider the climate change sensitivity of  to TCW relative to the historical period. Different from the effect of wind shear, the rainfall-humidity relationship cannot be assumed to remain the same across climates as similar levels of TCW do not result in similar rainfall intensities.
This is illustrated in figure 2, where in addition to CP4H
, the pre-storm atmospheric drivers are separated for CP4F
MCSs, similar to the approach used to obtain figure 1(c), but by averaging the  distribution across 5-percentile TCW-bins. Compared to CP4H
, the CP4F
MCS distribution shows a marked shift towards higher TCW. At the same time, when MCSs occur, similar levels of TCW in CP4F
result in higher
distribution across 5-percentile TCW-bins. Compared to CP4H
, the CP4F
MCS distribution shows a marked shift towards higher TCW. At the same time, when MCSs occur, similar levels of TCW in CP4F
result in higher  than in CP4H
. This is in contrast to our current understanding for likely changes in mean rainfall, for which less rainfall is expected in a warmer climate for similar TCW, as more moisture is necessary to reach similar levels of relative humidity. A possible explanation for this behaviour is that extreme MCS rainfall occurs when convection is strong. Convective updraughts are expected to widen and intensify under global warming (Prein et al
2017), with the latter similarly identified for CP4 (Jackson et al
2020). The dynamical MCS intensification may then result in higher extreme rainfall in the future for similar TCW levels.
than in CP4H
. This is in contrast to our current understanding for likely changes in mean rainfall, for which less rainfall is expected in a warmer climate for similar TCW, as more moisture is necessary to reach similar levels of relative humidity. A possible explanation for this behaviour is that extreme MCS rainfall occurs when convection is strong. Convective updraughts are expected to widen and intensify under global warming (Prein et al
2017), with the latter similarly identified for CP4 (Jackson et al
2020). The dynamical MCS intensification may then result in higher extreme rainfall in the future for similar TCW levels.
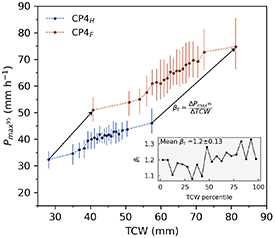
Figure 2. Deriving extreme MCS precipitation scaling from projected moisture change in the CP simulation.  (mm h−1) for 5-%tile bins as a function of pre-storm TCW (mm) for CP4-historical (CP4H
, blue) and -future (CP4F
, red) with bars spanning the 10–90 percentile of shear bins as in figure 1. The scaling factor (inset) is calculated for each percentile-connecting vector (
(mm h−1) for 5-%tile bins as a function of pre-storm TCW (mm) for CP4-historical (CP4H
, blue) and -future (CP4F
, red) with bars spanning the 10–90 percentile of shear bins as in figure 1. The scaling factor (inset) is calculated for each percentile-connecting vector ( , two example vectors given), expressed as the absolute change of
  per change in TCW between CP4H
and CP4F
.
per change in TCW between CP4H
and CP4F
.
Download figure:
Standard image High-resolution imageWe follow a 'quantile-projection' approach to map the historical driver distribution and associated  onto future conditions, as represented by climate change vectors
  between CP4F
and CP4H
in figure 2. The resulting
between CP4F
and CP4H
in figure 2. The resulting  ranges from 1.07 up to 1.33 (figure 2(a) inset), with a mean
  according to
The fact that hourly extreme rain scales with preceding TCW with  points towards the importance of dynamical processes that help to increase the vertical transport of moisture in MCSs and the MCS moisture supply from the surroundings. In the following,
  is used to calculate
  from TCW changes in CMIP models.
4. Combined driver-based projected changes in extreme rain
We now derive a plausible range of changes in reconstructed  based on the Sahel domain-average of absolute changes in TCW (mm, figure 3(a)) and wind shear (m s−1, figure 3(b)) of 64 CMIP models. The domain average is calculated for 9∘–19∘ N, 10∘ W–15∘ E, in line with the domain where MCSs were sampled.

Figure 3. CMIP driver change and reconstructed extreme rainfall from combined drivers. Sahel domain-average driver change of value-ordered CMIP5 (n = 38) and CMIP6 (n = 26) models for (a) TCW (mm) and (b) wind shear (m s−1) for the 2040, 2060, and 2080 periods relative to historical. CP4 driver change is based on JAS domain-averages, in line with CMIP, and corresponds to circa 2100. (c)–(e) shows the driver-reconstructed change in  (mm h−1) for respective time periods associated with TCW (grey), zonal wind shear (black), and combined change (green) for all models. Shading for CMIP and whiskers for CP4 depict uncertainty range from scaling with
  = 0.78 ± 0.15 and
  = 1.2 ± 0.13.
Download figure:
Standard image High-resolution imageIn terms of TCW and shear projections, there is no indication of a fundamentally different behaviour between CMIP5 and CMIP6 ensembles (figures 3(a) and (b)), justifying our pooled evaluation. For the 2080 period, the 10–90 percentile spread in TCW across all 64 CMIP models reaches +11–21 mm while CP4 projects a larger TCW change than 90% of all CMIP models (22 mm), noting it is representative of a later period and excludes anomalous aerosol forcing. Similarly, the CP4 wind shear change of +3 m s−1 is at the high end of the CMIP distribution.
Based on these results for ΔTCW and Δshear, we calculate  , the rainfall contribution from TCW, via equation (1) using
  as derived from CP4 (equation (5)). The scaling factor
  from OBS (equation (4)) is directly applied in equation (2) to derive
  , the rainfall contribution from shear. By scaling the CMIP driver changes throughout the century, we can also obtain reconstructed
  intensities for the 2040 and 2060 periods, which are not covered by the CP4 simulation.
Using the combined information from OBS, CP4 and CMIP models, figures 3(c)–(e) finally illustrates the translation of the MCS driver changes into absolute change in reconstructed  for individual and combined drivers (c.f. equation (3)) across the different future 30-year time slices:
Comparing TCW-reconstructed (figures 3(c)–(e), grey line and shading) to the combined-driver  (green line and shading), we find that shear changes have a minor effect on future rainfall change: while the individual change related to shear still increases from +1.8 mm h−1 around 2040 to +2.4 mm h−1 by 2080 for the 90th CMIP percentile, the relative contribution from strengthened shear to total
  decreases from 2040 through to 2100 as it is outpaced by the TCW increase. Hence, TCW remains the primary driver of increased MCS extreme rainfall for all future time periods considering average driver changes across the Sahel.
4.1. Spatial variability of reconstructed extreme rainfall and comparison to modelled extremes
So far, presented results did not consider sub-regional driver variability. Across the Sahel domain, TCW changes show marked spatial variability linked to a pronounced zonal asymmetry in projected moisture changes as well as to generally strong meridional gradients in this wet-dry transition region (supplementary figures S2c, S3, S4). Strongest wind shear changes tend to follow zonal bands for CP4 and CMIP, for which most models suggest a peak in the eastern Sahel (supplementary figures S2d, S5, S6).
Assuming our domain-wide scaling factors remain valid locally, we calculate a pixel-based  for the 2080 period in figures 4(a) and (b), showing the CMIP ensembles' 90th and 10th percentile, respectively. In line with model agreements on peaks of TCW and shear change in the eastern Sahel, the reconstructed
  shows highest values over Niger and northern Nigeria. Shear contributions to
 8% up to a maximum of 17% (hatching) cover most of the northern Sahel for both extreme ends of the CMIP range, commensurate with large CMIP uncertainties in modelling changes in southern Saharan lower tropospheric warming (Rowell et al
2021).
8% up to a maximum of 17% (hatching) cover most of the northern Sahel for both extreme ends of the CMIP range, commensurate with large CMIP uncertainties in modelling changes in southern Saharan lower tropospheric warming (Rowell et al
2021).
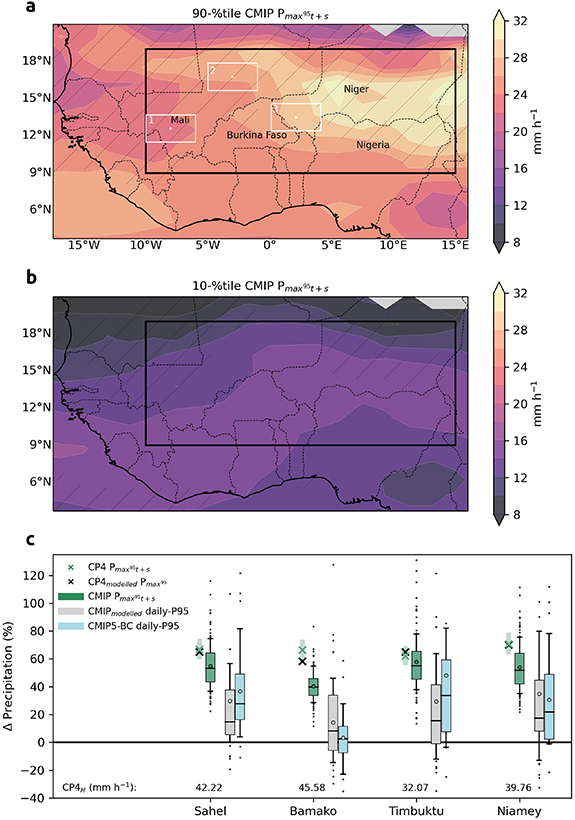
Figure 4. Spatial reconstruction of extreme rainfall change and comparison to modelled change for 2080. (a), (b) shows driver-reconstructed Δ  (mm h−1) for the 90th and 10th percentiles across the CMIP ensemble (n = 64) at each grid point, respectively, and areas of wind shear contribution
  8% to the rainfall change (hatching). Large box marks the Sahel domain for which
  and
and  were derived and 2
 boxes are centred on the cities of Bamako (1), Niamey (2), and Timbuktu (3). (c) compares relative changes in Δ
  based on CMIP driver change (green boxes, relative to CP4H
) to CMIP-modelled 95th percentile daily rainfall (grey boxes, n = 47) and for a bias-corrected CMIP5 version (Famien et al
2018; blue boxes, n = 28). Boxplots span the inter-quartile range, indicating the median (line) and mean (open circles), with 10–90 percentile whiskers. (x) depict CP4 driver-reconstructed
based on CMIP driver change (green boxes, relative to CP4H
) to CMIP-modelled 95th percentile daily rainfall (grey boxes, n = 47) and for a bias-corrected CMIP5 version (Famien et al
2018; blue boxes, n = 28). Boxplots span the inter-quartile range, indicating the median (line) and mean (open circles), with 10–90 percentile whiskers. (x) depict CP4 driver-reconstructed  (green (x)), and the raw CP4-modelled rainfall (black (x)). Green shading for CP4-(x) depicts the uncertainty from
  and
and  scaling factors.
Download figure:
Standard image High-resolution image
Finally, we compare relative changes in reconstructed  with modelled rainfall changes in CP4 and CMIP (figure 4(c)). The scaling is compared for the Sahel domain and boxes centred on the cities of Bamako (1), Timbuktu (2), and Niamey (3) (figure 4(a)), corresponding to regions along the previously discussed zonal gradient of TCW change projected by many CMIP models. For CP4, this step provides an indication of the skill of the simple linear driver-scaling presented here to reproduce regional intensities of modelled MCS rainfall. Figure 4(c) illustrates that for all regions except Bamako, the CP4-modelled
  (black cross) lies within the uncertainty range of
  reconstructed from JAS CP4 driver changes (green cross and shading). The range reflects the uncertainty associated with the TCW and shear scaling factors and reaches a maximum of ±7.7% (Niamey). This good correspondence in spite of CP4's weak shear response may be linked to the scaling not considering additional rainfall intensification factors like instability, suggesting that our results may still be a conservative estimate.
The CMIP5/6-based  (green box) is shown in comparison to the modelled change in 95th percentile daily rainfall (for wet days
  0.1 mm) of a range of raw CMIP5/6 models (grey box) as well as to a bias-corrected version of CMIP5 (blue box). We consider the latter to be the best available dataset regarding CMIP5-projected rainfall changes in West Africa (Famien et al
2018). Across evaluated regions, the ensemble mean change in reconstructed extreme rainfall lies between +40% and 58% (+20%–31% for the 2040 period), which is markedly higher than for any ensemble-mean modelled CMIP rainfall in the same region. Furthermore,
0.1 mm) of a range of raw CMIP5/6 models (grey box) as well as to a bias-corrected version of CMIP5 (blue box). We consider the latter to be the best available dataset regarding CMIP5-projected rainfall changes in West Africa (Famien et al
2018). Across evaluated regions, the ensemble mean change in reconstructed extreme rainfall lies between +40% and 58% (+20%–31% for the 2040 period), which is markedly higher than for any ensemble-mean modelled CMIP rainfall in the same region. Furthermore,  shows a clear signal of intensification across the entire CMIP uncertainty range, linked to exclusively positive driver changes. Modelled daily extremes on the other hand include negative changes within the 10–90th percentile CMIP range for all regions, with region-dependent ensemble means between 14% and 35% for raw CMIP and 3%–48% for bias-corrected CMIP5. While we acknowledge that the change in
  , which is based on sub-daily extremes, may behave differently from CMIP daily rainfall metrics, it allows us to compare the reconstructed results to a more commonly-used and directly-inferred extreme rainfall metric. In addition, 3 out of 4 currently available CMIP6 models that provide sub-daily rainfall did not show a stronger signal for 3-hourly compared to daily extremes (supplementary figure S7), suggesting there is no systematic intensification at sub-daily scale that applies to all CMIP models.
5. Discussion and conclusions
In this study, our aim was to fuse a CP model projection, which provides us with only one possible future of how precipitation extremes from West African MCSs might change, with a CMIP-based time-continuous uncertainty range. For that, we adopted a simple linear scaling based on only TCW and shear, which we show allows to reconstruct CP4-modelled rainfall intensities. The presented scaling approach follows the assumption that CMIP changes in atmospheric drivers of MCSs are plausible, while the CP model in combination with observations provides a more realistic response of extreme MCS rainfall to those drivers. We thus draw on the strengths of respective datasets.
We find reconstructed changes in extreme rainfall to be exclusively positive across CMIP models, dominated by the strong projected increases in TCW with an ensemble 10–90 percentile range of +37%–75% (+55% mean) for 2070–2100 (+18%–30% with +26% mean for 2030–2060) under RCP8.5 across our Sahel domain. Shear contributions to these figures reach at least 8% for most of the northern Sahel, although we note that this result is based on MCS sensitivities to shear in the afternoon. The shear contribution may be higher for nocturnal MCSs, when the importance of shear for MCS maintenance increases in the absence of daytime heating (e.g. Vizy and Cook 2018). The strictly positive changes are in contrast to CMIP-modelled changes in daily extremes, which we find to be less conclusive with a 10–90 percentile range of +0–60% (+30% mean) for raw CMIP5/6 rainfall and +4%–88% (+37% mean) using a bias-corrected CMIP5 dataset with some models again exhibiting negative changes.
The limited previous analyses of extreme rainfall projections over West Africa to date focus on selections of RCP8.5 downscaled CMIP models and have found either little change in extreme precipitation trends compared to driving CMIP models with no agreement in sign (Diallo et al 2016) or end-of-century ensemble-mean increases that stay below 40% (Sylla et al 2015, Todzo et al 2020). This suggests, CMIP and even medium-resolution downscaling approaches may consistently underestimate extreme rainfall change, potentially in ways related to model resolution, convection schemes and projected driver changes. This conclusion is further supported by previous CP4 studies (Kendon et al 2019, Finney et al 2020, Jackson et al 2020).
While the driver-reconstructed change in extreme rainfall presented here exhibits an apparently smaller uncertainty range than that of the CMIP models, many assumptions and simplifications are incorporated in the reconstruction that are not explicitly reflected. For example, we assume that the driver changes MCSs feel locally on an hourly basis are proportional to the climate change in the July–September domain mean as represented in the CMIP driver data. We also necessarily assume that rainfall scaling with wind shear is stationary across climates since the CP model fails to capture the observed shear sensitivity, highlighting a key problem of this CP simulation—although related errors would be minor given the indicated secondary role of wind shear for future extreme rain intensification. Furthermore, various scaling problems are simplified by the fact that all changes in the considered drivers are positive and force extreme rain in the same direction with climate change, avoiding drivers cancelling each other, which would considerably increase the significance of scaling errors. We also use the historical CP4 rainfall distribution as a present-day reference to translate the reconstructed absolute rainfall changes into relative changes, even though certain CMIP future driver changes may be unlikely given the CP4 historical starting point. Nevertheless, for simplicity, we assume all CMIP driver changes to be equally plausible to occur in CP4.
This leaves us with a novel methodology that combines CP with CMIP simulations and observations to translate future atmospheric changes into extreme rainfall change. The reconstructed extreme rainfall illustrates that, given the background conditions for MCS formation in a region, associated rainfall extremes will increase in line with and beyond the regional increase in TCW if relative humidity remains approximately constant. This relationship, diagnosed from CP simulations, makes TCW change a useful indicator for the behaviour of the extreme tail of the rainfall distribution. In this way, an evaluation of convection-permitting rainfall projections based on atmospheric drivers helps to communicate to users more defensible hydro-climatological information for West Africa, using our best scientific knowledge and understanding of the likely future changes in MCSs. The logical framing of this approach also lends itself to the construction of climate-change narratives (e.g. Dessai et al 2018, Burgin et al 2020), which have been found to be very useful in risk communication.
Acknowledgments
The research leading to these results received funding from the U.K.'s Natural Environment Research Council/Department for International Development (NERC/DFID) Future Climate for Africa (FCFA) program, under the AMMA-2050 (Grant Numbers NE/M020126/1, NE/M019977/1, NE/M019969/1, NE/M019950/1, NE/M019934/1, NE/M020428/2, NE/M020428/1) and Improving Model Processes for African Climate (IMPALA) projects (NE/MO17176/1, NE/M017230/1). Marsham also acknowledges funding from the HyCRISTAL project (NE/M02038X/1). We thank Rachel Stratton and Simon Vosper (Met Office), who ran the CP4 simulations within IMPALA and made the data available. Instructions for access to the CP4 dataset can be found in the User Guide via https://doi.org/10.5281/zenodo.4316466 and are publicly available from the Centre for Environmental Data Analysis (CEDA) archive (http://archive.ceda.ac.uk/). The bias-corrected CMIP5 dataset can be obtained by contacting A D: moise.famien@locean.ipsl.fr. MSG data are available from the EUMETSAT archive https://navigator.eumetsat.int/product/EO:EUM:DAT:MSG:HRSEVIRI, ECMWF hourly ERA5 reanalysis data are available from the Copernicus Data Store (https://doi.org/10.24381/cds.bd0915c6) and data from the Global Precipitation Measurement mission are available from https://doi.org/10.5067/GPM/IMERG/3B-HH/06. We also acknowledge the World Climate Research Programme, which, through its Working Group on Coupled Modelling, coordinated and promoted CMIP. We thank the climate modeling groups for producing and making available their model output, the Earth System Grid Federation (ESGF) for archiving the data and providing access, and the multiple funding agencies who support CMIP5 (https://esgf-node.llnl.gov/projects/cmip5/), CMIP6 and ESGF, and we thank the involved climate modeling groups for producing and making available their model output. Special thanks go to the developers of the Pangeo CMIP6 data access and cloud processing (https://pangeo-data.github.io/pangeo-cmip6-cloud/accessing_data.html), which worked like a charm, and to the providers of the python packages matplotlib/cartopy, xarray, salem, scipy, metpy, pandas, and their dependencies.
Data availability statement
The data that support the findings of this study are available upon reasonable request from the authors.
Author contributions
C K, L J, D P, J M, C T, D R and F G conceptualised the study, with input from T V and A D. All authors contributed to and discussed the methodological design, and analyses were conducted by C K and L J, with input from A F. C K and D P led the writing of the manuscript, with contributions from all authors.