
Effects of Land Cover Changes on Compound Extremes over West Africa Using the Regional Climate Model RegCM4


1
Laboratoire d’Océanographie, des Sciences de l’Environnement et du Climat (LOSEC), UFR Sciences et Technologies, Université Assane SECK de Ziguinchor, Ziguinchor 270000, Senegal
2
Institute of Environmental Geosciences, Université Grenoble Alpes, IRD, CNRS, Grenoble INP, IGE, F-38000 Grenoble, France
3
LASMES—African Centre of Excellence on Climate Change, Biodiversity and Sustainable Agriculture (ACE CCBAD)/Université Félix Houphouët Boigny, BP V-34, Abidjan 22 BP 801, Côte d’Ivoire
*
Author to whom correspondence should be addressed.
Atmosphere 2022, 13(3), 421; https://doi.org/10.3390/atmos13030421
Submission received: 12 January 2022
/
Revised: 1 March 2022
/
Accepted: 2 March 2022
/
Published: 5 March 2022
(This article belongs to the Special Issue Advances in Regional Climate Modelling)
Abstract
:This study aims to characterize the impacts of the Sahel–Sahara interface reforestation on compound extremes in the Sahel region during the West African monsoon season (June–July–August–September, JJAS). For this purpose, we performed a simulation with the standard version of the RegCM4 model, and another simulation with the altered version of the same model, taking into account the incorporated forest. Results show that reforestation may strongly influence the frequency of individual extreme events (dry and warm days) by decreasing them over and off the reforested zone. The reduction in these extreme dry and warm days may be due partly to the strengthening of the atmospheric moisture content over most parts of the West African domain and the weakening of the sensible heat flux south of 16° N. The analysis also shows an increase in extreme wet days over and off the reforested zone, which could be associated partly with the strengthening of evapotranspiration over most parts of the West African domain, including the reforested area. The analysis of compound extremes shows a strong occurrence of the compound dry/warm mode over the northern Sahel for both runs, probably due to the weak precipitation recorded in this zone. Both experiments also simulated a strong compound wet/warm mode occurrence over the Sahel due to a high rainfall occurrence over this region. When comparing both runs, the impact of the reforestation was to decrease (increase) the compound extreme dry/warm (wet/warm) mode over the reforested zone. The dry/warm mode decrease is consistent with that of individual extreme dry and warm days, while the compound wet/warm mode increase may be driven by that of the extreme wet days. Finally, when considering the seasonal cycle, the dry/warm mode exhibits a more substantial decrease in the beginning (June–July, JJ) than during the peak of the West African summer monsoon season (August–September, AS). Moreover, reforestation similarly affects the compound wet/warm mode in JJ and AS by increasing it in the reforested region and decreasing it over the Southern Sahel (south of 15° N). This work suggests that reforestation may be a good solution for West African policymakers to mitigate climate change over the region and to develop better strategies for water resource management.
1. Introduction
According to the special report of the Intergovernmental Panel on Climate Change [1], the global average temperature has increased by 0.05 °C from 1998 to 2012. This global warming is accompanied by an increase in extreme weather events. Moreover, in West Africa, recent studies have characterized the evolution of these extreme events in the region using climate models or products derived from satellite images [2,3]. However, the availability of daily meteorological data and their access remains a significant obstacle to understanding the variability of the extreme events on national and local scales [4]. An increase in the frequency of extreme weather events in this region could negatively affect socio-economic activities, especially in the agriculture sector, which is highly dependent on the West African monsoon rainfall [5].
Furthermore, the degradation of the environment, more specifically that of plant cover, remains a major concern in West Africa. Many studies [6,7,8] have shown that this degradation of vegetation cover is due to human activities and climatic variations. Indeed, in addition to extensive agriculture and overgrazing, high population growth followed by heavy land use and climatic variability remain the main factors that lead to the degradation of vegetation cover. The damaging effects of this degradation on the physical environment and human activities are manifold, and affect the Sahelian countries. Béné and Fournier and Ozer et al. [9,10] have shown that human activity constantly damages the environment. According to [10], changes in climatic parameters, such as rainfall and temperature, are detrimental to the development of plant cover in West Africa. Other studies [7] have also shown that bushfires are the key drivers of environmental degradation in West Africa. From an environmental standpoint, the degradation of plant cover has caused significant losses in plant biodiversity.
The greenbelt or great green wall project, initiated by the Conference of Heads of the Sahel–Saharan States and Governments and approved on 29 and 30 January 2007 in Addis Ababa (Ethiopia), testifies the determination of the African Union (UA) in terms of environment protection. This project aims at reforesting the Sahelian band from the East (Djibouti) to the West (Senegal) in order to tackle the detrimental social, economic, and environmental impacts of land degradation and to stop the advance of the desert in this area. Furthermore, considerable efforts have been devoted to research on the potential effects of reforestation on the West African climate [11,12,13,14,15,16,17,18,19,20,21,22,23,24]. There is much information on its implication in Africa, especially in West African countries. Works from these studies investigated the effects of reforestation on mechanisms underlying precipitation changes and individual extreme events, as well as projected changes in the mean climate in the near future and higher-order statistics [12,17,19,20,21,24]. However, none of these previous studies have attempted to investigate the impacts of the reforestation at the Sahel–Sahara interface location on compound rainfall and temperature extremes over West Africa.
In fact, following several authors [25,26,27,28], the compound extremes are known as simultaneous or coincident extremes. These compound climatic extremes are receiving increasing attention from policymakers, especially in Europe, Russia, California, and China, because of their great impacts on human health and the environment [29,30]. Following [31], compound event research has become a new, rapidly developing research field at the interface between weather and climate science and climate-impact research. Several studies [32,33,34,35,36,37,38] have investigated compound extremes, such as the occurrence of drought and heat waves or low rainfall and high surface temperatures in these regions. Works from [39] showed that the large precipitation deficit in the central United States in 2012 that caused a severe drought between May and August was accompanied by high temperatures, which had a strong impact on crop yields. According to [31], most climate-related impacts are caused by compound events. These authors also concluded that most commonly studied compound events in the scientific literature so far are compound hot/dry events. Feng et al. [40] analyzed the frequency, severity, duration, and magnitude of compound hot/dry events over global land areas for the period 1951–2012, and found a remarkable increases in these characteristics in regions such as central Africa, Europe, Mediterranean regions, and northern parts of East Asia. Olmo et al. [41] found an increase in compound hot/dry events in southern America over the recent decades. Following [42], the day–night temperature extremes concurrently has increased strongly in China since the late 1990s, particularly in densely populated areas. For instance, [43] found an increase in compound hot/dry events in the Mediterranean, and attribute these increases primarily to increases in temperature. Beniston (2009) [44] showed that the number of compound extreme warm/dry and warm/wet modes have increased in Europe in the 20th century and will continue to increase until 2100. Therefore, better understanding their occurrence and analyzing their drivers is of high societal importance [45]. Other studies are focused on compound precipitation and wind extremes [46], which can lead to devastating damage, particularly to infrastructure. Zhang et al. [47] found that compound precipitation and wind extremes in China are most likely to occur in southern parts of the country. Owen et al. [48] found that 70% of co-occurring extremes of wind and precipitation in Europe occur within a distance of 1110 km of a cyclone for most of Europe. Morán-Tejeda et al. [49] also showed an increase in the frequency of the compound extremes of dry/warm and wet/warm days in the Spanish mountains from 1970 to 2007. Moreover, [30] also showed a significant increase in the compound extreme dry/warm occurrence during the period 1901–2016 in Melbourne (Australia). These pioneering studies helped to better understand the compound extreme characteristics across Europe, Russia, China, and the United States. In Africa, particularly over West Africa, few studies have focused on compound extremes.
Indeed, semi-arid regions, such as the Sahel, are particularly sensitive to any environmental change (climate, land uses and cover, landscape features/structures) and may be seen as vulnerable areas to be protected as a shield against an undesired expansion of arid zones. Greening solutions, such as the African Great Green Wall, have been proposed. However, given that the climate system is non-linear, with the existence of different temporal and spatial scales, response thresholds, and feedback loops, the response to such a measure could be complicated by the inertia of its components and by complex interactions between them. This is confirmed by [17] who showed that reforestation in West Africa could have both positive and negative impacts on climate over the region and remote areas. Following these authors, while the reforestation could reduce the greenhouse-induced warming and increase rainfall over the reforested area, it could enhance the warming and decrease rainfall outside the reforested area, because the reforestation slows down the monsoon flow in transporting cool and humid air north of the reforestation area.
Furthermore, changes in the sustainability of economic development and living conditions are linked to our ability to combat climate risks associated with extreme events. The knowledge of the behavior of these extremes remains essential in the life of local populations. In particular, human health can be impacted by abnormally high temperature values.
Results from Fontaine et al. [50] showed a warming ranging between 1 and 3 °C over the Sahara and Sahel for the period 1979–2011. Following these authors, the warming trend is associated with a higher frequency and longer duration of heat waves. Otherwise, the Sahel has experienced a large rainfall variability during these last decades [51]. This variability often translates into severe drought and flooding events, which negatively impact water-resource availability and food security [52,53]. However, Ali [54] showed that the period after 1993 seems to have been a turning point for the Sahel, with a succession of very wet years and very dry years. These authors found that the drought is continuing in the western Sahel, while the eastern part of that region is experiencing a gradual recovery (return to wet conditions). However, this general tendency is sometimes punctuated by the occurrence of extreme hydroclimatic events, such as flooding and strong dry spells, which have dramatic socioeconomic impacts on West African countries. Therefore, the necessity of taking into account the impacts of a possible change in land cover properties (especially changes in vegetation) on the occurrence of compound extreme events over West Africa becomes an important topic to investigate. This work is oriented in this direction.
This study investigates the changes induced by the Sahel–Sahara interface reforestation with regard to compound extremes over West Africa using the Abdus Salam International Centre for Theoretical Physics (ICTP) Regional Climate Model version 4.5 (RegCM4.5). The paper is presented as follows: the model and experimental design are described in Section 2; the results and discussions are presented in Section 3; Section 4 presents the summary and conclusions.
2. Data and Methods
2.1. RegCM Simulations
The fourth generation of the Abdu Salam International Centre for Theoretical Physics (ICTP) regional climate model released version 4.5 (RegCM4.5) was used. Briefly, the RegCM4.5 is a hydrostatic, compressible, sigma-p vertical coordinate model that includes different options of physics parameterizations. This model is extensively described by Giorgi et al. [55]. Diba et al. [19] have already shown that this model can be used to study climate variability over West Africa. A detailed description of the model, the experimental set up, and relevant references are provided in Diba et al. [19]. In this study, the Biosphere Atmosphere Transfer Scheme 1E (BATS1E) from Dickinson et al. [56] was used to simulate the land surface processes. The planetary boundary layer from Holtslag et al. [57] was parameterized. The subgrid explicit moisture and cloud scheme (SUBEX) from Pal et al. [58] was used to parameterize the large-scale rain. The model includes several cumulus convection schemes. The convection schemes used were those of Grell [59], with the closure of Fritsch and Chappell [60] for the main land areas and Emanuel [61] for the ocean as in [19].
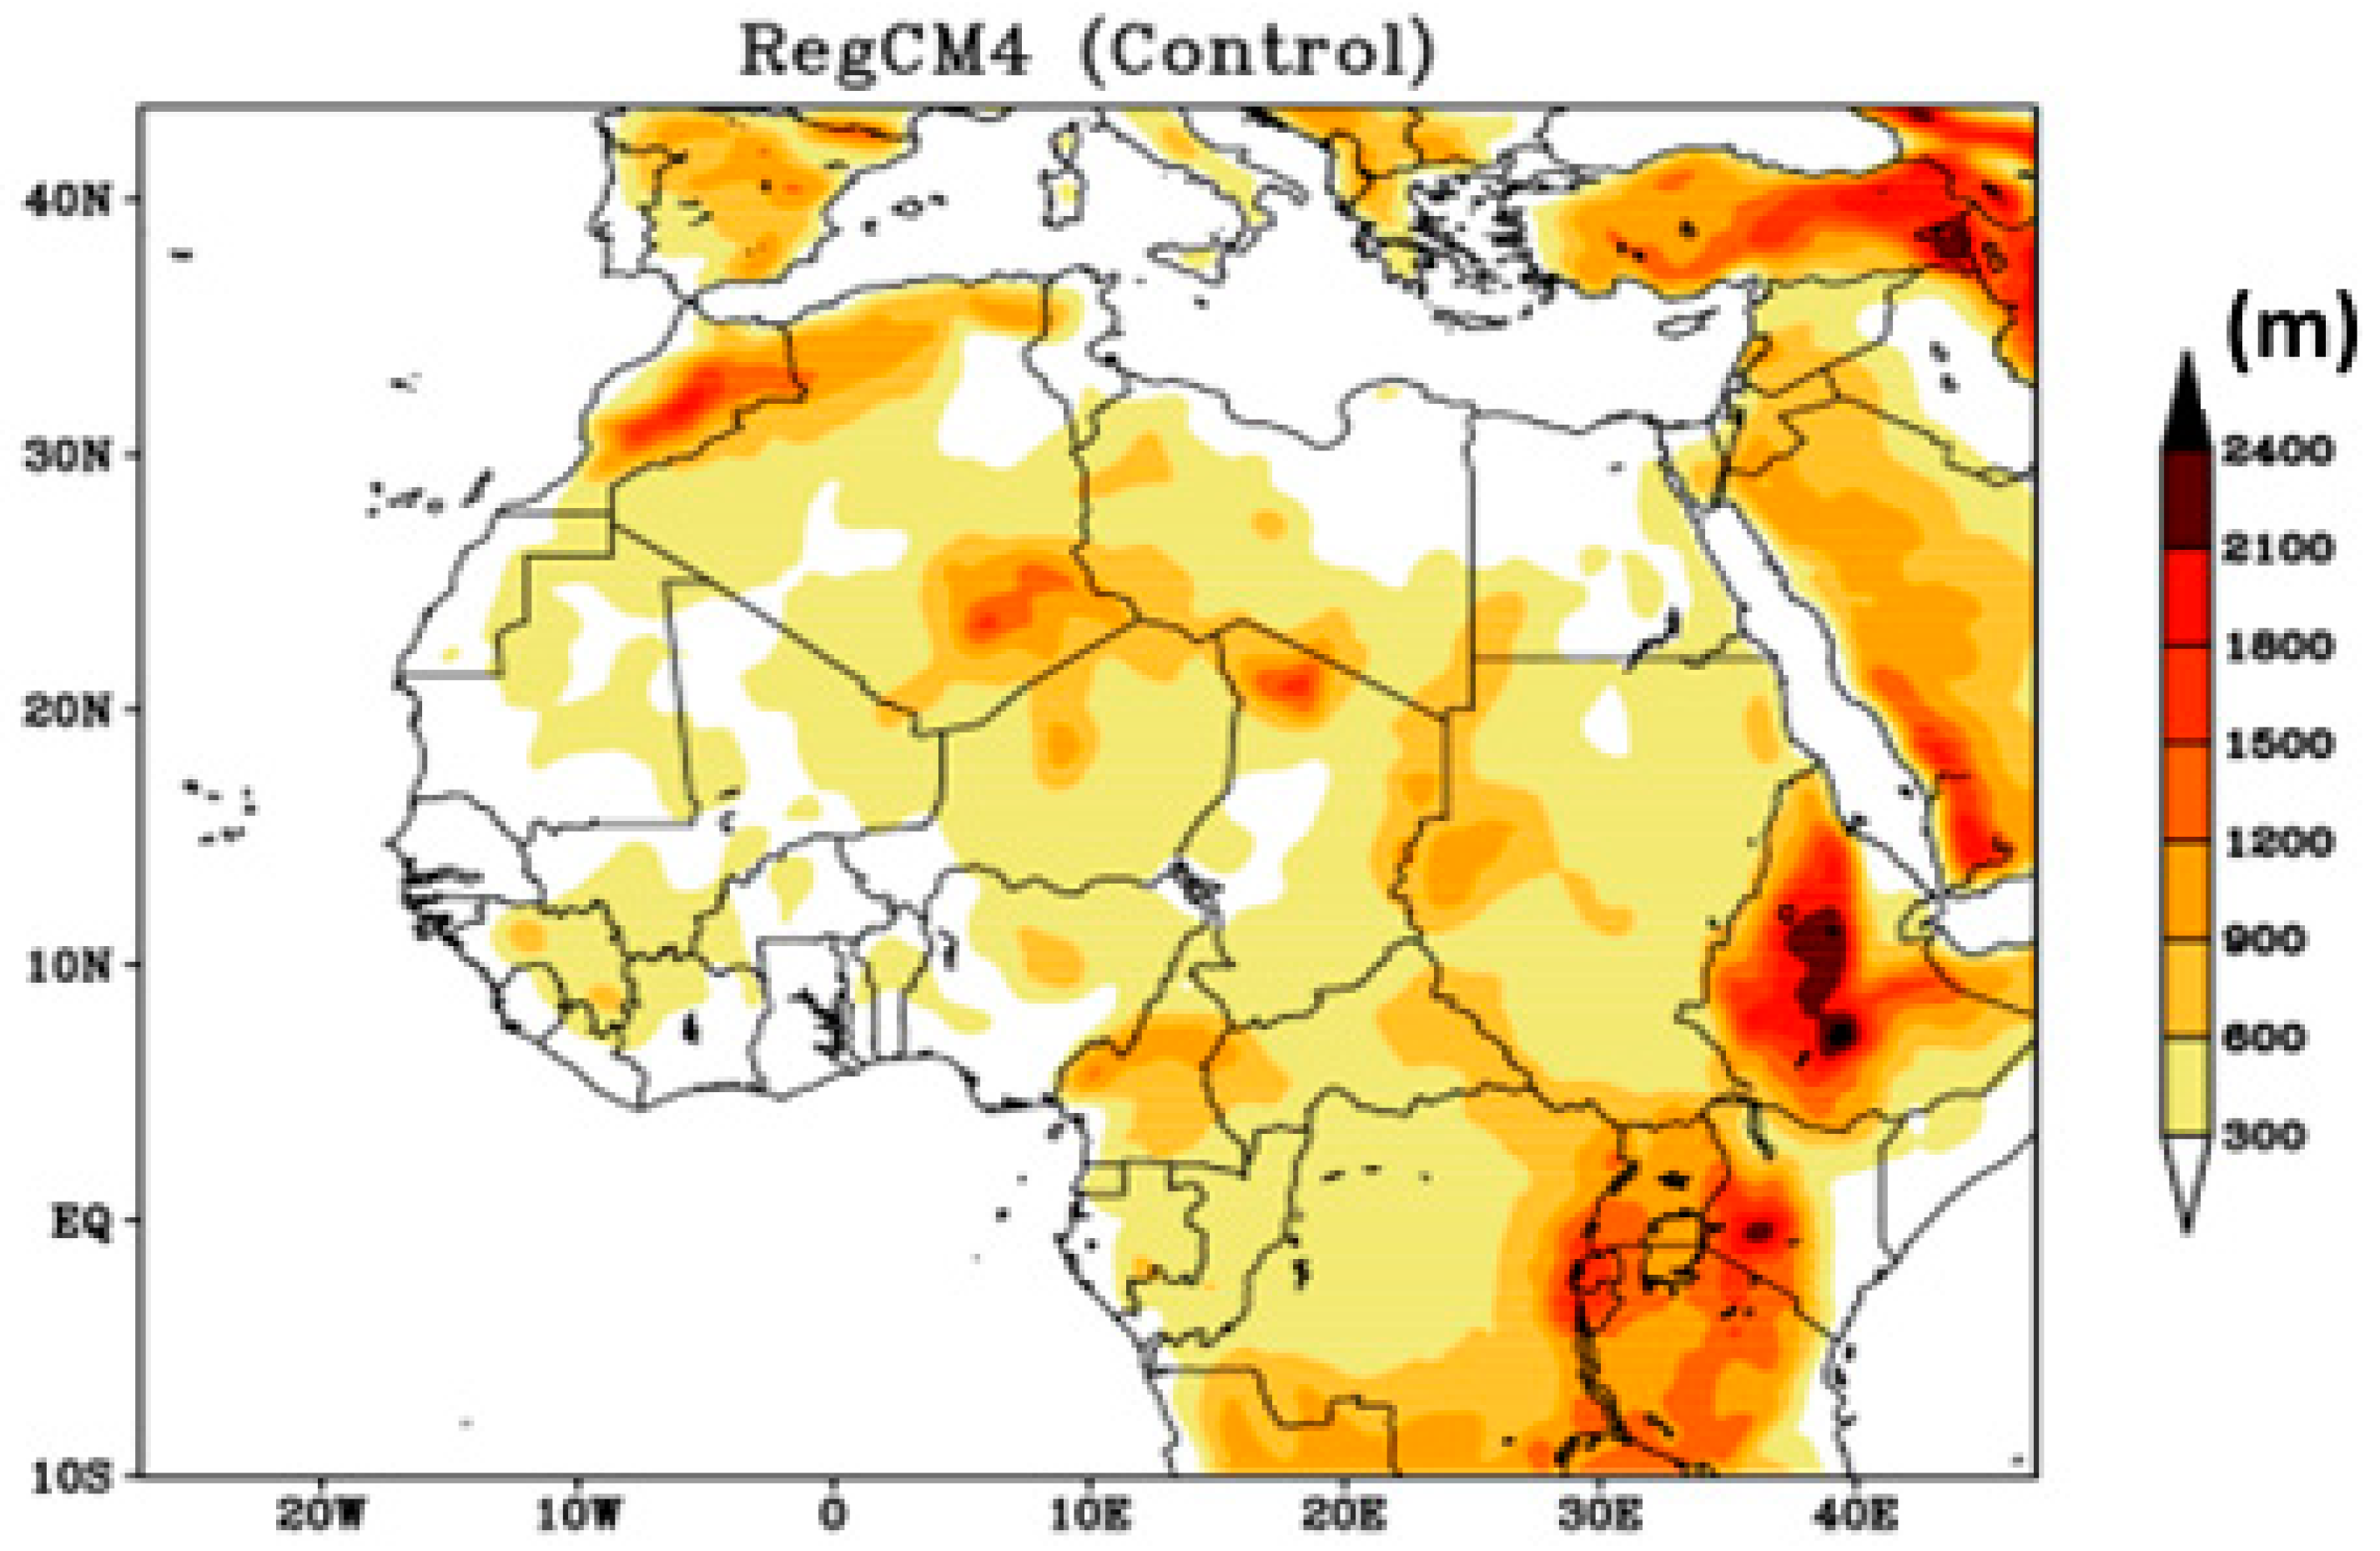
The simulations were driven by the ERA-Interim reanalysis (https://www.ecmwf.int/en/forecasts/datasets/reanalysis-datasets/era-interim, accessed on 20 March 2021) with the horizontal resolution of 1.5° × 1.5° [62,63] at the initial and lateral boundaries, and were carried out at a horizontal resolution of 50 km and 18 vertical sigma-pressure levels. Koné et al. [64] and Kouassi et al. [65] have demonstrated and confirmed, as in [19], that the configuration of RegCM4 used in this study is the best for the region. The simulation domain is represented in Figure 1. Two sets of experiments (model runs) were performed. These runs used two different land cover patterns, as shown in Figure 2. The land cover types used are presented in Table 1. This land cover is associated with a value that can be found in the legend of Figure 2. In the first experiment (Figure 2a), which was the control (CTR) for this study, we used the standard (reference) version of the RegCM4 model. This first simulation is referred to as RegCM4_CTL, and used the default land cover (vegetation) of West Africa provided by the RegCM4 model. In the second experiment, called RegCM4_REFORESTATION, we changed the vegetation cover over the area located between 15° N and 20° N (Sahel–Sahara interface)—which is a combination of grass (15° N–16° N), semi-desert (16° N–18° N), and desert (18° N–20° N)—to forest (Figure 2b) [19,22]. All the integrations started on 1 November 1989 and ran for 20 years and 2 months, until 1 January 2010. The first two months (November–December 1989) were excluded from the analysis to allow the model spin-up time, as in [19,64,66,67]. The impacts of the vegetation cover change were assessed by analyzing the difference between the simulations of the standard version of the RegCM4 model and the reforested version. In response to this land cover change (forest), several physical parameters, such as the leaf area index, albedo, and the roughness length were significantly modified (Table 2). These parameters were responsible for the difference between both runs.
2.2. Definition of Compound Extremes
Following [25], a compound event could be defined as two or more extreme events occurring simultaneously or successively, or the combinations of extreme events with underlying conditions that amplify the impact of the events, or the combinations of events that are not themselves extremes, but lead to an extreme event or impact when combined. According to [26], a compound event is an extreme that depends on several variables or events that are statistically dependent. In this study, the considered compound events (dry/warm and wet/warm) are defined as being when two extremes occur simultaneously (dry and warm or wet and warm). Additionally, individual extremes are characterized as follows: the precipitation (temperature) extremes are defined as dry or wet (cold or warm) when precipitation (temperature) is below/above certain thresholds (10th/90th percentiles) as in [28,29,30,31,34,38,40,43,44,49,68,69,70,71,72,73,74] (Table 3).
Daily rainfall and temperature data from the two runs of the RegCM4 model (with and without reforestation) were used to calculate the number of rainfall and temperature combinations of dry/warm and wet/warm compound extremes (Table 3) during the West African monsoon season (June–July–August–September; JJAS) over West Africa (0–20° N; 18° W–20° E) from 1990 to 2009. Indeed, the climate differences from one region to another were significantly linked to the rainfall and temperature variability. To go deeper into the seasonal characterization of the dry/warm and wet/warm compound extremes, we compared these modes between the beginning (June–July, JJ) and the core (August–September, AS) of the monsoon season.
3. Results and Discussion
3.1. Impact of Reforestation on the Rainfall and Temperature Extremes over West Africa
The simulation of the control (reference) version of the model (RegCM4_CTL) analyzed in this study has already been validated in [19,22,24]. The authors found that the RegCM4 model has low rainfall and surface temperature biases traducing its good ability to simulate the West African climate. For the validation of surface temperature and rainfall [19,22,24], the observed monthly mean surface temperatures of the Climate Research Unit (CRU) TS3.22 [75] and the precipitation data of the Global Precipitation Climatology Project (GPCP) [76] were used. The observed monthly gridded surface temperature data (horizontal resolution of 0.5 × 0.5 grid) were based on an archive provided by more than 4000 weather stations implanted across the world. The GPCP rainfall data are a combination of in situ measurements (rain gauges) and satellite rainfall at a spatial resolution of 2.5° × 2.5°.
This study focused mainly on the impacts of land cover changes (reforestation at the Sahel–Sahara interface) on compound extremes over West Africa by comparing the simulation from the standard version (reference) of the model (RegCM4_CTL) with that of the reforested version (RegCM4_REFORESTATION). The first part of this study was devoted to analyzing some atmospheric features necessary to better interpret the spatial distribution of the rainfall and temperature extremes over West Africa. Figure 3 shows the evapotranspiration, the sensible heat flux (Shf), and the latent heat flux (lhf) averaged from 1990 to 2009 for the RegCM4_CTL model (control case), the RegCM4_REFORESTATION model (reforestation run), and the difference between both runs during the summer season (JJAS period). The evapotranspiration increased from North to South (Figure 3a,b). The highest values (above 4 cg/m2/s) were obtained south of 13° N (over the southern Sahel and the Guinean regions). The weakest values (below 1.5 cg/m2/s) were found over the northern Sahel (Figure 3a,b). The difference between the reforested and the control runs showed an increase in evapotranspiration north of 10° N, with strong values (above 1.2 cg/m2/s) over the reforested areas (Figure 3c). This increase was consistent with the strengthening of the atmospheric moisture content integrated between 1000 and 850 hPa over the whole West African domain (figure not shown). The standard version simulated the maxima of sensible heat flux (>70 W∙m−2) north of 13° N (Figure 3d,e). The reforestation tended to weaken the sensible heat flux between 10° N and 16° N with strong values (>−20 W∙m−2) and to increase it over the northern Sahel, especially over the reforested zone (Figure 3f). The standard version of the RegCM4 model exhibited a dipolar structure of the latent heat flux, with the maxima (>50 W∙m−2) located south of 15° N (southern Sahel and the Guinean regions) and the minima (<30 W∙m−2) over the northern Sahel (Figure 3g,h). Reforestation tended to strengthen the latent heat flux north of 10° N (Figure 3i). This increase was more significant over the northern Sahel, with strong values (>30 W∙m−2) over the reforested zone (Figure 3i).
Dry years are a threat to agriculture, food security, and water availability in West Africa, particularly in the Sahelian zone. This zone has witnessed persistently oppressive droughts that have led to a decrease in agricultural productivity since the 1960s. Other impacts of the dry years include migration, water conflicts, and degradation of biodiversity in the region. Figure 4 shows the number of extreme dry days averaged from 1990 to 2009 for the control version of the model (RegCM4_CTL), the reforested version (RegCM4_ REFORESTATION) and the difference between these two runs. Stronger values of the extreme dry days were recorded over the northern Sahel (a north–south gradient) (Figure 4a,b). The smaller extreme dry days were simulated south of 12° N along the region of the maximum precipitation (ITCZ) and over the orographic regions (Fouta Jallon highlands; Jos Plateau and Cameroon highlands). The reforestation caused a decrease in the extreme dry days over the northern Sahel and the reforested zone (Figure 4c). The reduction in extreme dry days could be due partly to the strengthening of the evapotranspiration and the atmospheric moisture content in the lower layers (Figure not shown) over the reforested areas.
The number of extreme warm days is shown in Figure 5. The two RegCM4 runs simulated a lower frequency of extreme warm days in the southern Sahel and over the orographic regions and the Guinea coast (Figure 5a,b). The stronger values of this index were recorded over the northern Sahel. The difference between the simulations of the model shows that reforestation could strongly influence the frequency of extreme warm days. This index decreased over the reforested zone during the JJAS season (Figure 5c). This decrease in extreme warm days may be caused by an increase in the atmospheric moisture content (Figure not shown) over the Sahel and the weakening of the sensible heat flux (Figure 3f). The reinforcement of the latent heat flux (Figure 3i) led to a decrease in the surface temperature as shown in [77,78] and consequently a decrease in extreme warm days. The decrease in the individual extremes (dry and warm days) over the reforested area may be favorable for the agriculture and pastoralism that are the pillars of the economy of the considered regions.
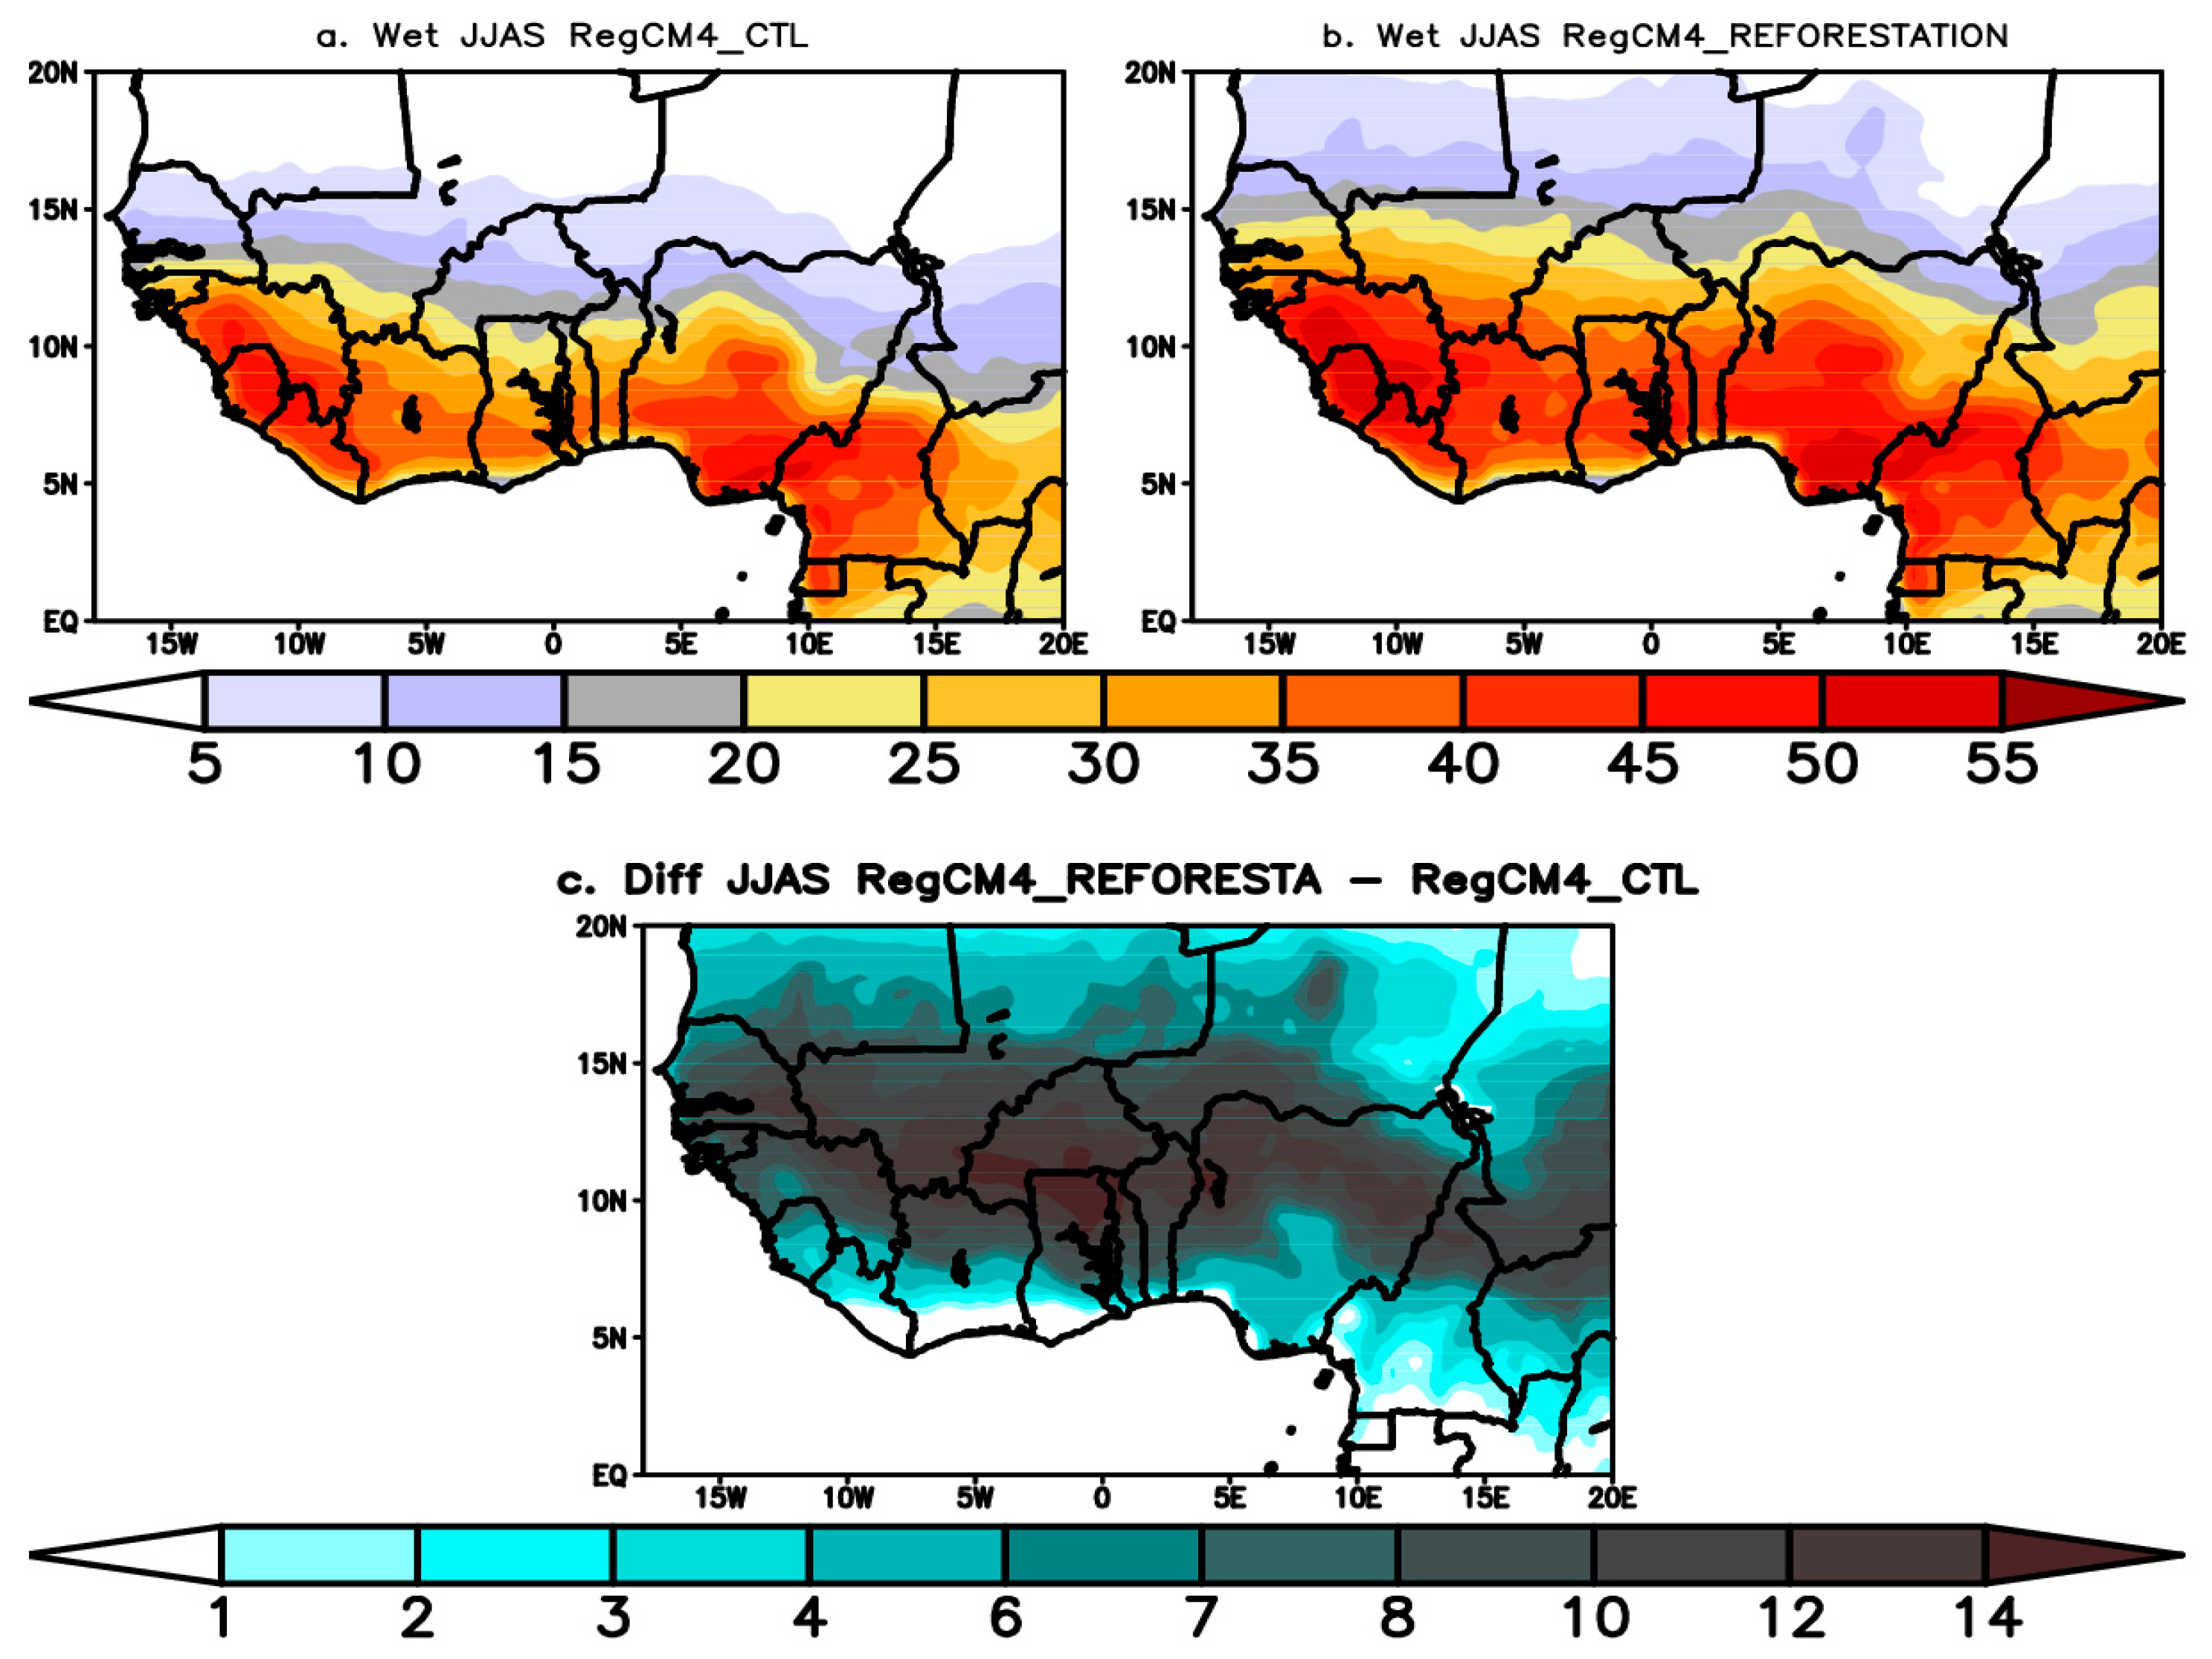
When considering the extreme wet days (number of days with daily rainfall above the 90th percentile of daily mean rainfall), strong values of this index were obtained over the southern Sahel, the orographic regions (Fouta Jallon highlands; Jos Plateau and Cameroon highlands), and the Guinean coast (Figure 6a,b). These very strong rainfall events are known to be favorable to flooding, and therefore they are a major concern for local populations and policymakers. The smallest values of these indices were simulated in the northern Sahel for both runs (Figure 6a,b). The analysis showed an increase in extreme wet days over and off the reforested zone during the JJAS period (Figure 6c), which could be associated partly with the strengthening of evapotranspiration (Figure 3c) over most parts of the West African domain. Furthermore, the increase in extreme wet days may induce several consequences, such as flooding.
3.2. Impact of Reforestation on Compound Extremes over West Africa
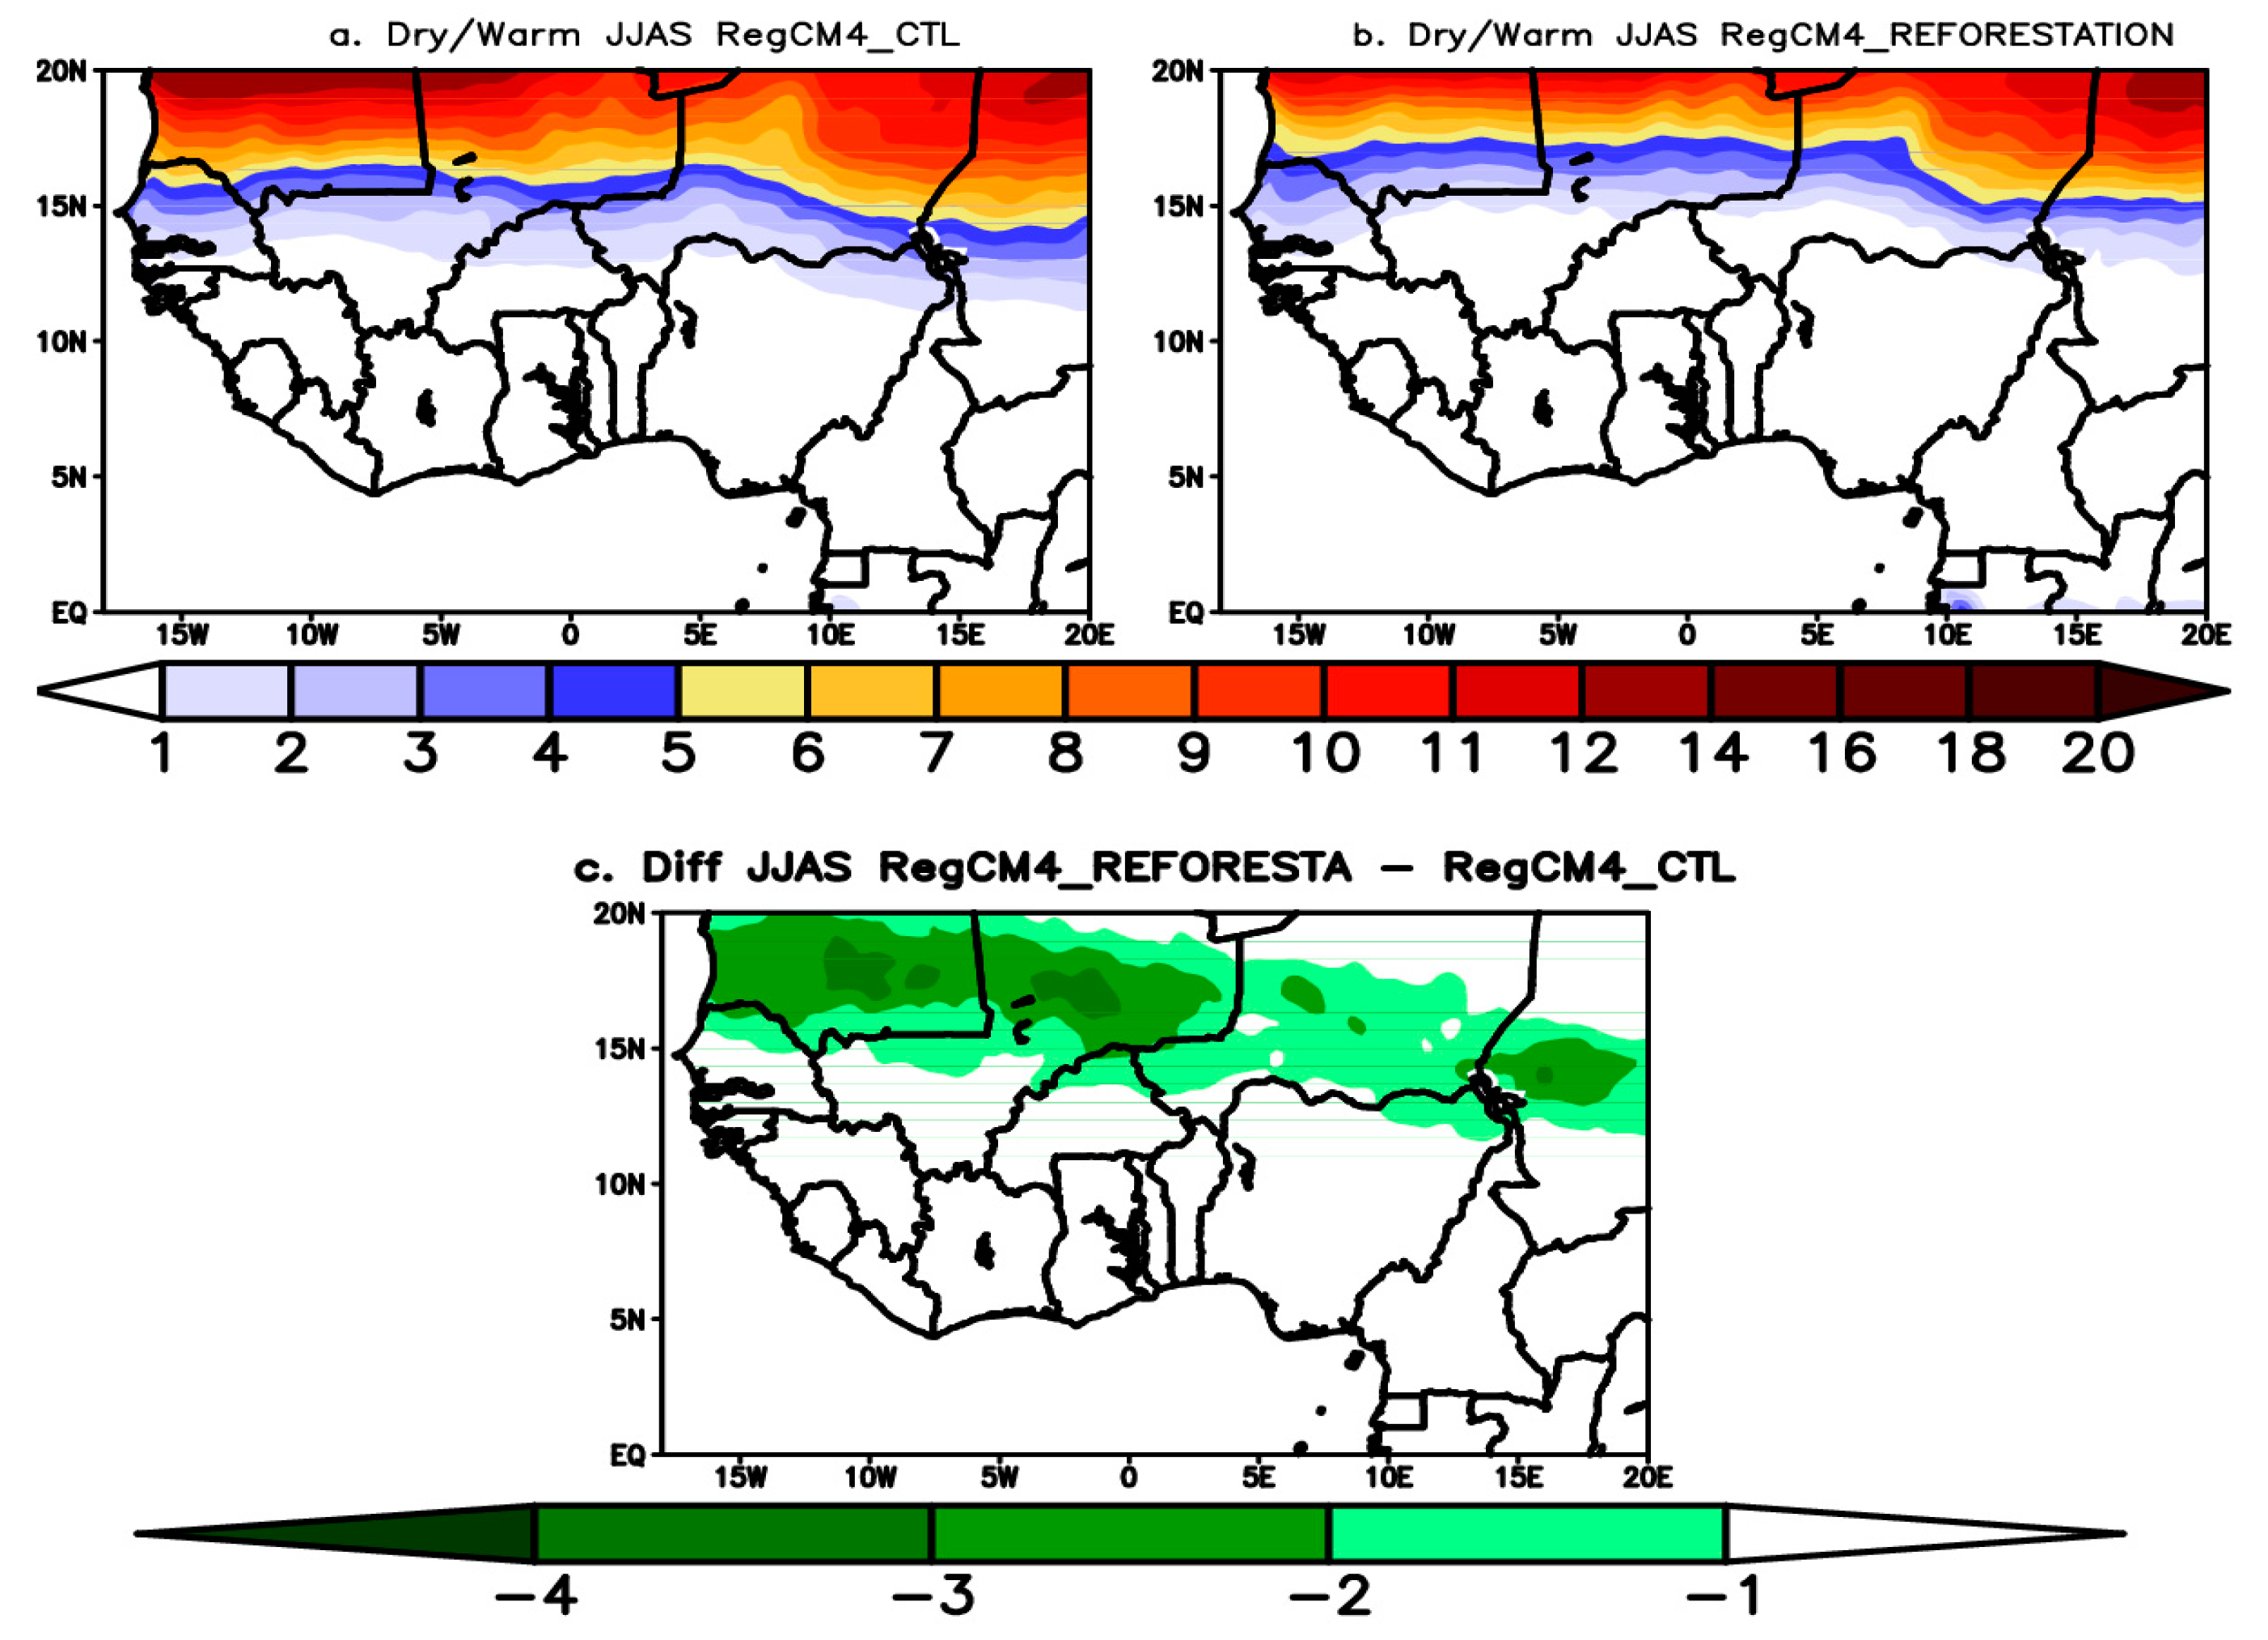
Climate change affects many climate parameters, including precipitation and temperature. Over West Africa, studies on climate extremes have mainly focused on the extremes from a single variable, such as heavy/lower precipitation or maximum/minimum temperature. Moreover, several studies have extensively explored the compound precipitation and temperature extremes in Europe, Russia, China, and United States [28,30,38]. In this work, the frequency of compound extremes is defined as the number of days with concurrent dry, warm, or wet extremes over the considered season. The analysis of compound extremes over the 1990–2009 period shows that the two experiments simulated a strong occurrence of the compound dry/warm mode over the northern Sahel (around the northern part of Mauritania, Mali, and Niger), probably due to the weak precipitation values recorded in these zones during the monsoon season (Figure 7a,b). Moreover, human health and crop yields may be negatively impacted by the compound dry/warm mode. Reforestation tends to decrease the compound dry/warm mode over the reforested domain (Figure 7c). This decrease is partly linked to the reduction in individual extreme events (dry and warm days) over the reforested zone. This decrease in the dry/warm mode during the rainy season (JJAS) could have positive effects on crop yields of the Sahelian regions. The reduction in compound dry/warm mode could also be beneficial to local populations because it could lead to a decrease in energy consumption for the preservation of foodstuffs in rural areas, and for cooling and air conditioning in urban areas. Moreover, human health could also be positively affected by the decrease in the compound dry/warm mode because high temperatures pose a serious threat to the human organism and to plants. The two experiments showed a strong occurrence of the compound wet/warm mode over the Sahel during the June-September (JJAS) period (Figure 8a,b). This may be linked to the high convection and strong rainfall amount over this zone during the rainy season (JJAS). The difference between both simulations of the model shows that reforestation increases the compound wet/warm mode over the reforested zone (Figure 8c). The impact of reforestation is also manifested by a decrease in the compound wet/warm mode outside the reforested area between 10° N and 14° N. The increase in the compound wet/warm mode may be partly driven by the increase in extreme wet days. This variation in the wet/warm mode could have impacts on biodiversity, ecosystem services, and agriculture.
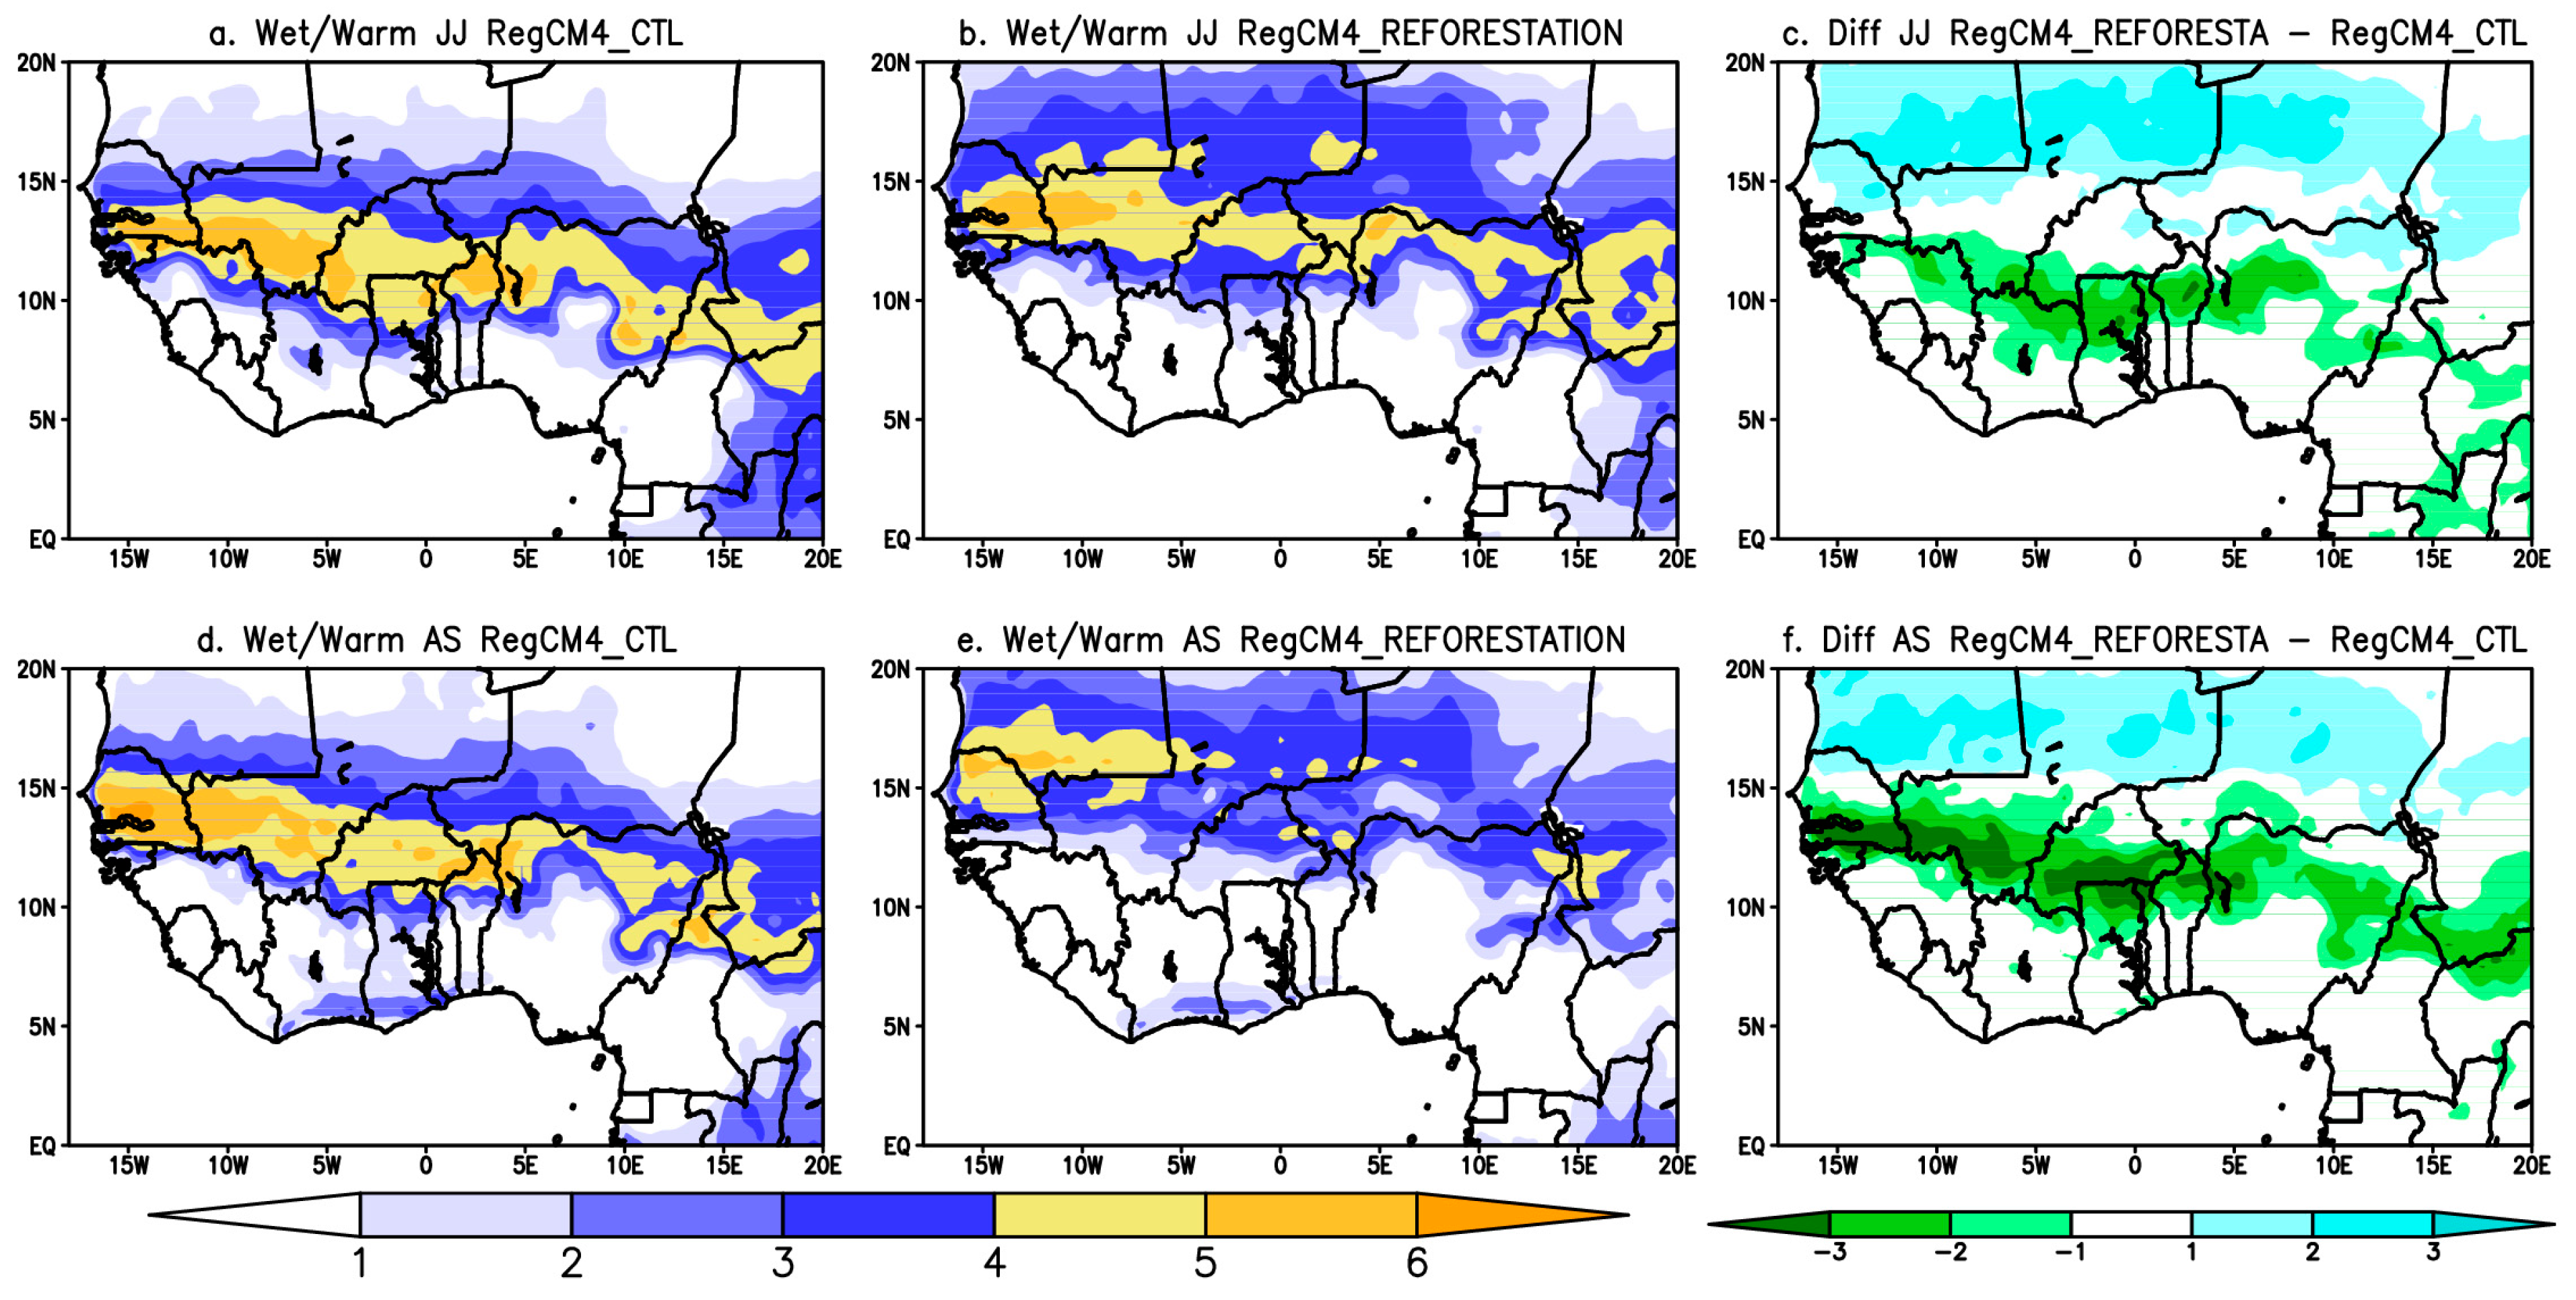
The last part of this study was devoted to the intra-seasonal characterization of the compound rainfall extreme events during the beginning (June–July, JJ) and the core (August–September, AS) of the rainy season (Figure 9 and Figure 10). A strong occurrence of the dry/warm compound extreme mode was diagnosed over the reforested area during the JJ period (Figure 9a,b). Reforestation mainly affected this index during the June–July period by decreasing it in the reforested area (Figure 9c,f) as in the summer period (JJAS). In the AS period, reforestation had little effect on this mode. The spatial distribution of the compound wet/warm mode during the beginning of the rainy season (JJ) was similar to that of the core of the rainy season (AS) (Figure 10a,b,d,e). The land vegetation change affected the compound wet/warm mode similarly during the JJ and AS periods by increasing (decreasing) it over the reforested area (southern Sahel), respectively (Figure 10c,f).
4. Conclusions
In this work, we studied the impacts of the reforestation at the Sahel–Sahara interface on the compound extremes over West Africa. To achieve this objective, we performed two sets of regional climate model experiments (with and without reforestation). Results show that reforestation modified compound rainfall over and off the reforested area. This result confirms the remote effect of reforestation, which means that change in vegetation cover can affect rainfall and temperature locally or in distant regions [17,19]. Moreover, the present work provides a first overview of the impacts of the reforestation at the Sahel–Sahara interface on the compound extreme rainfall events over West Africa.
Results show strong values of extreme dry days over the northern Sahel. The smaller values of extreme dry days were simulated south of 12° N and over the orographic regions (Fouta Jallon highlands; Jos Plateau and Cameroon highlands). Both RegCM4 runs simulated a lower frequency of extreme warm days in the southern Sahel and the Guinean coast. The stronger values of extreme warm days were recorded over the northern Sahel. Reforestation may strongly influence the frequency of individual extreme events (dry and warm days) by decreasing them over the reforested zone and outside this zone during the June–September (JJAS) period. The decrease in these extreme dry and warm days may be linked to an increase in atmospheric moisture content over the whole West African region and the weakening of the sensible heat flux between 10° N and 16° N.
Strong values of extreme wet days were obtained over the southern Sahel, the orographic regions (Fouta Jallon highlands; Jos Plateau and Cameroon highlands), and the Guinea coast. Results show an increase in extreme wet days over and off the reforested zone, which could be associated partly with the strengthening of evapotranspiration over most parts of the West African domain.
When considering the compound dry/warm mode, the two experiments simulated strong values of this mode over the northern Sahel due to the weak precipitation recorded in this zone. The impact of reforestation decreased this index over the reforested domain. Moreover, this decrease was more pronounced during the beginning of the rainy season (June–July, JJ). This index-weakening may be partly associated with the decrease in individual extreme events (dry and warm days). This decrease in compound dry/warm mode over the reforested area may be favorable for the agriculture of the considered regions. The analysis also shows a strong occurrence of the compound wet/warm mode over the Sahel during the June–September (JJAS) period. Results show an increase in the compound extreme wet/warm mode over the reforested zone during the summer season (JJAS). This may be partly driven by the increase in extreme wet days over the reforested zone. Additionally, results show that reforestation affected the compound wet/warm mode similarly during the beginning (June–July, JJ) and the core (August–September) of the rainy season.
Finally, the results show that reforestation decreased the dry/warm mode as well as individual extreme (dry and warm days) indices, especially over the reforested area, suggesting that this land cover change may have a positive impact on agriculture and human health, particularly over the reforested area. This study also suggests that ongoing greening efforts, such as the West African Great Green Wall project, may be a good option in creating favorable environmental conditions for increasing Sahel rainfall. However, an increase in the wet/warm mode and extreme wet days may induce dramatic consequences, such as flooding.
Author Contributions
I.D. and M.C. performed the design/conceptualization of the paper. I.D. processed the data. All the authors analyzed and discussed the results and contributed to the manuscript. All authors have read and agreed to the published version of the manuscript.
Funding
This research was partly funded by the IRD (Institut de Recherche pour le Développement; France) grant number UMR IGE Imputation 252RA5.
Data Availability Statement
Data used in this study are the outputs of the ICTP RegCM4 model. The ICTP website for downloading the RegCM4 model is: https://github.com/ictp-esp/RegCM/ (accessed on 15 February 2022). ERA-Interim reanalysis are available in the link hereafter https://www.ecmwf.int/en/forecasts/datasets/reanalysis-datasets/era-interim (accessed on 20 March 2021).
Acknowledgments
The authors would like to thank the Assane SECK University of Ziguinchor, the “Fond d’Impulsion de la Recherche Scientifique et Technologique” program of MESRI (Senegal), the LMI-ECLAIRS2 and the LMI-NEXUS for their support.
Conflicts of Interest
The authors declare no conflict of interest regarding the publication of this paper.
References
- IPCC. Summary for Policymakers. Climate Change, 2013. The Physical Science Basis. Contribution of Working Group I to the Fifth Assessment Report of the Intergovernmental Panel on Climate Change; Stocker, T.F., Qin, D., Plattner, G.-K., Tignor, M., Allen, S.K., Boschung, J., Nauels, A., Xia, Y., Bexm, V., Midgley, P.M., Eds.; Cambridge University Press: Cambridge, UK, 2013. [Google Scholar]
- Klutse, N.A.B.; Sylla, M.B.; Diallo, I.; Sarr, A.; Dosio, A.; Diedhiou, A.; Kamga, A.; Lamptey, B.; Ali, A.; Gbobaniyi, E.O.; et al. Daily characteristics of West African monsoon rainfall in CORDEX regional climate models. Theor. Appl. Climatol. 2015, 123, 369–386. [Google Scholar] [CrossRef]
- Bichet, A.; Diedhiou, A. West African Sahel has become wetter during the last 30 years, but dry spells are shorter and more frequent. Clim. Res. 2018, 75, 155–162. [Google Scholar] [CrossRef] [Green Version]
- Lamptey, B. An analytical framework for estimating the urban effect on climate. Int. J. Clim. 2009, 30, 72–88. [Google Scholar] [CrossRef]
- Dinku, T.; Ceccato, P.; Grover-Kopec, E.; Lemma, M.; Connor, S.J.; Ropelewski, C.F. Validation of satellite rainfall products over East Africa’s complex topography. Int. J. Remote Sens. 2007, 8, 1503–1526. [Google Scholar] [CrossRef]
- Hountondji, Y.C.H. Dynamique Environnementale en Zones Sahélienne et Soudanienne de l’Afrique de l’Ouest: Analyse des Modifications et Evaluation de la Dégradation du Couvert Végétal. Ph.D. Thesis, Faculté des Sciences, Université de Liège, Liège, Belgium, 2008. [Google Scholar]
- Avakoudjo, J.; Mama, A.; Toko, I.; Kindomihou, V.; Sinsin, B. Dynamique de l’occupation du sol dans le Parc National du W et sa périphérie au nord-ouest du Bénin. Int. J. Biol. Chem. Sci. 2014, 8, 2608–2625. [Google Scholar] [CrossRef] [Green Version]
- Zoungrana, B.J.B. Vegetation Dynamics in the Southwest of Burkina Faso in Response to Rainfall Variability and Land Use. Ph.D. Thesis, Kwame Nkrumah University of Science and Technology, Kumasi, Ghana, 2016. [Google Scholar]
- Bene, A.; Fournier, A. Végétation naturelle et occupation des terres au Burkina Faso (Afrique de l’ouest). Cinq décennies de changement dans un terroir du pays sèmè. In Regards Scientifiques Croisés sur le Chan-Gement Global et le Développement–Langue, Environnement, Culture; Actes du Colloque International de Ouagadougou (8–10 March 2012); Fabre, G., Fournier, A., Sanogo, L., Eds.; 2014; pp. 143–164. Available online: https://halshs.archives-ouvertes.fr/LEC-OUAGA-2012/public/lec-ouaga-2012.pdf (accessed on 10 January 2022).
- Ozer, P.; Hountondji, Y.C.; Niang, A.J.; Karimoune, S.; Laminou, M.O.; Salmon, M. Désertification au sahel: Historique et perspectives. BSGLg 2010, 54, 69–84. [Google Scholar]
- Xue, Y.; Shukla, J. The Influence of Land Surface Properties on Sahel Climate. Part I: Desertification. J. Clim. 1993, 6, 2232–2245. [Google Scholar] [CrossRef] [Green Version]
- Xue, Y.; Shukla, J. The Influence of Land Surface Properties on Sahel Climate. Part II. Afforestation. J. Clim. 1996, 9, 3260–3275. [Google Scholar] [CrossRef] [Green Version]
- Zheng, X.; Eltahir, E.A.B. The Role of Vegetation in the Dynamics of West African Monsoons. J. Clim. 1998, 11, 2078–2096. [Google Scholar] [CrossRef]
- Wang, G.; Eltahir, E.A.B. Role of vegetation dynamics in enhancing the low-frequency variability of the Sahel rainfall. Water Resour. Res. 2000, 36, 1013–1021. [Google Scholar] [CrossRef] [Green Version]
- Alo, C.A.; Wang, G. Role of vegetation dynamics in regional climate predictions over western Africa. Clim. Dyn. 2010, 35, 907–922. [Google Scholar] [CrossRef]
- Wang, G.; Alo, C.A. Changes in Precipitation Seasonality in West Africa Predicted by RegCM3 and the Impact of Dynamic Vegetation Feedback. Int. J. Geophys. 2011, 2012, 597205. [Google Scholar] [CrossRef] [Green Version]
- Abiodun, B.J.; Adeyewa, Z.D.; Oguntunde, P.; Salami, A.; Ajayi, V.O. Modeling the impacts of reforestation on future climate in West Africa. Theor. Appl. Climatol. 2012, 110, 77–96. [Google Scholar] [CrossRef]
- Zaroug, M.A.H.; Sylla, M.B.; Giorgi, F.; Eltahir, E.A.B.; Aggarwal, P.K. A sensitivity study on the role of the swamps of southern Sudan in the summer climate of North Africa using a regional climate model. Theor. Appl. Climatol. 2013, 113, 63–81. [Google Scholar] [CrossRef] [Green Version]
- Diba, I.; Camara, M.; Sarr, A.B. Impacts of the Sahel-Sahara Interface Reforestation on West African Climate: Intraseasonal Variability and Extreme Precipitation Events. Adv. Meteorol. 2016, 2016, 3262451. [Google Scholar] [CrossRef]
- Diasso, U.; Abiodun, B.J. Future impacts of global warming and reforestation on drought patterns over West Africa. Theor. Appl. Climatol. 2017, 133, 647–662. [Google Scholar] [CrossRef]
- Odoulami, R.C.; Abiodun, B.J.; Ajayi, A.E.; Diasso, U.J.; Saley, M.M. Potential impacts of forestation on heat waves over West Africa in the future. Ecol. Eng. 2017, 102, 546–556. [Google Scholar] [CrossRef]
- Diba, I.; Camara, M.; Sarr, A.B.; Diedhiou, A. Potential Impacts of Land Cover Change on the Interannual Variability of Rainfall and Surface Temperature over West Africa. Atmosphere 2018, 9, 376. [Google Scholar] [CrossRef] [Green Version]
- Bamba, A.; Diallo, I.; Toure, N.E.; Kouadio, K.; Konaré, A.; Dramé, M.S.; Diedhiou, A.; Silué, S.; Doumbia, M.; Tall, M. Effect of the African greenbelt position on West African summer climate: A regional climate modeling study. Theor. Appl. Climatol. 2018, 137, 309–322. [Google Scholar] [CrossRef]
- Diba, I.; Camara, M.; Diedhiou, A. Impacts of the Sahel-Sahara Interface Reforestation on West African Climate: Intra-Annual Variability and Extreme Temperature Events. Atmospheric Clim. Sci. 2019, 9, 35–61. [Google Scholar] [CrossRef] [Green Version]
- Seneviratne, S.I.; Nicholls, N.; Easterling, D.; Goodess, C.M.; Kanae, S.; Kossin, J.; Luo, Y.; Marengo, J.; McInnes, K.; Rahimi, M.; et al. Changes in climate extremes and their impacts on the natural physical environment. In Managing the Risks of Extreme Events and Disasters to Advance Climate Change Adaptation; Field, C.B., Barros, V., Stocker, T.F., Qin, D., Dokken, D., Ebi, K.L., Mastrandrea, M.D., Mach, K.J., Plattner, G.-K., Allen, S.K., et al., Eds.; A Special Report of Working Groups I And II of the Intergovernmental Panel on Climate Change (IPCC); Cambridge University Press: Cambridge, UK, 2012; pp. 109–230. [Google Scholar]
- Leonard, M.; Westra, S.; Phatak, A.; Lambert, M.; Hurk, B.V.D.; McInnes, K.; Risbey, J.; Schuster, S.; Jakob, D.; Stafford-Smith, M. A compound event framework for understanding extreme impacts. Wiley Interdiscip. Rev. Clim. Chang. 2014, 5, 113–128. [Google Scholar] [CrossRef]
- McPhillips, L.E.; Chang, H.; Chester, M.V.; Depietri, Y.; Friedman, E.; Grimm, N.B.; Kominoski, J.S.; McPhearson, T.; Méndez-Lázaro, P.; Rosi, E.J.; et al. Defining Extreme Events: A Cross-Disciplinary Review. Earth’s Future 2018, 6, 441–455. [Google Scholar] [CrossRef]
- Hao, Z.; Singh, V.P.; Hao, F. Compound Extremes in Hydroclimatology: A Review. Water 2018, 10, 718. [Google Scholar] [CrossRef] [Green Version]
- Zscheischler, J.; Martius, O.; Westra, S.; Bevacqua, E.; Raymond, C.; Horton, R.M.; van den Hurk, B.; AghaKouchak, A.; Jézéquel, A.; Mahecha, M.D.; et al. A typology of compound weather and climate events. Nat. Rev. Earth Environ. 2020, 1, 333–347. [Google Scholar] [CrossRef]
- Zhou, P.; Liu, Z. Likelihood of concurrent climate extremes and variations over China. Environ. Res. Lett. 2018, 13, 094023. [Google Scholar] [CrossRef] [Green Version]
- Zscheischler, J.; Fischer, E.M. The record-breaking compound hot and dry 2018 growing season in Germany. Weather Clim. Extremes 2020, 29, 100270. [Google Scholar] [CrossRef]
- Lyon, B. Southern Africa Summer Drought and Heat Waves: Observations and Coupled Model Behavior. J. Clim. 2009, 22, 6033–6046. [Google Scholar] [CrossRef]
- Albright, T.P.; Pidgeon, A.M.; Rittenhouse, C.D.; Clayton, M.K.; Wardlow, B.D.; Flather, C.H.; Culbert, P.D.; Radeloff, V.C. Combined effects of heat waves and droughts on avian communities across the conterminous United States. Ecosphere 2010, 1, 1–22. [Google Scholar] [CrossRef]
- Hao, Z.; AghaKouchak, A.; Phillips, T.J. Changes in concurrent monthly precipitation and temperature extremes. Environ. Res. Lett. 2013, 8, 034014. [Google Scholar] [CrossRef] [Green Version]
- Horton, R.M.; Mankin, J.S.; Lesk, C.; Coffel, E.; Raymond, C. A Review of Recent Advances in Research on Extreme Heat Events. Curr. Clim. Chang. Rep. 2016, 2, 242–259. [Google Scholar] [CrossRef]
- Orth, R.; Zscheischler, J.; Seneviratne, S.I. Record dry summer in 2015 challenges precipitation projections in central Europe. Sci. Rep. 2016, 6, 28334. [Google Scholar] [CrossRef] [PubMed]
- Sedlmeier, K.; Feldmann, H.; Schädler, G. Compound summer temperature and precipitation extremes over central Europe. Theor. Appl. Climatol. 2018, 131, 1493–1501. [Google Scholar] [CrossRef]
- Wu, X.; Hao, Z.; Hao, F.; Zhang, X. Variations of compound precipitation and temperature extremes in China during 1961–2014. Sci. Total Environ. 2019, 663, 731–737. [Google Scholar] [CrossRef] [PubMed]
- Livneh, B.; Hoerling, M.P. The Physics of Drought in the U.S. Central Great Plains. J. Clim. 2016, 29, 6783–6804. [Google Scholar] [CrossRef]
- Feng, S.; Wu, X.; Hao, Z.; Hao, Y.; Zhang, X.; Hao, F. A database for characteristics and variations of global compound dry and hot events. Weather Clim. Extrem. 2020, 30, 100299. [Google Scholar] [CrossRef]
- Olmo, M.; Bettolli, M.L.; Rusticucci, M. Atmospheric circulation influence on temperature and precipitation individual and compound daily extreme events: Spatial variability and trends over southern South America. Weather Clim. Extrem. 2020, 29, 100267. [Google Scholar] [CrossRef]
- Yu, R.; Zhai, P. Changes in compound drought and hot extreme events in summer over populated eastern China. Weather Clim. Extrem. 2020, 30, 100295. [Google Scholar] [CrossRef]
- Vogel, J.; Paton, E.; Aich, V.; Bronstert, A. Increasing compound warm spells and droughts in the Mediterranean Basin. Weather Clim. Extrem. 2021, 32, 100312. [Google Scholar] [CrossRef]
- Beniston, M. Trends in joint quantiles of temperature and precipitation in Europe since 1901 and projected for 2100. Geophys. Res. Lett. 2009, 36. [Google Scholar] [CrossRef] [Green Version]
- Sillmann, J.; Sippel, S.; Russo, S. Climate Extremes and Their Implications for Impact and Risk Assessment; Elsevier: Amsterdam, The Netherlands, 2019. [Google Scholar] [CrossRef]
- Martius, O.; Pfahl, S.; Chevalier, C. A global quantification of compound precipitation and wind extremes. Geophys. Res. Lett. 2016, 43, 7709–7717. [Google Scholar] [CrossRef] [Green Version]
- Zhang, Y.; Sun, X.; Chen, C. Characteristics of concurrent precipitation and wind speed extremes in China. Weather Clim. Extrem. 2021, 32, 100322. [Google Scholar] [CrossRef]
- Owen, L.E.; Catto, J.L.; Stephenson, D.B.; Dunstone, N.J. Compound precipitation and wind extremes over Europe and their relationship to extratropical cyclones. Weather Clim. Extrem. 2021, 33, 100342. [Google Scholar] [CrossRef]
- Morán-Tejeda, E.; Herrera, S.; López-Moreno, J.I.; Revuelto, J.; Lehmann, A.; Beniston, M. Evolution and frequency (1970–2007) of combined temperature–precipitation modes in the Spanish mountains and sensitivity of snow cover. Reg. Environ. Chang. 2013, 13, 873–885. [Google Scholar] [CrossRef] [Green Version]
- Fontaine, B.; Janicot, S.; Monerie, P.A. Recent Changes in Air Temperature, Heat Waves Occurrences and Atmospheric Circulation in Northern Africa. J. Geophys. Res. 2013, 118, 8536–8552. [Google Scholar] [CrossRef]
- Lu, J.; Delworth, T. Oceanic forcing of the late 20th century Sahel drought. Geophys. Res. Lett. 2005, 32, L22706. [Google Scholar] [CrossRef] [Green Version]
- Giorgi, F.; Coppola, E.; Raffaele, F.; Diro, G.T.; Fuentes-Franco, R.; Giuliani, G.; Mamgain, A.; Llopart, M.P.; Mariotti, L.; Torma, C. Changes in extremes and hydroclimatic regimes in the CREMA ensemble projections. Clim. Change 2014, 125, 39–51. [Google Scholar] [CrossRef]
- Diallo, I.; Giorgi, F.; Deme, A.; Tall, M.; Mariotti, L.; Gaye, A.T. Projected changes of summer monsoon extremes and hy-droclimatic regimes over West Africa for the twenty-first century. Clim. Dyn. 2016, 47, 3931–3954. [Google Scholar] [CrossRef]
- Ali, A. Climate variability and change in the Sahel. Understanding the current situation by observing Climate change in the Sahel. A challenge for sustainable development. AGRHYMET Monthly Bull, 2011; 17–20. Available online: http://www.agrhymet.ne/PDF/pdfeng/specialChCang.pdf(accessed on 20 March 2021).
- Giorgi, F.; Coppola, E.; Solmon, F.; Mariotti, L.; Sylla, M.B.; Bi, X.; Elguindi, N.; Diro, G.T.; Nair, V.; Giuliani, G.; et al. RegCM4: Model description and preliminary tests over multiple CORDEX domains. Clim. Res. 2012, 52, 7–29. [Google Scholar] [CrossRef] [Green Version]
- Dickinson, R.E.; Henderson, S.A.; Kennedy, P.J. Biosphere-atmosphere Transfer Scheme (BATS) Version 1e as Coupled to the NCAR Community Climate Model. NCAR Tech. Rep. 1993, TN-387+STR, 72. [Google Scholar] [CrossRef]
- Holtslag, A.; De Bruijn, E.; Pan, H. A high resolution air mass transformation model for short-range weather forecasting. Mon. Weather Rev. 1990, 118, 1561–1575. [Google Scholar] [CrossRef]
- Pal, J.S.; Small, E.; Eltahir, E.A.B. Simulation of regional-scale water and energy budgets: Representation of subgrid cloud and precipitation processes within RegCM. J. Geophys. Res. Atmos. 2000, 105, 29579–29594. [Google Scholar] [CrossRef] [Green Version]
- Grell, G.A. Prognostic evaluation of assumptions used by cumulus parameterizations. Mon. Weather Rev. 1993, 121, 764–787. [Google Scholar] [CrossRef] [Green Version]
- Fritsch, J.M.; Chappell, C.F. Numerical Prediction of Convectively Driven Mesoscale Pressure Systems. Part I: Convective Parameterization. J. Atmos. Sci. 1980, 37, 1722–1733. [Google Scholar] [CrossRef] [Green Version]
- Emanuel, K.A. A scheme for representing cumulus convection in large-scale models. J. Atmos. Sci. 1991, 48, 2313–2335. [Google Scholar] [CrossRef]
- Simmons, A.S.; Uppala, D.; Kobayashi, S. ERA-Interim: New ECMWF reanalysis products from 1989 onwards. ECMWF Newsl. 2007, 110, 29–35. [Google Scholar] [CrossRef]
- Uppala, S.; Dee, D.; Kobayashi, S.; Berrisford, P.; Simmons, A. Towards a climate data assimilation system: Status update of ERA-Interim. ECMWF Newsl. 2008, 115, 12–18. [Google Scholar] [CrossRef]
- Koné, B.; Diedhiou, A.; Touré, N.E.; Sylla, M.B.; Giorgi, F.; Anquetin, S.; Bamba, A.; Diawara, A.; Kobea, A.T. Sensitivity study of the regional climate model RegCM4 to different convective schemes over West Africa. Earth Syst. Dyn. 2018, 9, 1261–1278. [Google Scholar] [CrossRef] [Green Version]
- Kouassi, A.A.; Kone, B.; Silue, S.; Dajuma, A.; N’Datchoh, T.E.; Adon, M.; Yoboue, V.; Diedhiou, A. Sensitivity Study of the RegCM4’s Surface Schemes in the Simulations of West Africa Climate. Atmos. Clim. Sci. 2022, 12, 86–104. [Google Scholar] [CrossRef]
- Zhong, Z.; Hu, Y.; Min, J.; Xu, H. Numerical experiments on the spin-up time for seasonal-scale regional climate modeling. J. Meteorol. Res. 2007, 21, 409–419. [Google Scholar]
- Camara, M.; Jenkins, G.; Konare, A. Impacts of dust on West African climate during 2005 and 2006. Atmos. Chem. Phys. 2010, 10, 3053–3086. [Google Scholar]
- Benestad, R.E.; Haugen, J.E. On complex extremes: Flood hazards and combined high spring-time precipitation and tempera-ture in Norway. Clim. Chang. 2007, 85, 381–406. [Google Scholar] [CrossRef]
- Tencer, B.; Weaver, A.; Zwiers, F. Joint Occurrence of Daily Temperature and Precipitation Extreme Events over Canada. J. Appl. Meteorol. Climatol. 2014, 53, 2148–2162. [Google Scholar] [CrossRef]
- Arsenović, P.; Tošić, I.; Unkašević, M. Trends in combined climate indices in Serbia from 1961 to 2010. Meteorol. Atmos. Phys. 2015, 127, 489–498. [Google Scholar] [CrossRef]
- Tencer, B.; Bettolli, M.L.; Rusticucci, M. Compound temperature and precipitation extreme events in southern South America: Associated atmospheric circulation, and simulations by a multi-RCM ensemble. Clim. Res. 2016, 68, 183–199. [Google Scholar] [CrossRef] [Green Version]
- Zscheischler, J.; Seneviratne, S.I. Dependence of drivers affects risks associated with compound events. Sci. Adv. 2017, 3, e1700263. [Google Scholar] [CrossRef] [PubMed] [Green Version]
- Lu, Y.; Hu, H.; Li, C.; Tian, F. Increasing compound events of extreme hot and dry days during growing seasons of wheat and maize in China. Sci. Rep. 2018, 8, 1–8. [Google Scholar] [CrossRef] [PubMed] [Green Version]
- Feng, S.; Hao, Z.; Zhang, X.; Hao, F. Probabilistic evaluation of the impact of compound dry-hot events on global maize yields. Sci. Total Environ. 2019, 689, 1228–1234. [Google Scholar] [CrossRef]
- Harris, I.; Jones, P.D.; University of East Anglia Climatic Research Unit. CRU TS3.22: Climatic Research Unit (CRU) Time-Series (TS) Version 3.22 of High Resolution Gridded Data of Month-by-Month Variation in Climate (January 1901–December 2013); NCAS British Atmospheric Data Centre: London, UK, 2014. [Google Scholar] [CrossRef]
- Adler, R.F.; Huffman, G.J.; Chang, A.; Ferraro, R.; Xie, P.P.; Janowiak, J.; Rudolf, B.; Curtis, S.; Arkin, P.; Nelkin, E.; et al. The version-2 global precipitation climatology project (GPCP) monthly precipita-tion analysis (1979–present). J. Hydrometeorol. 2003, 4, 1147–1167. [Google Scholar] [CrossRef]
- Diba, I.; Camara, M. Analyse De L’impact Du Changement De La Couverture Végétale Sur La Pluie Et La Température De Surface Au Sénégal. Eur. Sci. J. ESJ 2017, 13, 270. [Google Scholar] [CrossRef] [Green Version]
- Wang, L.; Cheung, K. Potential impact of reforestation programmes and uncertainties in land cover effects over the loess plateau: A regional climate modeling study. Clim. Chang. 2017, 144, 475–490. [Google Scholar] [CrossRef]
Figure 1.
Topography (m) of the simulation domain (West Africa) from the RegCM4 model.

Figure 2.
Distribution of land cover types in the study domain: (a) the standard version of RegCM4 model and (b) the reforested version RegCM4_REFORESTATION. The reforested zone (between 15° N–20° N).
Figure 2.
Distribution of land cover types in the study domain: (a) the standard version of RegCM4 model and (b) the reforested version RegCM4_REFORESTATION. The reforested zone (between 15° N–20° N).

Figure 3.
(a–c) Evapotranspiration (Evap) expressed in cg/m2/s, (d–f) sensible heat flux (Shf) and (g–i) latent heat flux (lhf) expressed in W∙m−2 during the JJAS period averaged from 1990 to 2009 over West Africa for RegCM4_CTL; RegCM4_REFORESTATION and RegCM4_REFORESTATION—RegCM4_CTL.
Figure 3.
(a–c) Evapotranspiration (Evap) expressed in cg/m2/s, (d–f) sensible heat flux (Shf) and (g–i) latent heat flux (lhf) expressed in W∙m−2 during the JJAS period averaged from 1990 to 2009 over West Africa for RegCM4_CTL; RegCM4_REFORESTATION and RegCM4_REFORESTATION—RegCM4_CTL.

Figure 4.
Number (expressed in days) of extreme dry days during the JJAS period averaged from 1990 to 2009 over West Africa for: (a) RegCM4_CTL; (b) RegCM4_REFORESTATION and (c) RegCM4_REFORESTATION—RegCM4_CTL.
Figure 4.
Number (expressed in days) of extreme dry days during the JJAS period averaged from 1990 to 2009 over West Africa for: (a) RegCM4_CTL; (b) RegCM4_REFORESTATION and (c) RegCM4_REFORESTATION—RegCM4_CTL.

Figure 5.
Number (expressed in days) of extreme warm days during the JJAS period averaged from 1990 to 2009 over West Africa for: (a) RegCM4_CTL; (b) RegCM4_REFORESTATION and (c) RegCM4_REFORESTATION—RegCM4_CTL.
Figure 5.
Number (expressed in days) of extreme warm days during the JJAS period averaged from 1990 to 2009 over West Africa for: (a) RegCM4_CTL; (b) RegCM4_REFORESTATION and (c) RegCM4_REFORESTATION—RegCM4_CTL.

Figure 6.
Number (expressed in days) of extreme wet days during the JJAS period averaged from 1990 to 2009 over West Africa for: (a) RegCM4_CTL; (b) RegCM4_REFORESTATION and (c) RegCM4_REFORESTATION—RegCM4_CTL.
Figure 6.
Number (expressed in days) of extreme wet days during the JJAS period averaged from 1990 to 2009 over West Africa for: (a) RegCM4_CTL; (b) RegCM4_REFORESTATION and (c) RegCM4_REFORESTATION—RegCM4_CTL.

Figure 7.
Number (expressed in days) of compound dry/warm during the JJAS period averaged from 1990 to 2009 over West Africa for: (a) RegCM4_CTL; (b) RegCM4_REFORESTATION and (c) RegCM4_REFORESTATION—RegCM4_CTL.
Figure 7.
Number (expressed in days) of compound dry/warm during the JJAS period averaged from 1990 to 2009 over West Africa for: (a) RegCM4_CTL; (b) RegCM4_REFORESTATION and (c) RegCM4_REFORESTATION—RegCM4_CTL.

Figure 8.
Number (expressed in days) of compound wet/warm during the JJAS period averaged from 1990 to 2009 over West Africa for: (a) RegCM4_CTL; (b) RegCM4_REFORESTATION and (c) RegCM4_REFORESTATION—RegCM4_CTL.
Figure 8.
Number (expressed in days) of compound wet/warm during the JJAS period averaged from 1990 to 2009 over West Africa for: (a) RegCM4_CTL; (b) RegCM4_REFORESTATION and (c) RegCM4_REFORESTATION—RegCM4_CTL.

Figure 9.
Number (expressed in days) of extreme dry/warm days during the June–July (JJ) and August–September (AS) periods averaged from 1990 to 2009 over West Africa for: (a,d) RegCM4_CTL; (b,e) RegCM4_REFORESTATION and (c,f) RegCM4_REFORESTATION—RegCM4_CTL.
Figure 9.
Number (expressed in days) of extreme dry/warm days during the June–July (JJ) and August–September (AS) periods averaged from 1990 to 2009 over West Africa for: (a,d) RegCM4_CTL; (b,e) RegCM4_REFORESTATION and (c,f) RegCM4_REFORESTATION—RegCM4_CTL.

Figure 10.
Number (expressed in days) of extreme wet/warm days during the June–July (JJ) and August–September (AS) periods averaged from 1990 to 2009 over West Africa for: (a,d) RegCM4_CTL; (b,e) RegCM4_REFORESTATION and (c,f) RegCM4_REFORESTATION—RegCM4_CTL.
Figure 10.
Number (expressed in days) of extreme wet/warm days during the June–July (JJ) and August–September (AS) periods averaged from 1990 to 2009 over West Africa for: (a,d) RegCM4_CTL; (b,e) RegCM4_REFORESTATION and (c,f) RegCM4_REFORESTATION—RegCM4_CTL.


Table 1.
Land cover types/vegetation classes used in this study. NB: the values below indicate the type of land cover used in this study which can be found in the legend of Figure 2.
Table 1.
Land cover types/vegetation classes used in this study. NB: the values below indicate the type of land cover used in this study which can be found in the legend of Figure 2.
| Crop/Mixed Farming |
|---|
| 1. Short grass |
| 2. Evergreen needleleaf tree |
| 3. Deciduous needleleaf tree |
| 4. Deciduous broadleaf tree |
| 5. Evergreen broadleaf tree |
| 6. Tall grass |
| 7. Desert |
| 8. Tundra |
| 9. Irrigated crop |
| 10. Semi-desert |
| 11. Ice cap/glacier |
| 12. Bog or marsh |
| 13. Inland water |
| 14. Ocean |
| 15. Evergreen shrub |
| 16. Deciduous shrub |
| 17. Mixed woodland |
| 18. Forest/field mosaic |
| 19. Water and land mixture |
Table 2.
Summary of BATS land cover characteristics used in the study. See Dickinson et al. [56] for more details.
Table 2.
Summary of BATS land cover characteristics used in the study. See Dickinson et al. [56] for more details.
| Parameters | Short Grass | Tall Grass | Desert | Semi-Desert | Forest |
|---|---|---|---|---|---|
| Max fractional vegetation cover | 0.80 | 0.80 | 0.00 | 0.35 | 0.80 |
| Vegetation albedo for wave lengths < 0.7 μm | 0.10 | 0.08 | 0.20 | 0.17 | 0.06 |
| Vegetation albedo for wave lengths > 0.7 μm | 0.30 | 0.30 | 0.40 | 0.34 | 0.18 |
| Difference between max fractional vegetation cover and cover at 269 K | 0.1 | 0.0 | 0.2 | 0.0 | 0.4 |
| Roughness length (m) | 0.05 | 0.10 | 0.05 | 0.10 | 0.30 |
| Min stomatal resistance (s/m) | 60 | 60 | 200 | 150 | 120 |
| Max leaf area index | 2 | 6 | 0 | 6 | 6 |
| Min leaf area index | 0.5 | 0.5 | 0 | 0.5 | 0.5 |
| Stem (dead matter area index) | 4.0 | 2.0 | 0.5 | 2.0 | 2.0 |
| Root zone soil layer depth (mm) | 1000 | 1000 | 1000 | 1000 | 2000 |
| Soil texture type | 6 | 6 | 3 | 5 | 6 |
| Soil color type | 3 | 4 | 1 | 2 | 4 |
Table 3.
Definitions of the five extremes used in this study [28,29,30,31,34,38,40,43,44,49,68,69,70,71,72,73,74].
| Indices | Definitions |
|---|---|
| Extreme dry days | Number of days with daily rainfall different to zero and below the 10th percentile of daily mean rainfall |
| Extreme warm days | Number of days with daily temperature above the 90th percentile of daily maximum temperature |
| Extreme wet days | Number of days with daily rainfall above the 90th percentile of daily mean rainfall |
| Compound dry/warm | Number of days with daily rainfall different to zero and below the 10th percentile of daily mean rainfall and daily temperature above the 90th percentile of daily maximum temperature |
| Compound wet/warm | Number of days with daily rainfall above the 90th percentile of daily mean rainfall and daily temperature above the 90th percentile of daily maximum temperature |
Publisher’s Note: MDPI stays neutral with regard to jurisdictional claims in published maps and institutional affiliations. |
© 2022 by the authors. Licensee MDPI, Basel, Switzerland. This article is an open access article distributed under the terms and conditions of the Creative Commons Attribution (CC BY) license (https://creativecommons.org/licenses/by/4.0/).
Share and Cite
MDPI and ACS Style
Camara, M.; Diba, I.; Diedhiou, A. Effects of Land Cover Changes on Compound Extremes over West Africa Using the Regional Climate Model RegCM4. Atmosphere 2022, 13, 421. https://doi.org/10.3390/atmos13030421
AMA Style
Camara M, Diba I, Diedhiou A. Effects of Land Cover Changes on Compound Extremes over West Africa Using the Regional Climate Model RegCM4. Atmosphere. 2022; 13(3):421. https://doi.org/10.3390/atmos13030421
Chicago/Turabian StyleCamara, Moctar, Ibrahima Diba, and Arona Diedhiou. 2022. "Effects of Land Cover Changes on Compound Extremes over West Africa Using the Regional Climate Model RegCM4" Atmosphere 13, no. 3: 421. https://doi.org/10.3390/atmos13030421
Note that from the first issue of 2016, this journal uses article numbers instead of page numbers. See further details here.