European In-Situ Snow Measurements: Practices and Purposes

 , ,
, ,  , , , , , and
Abstract
:1. Introduction
2. European Survey on Snow Measurement Practices and Applied Instrumentation
3. Results
3.1. Participating Countries and Institutions
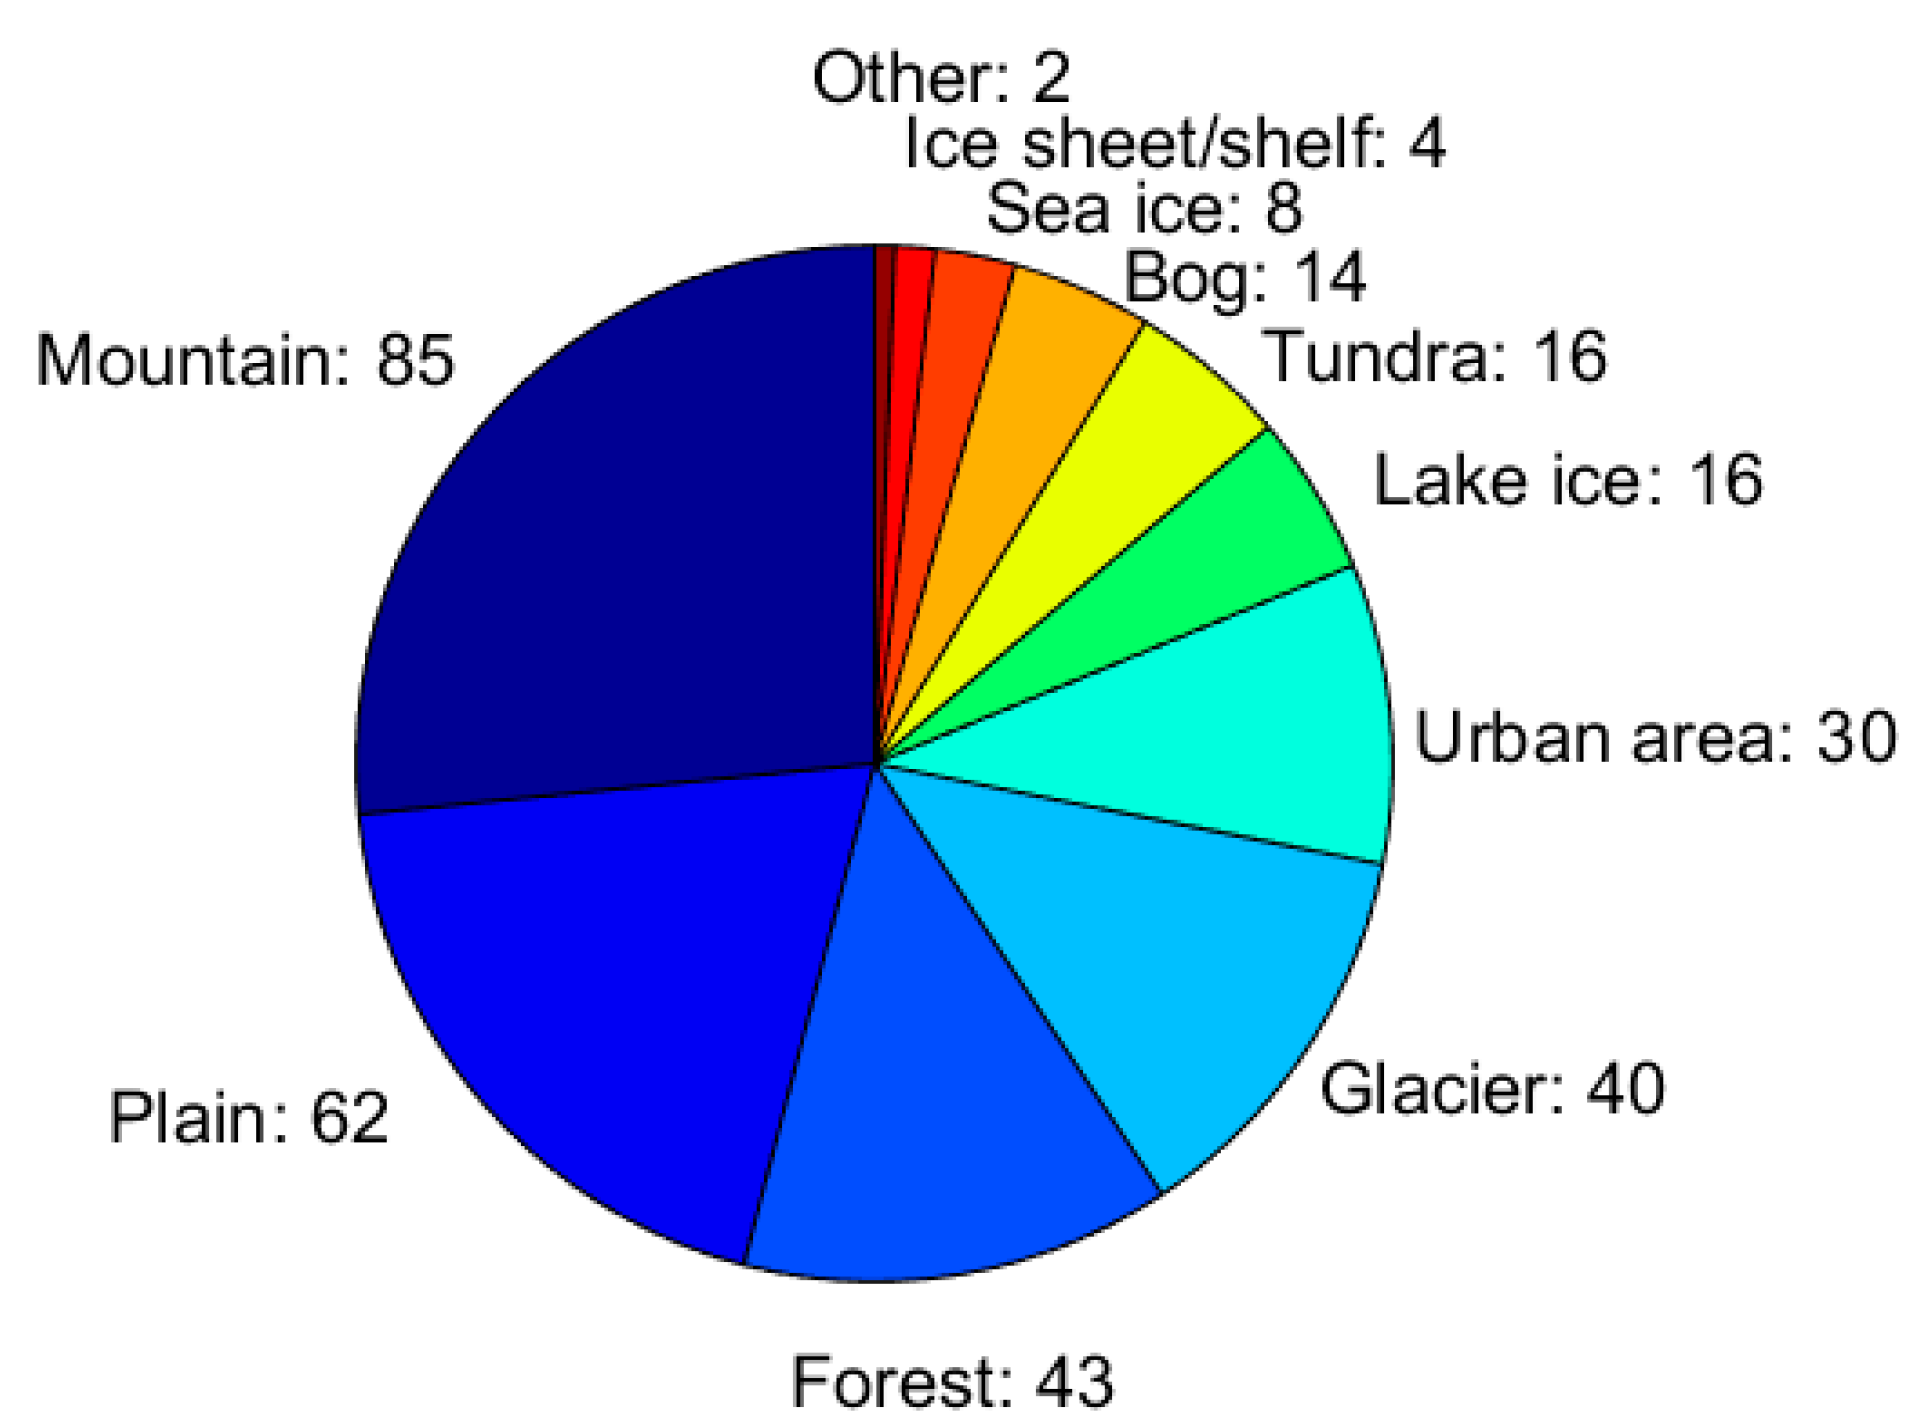
3.2. Purpose of the Measurements and Measurement Environment
3.3. Measured Properties and Applied Instrumentation
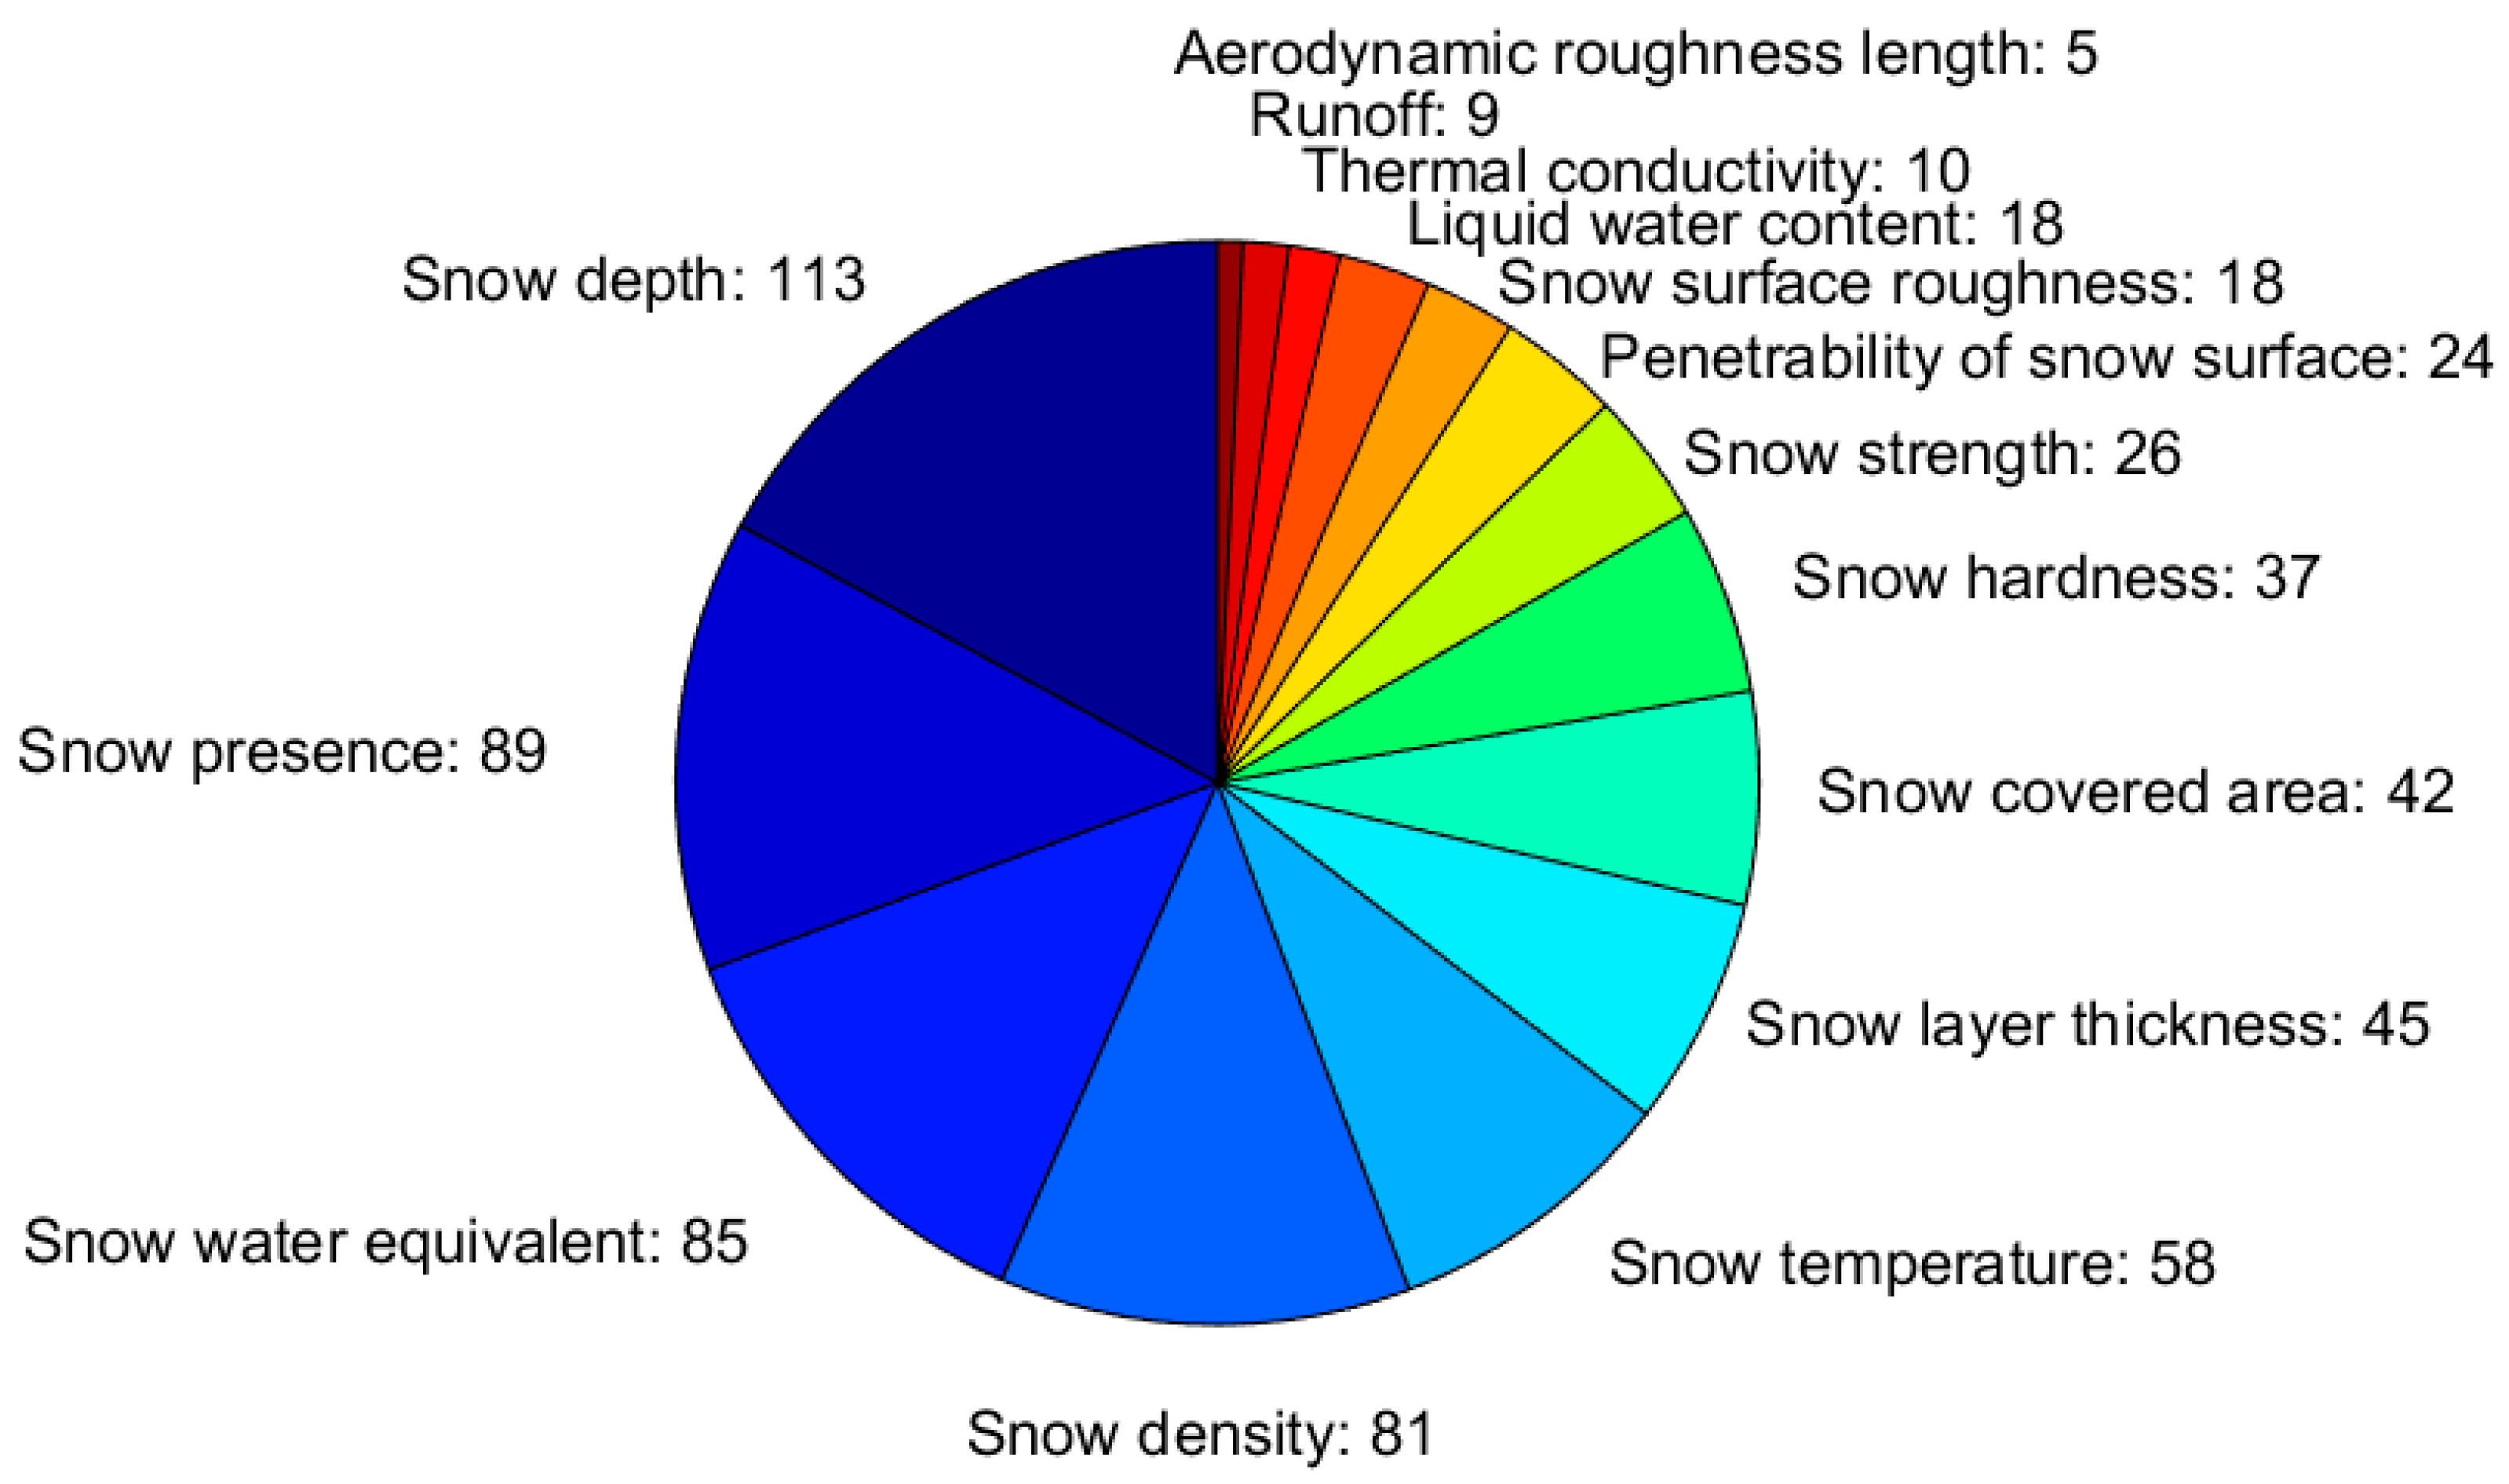
3.3.1. Snow Macrophysical Properties
3.3.2. Snow Microphysical Properties
3.3.3. Snow Electromagnetic Properties
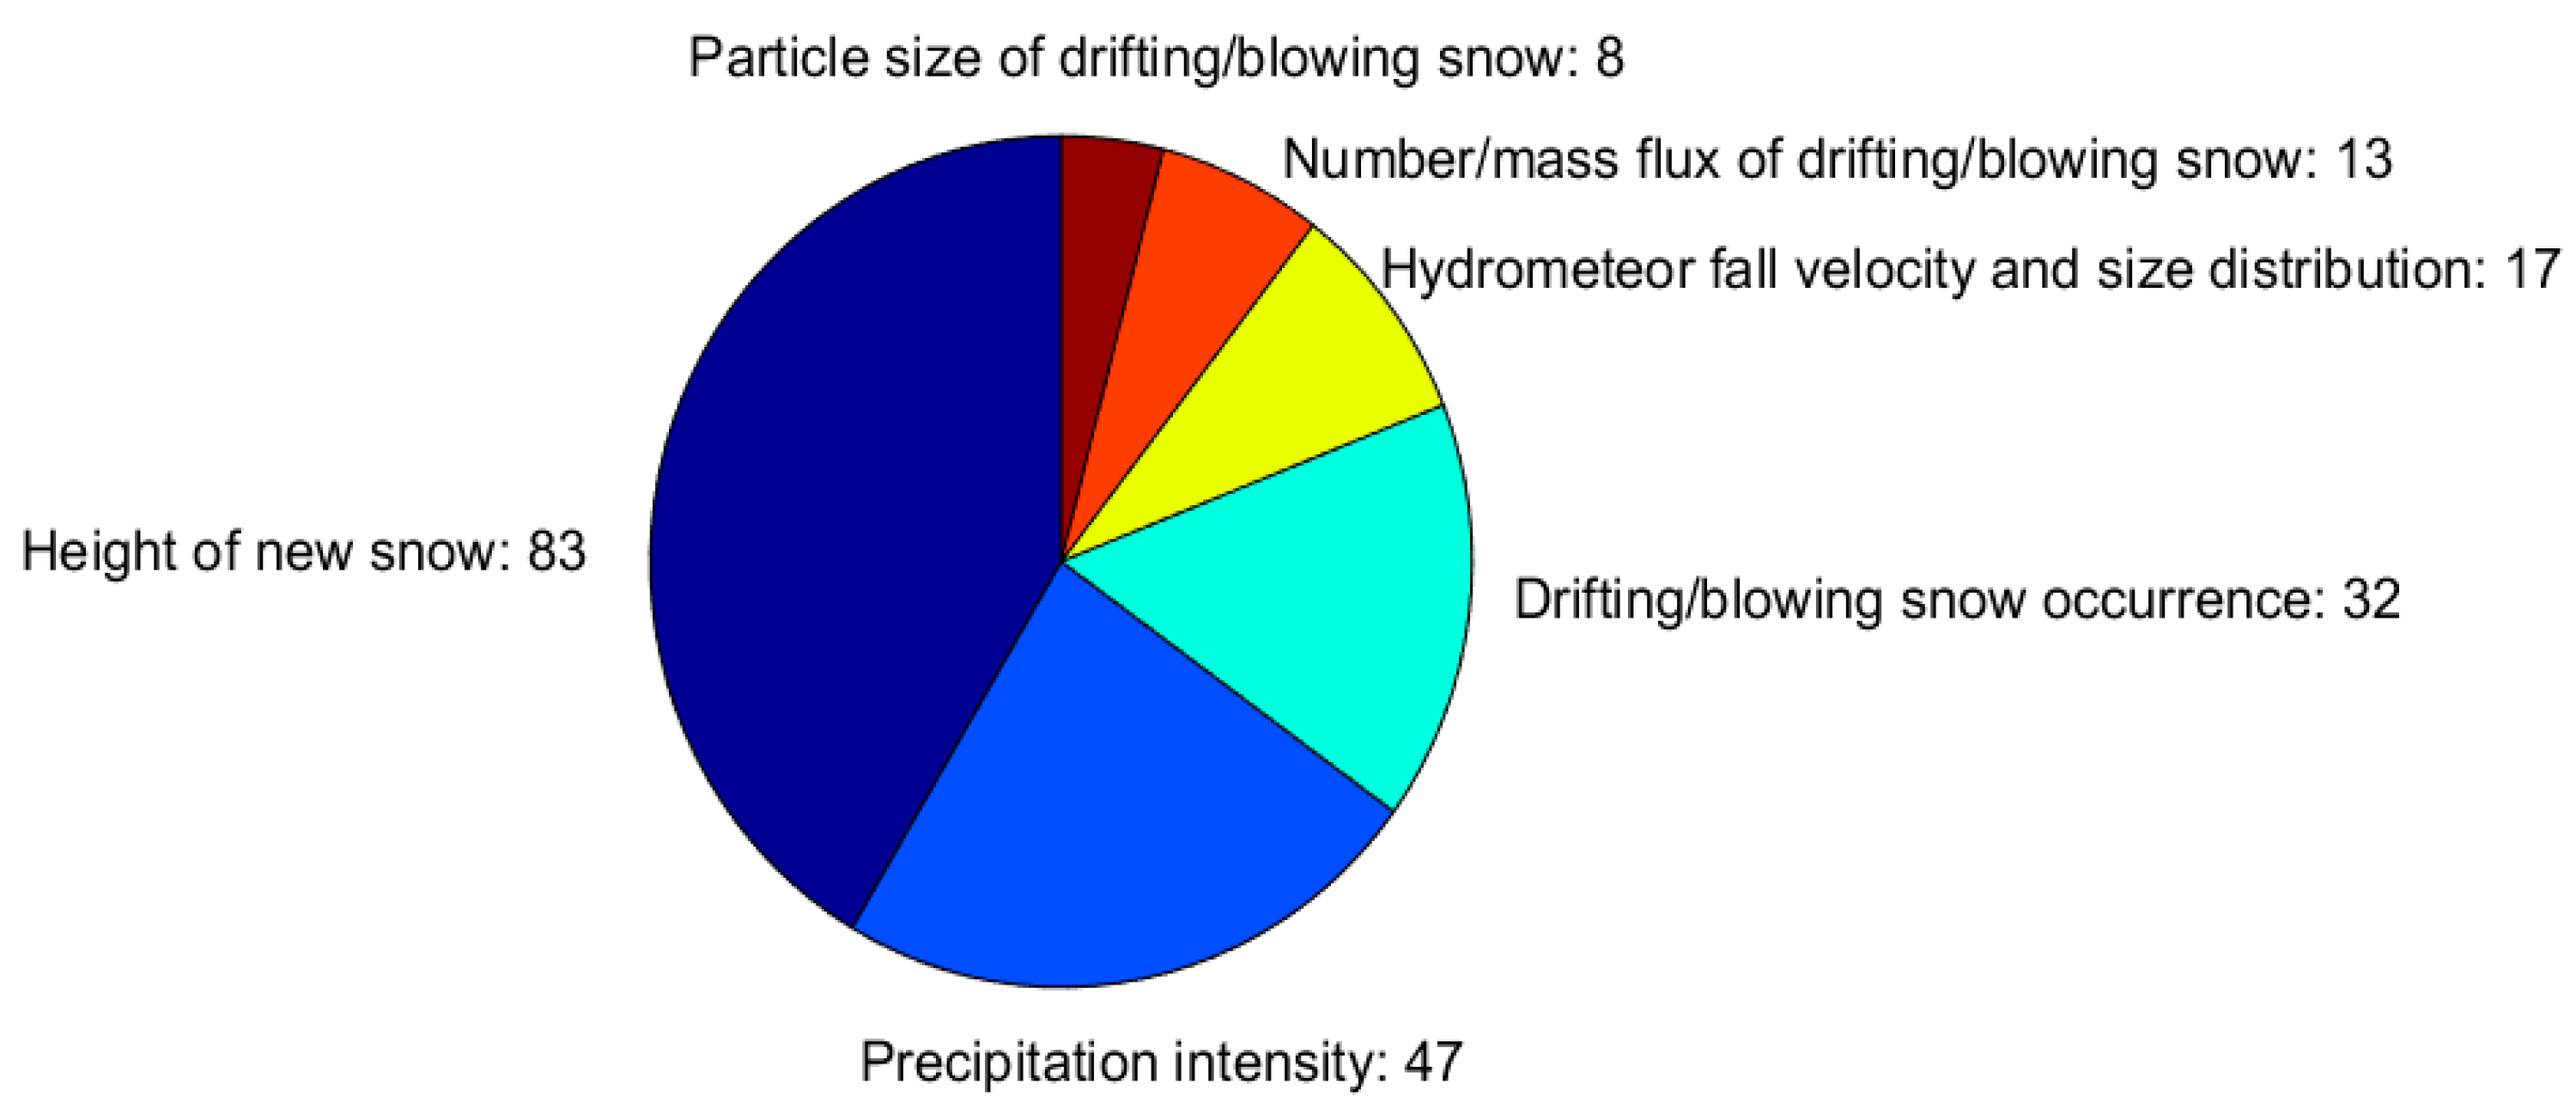
3.3.4. Precipitating and Suspended Snow
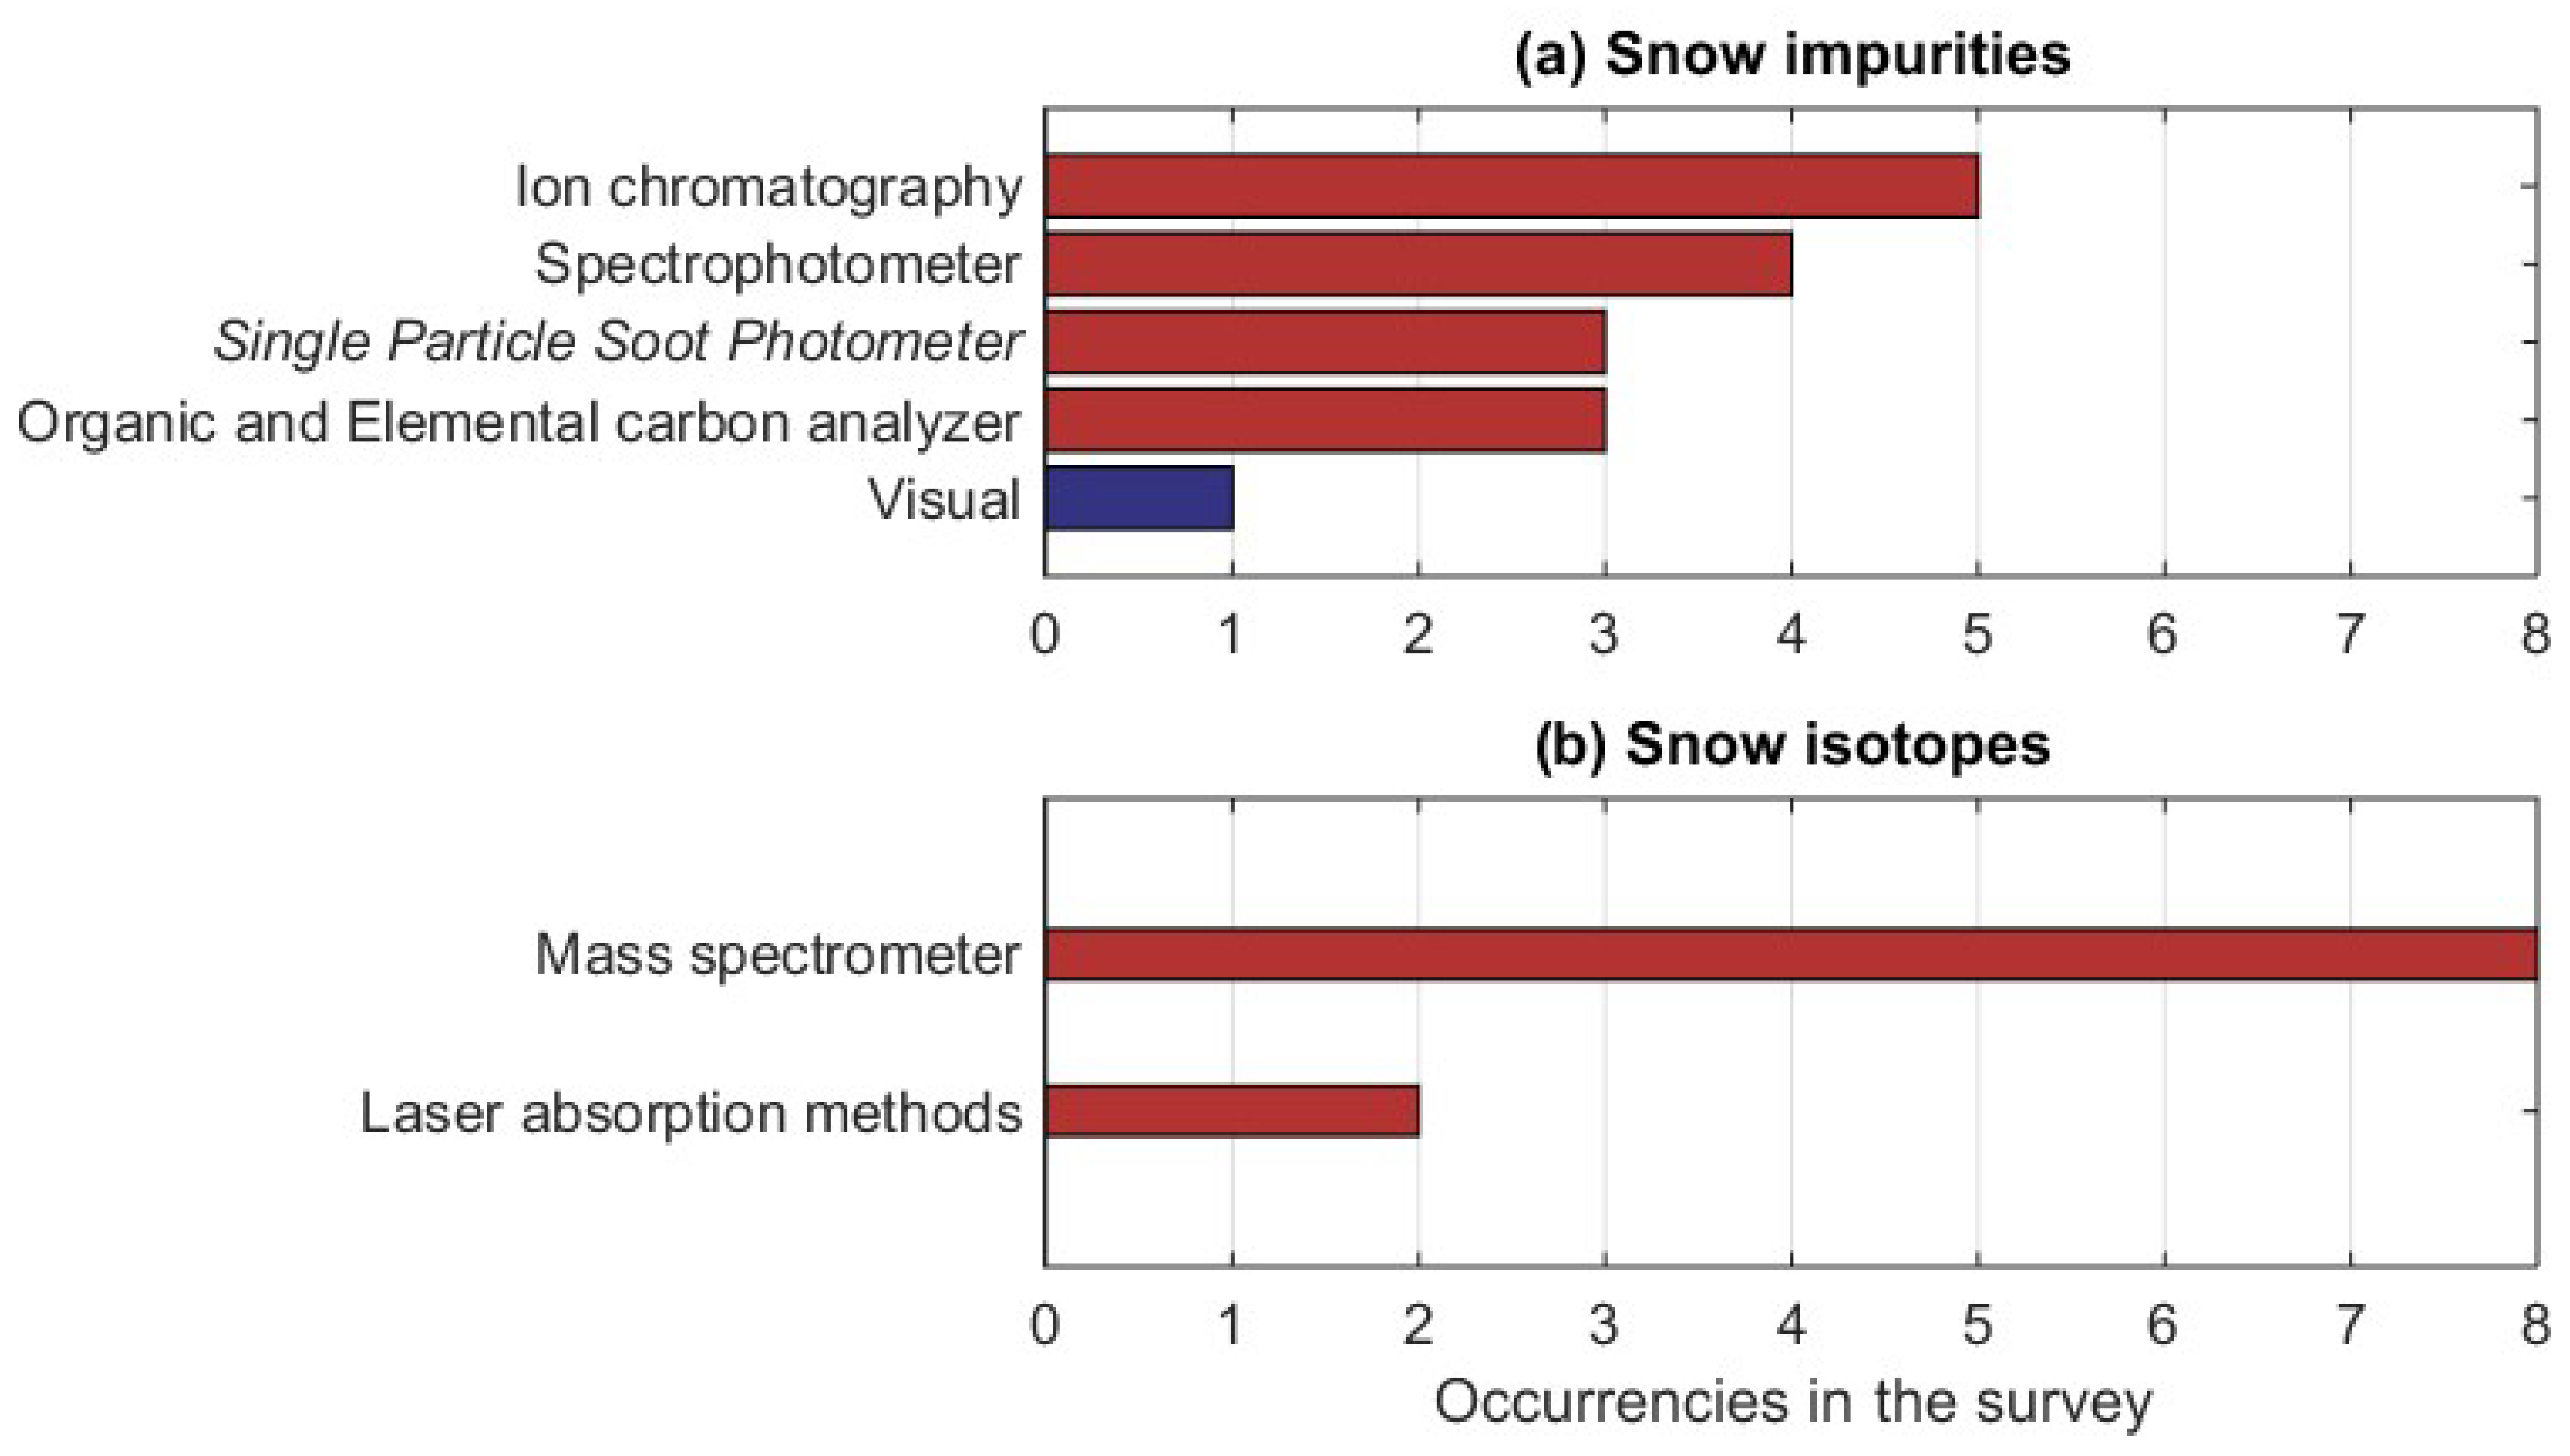
3.3.5. Snow Composition
3.4. Use of Measurement Protocols
4. Summary and Discussion
5. Conclusions
Author Contributions
Funding
Acknowledgments
Conflicts of Interest
Appendix A. List of the Measurable Snow Properties

| Parameter | Definition | Instruments |
|---|---|---|
| Runoff | Melted water that flows over land as surface water |
|
| Snow covered area, or snow cover extent (SCE) | Snow covered area is defined as the areal extent of the snow-covered ground, usually expressed as a fraction (%) of the total area investigated. The latter must be defined (e.g., observation site, catchment, district, country, continent). Unless otherwise specified, only seasonal snow cover is considered. Hence, on glaciers and névés, ground refers either to glacier ice or to an old firn surface [14]. |
|
| Snow density | Density, that is, mass per unit volume (kg m−3), is normally determined by weighing snow of a known volume. Sometimes total and dry snow densities are measured separately. Total snow density encompasses all of the constituents of snow (ice, liquid water, and air), while the dry snow density refers to the ice matrix and air only [14]. |
|
| Snow depth (HS) | HS denotes the total height of the snowpack (i.e., the vertical distance in centimetres from base to snow surface). Unless otherwise specified, HS is related to a single location at a given time. Thus, the manual HS measurements are often made with one or more fixed snow stakes. On the other hand, portable HS probes allow for measurements along snow courses and transects. The slope-perpendicular equivalent of the HS is the total thickness of the snowpack, denoted by DS [14]. |
|
| Snow hardness | Hardness is the resistance to penetration of an object into the snow. Hardness measurements produce a relative information value that depends on the instrument. Therefore, the device has to be specified [14]. |
|
| Snow layer thickness (stratigraphy) | The snow layer thickness (measured in centimetres or fractions thereof) is an essential parameter when characterizing the current state of a snowpack. Layer thickness is usually measured vertically. If the measurement is taken perpendicular (i.e., slope normal), the layer thickness should be denoted by Lp [14]. The definition of a layer is somewhat arbitrary and observer dependent. |
|
| Snow liquid water content (LWC) | Liquid water content is defined as the amount of water within the snow that is in the liquid phase. This parameter is synonymous with the free-water content of a snow sample. Liquid water in snow originates from either melt, rain, or a combination of the two. Measurements of liquid water content or wetness are expressed as either a volume (LWCV) or mass (LWCm) fraction. Both can be reported as a percent (%), and always require a separate measurement of density [14]. |
|
| Snow (surface) penetrability | Penetrability is the depth that an object penetrates into the snow from the surface. It can be used as a rough measure of the amount of snow available for transport by aeolian processes, or the ability of a snowpack to support a certain load. The depth of penetration of some suitable object (such as a Rammsonde element, a foot, or a ski) is measured in centimetres [14]. |
|
| Presence of Snow | A binary observation of the presence of snow cover at the measurement location, usually based on a snow cover fraction threshold of 50%. |
|
| Snow (surface) roughness | It refers to the roughness of a snow surface caused by the precipitation, or the wind, as well as by uneven sublimation or melt. It does not refer to the roughness as a result of the snow microstructure. |
|
| Snow roughness length (aerodynamic roughness) | It is used in some vertical wind profile equations that model the horizontal mean wind speed near the snow covered ground. In the log wind profile, it is equivalent to the height at which the wind speed theoretically becomes zero. Drag coefficient is an alternative measure of the same quantity. |
|
| Snow strength/shear resistance | Snow strength can be regarded as the maximum or failure stress on a stress–strain curve. It is the maximum stress snow can withstand without failing or fracturing. Snow strength depends on the stress state (σ: compressive or tensile; τ: shear) in pascals and the strain, ε, which is dimensionless, as well as on their rates in pascals per second and per second, respectively. Snow strength depends also on microstructure and on the homogeneity of the sample. To make measurements meaningful, all of these properties must be considered. Moreover, failure types such as ductile or brittle fracture or maximum stress at low strain rates must be given [14]. Various tests have been developed (listed on the right) to assess the stability of the snowpack, and, thus, provide a qualitative evaluation of its strength. Only the shear frame provides a real measurement of the strength. |
|
| Snow temperature (Ts) | T is defined as the temperature of the snow. It can be taken at the snow surface and/or at various depths of the snowpack. |
|
| Snow thermal conductivity | Property of snow that controls the heat conduction in the snow |
|
| Water equivalent of the snow (snow water equivalent [SWE]) | The water equivalent of the snow cover is the vertical depth of water that would be obtained if the snow cover melted completely, which equates to the snow-cover mass per unit area. It can represent the snow cover over a given region or a confined snow sample over the corresponding area. The snow water equivalent is the product of the snow height in meters and the vertically-integrated density in kilograms per cubic meter. It is typically expressed in millimeters of water equivalent, which is equivalent to kilograms per square meter or liters per square meter, thus referring to the unit surface area of the considered snow sample [14]. |
|
| Parameter | Definition | Instruments |
|---|---|---|
| Air permeability of snow | The air permeability of snow is the property of snow that controls the ease with which a fluid, typically air or water, can move through the snow [59,60]. A direct comparison between the permeameter and numerical simulations was made by [61]. |
|
| Snow (auto) correlation function | It describes how the snow microstructures at different positions are related. More specifically, the correlation function A quantifies how microstructure variables co-vary with one another on average across space. Usually it is applied to the phase indicator function of the medium [62]. |
|
| Snow correlation length | Derivative of the three-dimensional, spatial autocorrelation function A(x), with A(0) = 1, and with x being the scalar displacement [63]. |
|
| Snow grain shape | The main morphological classes of grain shapes are: precipitation particles (PP), machine made snow (MM), decomposing and fragmented precipitation particles (DF), rounded grains (RG), faceted crystals (FC), depth hoar (DH), surface hoar (SH), melt forms (MF), ice formations (IF). This basic classification is augmented by subclasses, where a process-oriented characterization of all of the sub-classes supplements the morphological classification. This side-by-side representation of morphological classification and physical processes should help various user groups arrive at a more reliable classification and an easier physical interpretation of their observations [14]. |
|
| Snow grain size | The classical grain size (E) of a snow layer is the average size of its grains. The size of a grain or particle is its greatest extension, measured in millimeters [14]. Alternatively, E can be expressed using the following terms: very fine (<0.2 mm), fine (0.2–0.5 mm), medium (0.5–1.0 mm), coarse (1.0–2.0 mm), very coarse (2.0–5.0 mm), and extreme (>5.0 mm). Some users will want to also specify the average maximum size Emax or even a distribution of the sizes. Note that the grain size must be regarded as a property of the snow layer and not of the grain shape or shapes. |
|
| Snow microwave-equivalent grain size | The microwave-equivalent grain size (MGS) is calculated by inverting snow microwave emission models with snow brightness temperature as an input parameter in some specific conditions, which must be specified. MGS can be related to the optical-equivalent grain size via a ‘scale factor‘ that depends on the stickiness of the snow particles. |
|
| Snow optical-equivalent grain size | The optical-equivalent grain size (OGS) can be defined as the radius of a collection of mono-disperse modelled crystals (often spheres) with the same volume-to-surface ratio as the non-spherical snow particle [64]. In case of randomly-oriented convex snow crystals, the optical-equivalent grain size (ro) is related to SSA and, therefore, to the microstructure of snow through the following relationship: , where ρi is the ice density. |
|
| Snow porosity | It is defined as the volume of the pore space divided by the total volume. Porosity is directly related to snow density. |
|
| Snow specific surface area (SSA) | SSA is defined as the total surface area of the air/ice interface, either per unit mass of a snow sample (SSAm) or per ice volume (SSAV) given in m2 kg–1 or m2 m–3, respectively. The density of ice, ρi, simply relates SSAm to SSAV = ρi SSAm. It is related to the optical radius or effective grain size. |
|
| Snow stickiness | It is a measure of the degree in which snow particles are attached to each other (by sintering and interlocking). |
|
| Snow tortuosity | It is defined as the ratio of two distances, namely: the path between two points through either the ice or pore space and the straight line between them. The tortuosity of the ice matrix may be the primary factor determining the thermal conductivity of snow [65]. It also affects the elastic modulus and heat and mass fluxes through the pore space. Currently, tortuosity measurements require three-dimensional reconstructions of the ice/air matrix, combined with numerical simulations [66]. |
|
| Parameter | Definition | Instruments |
|---|---|---|
| Polarization of snow optical reflectance | Direction of oscillation of the electrical field of an electromagnetic wave that has been reflected from the snow surface. |
|
| Snow backscattering coefficient | The amount of energy reflected back to the direction from which an electromagnetic pulse has been emitted, relative to the emitted amount of energy. |
|
| Snow bidirectional reflectance distribution function (BRDF) | It is defined as the ratio between the reflected radiance at a specific reflection angle and the incidence irradiance at a specific incident solar angle for each solar shortwave wavelength. In other words, it is the directional distribution of the diffuse radiation reflected by the snow surface in the solar shortwave wavelength range (350–2500 nm). |
|
| Snow brightness temperature | A descriptive measure of radiation in terms of the temperature of a hypothetical black-body emitting an identical amount of radiation at the same wavelength. |
|
| Snow broadband albedo (α) | It is defined as the upward broadband shortwave irradiance divided by the downward broadband shortwave irradiance. It can be computed by the integration of the spectral albedo over all of the shortwave wavelengths weighted by the actual incident spectrum. |
|
| Snow directional-hemispherical reflectance | It is defined as the integral of BRDF over a particular reflection cone. |
|
| Snow e-folding depth | The depth of snow over which light intensity reduces by a factor 1/e. |
|
| Snow dielectric permittivity | A measure of the resistance that is encountered when forming an electric field in the snow. |
|
| Snow optical transmittance | It is the property of snow to transmit light through it. It determines the portion of incoming light that is transmitted through the snow instead of being absorbed or scattered. |
|
| Snow spectral albedo (αλ) | It is defined as the spectral directional-hemispherical reflectance (i.e., the integral of BRDF over all of the reflection angles). In other words, the spectral albedo is the upward shortwave irradiance divided by the downward shortwave irradiance at each shortwave wavelength. |
|
| Parameter | Definition | Instruments |
|---|---|---|
| Occurrence of drifting/blowing snow | Drifting snow is defined as an ensemble of snow particles raised by the wind to small heights above the ground [67]. When the snow particles rise to a height of 1.8 m and above, the snow transport by the wind is called blowing snow [67]. The occurrence of drifting/blowing snow is recorded as presence or absence of it. |
|
| Height of new snow, or depth of snowfall (HN) | Height of new snow is the vertical depth in centimeters of freshly fallen snow that accumulated on a snow board during a standard observing period of 24 h. Additional observation intervals can be used, but should be specified. For example, the notation HN(8h) or HN(2d) denotes an observation interval of 8 h or 2 days, respectively. The corresponding slope-perpendicular measurement is denoted by DN [14]. Special precautions should be taken so as not to measure old snow. This can be done by sweeping a suitable patch clear beforehand or covering the top of the snow surface with a piece of suitable material (such as wood, with a slightly rough surface, painted white) and measuring the depth down to this [34]. |
|
| Hydrometeor fall velocity and size distribution | Measurement of particle size distribution (PSD) and vertical fall velocity of the hydrometeors as a function of the diameter. The definition of the measured diameter varies among different instruments. For this reason, often the definition of diameter, detectable size range, and observation directions (e.g., 1D, 2D, and view angle) are given. PSD is typically integrated over a time interval (e.g., a one-minute-time interval). |
|
| Number flux of drifting/blowing snow | It is defined as the number of snow particles flowing through a unit area per second. |
|
| Particle size of drifting/blowing snow | It is defined in the same way as snow grain size (see Snow microphysical properties). |
|
| Precipitation Intensity | The intensity of precipitation is defined as the mass flux over a given interval assuming a constant intensity. It is typically expressed in terms of depth per unit time, for example, millimeters per hour. |
|
| Parameter | Definition | Instruments |
|---|---|---|
| Snow impurity | The type of impurity should be fully described and its amount given as mass fraction (%, ppm). Common impurities are dust, sand, soot, acids, and organic and soluble materials. |
|
| Snow isotopes | The most relevant stable isotopes for water are 18O for oxygen (corresponding to the most abundant isotope 16O), and 2H (or Deuterium, D) for hydrogen (corresponding to the most abundant isotope 1H). The respective heavy water molecules are then and HDO. Generally, stable isotopes are quantified as relative ratios of rare toward abundant isotope abundance, with respect to a mean standard (the Vienna Standard Mean Ocean Water [V-SMOW]), denoted with the symbol δ and expressed in per mille. Thus, snow isotopic composition is reported as δD, δ18O, and deuterium excess d. |
|
Appendix B. List of the Instruments Applied to Measure the Snow Properties
| Instrument (Classification) | Description | Measured or derived snow properties (derived properties are marked in italic) |
|---|---|---|
| Acoustic sensor for snow bulk properties | The sensor is composed of one or more microphones and a loudspeaker (e.g., [68,69]). It is placed above the snow surface and sends a sound wave into the snow. The bulk and thermal properties of the snow influence the speed and attenuation of the sound waves propagating through the snowpack and reflected to the microphone(s). Through an acoustic model, the reflection of the sound wave is related to the bulk and thermal properties of the snow. |
|
| (portable or stationary, non-invasive, active, manual with electronics or automatic) | ||
| Acoustic snow depth sensor | See Ultrasonic snow depth sensor | |
| ASSSAP | The device is a 1 m long cylinder with a 10 cm diameter, inserted into a pre-drilled hole in the snowpack, to measure the SSA profiles. The optical head is constituted of an infrared laser diode at 1310 nm wavelength, which illuminates the snow horizontally (i.e., perpendicularly to the snow surface), following the design of a previous instrument called POSSSUM [12]. The radiation reflected back by the snow is recorded by six InGaAs photodiodes located on a crown at different viewing zenith angles. The distance between the snow surface and the photodiodes is measured with a 810 nm laser diode and a silicon photodiode receiver. The signals measured by the photodiodes are converted to bidirectional reflectance through a calibration fit, obtained using several reflectance standards. SSA is finally obtained from the radiation measurements using a model-based relationship. |
|
| (portable, invasive, active manual with electronics) | ||
| Calorimetry | Freezing, melting, and chemical calorimeters are used for measuring the LWC of snow. A calorimeter is an insulated container where the snow sample of a known mass is placed and temperature is recorded. A liquid is added to the container, and the change in heat content due to a change in phase of the mixture is recorded. The measured heat is related to the LWC of the snow sample, using a heat balance equation [14]. The added liquid can be a freezing agent, hot water, or a chemical agent. |
|
| (portable, invasive, manual with electronics) | ||
| Camera | See Photography | |
| Camera system with light source | The measurement system consists of a light source and a camera, horizontally aligned one in front of the other. The camera records shadow images of the drifting snow particles that pass through the illuminated volume (e.g., [70,71]). The measurement principle is the same as for a disdrometer, but the camera system is designed to measure horizontal particle flows (such as drifting snow) instead of vertical flows (such as solid precipitation). |
|
| (stationary, non-invasive, active, automatic) | ||
| Cosmic ray sensor | See Neutron probe | |
| Denoth Meter | It uses capacitance to measure the dielectric permittivity of the snow, which is related to its porosity and/or volumetric water content. It is a portable device consisting of a flat plate antenna that is inserted into the snowpack [72]. The plate can also be buried in the snowpack and used to measure diurnal cycles in snow wetness. Snow density and LWC are derived from the measured dielectric permittivity through empirical relationships. |
|
| (portable or stationary, Invasive, active, manual with electronics or automatic) | ||
| Dilution method | The method consists in the dilution of snow samples extracted from the snowpack with an acid, which changes the concentration of ions, depending on the LWC. The conductivity of the resulting solution is measured with an electrolytic conductivity meter and is related to the snow LWC [73,74]. |
|
| (portable, invasive, manual with electronic) | ||
| Disdromete | Optical disdrometers are employed for the detection of falling snow particles. Typically, a light source (laser beam or halogen lamp) and a light detector (photo diode or camera) are placed horizontally opposite to each other. The instrument records the light attenuations (shadows or images) of the particles as they fall through the observation volume (e.g., [75,76,77,78,79]). The diameter of the particles is calculated (e.g., from the reduction of electric voltage on a photo diode or with optical imaging software depending on the instrument). The fall velocity is retrieved from multiple, consecutive records. The number of the particles is obtained from the amount of adequately measured particles over the observed time period. |
|
| (stationary, active, automatic) | ||
| FlowCaptanemo-driftometer (ISAW, Tannay, Switzerland) | The sensor determines both the wind velocity and snow particle flux. The detection principle is based on mechanical-acoustic coupling. The sensor is composed of closed pipes containing electro-acoustic transducers and a powering, filtering, and amplifying unit. When the sensor is placed into a particle flux, the particles shock the sensor pipes, inducing acoustic pressure. The pressure is picked-up by the transducers. The electrical outputs are filtered and time-averaged in given frequency ranges, to provide a signal proportional to particle flux [80]. |
|
| (stationary or portable, non-invasive, automatic) | ||
| Foot penetration | It is measured with a step into undisturbed snow, by putting the full body weight on one foot. The depth of the generated footprint, measured to the nearest centimeter from 0 to 5 cm, and, thereafter, to the nearest increment of 5 cm [81], indicates the surface penetrability. Foot penetration is sensitive to the weight of the observer. |
|
| (portable, manual, invasive) | ||
| Gamma ray sensor | A gamma sensor is constituted by a passive detector installed above the snow surface that measures the natural background radiation emitted by the soil and attenuated by the snowpack above it [82]. The attenuation of the gamma radiation is calculated with respect to the measurements done during the snow-free season, and an empirical equation is used to relate it to SWE [15]. |
|
| (stationary, non-invasive, passive, automatic) | ||
| Global Positioning System (GPS) Reflectometry | Ground-based GPS receivers installed above the snowpack detect interferences between the direct signal from the GPS constellation, the reflected signal by the snow surface and possibly by other paths through the snowpack. As the multiple reflections of electromagnetic waves from the snow affect the signal-to-noise ratio (SNR) at the GPS receiver antenna, changes in SNR are related to surface height as well as the bulk properties of the snowpack. Using empirical or physically-based models of the propagation of electromagnetic radiation in the snow, snow macrophysical properties can be estimated from the SNR (e.g., [38,39,40]). |
|
| (portable and/or stationary, non-invasive, active, automatic) | ||
| Gonio-spectro-radiometer | Gonio-spectro-radiometers are spectro-radiometers (see Spectro radiometers) measuring via fiber optics and narrow-field-of-view optical lens (e.g., 3°). The optical lens is installed on a moving arm, which rotates in both zenithal and azimuthal directions, to sample the snow reflectance from the whole hemisphere. The movement is such that the sensor is viewing the same target point on the snow at any time and from every position. The reflectance is calculated from the ratio between the signal received from the snow and that received from a white reference (see e.g., [83,84,85]). |
|
| (portable, non-invasive, passive, manual with electronics or automatic) | ||
| Ground Penetrating Radar (GPR) | GPR sends an electromagnetic wave towards the snow and receives the reflected signal. The snowpack bulk properties are calculated from the reflected signal using empirical relationships or physically-based models of the propagation of electromagnetic radiation in the snow. Higher frequency radars have a better vertical resolution but they are subject to greater attenuation resulting in a lesser depth penetration than lower frequency radars. The latter, on the other hand, are more appropriate for the highly scattering wet snowpack (e.g., [86]). Upward looking GPR at the ground surface combined with GPS receivers can retrieve LWC, HS, and SWE continuously and independently [87]. Non-imaging, accurately calibrated radars are called scatterometers. |
|
| (portable and/or stationary, non-invasive, active, automatic) | ||
| Hand test | The Hand test is made by the observer to measure the hardness of snow layers in a snow pit. The observer pushes a fist, four fingers, a finger, a pencil, or a knife (in order of increasing hardness) into the snowpack. The hardness is recorded as the element that can be inserted into the snow [14]. The accuracy varies between observers [88]. |
|
| (portable, invasive, manual) | ||
| Heat flux plate | Heat flux plates (HFP) are small (often <50 mm per side), thin (<5 mm thick), rigid sensors placed horizontally in the snow at the desired depth(s). Most employ a thermopile to measure the temperature difference between the top and bottom of the plate [89]. The thermal conductivity is derived from the temperature gradient and the measured heat conduction flux between the snow below and above the plate. Modern HFPs are always guarded [90]. |
|
| (portable and/or stationary, invasive, automatic) | ||
| HOBO Pedant temperature data logger(Onset Computer Corporation, Buorne, MA, USA) | It is a miniature data logger that can record temperature. It has a waterproof casing and use solar radiation shield for accurate temperature measurements in sunlight. It has a changeable battery. As it does not transmit the data externally, it is usually buried into the snow at known depth over one or more seasons and later recovered to download the data. |
|
| iButton | An iButton is a computer chip that is enclosed in a 16 mm thick durable weather resistant stainless steel can. It integrates a globally unique address, a digital thermometer, a thermal history log, an alarm event log, and additional memory to store user data. As it does not transmit the data externally, it is usually buried into the snow at a known depth over one or more seasons, and later recovered to download the data. The device can be used until the internal battery is consumed. The battery is not rechargeable or replaceable. |
|
| (portable or stationary non-invasive automatic) | ||
| IceCube,originally called DUFISSS (A2 Photonic Sensors, France) | About 4 or 8 cm3 of snow sampled from a snow pit wall is collected into a black sample holder, which is place inside an integrating sphere [11]. An infra-red laser diode illuminates the snow sample, and the reflected light is measured by an InGaAs photodiode placed at the output port of the sphere. Reference targets are used to determine the empirical fit that relates the photodiode signal to reflectance. The SSA is then derived from the reflectance through a fitting curve calculated using SSA direct observations obtained with methane absorption method [11]. |
|
| (portable, invasive, active, manual with electronics) | ||
| Infrared sensor (or camera) above the surface | Infrared temperature sensors and cameras measure the longwave radiation emitted by the snow surface. The surface temperature is inferred by applying the Stefan–Boltzmann law, which relates the temperature of a black body to its emitted longwave radiation, and by assuming a certain snow emissivity. |
|
| (portable or stationary, non-invasive, passive, and automatic) | ||
| Infrared sensor, Probe | A handheld infrared sensor probe can be applied to quickly measure the vertical profile of snow temperature in a snowpit, immediately after the cut of the wall. |
|
| (portable or stationary, non-invasive, passive, manual with electronics or automatic) | ||
| InfraSnow | The InfraSnow instrument measures optical equivalent grain size, which can be converted to specific surface area [29]. The instrument uses a light-emitting diode with a wavelength of 950 nm and a photodetector. The very portable instrument is used to quantify the snow properties on ski tracks [91]. The longer wavelength, compared with the IceCube and ASSSAP, leads to a reduced sensitivity to surface sample disturbance. The opening of the instrument is directly put on the snow surface, the only requirement is that the surface is flat, but no other snow preparation is necessary. This simple application comes with the drawback that the intensity of reflection is somewhat density dependent, so an estimate or joint measurement of the snow density is necessary. |
|
| (portable, non-invasive, active manual with electronics) | ||
| Ion chromatography | Ion chromatography separates ions and polar molecules based on their affinity to the ion exchanger. The snow sample is dissolved in a fluid called the mobile phase, which carries it through a structure holding another material called the stationary phase. The stationary phase is positive or negative charged, and ions of the various snow constituents travel at different speeds, resulting in the separation of the constituents [92]. |
|
| (invasive, manual with electronics) | ||
| Laser absorption methods | Snow is transformed into the gas phase, placed into a cavity, and illuminated with a laser beam. A photodetector measures the gas absorption spectrum, which reveals the concentration of the chemical elements composing the snow. In cavity-ring-down spectroscopy, the laser beam is entered into the cavity and starts bouncing between mirrors. Once the light source is switched off, the time of decay, or ‘ring down’, of the intensity of the beam depends on the snow isotopic composition. |
|
| (invasive, active manual with electronics) | ||
| Laser depth sensors | Laser sensors are based on the measurement of time between the sent and received electromagnetic laser pulse, the latter being reflected from the ground/snow surface. The difference between the measurements taken in snow-free and snow-covered scenes allows the calculation of depths [93]. |
|
| (stationary, non-invasive, active, automatic) | ||
| Laser scanner (ground based and airborne) | The laser scanner (or lidar) measures the time between the sent and received laser pulse, the latter being reflected from the ground/snow surface. The scanner/laser beam moves horizontally and/or vertically to scan a line. Differencing co-registered lidar maps from two dates (snow-off from snow-on) allows the calculation of HS with sub-decimeter vertical uncertainty and high horizontal spatial resolutions over spatial extents compatible with basin-scale hydrologic needs and for slope-scale investigations (e.g., [94,95]). Time-lapse laser scanning also exists on a small scale [96]. Snow surface roughness can be derived from distance differences along the measurement line(s). |
|
| (portable and/or stationary, non-invasive, active, manual with electronics) | ||
| Lidar | See Laser scanner | |
| Loaded column test | The loaded column test allows an observer to estimate how much additional mass a weak layer might support before it will fracture. A snow column is isolated with a saw, and excavated blocks of snow with same area are stacked on the column until it fractures. The level of the fracture is recorded and the mass of each block can be measured. The shear resistance is derived from the measurement of the total load causing the failure of the column [81]. |
|
| (portable, invasive, manual) | ||
| Lysimeter | The lysimeter measures the amount of water melting from a snowpack (runoff). It consists of a collection pan which leads the water to a measurement gauge through a pipe or orifice [15]. |
|
| (stationary, non-invasive, automatic) | ||
| MagnaProbe(Pasco, CA, USA) | Self-recording snow depth probe developed by [97], which uses a sliding electromechanical basket that reaches the snow surface when the tip of the pole contacts the ground surface. The distance between the plate at the snow surface and the tip of the pole at ground is measured electronically by pushing a switch. A GPS system provides the geographical location of each point. Time, location, and HS can be recorded electronically using standard loggers [15]. |
|
| (portable, non-invasive, manual with electronics) | ||
| Magnifying glass | The snow crystals are collected above a gridded black plate and carefully disaggregated with a spatula or a sharp needle. The magnifying class is then placed above the plate, and through it the observer obtains a visual estimation of the snow grain size and shape [14]. |
|
| (portable, invasive, manual) | ||
| Mass spectrometer | The snow samples are first melted and diluted with acid and then nebulized in the mass spectrometer. There, the gas molecules are fragmented into ions through electron ionization. The ions are separated in the mass spectrometer according to their mass-to-charge ratio, and are detected in proportion to their abundance. A mass spectrum of the molecule is thus produced and the Pb isotope concentration determined (e.g., [98]). |
|
| (Portable, invasive, active, manual with electronics) | ||
| Mechanical trap + wind speed measurements | The mechanical trap is used to measure the blowing snow mass flux [15]. It consists of a collection container or a fabric bag with an orifice. The container is oriented toward the wind to collect the snow particles. The measurement of the mass of the collected snow particles is done by manually emptying the container and weighing its content or by applying an electronic weighing scale directly connected to the container, and it enables the calculation of the mass flux of blowing snow. With concomitant measurements of wind speed (with an anemometer), the flux density (number flux) of blowing snow particles crossing a unit area in 1 s can be calculated [15]. |
|
| (Portable or stationary, manual or automatic) | ||
| Methane absorption method | The method consists in placing a snow sample in a container with CH4 at the temperature of 77 K, and measuring the number of CH4 molecules absorbed by the snow (i.e., that can be accommodated on the snow surface). Knowing the cross sectional surface area of a CH4 molecule, the area of the snow sample that is accessible to gases can be determined by BET analysis. SSA is obtained dividing the area of the snow sample by its weight [99,100,101]. |
|
| (lab-based, manual with electronics) | ||
| Micro-computed tomography (micro-CT) | The micro-CT instrument takes X-ray scans (images) of a snow sample, each scan reproducing a slice of the sample. After the three-dimensional image of the microstructure of the snow sample is reconstructed from the scanned slices, an image processing software is applied to derive the stereological properties characterizing the snow sample. The measurements can be done using natural snow sample [102] or cast snow samples [103]. Though numerical simulations, several snow properties can be derived from the observed micro-CT images [104]. |
|
| (lab-based, manual with electronics) | ||
| Microwave radiometer | A ground-looking microwave radiometer measures the microwave radiation (at frequencies of 1–1000 GHz) emitted from the ground and the snow, which is called the brightness temperature. Microwave radiometers are usually equipped with multiple receiving channels, which detect a signal originating from snow/ground layers of different thickness (e.g., [22]). From the measurements of snow brightness temperature, is it possible to retrieve the snow cover extent, HS, SWE, melt events, snow temperature, and microwave-equivalent snow grain size (e.g., [20,105,106]). |
|
| (portable/stationary, non-invasive, passive, automatic) | ||
| Multichannel Filter Radiometer (MCFR) | MCFRs measure UV/solar radiation in several discrete wavelength bands. The fore-optic generally consists of a diffuser, the angular response of which should ideally be proportional to the cosine of the zenith angle. The wavelength selection is typically achieved by narrow to moderate band interference filters, and the signal is detected with a photodiode or a phototube (without dynodes for multiplication). Compared to spectroradiometers and broadband instruments, interpretation of data of these instruments is more complex and the separation of instrument characteristics and data products is not straightforward [107]. The snow UV/multichannel albedo is obtained using a pair of upward and downward looking MCFRs (e.g., [108]). |
|
| (portable, non-invasive, passive, and automatic) | ||
| Near-Infrared (NIR) photography | In NIR photography, a digital camera filtered to detect the 850–1000 nm wavelength range is applied to distinguish snow layers of different microstructure. The method consists of taking a photo of a smoothened snow pit wall, where also a ruler and/or plates of known reflectance are placed for reference. The snow stratigraphy is directly obtained from the visual assessment of the photo, and the SSA of each layer is derived from the measured reflectance through an empirical fit [28,109]. |
|
| (portable, invasive, passive, manual with electronics) | ||
| Needle probe | See Transient needle probe | |
| Neutron probe | A neutron probe (or cosmic-ray probe) measures the intensity of neutrons received from the surface. Neutrons generated by cosmic rays near the earth surface are slowed through collisions with the hydrogen nuclei of water molecules [110]. Thus, the moderation of neutron intensity measured by the neutron probe above the snow is negatively correlated with the SWE [111]. The footprint of the probe is few hundred meters (depending on air pressure). Bulk snow density can be derived with a co-located HS sensor [112]. |
|
| (portable or stationary, non-invasive, passive, automatic) | ||
| Organic carbon (OC) and elemental carbon (EC) analyser | Many different thermal, optical, and thermal/optical carbon analysis methods for organic carbon (OC), elemental carbon (EC), or black carbon (BC) have been applied throughout the world [113]. The snow impurity content of melted snow samples is collected in filters. OC and EC are measured by thermal evolution methods that quantify the amount of carbon that leaves the filter at different temperatures [114]. These methods use different combinations of temperature and analysis atmospheres to evaporate, pyrolyze, and combust the carbon-containing compounds on a filter sample, and then detect the evolved carbon gases. The separation of OC from EC is ambiguous because some of the EC combusts in the presence of oxygen, and some of the OC chars (turns to EC) in an oxygen-deficient atmosphere. Light reflected from or transmitted through the filter during the analysis is used to monitor and correct for this charring [113]. |
|
| (lab-based, invasive, manual with electronics) | ||
| Permeometer | Permeometer is used to measure the permeability of snow [115]. As reported in [15], the snow sample is placed inside a container, and air is pumped through the sample. The speed of the air and the air pressure inside and outside of the container is recorded for different air flow rates. The air saturated permeability is then determined through a regression equation [115]. |
|
| (portable, invasive, automatic) | ||
| Photogrammetry | See Photography | |
| Photography (or photogrammetry) | Digital camera and video cameras are employed to do snow photogrammetry (i.e., to measure snow properties). A large variety of snow properties can be measured applying different setups and image processing algorithms. Time lapse-photography with cameras or webcams at fixed position is applied to retrieve snow covered area (e.g., [41,116]), snow presence, HS, and height of new snow (e.g., [117,118,119]). Cameras mounted on manned or unmanned aerial vehicles allow the mapping of HS [120,121,122] and snow BRDF [123], the latter requiring calibrated white targets at the surface as a reference. Snow surface roughness is obtained from the processing of photos with reference scales, such as a graduated blackboard vertically inserted into the snow surface [124] and graduated survey strings aligned over the glacier surface [125]. Macro-photography is applied to measure snow grain shape and size metrics (as the optical equivalent snow grain size) of snow particles extracted from the snow pit wall (e.g., [30,31]) and of drifting snow particles attached to sticking slides (e.g., [126]). |
|
| (portable or stationary, invasive or non-invasive, manual with electronic or automatic) | ||
| Present weather detector (PWD) | The PWD is a multi-variables sensor for automatic weather observing systems. It combines an optical sensor, a capacitive rain sensor, and a Pt100 thermistor. The working principle of the optical sensor is similar to the optical disdrometer (see Disdrometer). However, the PWD is designed to detect the bulk characteristics of the precipitation, without resolving the single precipitation particles. PWD are usually operational instrument, providing products that are needed for operational applications, such as aviation and road weather, while optical disdrometers are applied more in research. Type of precipitation (fog, rain fall, snowfall, etc.), visibility, and precipitation intensity are calculated from the attenuation (extinction) of the light emitted by a laser and detected by photodiodes when the precipitating particles fall through the observation volume [127]. The optical sensor can use the principle of forward scattering or extinction. The capacitive sensor measures the presence and amount of water on its surface. The signal is dependent on the thickness of the water on the sensor, which is a measure of the liquid water content of the precipitation. The Pt100 thermistor is used to monitor the temperature, as an adjustable parameter for classification of precipitation types. |
|
| (Stationary, non-invasive, active, automatic) | ||
| Propagation saw test (PST) | The PST tests the propensity of a pre-identified deeply buried weak-layer and slab combination to propagate a crack in the snowpack, independently of any loading for fracture initiation [128,129]. The tester uses an isolated column and initiates a fracture by dragging a snow saw along the weak layer in the uphill direction. The tester should describe the way the fracture propagates ahead of the saw according to a coded description. |
|
| (portable, invasive, manual) | ||
| Push–pull gauge | The push–pull gauge measures horizontal compressive force and consists of a load cell connected to a bolt; when the bolt is pushed, the force is measured and is shown directly on a display (e.g., [130,131]). Different attachments can be connected to the push–pull gauge. The force recorded when the attachment is pushed against the snow pit wall can be converted to hardness index using the Table 1.4 of Fierz et al. [14]. |
|
| (portable, invasive, manual with electronics) | ||
| Pyrgeometer | A pyrgeometer measures the broadband longwave flux in the wavelength range from 4.5 to 100 μm received from its hemispherical field of view. A couple of upward- and downward-looking pyrgeometers installed about 2 m above the surface is needed to measure the snow surface net longwave flux (sum of flux emitted by the snow surface and received from the overlying atmosphere). The snow surface temperature is inferred from the net longwave flux by applying the Stefan-Boltzmann law, which relates the temperature of a black body to its emitted longwave radiation, and by assuming a certain snow emissivity. |
|
| (stationary, non-invasive, passive, automatic) | ||
| Pyranometer | A pyranometer measures the broadband shortwave flux in the solar wavelength range (ca. 0.3 μm to 3 μm) from its hemispherical field of view. In thermopile pyranometers, the solar radiation absorbed by a black surface heats the thermopile junction located beneath it and generates a small voltage, which is proportional to the absorbed shortwave irradiance. A couple of upward- and downward-looking pyranometers, installed about 2 m above the snow surface are needed to calculate the snow broadband albedo from the ratio between the upward and downward shortwave fluxes. |
|
| (stationary, non-invasive, passive, automatic) | ||
| Radar | For radars applied in near-field (in-situ) observations (see Ground-penetrating Radar). | |
| Rammsonde | The Swiss Rammsonde consists of a cave rod, with a 60° cone tip angle, to which is attached a drop hammer. The hammer is dropped from a known height through a thin guide inside the rod, causing the penetration of the cone into the snowpack [132]. Knowledge of the hammer height before the drop, the mass of the hammer, and the penetration depth, enables the computation of the ram resistance. |
|
| (portable, invasive, manual with/without electronics) | ||
| Reflectometry | See GPS Reflectometry | |
| Rutschblock test | The Rutchblock (or glide-block) test was developed in Switzerland. A snow column is isolated by hand using a saw [133], and its collapse after a series of loading steps by the skier is recorded with the appropriate Rutschblock score [81]. The test is mainly used for snow stability in slopes. |
|
| (portable, invasive, manual) | ||
| Scale | See Snow scale | |
| Scatterometer | See Ground-penetrating Radar | |
| Shear frame test | The shear frame test is used to measure the shear strength of snow layers and of the interfaces between them. The shear frame consists of a metal frame with parallel cross bars [134]. A force gauge is attached to side of the frame, and the observer pulls on the frame so that fracture in the snowpack occurs within 1 s [81]. The shear strength is calculated from the average measured shear force, and it depends on the frames size. |
|
| (portable, invasive, manual) | ||
| Shovel Shear Test | Shovel shear test is made to detect unstable layers in deep snow over slopes. A snow column is isolated from the snowpack through vertical cuts on the downslope and lateral sides. A vertical cut of the depth of the shovel plate is made on the back (upslope) side of the column. Shovel is inserted into the cut and gently pulled in the downslope direction until the column breaks. The depth of the shear plane where the break occurred is recorded, and the procedure is repeated until the ground is reached [81]. |
|
| (portable, invasive, manual) | ||
| Single Particle Soot Photometer (SP2), (Droplet measurement technologies, Inc., CO, USA) | SP2 is used to analyse the black carbon (BC) concentration in snow and ice. Unless filter-based methods (see organic carbon [OC] and elemental carbon [EC] analyser), SP2 does not need a filtration step, and operates with very little sample volume (e.g., [135]). However, the SP2 requires an aerosolization step, because it analyzes only air-borne samples. A laser heats the individual BC particles, and the instrument detects the thermal radiation emitted by them when they become incandescent. This signal is proportional to the BC mass [136]. Thus, SP2 provide continuous, automatic measurements of mass concentration and size distribution of BC on a particle-by-particle basis [135]. |
|
| (portable, invasive, automatic) | ||
| Ski penetration | It is measure with a step into undisturbed snow, by putting full body weight on one ski. This generates a ski track, the depth of which is measured from the centreline to the nearest centimetre from 0 to 5 cm, and, thereafter, to the nearest increment of 5 cm [81], which indicates the surface penetrability. Ski penetration is sensitive to the weight of the observer and the surface area of the ski. |
|
| (portable, manual, invasive) | ||
| Snow cutter | The snow cutter is used to extract snow samples of a known volume from the snow pit walls to measure the vertical profile of snow density. The cutter may have different shapes (right-angled triangular prism, right rectangular prism, or cylinder), has sharpened edges, and is usually made of aluminium [137]. The cutter is horizontally or vertically inserted into the targeted snow layer and extracted with the help of a separate metal plate that sharply cuts one side of the sample. The mass of the snow sample is then weighed with a scale and the density is derived from its volume and weight. The SWE of the snowpack can be obtained from the snow density measurements if the whole vertical profile of the snowpack is sampled. |
|
| (portable, invasive, manual) | ||
| Snow Fork(Insinööritoimisto Toikka, Finland) | It is a microwave resonator used to measure the dielectric permittivity of the snow, which is related to its porosity and/or volumetric water content. It is a portable device consisting of two parallel stainless steel prongs with sharpened ends that act as transmission line and are usually inserted horizontally into the side of a snowpit [138]. Snow density and liquid water content are derived from the measured dielectric permittivity through empirical relationships. |
|
| (portable, invasive, active, manual with electronics) | ||
| Snow (or precipitation) gauge | The snow gauge term is used to separate this gauge from the vast family of precipitation gauges, which are suitable to measure only rain. Snow gauge measures the amount of solid precipitation in a certain period of time, and typically the precipitation intensity is expressed as liquid water equivalent [139]. Falling snow is collected into a catchment container. The mass of the collected snow and time are recorded and converted to precipitation intensity. For the automatic snowfall observations, only the weighing-gauge type is suitable. Manual measurements are made by removing the container and melting the collected snow. For accurate snowfall measurements the gauge should have a wind shield, typically, in operational use, an Alter or a Tretyakov-types are utilized. The reference gauge for the solid precipitation measurements is surrounded by an octagonal double fence also known as the Double Fence Intercomparison Reference (DFIR, [140]). |
|
| (Stationary, not-invasive, manual or automatic) | ||
| SnowMicroPen | The instrument is a high-resolution penetrometer, developed at the WSL Institute for Snow and Avalanche Research (Switzerland), which automatically measures the resistive force produced when a rode with in a conical sensitive tip penetrates perpendicularly into the snowpack at a constant speed [141]. The resistive force is related to the texture of snow, thus empirical relations are used to derive the vertical profile of snow density, hardness, SSA, correlation length, layer thickness, and HS [13]. |
|
| (portable, invasive, manual with electronics) | ||
| Snowpack Analyzer (SPA)(Sommer Meschtechnik, Koblach, Austria) | It applies TDR (see in this table) to measure the dielectric constant of the snow [37], from which density and LWC are derived. It uses a flat coaxial cable antenna installed at an angle to the ground surface. The antenna is buried in the snowpack when snowfall accumulates. The assembly includes an acoustic sensor (see in this table) that measures HS and permits the calculation of SWE. |
|
| (stationary, non-invasive, active, automatic) | ||
| Snow particle counter (SPD) | SPD is an optical device that measures the diameter and the number of drifting snow particles by detecting their shadows on a photodiode [142]. A laser diode is used as a light source, and a photodiode detects the interruption of the light beam by a blowing snow particle. The SPD is able to detect particles with diameter in the range of 40–500 μm. |
|
| (Stationary, non-invasive, automatic) | ||
| Snow pillow | The snow pillow is a pressure transducer filled with antifreeze fluid installed at the ground surface under the snowpack [143]. Through the pressure changes of the fluid, the instrument measures the mass of the snow accumulated over the instrument, which gives the SWE once the pillow’s area is known. |
|
| (stationary, non-invasive, automatic) | ||
| Snow probe | The snow (or avalanche) probe is constituted of several graduated rigid sticks connected by strings that can quickly be joined together to form a single long rod. It is vertically inserted into the snow surface until it reaches the ground to measure the snow depth. |
|
| (portable, invasive, and manual) | ||
| Snow ruler | See Snow stake and ruler | |
| Snow scale | The snow scale is installed at the ground surface and automatically measures the weight and, therefore, the mass of the snow accumulated over it. The SWE is obtained by dividing the measured snow mass by the area of the instrument. When the height of the snowpack is independently measured, the snow density can be calculated from the ratio between mass and volume of the sampled snow column. |
|
| (stationary, non-invasive, automatic) | ||
| Snow stake and ruler | The snow stakes are graduated rigid sticks, which can be vertically inserted into the snow surface until they reach the ground. They are suitable for mapping the snow height along transects or snow courses. Portable snow rulers are usually carpenter’s folding rulers temporally installed against the snow pit wall for HS and layer thickness measurements [15]. The stationary version of the snow stake/ruler is a graduated rigid stick installed on the ground before the start of the snow season. The graduated scale marked on it can be read visually or through a camera. The scale reading provides an estimation of the height of the snowpack. When a board is placed over the old snow, it can measure the height of snowfall accumulated above the board. |
|
| (portable or stationary, invasive or non-invasive, manual) | ||
| Snow tube | Snow tube (or snow sampling tube) is used to extract samples of snow to measure the snow water equivalent and density [144]. The material, length, and design of the snow tubes varies, but generally the instrument is a cylinder with a serrated cutting edge, pushed through the snowpack until its edge reaches the ground. The tube with the extracted snow sample is weighed with a scale. SWE is derived from the weight and volume of the snow sample. If the snowpack is deeper than the height of the tube, vertically aligned multiple samples are taken. To derive snow density, a simultaneous measurement of HS is needed (e.g., [145]). |
|
| (portable, invasive, manual) | ||
| Spectrophotometer | Spectrophotometers are applied to measure the amount of light that is absorbed by the impurity content of the snow. Snow samples are melted and filtered, and the filters are inserted into the spectrophotometer. A light source shines on the filters and the absorption spectrum is measured. The spectrum is then analyzed to infer the concentration of black carbon (BC), the fraction of absorption due to non-BC light-absorbing constituents and the absorption Ångstrom exponent of all particles [146]. |
|
| (portable, invasive, active, manual with electronics) | ||
| Spectro-radiometer | Spectro-radiometers include one or multiple photodetectors that are sensitive to one portion of or to the whole solar spectrum. Depending on the connected light receptor (narrow-angle fore optic, diffuser for hemispherical light reception, integrating sphere for hemispherical light reception), they measure spectral radiance or irradiance. When facing the snow surface, they measure the spectrum of the radiance/irradiance reflected from the snowpack. The snow spectral reflectance/albedo is calculated from the ratio of reflected radiance/irradiance to the incoming radiance/irradiance. All of the commercially available spectro-radiometers that can detect the full solar spectrum are portable (manual) instruments (e.g., [147]). Few spectrometers that are applied for stationary and automatic measurements cover only part of the solar spectrum (e.g., [148,149]). Near-surface snow SSA and optical-equivalent snow grain size can be derived from the spectral reflectance/albedo measurements using radiative transfer models. Connecting a contact probe to the manual spectro-radiometer via a fiber-optic cable, it is possible to measure the vertical profile of SSA, e-folding depth, and optical transmittance from the wall of a snow pit (e.g., [150]). The same quantities can also be measured using several contact probes buried in the snow at different depth and connected to an automatic spectro-radiometer via fiber optic cables (e.g., [149]). |
|
| (portable or stationary, invasive or non-invasive, passive, manual with electronics or automatic) | ||
| Sticking slides + photography and image processing | See Photography | |
| Tacheometry(portable, non-invasive manual with electronics) | Tacheometry is the combination of (horizontal and zenith) angle and (slope) distance measurements from a standing point to observation/target points (retro-reflectors). It allows the determination of a point’s coordinate in three dimensions by transferring polar measurements into a Cartesian coordinate system. This technique can be used for monitoring the HS on slopes. |
|
| Thermistor probe, Handheld or connected to data logger | A thermistor probe measures the temperature through the temperature dependence of its resistance. The thermistor is incorporated in the stainless steel head of the probe, which is inserted into the snowpack. The data logger automatically converts the recorded resistance to temperature through a polynomial equation. It is usually inserted across the snowpit wall at different snow depths to measure the temperature profile of snowpits (e.g., [151]), but it can also be placed in stationary installations, as a single element or as array of probes at different heights that are buried into the snow after snow accumulation (e.g., at the Arctic Research Centre in Sodankylä, Finland: http://litdb.fmi.fi/ioa0007_data.php). |
|
| (portable or stationary, invasive or non-invasive, manual with electronics or automatic) | ||
| Thermistor string, Fixed | A Thermistor string is cable with several thermistors installed at regular/known distances, which is buried into the snow to measure the vertical profile of the snow temperature. The measured snow temperature profile together with an independent estimation of the heat flux into the snow can provide the snow thermal conductivity. |
|
| (stationary, non-invasive automatic) | ||
| Time Domain Reflectometry (TDR) | The TDR method measures the return time of an electromagnetic pulse transmitted through a finite length cable or probe inserted into the snow. The return time of the pulse is affected by both the length of the cable or probe (travel distance) and the permittivity of the snow around it (propagation velocity). When the length of the cable is known, the snow permittivity can be determined [152], from which snow density and LWC can be derived. |
|
| (Portable or stationary, non-invasive, active, manual with electronic or automatic) | ||
| Time-lapse photography | See Photography | |
| Tipping bucket gauge | See Snow gauge | |
| Transient needle probe | The transient needle probe is a thin needle inserted into the snowpack, which is heated up through an electrical current. The change in temperature during heating or cooling of the probe is sensed by a thermocouple, and depends on the thermal conductivity of the snow (e.g., [153]). The probe can be manually inserted into the snowpit wall, or buried into the snowpack throughout the snow season [154]. |
|
| (Portable or stationary, invasive or non-invasive, manual with electronics, or automatic) | ||
| Translucent profile | Translucent profile is made to detect stratigraphy of snow. Two snow pits are excavated opposite to each other so that a very thin, vertically flat section of snow is left between them [155,156]. Light penetrating through the snow section reveals the layer boundaries. |
|
| (invasive, Manual) | ||
| Ultrasonic snow depth sensor | An ultrasonic sensor is fixed to a mast of known height above the snow surface. It produces an inaudible (>20 kHz) acoustic pulse that is reflected from the snow surface. Measuring the time between the sent and received pulses enables the retrieval of HS using kinematics [15]. The concomitant measurement of air temperature is needed to calculate the speed of the sound in the air. |
|
| (stationary, non-invasive, active, automatic) | ||
| Wind speed vertical profile | The vertical profile of wind speed is obtained from weather masts or soundings. It is applied to derive the snow aerodynamic snow roughness, or roughness length, which is the height at which the mean wind becomes zero when extrapolating the logarithmic wind-speed profile downward through the atmospheric surface layer. |
|
| (portable or stationary; non-invasive; manual with electronics in case of sounding; or automatic |
Appendix C. Questionnaire
 Measured snow parameter(s)
![Sensors 18 02016 i002]() Yes
Yes![Sensors 18 02016 i002]() No
No

![Sensors 18 02016 i003]() Snow covered area (Snow extent) - Optical remote sensing
Snow covered area (Snow extent) - Optical remote sensing![Sensors 18 02016 i003]() Snow covered area (Snow extent) - Camera or web-cam
Snow covered area (Snow extent) - Camera or web-cam![Sensors 18 02016 i003]() Snow presence - Visual
Snow presence - Visual![Sensors 18 02016 i003]() Snow presence - Camera or web-cam
Snow presence - Camera or web-cam![Sensors 18 02016 i003]() Snow presence - Snow depth sensor
Snow presence - Snow depth sensor![Sensors 18 02016 i003]() Snow presence - Thermometer
Snow presence - Thermometer![Sensors 18 02016 i003]() Snow presence - Infrared sensor
Snow presence - Infrared sensor![Sensors 18 02016 i003]() Snow depth (HS) - Stakes
Snow depth (HS) - Stakes![Sensors 18 02016 i003]() Snow depth (HS) - Rulers
Snow depth (HS) - Rulers![Sensors 18 02016 i003]() Snow depth (HS) - Snow probe
Snow depth (HS) - Snow probe![Sensors 18 02016 i003]() Snow depth (HS) - MagnaProbe
Snow depth (HS) - MagnaProbe![Sensors 18 02016 i003]() Snow depth (HS) - Ultrasonic and laser depth sensors
Snow depth (HS) - Ultrasonic and laser depth sensors![Sensors 18 02016 i003]() Snow depth (HS) - Time-lapse photography
Snow depth (HS) - Time-lapse photography![Sensors 18 02016 i003]() Snow depth (HS) - Terrestrial and air-borne Laser Scanner
Snow depth (HS) - Terrestrial and air-borne Laser Scanner![Sensors 18 02016 i003]() Snow depth (HS) - Unmanned Aerial Vehicle & Photogrammetry
Snow depth (HS) - Unmanned Aerial Vehicle & Photogrammetry![Sensors 18 02016 i003]() Snow depth (HS) - Ground Penetrating Radar
Snow depth (HS) - Ground Penetrating Radar![Sensors 18 02016 i003]() Liquid water content (LWC) - Melting/freezing calorimetry
Liquid water content (LWC) - Melting/freezing calorimetry![Sensors 18 02016 i003]() Liquid water content (LWC) - Alcohol calorimetry
Liquid water content (LWC) - Alcohol calorimetry![Sensors 18 02016 i003]() Liquid water content (LWC) - Dilution method
Liquid water content (LWC) - Dilution method![Sensors 18 02016 i003]() Liquid water content (LWC) - Time Domain Reflectometry (TDR)
Liquid water content (LWC) - Time Domain Reflectometry (TDR)![Sensors 18 02016 i003]() Liquid water content (LWC) - Snow Fork
Liquid water content (LWC) - Snow Fork![Sensors 18 02016 i003]() Liquid water content (LWC) - Denoth meter
Liquid water content (LWC) - Denoth meter![Sensors 18 02016 i003]() Snow Water Equivalent (SWE) - Snow sampling tube
Snow Water Equivalent (SWE) - Snow sampling tube![Sensors 18 02016 i003]() Snow Water Equivalent (SWE) - Snow cutters & scale
Snow Water Equivalent (SWE) - Snow cutters & scale![Sensors 18 02016 i003]() Snow Water Equivalent (SWE) - Snow pillow
Snow Water Equivalent (SWE) - Snow pillow![Sensors 18 02016 i003]() Snow Water Equivalent (SWE) - Scale (i.e., Sommer scale)
Snow Water Equivalent (SWE) - Scale (i.e., Sommer scale)![Sensors 18 02016 i003]() Snow Water Equivalent (SWE) - Snow gauge
Snow Water Equivalent (SWE) - Snow gauge![Sensors 18 02016 i003]() Snow Water Equivalent (SWE) - Passive snow water equivalent sensor (i.e., Campbell CS 725)
Snow Water Equivalent (SWE) - Passive snow water equivalent sensor (i.e., Campbell CS 725)![Sensors 18 02016 i003]() Snow Water Equivalent (SWE) - Snowpack analyzer
Snow Water Equivalent (SWE) - Snowpack analyzer![Sensors 18 02016 i003]() Snow Water Equivalent (SWE) - Gamma and cosmic rays sensors
Snow Water Equivalent (SWE) - Gamma and cosmic rays sensors![Sensors 18 02016 i003]() Snow Water Equivalent (SWE) - Ground penetrating radar
Snow Water Equivalent (SWE) - Ground penetrating radar![Sensors 18 02016 i003]() Snow Water Equivalent (SWE) - Acoustic sensor
Snow Water Equivalent (SWE) - Acoustic sensor![Sensors 18 02016 i003]() Snow Density - Snow sampling tube
Snow Density - Snow sampling tube![Sensors 18 02016 i003]() Snow Density - Snow cutter & scale
Snow Density - Snow cutter & scale![Sensors 18 02016 i003]() Snow Density - Scale (i.e., Sommer scale)
Snow Density - Scale (i.e., Sommer scale)![Sensors 18 02016 i003]() Snow Density - Neutron probe
Snow Density - Neutron probe![Sensors 18 02016 i003]() Snow Density - Snow MicroPen
Snow Density - Snow MicroPen![Sensors 18 02016 i003]() Snow temperature (Ts) - Manual thermistor probe
Snow temperature (Ts) - Manual thermistor probe![Sensors 18 02016 i003]() Snow temperature (Ts) - Fixed thermistor string
Snow temperature (Ts) - Fixed thermistor string![Sensors 18 02016 i003]() Snow temperature (Ts) - Pyrgeometer (only surface)
Snow temperature (Ts) - Pyrgeometer (only surface)![Sensors 18 02016 i003]() Snow temperature (Ts) - Infrared sensor (or camera) above the surface
Snow temperature (Ts) - Infrared sensor (or camera) above the surface![Sensors 18 02016 i003]() Snow temperature (Ts) - Probe with infrared sensors
Snow temperature (Ts) - Probe with infrared sensors![Sensors 18 02016 i003]() Snow temperature (Ts) - i-buttons
Snow temperature (Ts) - i-buttons![Sensors 18 02016 i003]() Snow layer thickness (stratigraphy) - Visual observations & ruler
Snow layer thickness (stratigraphy) - Visual observations & ruler![Sensors 18 02016 i003]() Snow layer thickness (stratigraphy) - NIR photography
Snow layer thickness (stratigraphy) - NIR photography![Sensors 18 02016 i003]() Snow layer thickness (stratigraphy) - Translucent profile
Snow layer thickness (stratigraphy) - Translucent profile![Sensors 18 02016 i003]() Snow hardness - Hand test
Snow hardness - Hand test![Sensors 18 02016 i003]() Snow hardness - Push-pull gauges
Snow hardness - Push-pull gauges![Sensors 18 02016 i003]() Snow hardness - SnowMicroPen
Snow hardness - SnowMicroPen![Sensors 18 02016 i003]() Penetrability of snow surface - Ram penetrometer
Penetrability of snow surface - Ram penetrometer![Sensors 18 02016 i003]() Penetrability of snow surface - Foot penetration
Penetrability of snow surface - Foot penetration![Sensors 18 02016 i003]() Penetrability of snow surface - Ski penetration
Penetrability of snow surface - Ski penetration![Sensors 18 02016 i003]() Snow strength/shear resistance - Shovel Shear test
Snow strength/shear resistance - Shovel Shear test![Sensors 18 02016 i003]() Snow strength/shear resistance - Loaded column test
Snow strength/shear resistance - Loaded column test![Sensors 18 02016 i003]() Snow strength/shear resistance - Trapezoidal Tensile test
Snow strength/shear resistance - Trapezoidal Tensile test![Sensors 18 02016 i003]() Snow strength/shear resistance - Flat jack Shear test
Snow strength/shear resistance - Flat jack Shear test![Sensors 18 02016 i003]() Snow strength/shear resistance - Shear frame test
Snow strength/shear resistance - Shear frame test![Sensors 18 02016 i003]() Snow strength/shear resistance - Rutschblock test
Snow strength/shear resistance - Rutschblock test![Sensors 18 02016 i003]() Snow strength/shear resistance - SnowMicroPen
Snow strength/shear resistance - SnowMicroPen![Sensors 18 02016 i003]() Snow roughness length (aerodynamic roughness) - Wind profile
Snow roughness length (aerodynamic roughness) - Wind profile![Sensors 18 02016 i003]() Snow surface roughness - Laser scanner
Snow surface roughness - Laser scanner![Sensors 18 02016 i003]() Snow surface roughness - Photography
Snow surface roughness - Photography![Sensors 18 02016 i003]() Runoff - Lysimeter
Runoff - Lysimeter![Sensors 18 02016 i003]() Other:
Other: ![Sensors 18 02016 i001]()

![Sensors 18 02016 i002]() Yes
Yes![Sensors 18 02016 i002]() No
No
![Sensors 18 02016 i003]() Grain shape - Visual
Grain shape - Visual![Sensors 18 02016 i003]() Grain shape - Visual & magnifying glasses
Grain shape - Visual & magnifying glasses![Sensors 18 02016 i003]() Grain shape - Macro-photography & image processing
Grain shape - Macro-photography & image processing![Sensors 18 02016 i003]() Grain shape - Casting & Micro-computed tomography & image processing
Grain shape - Casting & Micro-computed tomography & image processing![Sensors 18 02016 i003]() Grain size - Visual & scale
Grain size - Visual & scale![Sensors 18 02016 i003]() Grain size - Visual & scale & magnifying glasses
Grain size - Visual & scale & magnifying glasses![Sensors 18 02016 i003]() Grain size - Macro-photography & image processing
Grain size - Macro-photography & image processing![Sensors 18 02016 i003]() Grain size - NIR-photography
Grain size - NIR-photography![Sensors 18 02016 i003]() Grain size - Casting & Micro-computed tomography & image processing
Grain size - Casting & Micro-computed tomography & image processing![Sensors 18 02016 i003]() Optical-equivalent grain size - Contact probe of Spectro-radiometer & snow-radiative transfer model
Optical-equivalent grain size - Contact probe of Spectro-radiometer & snow-radiative transfer model![Sensors 18 02016 i003]() Optical-equivalent grain size - Spectro-radiometer & snow-radiative transfer model
Optical-equivalent grain size - Spectro-radiometer & snow-radiative transfer model![Sensors 18 02016 i003]() Microwave equivalent grain size - Microwave radiometers & snow microwave emission model
Microwave equivalent grain size - Microwave radiometers & snow microwave emission model![Sensors 18 02016 i003]() Specific Surface Area (SSA) - IceCube
Specific Surface Area (SSA) - IceCube![Sensors 18 02016 i003]() Specific Surface Area (SSA) - ASSSAP
Specific Surface Area (SSA) - ASSSAP![Sensors 18 02016 i003]() Specific Surface Area (SSA) - NIR-photography
Specific Surface Area (SSA) - NIR-photography![Sensors 18 02016 i003]() Specific Surface Area (SSA) - SnowMicroPen
Specific Surface Area (SSA) - SnowMicroPen![Sensors 18 02016 i003]() Specific Surface Area (SSA) - Casting & Micro-computed tomography & image processing
Specific Surface Area (SSA) - Casting & Micro-computed tomography & image processing![Sensors 18 02016 i003]() Specific Surface Area (SSA) - CH4 absorption
Specific Surface Area (SSA) - CH4 absorption![Sensors 18 02016 i003]() Snow correlation function - Casting & Micro-computed tomography & image processing
Snow correlation function - Casting & Micro-computed tomography & image processing![Sensors 18 02016 i003]() Snow correlation length - Casting & Micro-computed tomography & image processing
Snow correlation length - Casting & Micro-computed tomography & image processing![Sensors 18 02016 i003]() Snow correlation length - SnowMicroPen
Snow correlation length - SnowMicroPen![Sensors 18 02016 i003]() Snow tortuosity - Casting & Micro-computed tomography & image processing
Snow tortuosity - Casting & Micro-computed tomography & image processing![Sensors 18 02016 i003]() Snow porosity - Casting & Micro-computed tomography & image processing
Snow porosity - Casting & Micro-computed tomography & image processing![Sensors 18 02016 i003]() Air permeability of snow - Permeameter, or permeability apparatus (controlled air flow through a snow sample)
Air permeability of snow - Permeameter, or permeability apparatus (controlled air flow through a snow sample)![Sensors 18 02016 i003]() Air permeability of snow - Casting & micro-computed tomography
Air permeability of snow - Casting & micro-computed tomography![Sensors 18 02016 i003]() Snow stickiness - Casting & Micro-computed tomography& image processing
Snow stickiness - Casting & Micro-computed tomography& image processing![Sensors 18 02016 i003]() Snow thermal conductivity - Heat flux plate
Snow thermal conductivity - Heat flux plate![Sensors 18 02016 i003]() Snow thermal conductivity - Transient needle probe
Snow thermal conductivity - Transient needle probe![Sensors 18 02016 i003]() Snow thermal conductivity - Thermistor string
Snow thermal conductivity - Thermistor string![Sensors 18 02016 i003]() Snow thermal conductivity - Micro-computed tomography & image processing
Snow thermal conductivity - Micro-computed tomography & image processing![Sensors 18 02016 i003]() Other:
Other: ![Sensors 18 02016 i001]()
![Sensors 18 02016 i002]() Yes
Yes![Sensors 18 02016 i002]() No
No
![Sensors 18 02016 i003]() Snow Bidirectional Reflectance Distribution Function (BRDF) - Gonio-spectro-radiometer
Snow Bidirectional Reflectance Distribution Function (BRDF) - Gonio-spectro-radiometer![Sensors 18 02016 i003]() Snow Bidirectional Reflectance Distribution Function (BRDF) - Camera + white Lambertian-reflecting target
Snow Bidirectional Reflectance Distribution Function (BRDF) - Camera + white Lambertian-reflecting target![Sensors 18 02016 i003]() Polarization of snow optical reflectance - Spectro-radiometer
Polarization of snow optical reflectance - Spectro-radiometer![Sensors 18 02016 i003]() Snow Spectral Albedo - Spectro-radiometer connected to cosine receptor or integrating sphere
Snow Spectral Albedo - Spectro-radiometer connected to cosine receptor or integrating sphere![Sensors 18 02016 i003]() Snow broadband albedo - Spectro-radiometer connected to cosine receptor or integrating sphere
Snow broadband albedo - Spectro-radiometer connected to cosine receptor or integrating sphere![Sensors 18 02016 i003]() Snow broadband albedo - Pyranometers
Snow broadband albedo - Pyranometers![Sensors 18 02016 i003]() Snow e-folding depth - Fiber-optic probes
Snow e-folding depth - Fiber-optic probes![Sensors 18 02016 i003]() Snow optical transmittance - Array of spectro-radiometers (two or more)
Snow optical transmittance - Array of spectro-radiometers (two or more)![Sensors 18 02016 i003]() Snow brightness temperature - Microwave radiometer
Snow brightness temperature - Microwave radiometer![Sensors 18 02016 i003]() Snow backscattering - Radar
Snow backscattering - Radar![Sensors 18 02016 i003]() Snow electrical conductivity - Snow fork
Snow electrical conductivity - Snow fork![Sensors 18 02016 i003]() Other:
Other: ![Sensors 18 02016 i001]()
![Sensors 18 02016 i002]() Yes
Yes![Sensors 18 02016 i002]() No
No
![Sensors 18 02016 i003]() Height of new snow, depth of snowfall - Stakes
Height of new snow, depth of snowfall - Stakes![Sensors 18 02016 i003]() Height of new snow, depth of snowfall - Rulers
Height of new snow, depth of snowfall - Rulers![Sensors 18 02016 i003]() Height of new snow, depth of snowfall - Snow probe
Height of new snow, depth of snowfall - Snow probe![Sensors 18 02016 i003]() Height of new snow, depth of snowfall - MagnaProbe
Height of new snow, depth of snowfall - MagnaProbe![Sensors 18 02016 i003]() Height of new snow, depth of snowfall - Ultrasonic and laser depth sensors
Height of new snow, depth of snowfall - Ultrasonic and laser depth sensors![Sensors 18 02016 i003]() Height of new snow, depth of snowfall - Time-lapse photography
Height of new snow, depth of snowfall - Time-lapse photography![Sensors 18 02016 i003]() Height of new snow, depth of snowfall - Terrestrial and air-borne Laser Scanner
Height of new snow, depth of snowfall - Terrestrial and air-borne Laser Scanner![Sensors 18 02016 i003]() Height of new snow, depth of snowfall - Photogrammetry
Height of new snow, depth of snowfall - Photogrammetry![Sensors 18 02016 i003]() Precipitation Intensity - Weighting-recording gauge
Precipitation Intensity - Weighting-recording gauge![Sensors 18 02016 i003]() Precipitation Intensity - Present weather detector based on extinction
Precipitation Intensity - Present weather detector based on extinction![Sensors 18 02016 i003]() Hydrometeor fall velocity and size distribution - Optical disdrometer
Hydrometeor fall velocity and size distribution - Optical disdrometer![Sensors 18 02016 i003]() Drifting snow occurrence - Visual observation
Drifting snow occurrence - Visual observation![Sensors 18 02016 i003]() Number flux of drifting snow - Snow particle counter
Number flux of drifting snow - Snow particle counter![Sensors 18 02016 i003]() Number flux of drifting snow - Mechanical trap & wind speed measurements
Number flux of drifting snow - Mechanical trap & wind speed measurements![Sensors 18 02016 i003]() Number flux of drifting snow - Camera system with light source
Number flux of drifting snow - Camera system with light source![Sensors 18 02016 i003]() Number flux of drifting snow - FlowCapt acoustic sensor
Number flux of drifting snow - FlowCapt acoustic sensor![Sensors 18 02016 i003]() Number flux of drifting snow - Disdrometer
Number flux of drifting snow - Disdrometer![Sensors 18 02016 i003]() Particle size of drifting snow - Sticking slides & photography & image processing
Particle size of drifting snow - Sticking slides & photography & image processing![Sensors 18 02016 i003]() Particle size of drifting snow - Camera system with light source & image processing
Particle size of drifting snow - Camera system with light source & image processing![Sensors 18 02016 i003]() Particle size of drifting snow - Disdrometer
Particle size of drifting snow - Disdrometer![Sensors 18 02016 i003]() Other:
Other: ![Sensors 18 02016 i001]()
![Sensors 18 02016 i002]() Yes
Yes![Sensors 18 02016 i002]() No
No
![Sensors 18 02016 i003]() Snow impurity - Ion chromatography
Snow impurity - Ion chromatography![Sensors 18 02016 i003]() Snow impurity - Organic and Elemental Carbon analyzer (OC/EC)
Snow impurity - Organic and Elemental Carbon analyzer (OC/EC)![Sensors 18 02016 i003]() Snow impurity - Single Particle Soot Photometer (SP2)
Snow impurity - Single Particle Soot Photometer (SP2)![Sensors 18 02016 i003]() Snow impurity - Filter & spectrophotometer
Snow impurity - Filter & spectrophotometer![Sensors 18 02016 i003]() Snow isotopes - Mass spectrometer
Snow isotopes - Mass spectrometer![Sensors 18 02016 i003]() Snow isotopes - Laser absorption methods (Cavity ring down-spectroscopy-analyzer, Integrated cavity output spectroscopy-analyzer)
Snow isotopes - Laser absorption methods (Cavity ring down-spectroscopy-analyzer, Integrated cavity output spectroscopy-analyzer)![Sensors 18 02016 i003]() Other:
Other: ![Sensors 18 02016 i001]()
![Sensors 18 02016 i003]() Bog
Bog![Sensors 18 02016 i003]() Forest
Forest![Sensors 18 02016 i003]() Glacier
Glacier![Sensors 18 02016 i003]() Mountain
Mountain![Sensors 18 02016 i003]() Lake Ice
Lake Ice![Sensors 18 02016 i003]() Plain (flat open area)
Plain (flat open area)![Sensors 18 02016 i003]() Sea Ice
Sea Ice![Sensors 18 02016 i003]() Tundra
Tundra![Sensors 18 02016 i003]() Urban Area
Urban Area![Sensors 18 02016 i003]() Other:
Other: ![Sensors 18 02016 i001]()
![Sensors 18 02016 i002]() Yes, for all the measured parameters I applied a written protocol, which describes both the use of the instrumentation and its set up in various environmental conditions
Yes, for all the measured parameters I applied a written protocol, which describes both the use of the instrumentation and its set up in various environmental conditions![Sensors 18 02016 i002]() Yes, for some of the measured parameters I applied a written protocol, which describes both the use of the instrumentation and its set up in various environmental conditions. For some parameters I only followed the general instructions of the instrument and applied measurement strategy based on my own experience or on the oral teaching of senior scientists/operators
Yes, for some of the measured parameters I applied a written protocol, which describes both the use of the instrumentation and its set up in various environmental conditions. For some parameters I only followed the general instructions of the instrument and applied measurement strategy based on my own experience or on the oral teaching of senior scientists/operators![Sensors 18 02016 i002]() No, I only followed the general instructions of the instrument and applied measurement strategy based on my own experience or on the oral teaching of senior scientists/operators.
No, I only followed the general instructions of the instrument and applied measurement strategy based on my own experience or on the oral teaching of senior scientists/operators.![Sensors 18 02016 i002]() No, I don’t use any written protocol, I apply the instrument’s instructions using the instrument as I learned by myself.
No, I don’t use any written protocol, I apply the instrument’s instructions using the instrument as I learned by myself.![Sensors 18 02016 i002]() Other:
Other: ![Sensors 18 02016 i001]()
![Sensors 18 02016 i003]() Research
Research![Sensors 18 02016 i003]() Operational
Operational
![Sensors 18 02016 i003]() Agriculture and Forestry
Agriculture and Forestry![Sensors 18 02016 i003]() Avalanche
Avalanche![Sensors 18 02016 i003]() Climatology
Climatology![Sensors 18 02016 i003]() Flooding
Flooding![Sensors 18 02016 i003]() Health and Sport
Health and Sport![Sensors 18 02016 i003]() Hydrology
Hydrology![Sensors 18 02016 i003]() Meteorology
Meteorology![Sensors 18 02016 i003]() Traffic
Traffic![Sensors 18 02016 i003]() Water Management
Water Management![Sensors 18 02016 i003]() Other:
Other: ![Sensors 18 02016 i001]()
Appendix D. European Countries and Institutions Participating to the Survey
| Country | Total N° of Answers | Number of Answers per Institution |
|---|---|---|
| Albania | 1 | 1, Institute of GeoSciences, Energy, Water, and Environment (IGJEUM) |
| Andorra | 1 | 1, Snow and Mountain Research Centre |
| Austria | 4 | 2, Central Institution for Meteorology and Geodynamics (ZAMG) 1, University of Graz 1, Avalanche warning Centre Tirol (LWD) |
| Belgium | 2 | 1, University of Leuven (KU Leuven) 1, Royal Meteorological Institute |
| Bosnia and Herzegovina | 1 | 1, Federal hydrometeorological institute |
| Bulgaria | 3 | 3, National Institute of Meteorology and Hydrology |
| Croatia | 1 | 1, Croatian Meteorological and Hydrological Service (DHMZ) |
| Cyprus | 1 | 1, Cyprus Department of Meteorology |
| Czech Republic | 3 | 1, Czech University of Life Sciences, Department of Agroecology and Biometeorology 1, Czech Hydrometeorological Institute (CHMI) 1, Charles University, Department of Physical Geography and Geoecology |
| Denmark | 2 | 1, Danish Meteorological Institute (DMI) 1, Geological Survey of Denmark and Greenland (GEUS) |
| Estonia | 2 | 2, Estonian Environment Agency |
| Finland | 12 | 8, Finnish Meteorological Institute (FMI) 2, Finnish Geospatial Research Institute 1, Finnish Environment Institute (SYKE) 1, University of Oulu |
| France | 9 | 1, National Center for Scientific Research/Center for the Study of the Biosphere from Space (CNRS/CESBIO) 1, National Center for Scientific Research/Laboratory of Hydrology and Environment Transfers (CNRS/LTHE) 2, Météo-France 2, Laboratory of Glaciology and Environmental Geophysics (LGGE) 1, Grenoble Alps University 1, National Research Institute of Science and Technology for Environment and Agriculture (IRSTEA) 1, French Electricity (Electricité de France—EDF) |
| Germany | 3 | 1, Alfred Wegener Institute 1, German Weather Service (DWD) 1, Ludwig-Maximilian University of Munich, Depart. Earth and Environmental Sciences |
| Greece | 1 | 1, University of Thessaly |
| Hungary | 3 | 3, Hungarian Meteorological Service (OMSZ) |
| Iceland | 3 | 1, Icelandic Meteorological Office 1, Reykjavik University 1, National Power Company of Iceland (Landsvirkjun) |
| Ireland | 2 | 1, University College Dublin 1, Irish Meteorological Service |
| Italy | 12 | 3, Regional Environmental Protection Agency (ARPA) 1, National Research Council/Institute for the Dynamics of Environmental Processes (CNR/IDPA) 1, University of Pavia 1, Insubria University 1, Civil protection of Friuli Venezia Giulia Region 1, Civil Protection of Marche Region 1, Civil protection of Bolzan Province 2 Snow and Avalanche Warning Service of Valle d’Aosta 1, Italian Air Force/Technical Centre for Meteorology |
| Latvia | 1 | 1, Latvian Environment, Geology and Meteorology Centre |
| Lithuania | 2 | 1, Lithuanian Hydrometeorological Service 1, Vilnius University |
| Luxembourg | 1 | 1, Agricultural Service (ASTA) |
| Norway | 3 | 2, Norwegian Water Resource and Energy Directorate (NVE) 1, University of Oslo |
| Poland | 6 | 1, Institute of Meteorology and Water Management—National Research Institute (IMGW-PIB) 1, University of Silesia 2, Institute of Geophysics-Polish Academy of Sciences 1, Nicolaus Copernicus University in Toruń, N.Copernicus Polar Station on Spitsbergen 1, University of Wrocław, Department of Climatology and Atmosphere Protection |
| Portugal | 1 | 1, Portuguese Institute of the Sea and the Atmosphere (IPMA) |
| Republic of Macedonia | 1 | 1, Hydrometeorological Service |
| Romania | 1 | 1, National Meteorological Administration |
| Russia | 3 | 2, Russian State Hydrometeorological University (RSHU) 1, Federal State Budget Institution—North-West Management of Hydrometeorology and Environmental Monitoring (FGBU—Severo-Zapadnoe UGMS) |
| Serbia | 1 | 1, Republic Hydrometeorological Service of Serbia |
| Slovakia | 3 | 1, Earth Science Institute 1,Technical University in Zvolen (TU Zvolen) 1, Institute of Hydrology—Slovak Academy of Sciences |
| Slovenia | 7 | 1, Slovenian Environment Agency 1, Slovenian Forestry Institute 1, Geodetic Institute of Slovenia 1, Scientific Research Centre of the Slovenian Academy of Sciences and Arts, Anton Melik Geographical Institute 1, Jožef Stefan Institute 1, Anton Melik Geographical Institute (ZRC SAZU) 1, Mountain Rescue of Slovenia (Gorska reševalna zveza Slovenije) |
| Spain | 8 | 1, Spanish National Research Council (CSIC) 1, Spanish State Meteorology Agency (AEMET) 1,University of Salamanca 1, Spanish Geological Survey (IGME) 1,University of the Basque Country 1,University of Granada 1, General Water Directorate 1, Environment and Water Agency of Andalusia |
| Sweden | 3 | 2, Swedish Meteorological and Hydrological Institute (SMHI) 1, Water regulation enterprises (Vattenregleringsföretagen) |
| Switzerland | 5 | 2 WSL Institute for Snow and Avalanche Research (SLF) 1University of Bern—Institute of Geography 1, Meteo Swiss 1, University of Zurich |
| The Netherlands | 1 | 1, Institute for Marine and Atmospheric research Utrecht, Utrecht University |
| Turkey | 4 | 1, Middle East Technical University (METU) 1, Anadolu University 1, Turkish State Meteorological Service 1, General Directorate of State Hydraulic Works (DSI) |
| United Kingdom | 7 | 3, Met Office 1, Scottish Environment Protection Agency 1, Scottish Avalanche Information Service 1, University of Edimburg 1, Northumbria University |
| Ukraine | 1 | 1, Ukrainian Hydrometeorological Institute |
References
- Witze, A. Snow sensors seek best way to track the white stuff. Nature 2016, 532, 17. [Google Scholar] [CrossRef] [PubMed]
- Brown, R.D.; Mote, P.W. The Response of Northern Hemisphere Snow Cover to a Changing Climate. J. Clim. 2009, 22, 2124–2145. [Google Scholar] [CrossRef]
- Intergovernmental Panel on Climate Change (IPCC). Climate Change 2014: Synthesis Report. Contribution of Working Groups I, II and III to the Fifth Assessment Report of the Intergovernmental Panel on Climate Change; Pachauri, R.K., Meyer, L.A., Eds.; Intergovernmental Panel on Climate Change (IPCC): Geneva, Switzerland, 2014; p. 151. [Google Scholar]
- Gastineau, G.; Garcia-Serrano, J.; Frankignoul, C. The Influence of Autumnal Eurasian Snow Cover on Climate and Its Link. J. Clim. 2017, 30, 7599–7619. [Google Scholar] [CrossRef]
- Burakowski, E.; Magnusson, M. Climate Impacts on the Winter Tourism Economy in the United States; Natural Resources Defense Council: New York, NY, USA, 2012; p. 36. Available online: https://protectourwinters.org/climate_report/report.pdf (accessed on 30 April 2018).
- Organisation for Economic Co-operation and Development (OECD). Climate Change in the European Alps: Adapting Winter Tourism and Natural Hazards Management; Organisation for Economic Co-operation and Development (OECD): Paris, France, 2007; p. 136. ISBN 9789264031692. [Google Scholar]
- Kokhanovsky, A.; Rozanov, V.V.; Aoki, T.; Odermatt, D.; Brockmann, C.; Krüger, O.; Bouvet, M.; Drusch, M.; Hori, M. Sizing snow grains using backscattered solar light. Int. J. Remote Sens. 2011, 32, 6975–7008. [Google Scholar] [CrossRef]
- Picard, G.; Sandells, M.; Löwe, H. SMRT: An active/passive microwave radiative transfer model for snow with multiple microstructure and scattering formulations (v1.0). Geosci. Model Dev. 2017. [Google Scholar] [CrossRef]
- Proksch, M.; Mätzler, C.; Wiesmann, A.; Lemmetyinen, J.; Schwank, M.; Löwe, H.; Schneebeli, M. MEMLS3&a, Microwave Emission Model of Layered Snowpacks adapted to include backscattering. Geosci. Model Dev. 2015, 8, 2611–2626. [Google Scholar] [CrossRef]
- Räisänen, P.; Makkonen, R.; Kirkevåg, A.; Boldingh Debernard, J. Effects of snow grain shape on climate simulations: Sensitivity tests with the Norwegian Earth System Model. Cryosphere Discuss. 2017. [Google Scholar] [CrossRef]
- Gallet, J.-C.; Domine, F.; Zender, C.S.; Picard, G. Measurement of the specific surface area of snow using infrared reflectance in an integrating sphere at 1310 and 1550 nm. Cryosphere 2009, 3, 167–182. [Google Scholar] [CrossRef] [Green Version]
- Arnaud, L.; Picard, G.; Champollion, N.; Domine, F.; Gallet, J.-C.; Lefebvre, E.; Fily, M.; Barnola, J.-M. Measurement of vertical profiles of snow specific surface area with a 1 cm resolution using infrared reflectance: Instrument description and validation. J. Glaciol. 2011, 57, 17–29. [Google Scholar] [CrossRef]
- Proksch, M.; Löwe, H.; Schneebeli, M. Density, specific surface area, and correlation length of snow measured by high-resolution penetrometry. J. Geophys. Res. Earth Surf. 2015, 120. [Google Scholar] [CrossRef]
- Fierz, C.; Armstrong, R.L.; Durand, Y.; Etchevers, P.; Greene, E.; McClung, D.M.; Nishimura, K.; Satyawali, P.K.; Sokratov, S.A. The International Classification for Seasonal Snow on the Ground; IHP-VII Technical Documents in Hydrology N°83, IACS Contribution N°1; UNESCO-IHP: Paris, France, 2009. [Google Scholar]
- Kinar, N.J.; Pomeroy, J.W. Measurement of the physical properties of the snowpack. Rev. Geophys. 2015, 53, 481–544. [Google Scholar] [CrossRef] [Green Version]
- Lehning, M.; Bartelt, P.; Brown, B.; Fierz, C.; Satyawali, P. A physical SNOWPACK model for the Swiss avalanche warning Part II. Snow microstructure. Cold Reg. Sci. Technol. 2002, 35, 147–167. [Google Scholar] [CrossRef]
- Vionnet, V.; Brun, E.; Morin, S.; Boone, A.; Faroux, S.; Le Moigne, P.; Martin, E.; Willemet, J.-M. The detailed snowpack scheme Crocus and its implementation in SURFEX v7.2. Geosci. Model Dev. 2012, 5, 773–791. [Google Scholar] [CrossRef] [Green Version]
- Tedesco, M.; Kokhanovsky, A.A. The semi-analytical snow retrieval algorithm and its application to MODIS data. Remote Sens. Environ. 2007, 111, 228–241. [Google Scholar] [CrossRef]
- Mätzler, C. Applications of the Interaction of Microwaves with the Natural Snow Cover. Remote Sens. Rev. 1987, 2, 259–387. [Google Scholar] [CrossRef]
- Pulliainen, J.; Grandell, J.; Hallikainen, M. HUT snow emission model and its applicability to snow water equivalent retrieval. IEEE Trans. Geosci. Remote Sens. 1999, 37, 1378–1390. [Google Scholar] [CrossRef]
- Macelloni, G.; Paloscia, S.; Pampaloni, P.; Brogioni, M.; Ranzi, R.; Crepaz, A. Monitoring of melting refreezing cycles of snow with microwave radiometers: The Microwave Alpine Snow Melting Experiment (MASMEx 2002–2003). IEEE Trans. Geosci. Remote Sens. 2005, 43, 2431–2442. [Google Scholar] [CrossRef]
- Lemmetyinen, J.; Derksen, C.; Toose, P.; Proksch, M.; Pulliainen, J.; Kontu, A.; Rautiainen, K.; Seppänen, J.; Hallikainen, M. Simulating seasonally and spatially varying snow cover brightness temperature using HUT snow emission model and retrieval of a microwave effective grain size. Remote Sens. Environ. 2015, 156, 71–95. [Google Scholar] [CrossRef]
- Pomeroy, J.W.; Gray, D.M. Saltation of snow. Water Resour. Res. 1990, 26, 1583–1594. [Google Scholar]
- Schmidt, R.A. Measuring particle size and snowfall intensity in drifting snow. Cold Reg. Sci. Technol. 1984, 9, 121–129. [Google Scholar] [CrossRef]
- Mackiewicz, M.C. A new approach to quantifying soil temperature responses to changing air temperature and snow cover. Polar Sci. 2012, 6, 226–236. [Google Scholar] [CrossRef]
- Dadic, R.; Schneebeli, M.; Lehning, M.; Hutterli, M.A.; Ohmura, A. Impact of the microstructure of snow on its temperature: A model validation with measurements from Summit, Greenland. J. Geophys. Res. 2008, 113, D14303. [Google Scholar] [CrossRef]
- Techel, F.; Pielmeier, C. Point observations of liquid water content in wet snow–investigating methodical, spatial and temporal aspects. Cryosphere 2011, 5, 405–418. [Google Scholar] [CrossRef]
- Matzl, M.; Schneebeli, M. Measuring specific surface area of snow by near-infrared photography. J. Glaciol. 2006, 52, 558–564. [Google Scholar] [CrossRef] [Green Version]
- Gergely, M.; Wolfsperger, F.; Schneebeli, M. Simulation and Validation of the InfraSnow: An Instrument to Measure Snow Optically Equivalent Grain Size. IEEE Trans. Geosci. Remote Sens. 2014, 52, 4236–4247. [Google Scholar] [CrossRef]
- Aoki, T.; Aoki, T.; Fukabori, M.; Hachikubo, A.; Tachibana, Y.; Nishio, F. Effects of snow physical parameters on spectral albedo and bi-directional reflectance of snow surface. J. Geophys. Res. 2000, 105, 10219–10236. [Google Scholar] [CrossRef]
- Pirazzini, R.; Räisänen, P.; Vihma, T.; Johansson, M.; Tastula, E.M. Measurements and modelling of snow particle size and shortwave infrared albedo over a melting Antarctic ice sheet. Cryosphere 2015, 9, 2357–2381. [Google Scholar] [CrossRef] [Green Version]
- McArthur, L.J.B. Baseline Surface Radiation Network (BSRN). Operations Manual. Version 2.1. WCRP-121, WMO/TD-No. 1274. 2005. Available online: http://hdl.handle.net/10013/epic.39582.d001 (accessed on 28 April 2018).
- World Meteorological Organization. Guide to Meteorological Instruments and Methods of Observation, 2014th ed.; Report WMO-No. 8; World Meteorological Organization: Geneva, Switzerland, 2017; p. 1177. Available online: http://library.wmo.int/opac/doc_num.php?explnum_id=3121 (accessed on 28 April 2018).
- World Meteorological Organization. Guide to Hydrological Practices, Report WMO-No. 168, Volume I: Hydrology—From Measurement to Hydrological Information, Geneva, Switzerland, 2008. p. 296. Available online: http://www.whycos.org/hwrp/guide/index.php (accessed on 28 April 2018).
- Lanzinger, E.; Theel, M. Optimized Snow Plates and Snow Grids for Automatic and Manual Snow Depth Measurements. In Proceedings of the WMO Technical Conference on Meteorological and Environmental Instruments and Methods of Observation, Helsinki, Finland, 30 August–1 September 2010; Available online: http://www.wmo.int/pages/prog/www/IMOP/publications/IOM-104_TECO-2010/_PROGRAMME.HTML (accessed on 28 April 2018).
- Scherrer, S.C.; Wüthrich, C.; Croci-Maspoli, M.; Weingartner, R.; Appenzeller, C. Snow variability in the Swiss Alps 1864–2009. Int. J. Climatol. 2013, 33, 3162–3173. [Google Scholar] [CrossRef]
- Niang, M.; Bernier, M.; Gauthier, Y.; Fortin, G.; Van Bochove, E.; Stacheder, M.; Brandelik, A. On the validation of snow densities derived from SNOWPOWER probes in a temperate snow cover in eastern Canada: First results. Proc. East. Snow Conf. 2003, 60, 175–187. [Google Scholar]
- Larson, K.M.; Gutmann, E.D.; Zavorotny, V.U.; Braun, J.J.; Williams, M.W.; Nievinski, F.G. Can we measure snow depth with GPS receivers? Geophys. Res. Lett. 2009, 36, L17502. [Google Scholar] [CrossRef]
- Jacobson, M.D. Inferring snow water equivalent for a snow-covered ground reflector using GPS multipath signals. Remote Sens. 2010, 2, 2426–2441. [Google Scholar] [CrossRef]
- McCreight, J.L.; Small, E.E.; Larson, K.M. Snow depth, density, and SWE estimates derived from GPS reflection data: Validation in the western U.S. Water Resour. Res. 2014, 50, 6892–6909. [Google Scholar] [CrossRef]
- Arslan, A.N.; Tanis, C.M.; Metsämäki, S.; Aurela, M.; Böttcher, K.; Linkosalmi, M.; Peltoniemi, M. Automated Webcam Monitoring of Fractional Snow Cover in Northern Boreal Conditions. Geosciences 2017, 7, 55. [Google Scholar] [CrossRef]
- Nitu, R.; Roulet, Y.A. WMO SPICE: Intercomparison of Instruments and Methods for the Measurement of Solid Precipitation and Snow on the Ground, Overall Results and Recommendations. In Proceedings of the WMO Technical Conference on Meteorological and Environmental Instruments and Methods of Observation, Madrid, Spain, 27–30 September 2016; Available online: https://www.wmo.int/pages/prog/www/IMOP/publications/IOM-125_TECO_2016/Session_3/K3A_Nitu_SPICE.pdf (accessed on 30 April 2018).
- Charrois, L.; Cosme, E.; Dumont, M.; Lafaysse, M.; Morin, S.; Libois, Q.; Picard, G. On the assimilation of optical reflectances and snow depth observations into a detailed snowpack model. Cryosphere 2016, 10, 1021–1038. [Google Scholar] [CrossRef]
- Wautier, A.; Geindreau, C.; Flin, F. Linking snow microstructure to its macroscopic elastic stiffness tensor: A numerical homogenization method and its application to 3-D images from X-ray tomography. Geophys. Res. Lett. 2015, 42. [Google Scholar] [CrossRef]
- Bellaire, S.; Jamieson, J.B.; Fierz, C. Forcing the snow-cover model SNOWPACK with forecasted weather data. Cryosphere 2011, 5, 1115–1125. [Google Scholar] [CrossRef] [Green Version]
- Dong, C. Remote sensing, hydrological modeling and in-situ observations in snow cover research: A review. J. Hydrol. 2018. [Google Scholar] [CrossRef]
- Lehning, M.; Fierz, C. Assessment of snow transport in avalanche terrain. Cold Reg. Sci. Technol. 2008, 51, 240–252. [Google Scholar] [CrossRef]
- Naaim-Bouvet, F.; Bellot, H.; Naaim, M. Back analysis of drifting-snow measurements over an instrumented mountainous site. Ann. Glaciol. 2010, 51, 207–217. [Google Scholar] [CrossRef] [Green Version]
- Jaedicke, C. Snow drift losses from an Arctic catchment on Spitsbergen: An additional process in the water balance. Cold Reg. Sci. Technol. 2002, 34, 1–10. [Google Scholar] [CrossRef]
- Savelyev, S.A.; Gordon, M.; Hanesiak, J.; Papakyriakou, T.; Taylor, P. Blowing snow studies in the Canadian Arctic Shelf Exchange Study, 2003–04. Hydrol. Process. 2006, 20, 817–827. [Google Scholar] [CrossRef]
- Scarchilli, C.; Frezzotti, M.; Grigioni, P.; De Silvestri, L.; Agnoletto, L.; Dolci, S. Extraordinary blowing snow transport events in East Antarctica. Clim. Dyn. 2010, 34, 1195–1206. [Google Scholar] [CrossRef]
- Gallée, H.; Trouvilliez, A.; Agosta, C.; Genthon, C.; Favier, V.; Naaim-Bouvet, F. Transport of snow by the wind: A comparison between observations in Adélie Land, Antarctica, and simulations made with the regional climate model MAR. Bound. Layer Meteorol. 2013, 146, 133–147. [Google Scholar] [CrossRef]
- Trouvilliez, A.; Naaim-Bouvet, F.; Bellot, H.; Genthon, C.; Gallée, H. Evaluation of the FlowCapt Acoustic Sensor for the Aeolian Transport of Snow. J. Atmos. Ocean. Technol. 2015, 32, 1630–1641. [Google Scholar] [CrossRef] [Green Version]
- Liston, G.E.; Hiemstra, C.A. A Simple Data Assimilation System for Complex Snow Distributions (SnowAssim). J. Hydrometeorol. 2008, 9, 989–1004. [Google Scholar] [CrossRef]
- De Rosnay, P.; Balsamo, G.; Albergel, C.; Muñoz-Sabater, J.; Isaksen, L. Initialisation of Land Surface Variables for Numerical Weather Prediction. Surv. Geophys. 2014, 35, 607–621. [Google Scholar] [CrossRef]
- De Rosnay, P.; Isaksen, L.; Dahoui, M. Snow data assimilation at ECMWF. ECMWF Newslett. 2015, 143, 26–31. [Google Scholar]
- Brun, E.; Lawrimore, J.; de Rosnay, P.; Friddell, J. A Global Cryosphere Watch Initiative—For Improving In-Situ Snow Observations and Their Access—For Rescuing/Collecting Historical In-Situ Snow Data; OSD/GCW-CNT1/Doc 3.1.3; World Meteorological Organization, Global Cryosphere Watch: Geneva, Switzerland, 2013; pp. 5–13. [Google Scholar]
- Bokhorst, S.; Pedersen, S.H.; Brucker, L.; Anisimov, O.; Bjerke, J.W.; Brown, R.D.; Ehrich, D.; Essery, R.L.; Heilig, A.; Ingvander, S.; et al. Changing Arctic snow cover: A review of recent developments and assessment of future needs for observations, modelling, and impacts. Ambio 2016, 45, 516–537. [Google Scholar] [CrossRef] [PubMed] [Green Version]
- Zermatten, E.; Haussener, S.; Schneebeli, M.; Steinfeld, A. Tomography-based determination of permeability and Dupuit–Forchheimer coefficient of characteristic snow samples. J. Glaciol. 2011, 57, 811–816. [Google Scholar] [CrossRef] [Green Version]
- Calonne, N.; Geindreau, C.; Flin, F.; Morin, S.; Lesaffre, B.; Rolland du Roscoat, S.; Charrier, P. 3-D image-based numerical computations of snow permeability: Links to specific surface area, density, and microstructural anisotropy. Cryosphere 2012, 6, 939–951. [Google Scholar] [CrossRef] [Green Version]
- Zermatten, E.; Schneebeli, M.; Arakawa, H.; Steinfeld, A. Tomography-based determination of porosity, specific area and permeability of snow and comparison with measurements. Cold Reg. Sci. Technol. 2014, 97, 33–40. [Google Scholar] [CrossRef]
- Torquato, S. Random Heterogeneous Materials; Springer: New York, NY, USA, 2013; p. 703. [Google Scholar]
- Debye, P.; Anderson, H.R., Jr.; Brumberger, H. Scattering by an inhomogeneous solid. II. The correlation function and its application. J. Appl. Phys. 1957, 28, 679–683. [Google Scholar] [CrossRef]
- Grenfell, T.C.; Warren, S.G. Representation of a nonspherical ice particle by a collection of independent spheres for scattering and absorption of radiation. J. Geophys. Res. 1999, 104, 31697–31708. [Google Scholar] [CrossRef]
- Epstein, N. On tortuosity and the tortuosity factor in flow and diffusion through porous media. Chem. Eng. Sci. 1989, 44, 777–779. [Google Scholar] [CrossRef]
- Kaempfer, T.U.; Schneebeli, M.; Sokratov, S.A. A microstructural approach to model heat transfer in snow. Geophys. Res. Lett. 2005, 32, L21503. [Google Scholar] [CrossRef]
- Cohn, S.A. International Cloud Atlas, 2017th ed.; World Meteorological Organization: Geneva, Switzerland, 2017; p. 1177. Available online: https://cloudatlas.wmo.int/home.html (accessed on 29 April 2018).
- Kinar, N.J.; Pomeroy, J.W. Determining snow water equivalent by acoustic sounding. Hydrol. Process. 2007, 21, 2623–2640. [Google Scholar] [CrossRef]
- Kinar, N.J.; Pomeroy, J.W. SAS2: The systemfor acoustic sensing of snow. Hydrol. Process. 2015. [Google Scholar] [CrossRef]
- Gordon, M.; Taylor, P.A. Measurements of blowing snow, part I: Particle shape, size distribution, velocity, and number flux at Churchill, Manitoba, Canada. Cold Reg. Sci. Technol. 2009, 55, 63–74. [Google Scholar] [CrossRef]
- Gromke, C.; Horender, S.; Walter, B.; Lehning, M. Snow particle characteristics in the saltation layer. J. Glaciol. 2014, 60, 431–438. [Google Scholar] [CrossRef]
- Denoth, A. An electronic device for long-term snow wetness recording. Ann. Glaciol. 1994, 19, 104–106. [Google Scholar] [CrossRef] [Green Version]
- Perla, R.; LaChapelle, E. Dilution method for measuring liquid water in snow. Proc. West. Snow Conf. 1984, 52, 80–85. [Google Scholar]
- Davis, R.; Dozier, J.; LaChapelle, E.; Perla, R. Field and laboratory measurements of snow liquid water by dilution. Water Resour. Res. 1985, 21, 1415–1420. [Google Scholar] [CrossRef]
- Löffler-Mang, M.; Joss, J. An optical disdrometer for measuring size and velocity of hydrometeors. J. Atmos. Ocean. Technol. 2000, 17, 130–139. [Google Scholar] [CrossRef]
- Kruger, A.; Krajewski, W.F. Two-Dimensional Video Disdrometer: A Description. J. Atmos. Ocean. Technol. 2002, 19, 602–617. [Google Scholar] [CrossRef]
- Newman, A.; Kucera, P.; Bliven, L. Presenting the Snowflake Video Imager (SVI). J. Atmos. Ocean. Technol. 2009, 26, 167–179. [Google Scholar] [CrossRef]
- Garrett, T.J.; Fallgatter, C.; Shkurko, K.; Howlett, D. Fallspeed measurement and high-resolution multi-angle photography of hydrometeors in freefall. Atmos. Meas. Tech. 2012, 5, 2625–2633. [Google Scholar] [CrossRef] [Green Version]
- Tiira, J.; Moisseev, D.N.; von Lerber, A.; Ori, D.; Tokay, A.; Bliven, L.F.; Petersen, W. Ensemble mean density and its connection to other microphysical properties of falling snow as observed in Southern Finland. Atmos. Meas. Tech. 2016, 9, 4825–4841. [Google Scholar] [CrossRef] [Green Version]
- Chritin, V.; Bolognesi, R.; Gubler, H. FlowCapt: A new acoustic sensor to measure snowdrift and wind velocity for avalanche forecasting. Cold Reg. Sci. Technol. 1999, 30, 125–133. [Google Scholar] [CrossRef]
- American Avalanche Association. Snow, Weather and Avalanches: Observation guidelines for Avalanche Programs in the United States, 3rd ed.; American Avalanche Association: Victor, ID, USA, 2016; p. 104. [Google Scholar]
- Bissell, V.C.; Peck, E.L. Monitoring snow water equivalent by using natural soil radioactivity. Water Resour. Res. 1973, 9, 885–890. [Google Scholar] [CrossRef]
- Bourgeois, C.S.; Ohmura, A.; Schroff, K.; Frei, H.J.; Calanca, P. IAC ETH Gonio-Spectrometer: A tool for hyperspectral HDRF measurements. J. Atmos. Ocean. Technol. 2006, 23, 573–584. [Google Scholar] [CrossRef]
- Buchhorn, M.; Petereit, R.; Heim, B. A Manual Transportable Instrument Platform for Ground-Based Spectro-Directional Observations (ManTIS) and the Resultant Hyperspectral Field Goniometer System. Sensors 2013, 13, 16105–16128. [Google Scholar] [CrossRef] [Green Version]
- Peltoniemi, J.I.; Hakala, T.; Suomalainen, J.; Honkavaara, E.; Markelin, L.; Gritsevich, M.; Eskelinen, J.; Jaanson, P.; Ikonen, E. A detailed study for the provision of measurement uncertainty and traceability for goniospectrometers. J. Quant. Spectrosc. Radiat. 2014, 146, 376–390. [Google Scholar] [CrossRef]
- Marshall, H.-P.; Koh, G. FMCW radars for snow research. Cold Reg. Sci. Technol. 2008, 52, 118–131. [Google Scholar] [CrossRef]
- Schmid, L.; Koch, F.; Heilig, A.; Prasch, M.; Eisen, O.; Mauser, W.; Schweizer, J. A novel sensor combination (upGPR-GPS) to continuously and nondestructively derive snow cover properties. Geophys. Res. Lett. 2015, 42, 3397–3405. [Google Scholar] [CrossRef] [Green Version]
- Pielmeier, C.; Schneebeli, M. Stratigraphy and changes in hardness of snow measured by hand, ramsonde and snow micro penetrometer: A comparison with planar sections. Cold Reg. Sci. Technol. 2003, 37, 393–405. [Google Scholar] [CrossRef]
- Sauer, T.J. Heat flux. In Encyclopedia of Soil Science, 2nd ed.; Lal, R., Ed.; CRC Press: Boca Raton, FL, USA, 2006; Volume 1, p. 1923. [Google Scholar]
- Riche, F.; Schneebeli, M. Thermal conductivity of snow measured by three independent methods and anisotropy considerations. Cryosphere 2013, 7, 217–227. [Google Scholar] [CrossRef]
- Wolfsperger, F.; Hinterberger, B.; Christian, J.; Matzl, M.; Jahnel, R.; Spörri, J.; Kröll, J.; Gilgien, M.; Rhyner, H.; Schneebeli, M.; et al. Quantifying snow conditions of World Cup Alpine ski racing tracks. In Science and Skiing VI; Müller, E., Kroll, J., Lindinger, S., Pfusterschmied, J., Stöggl, T., Eds.; Sixth International Congress on Science and Skiing: Tyrol, Austria, 2015; pp. 330–339. [Google Scholar]
- Legrand, M.; de Angelis, M.; Delmas, R.J. Ion chromatographic determination of common ions at ultratrace levels in Antarctic snow and ice. Anal. Chim. Acta 1984, 156, 181–192. [Google Scholar] [CrossRef]
- Mair, M.; Baumgartner, D.J. Operational Experience with Automatic Snow Depth Sensors—Ultrasonic and Laser Principle. In Proceedings of the WMO Technical Conference on Meteorological and Environmental Instruments and Methods of Observation, Helsinki, Finland, 30 August–1 September 2010; Available online: http://www.wmo.int/pages/prog/www/IMOP/publications/IOM-104_TECO-2010/_PROGRAMME.HTML (accessed on 28 April 2018).
- Kaasalainen, S.; Kaasalainen, M.; Mielonen, T.; Suomalainen, J.; Peltoniemi, J.I.; Näränen, J. Optical properties of snow in backscatter. J. Glaciol. 2006, 52, 574–584. [Google Scholar] [CrossRef] [Green Version]
- Deems, J.S.; Painter, T.H.; Finnegan, D.C. Lidar measurements of snow depth: A review. J. Glaciol. 2013, 59, 467–479. [Google Scholar] [CrossRef]
- Picard, G.; Arnaud, L.; Panel, J.M.; Morin, S. Design of a scanning laser meter for monitoring the spatio-temporal evolution of snow depth and its application in the Alps and in Antarctica. Cryosphere 2016, 10, 1495–1511. [Google Scholar] [CrossRef] [Green Version]
- Sturm, M. Self-Recording Snow Depth Probe, CRREL Factsheet; Cold Regions Research and Engineering Laboratory: Hanover, NH, USA, 1999. [Google Scholar]
- Vallelonga, P.; Van de Velde, K.; Candelone, J.-P.; Ly, C.; Rosman, K.J.R.; Boutron, C.F.; Morgan, V.I.; Mackey, D.J. Recent advances in measurement of Pb isotopes in polar ice and snow at sub-picogram pergram concentrations using thermal ionisation mass spectrometry. Anal. Chim. Acta 2002, 453, 1–12. [Google Scholar] [CrossRef]
- Hanot, L.; Dominé, F. Evolution of the surface area of a snow layer. Environ. Sci. Technol. 1999, 33, 4250–4255. [Google Scholar] [CrossRef]
- Dominé, F.; Cabanes, A.; Taillandier, A.S.; Legagneux, L. Specific surface area of snow samples determined by CH4 adsorption at 77 K and estimated by optical microscopy and scanning electron microscopy. Environ. Sci. Technol. 2001, 35, 771–780. [Google Scholar] [CrossRef] [PubMed]
- Kerbrat, M.; Pinzer, B.; Huthwelker, T.; Gäggeler, H.W.; Ammann, M.; Schneebeli, M. Measuring the specific surface area of snow with X-ray tomography and gas adsorption: Comparison and implications for surface smoothness. Atmos. Chem. Phys. 2008, 8, 1261–1275. [Google Scholar] [CrossRef] [Green Version]
- Schneebeli, M.; Sokratov, S.A. Tomography of temperature gradient metamorphism of snow and associated changes in heat conductivity. Hydrol. Process. 2004, 18, 3655–3665. [Google Scholar] [CrossRef]
- Heggli, M.; Frei, M.; Schneebeli, M. Snow replica method for three-dimensional X-ray microtomography imaging. J. Glaciol. 2009, 55, 631–639. [Google Scholar] [CrossRef]
- Calonne, N.; Flin, F.; Morin, S.; Lesaffre, B.; du Roscoat, S.R.; Geindreau, C. Numerical and experimental investigations of the effective thermal conductivity of snow. Geophys. Res. Lett. 2011, 38, L23501. [Google Scholar] [CrossRef]
- Wiesmann, A.; Mätzler, C. Microwave Emission Model of Layered Snowpacks. Remote Sens. Environ. 1999, 70, 307–316. [Google Scholar] [CrossRef]
- Picard, G.; Brucker, L.; Roy, A.; Dupont, F.; Fily, M.; Royer, A.; Harlow, C. Simulation of the microwave emission of multi-layered snowpacks using the Dense Media Radiative transfer theory: The DMRT-ML model. Geosci. Model Dev. 2013, 6, 1061–1078. [Google Scholar] [CrossRef]
- Seckmeyer, G.; Bais, A.; Bernhard, G.; Blumthaler, M.; Johnsen, B.; Lantz, K.; McKenzie, R. Instruments to Measure Solar Ultraviolet Radiation—Part 3: Multi-Channel Filter Instruments; Global Atmosphere Watch Report, GAW Report No. 190; World Meteorological Organization: Geneva, Switzerland, 2010; p. 51. [Google Scholar]
- McFarlane, S.A.; Gaustad, K.L.; Mlawer, E.J.; Long, C.N.; Delamere, J. Development of a high spectral resolution surface albedo product for the ARM Southern Great Plains central facility. Atmos. Meas. Tech. 2011, 4, 1713–1733. [Google Scholar] [CrossRef] [Green Version]
- Tape, K.D.; Rutter, N.; Marshall, H.-P.; Essery, R.; Sturm, M. Recording microscale variations in snowpack layering using near-infrared photography. J. Glaciol. 2010, 56, 75–80. [Google Scholar] [CrossRef] [Green Version]
- Zreda, M.; Desilets, D.; Ferré, T.P.A.; Scott, R.L. Measuring soil moisture content non-invasively at intermediate spatial scale using cosmic-ray neutrons. Geophys. Res. Lett. 2008, 35, 1–5. [Google Scholar] [CrossRef]
- Sigouin, M.J.P.; Si, B.C. Calibration of a non-invasive cosmic-ray probe for wide area snow water equivalent measurement. Cryosphere 2016, 10, 1181–1190. [Google Scholar] [CrossRef] [Green Version]
- Morris, E.M. A theoretical analysis of the neutron scattering method of measuring snow and ice density. J. Geophys. Res. 2008, 113. [Google Scholar] [CrossRef] [Green Version]
- Watson, J.G.; Chow, J.C.; Chen, L.W.A. Summary of Organic and Elemental Carbon/Black Carbon Analysis Methods and Intercomparisons. Aerosol Air Qual. Res. 2005, 5, 65–102. [Google Scholar] [CrossRef] [Green Version]
- Currie, L.A.; Benner, B.A., Jr.; Cachier, H.; Cary, R.; Chow, J.C.; Druffel, E.R.M.; Eglinton, T.I.; Gustafsson, Ö.; Hartmann, P.C.; Hedges, J.I.; Kessler, J.D.; et al. A critical evaluation of interlaboratory data on total, elemental, and isotopic carbon in the carbonaceous particle reference material, NIST SRM 1649a. J. Res. Natl. Bur. Stand. 2002, 107, 279–298. [Google Scholar] [CrossRef] [PubMed]
- Hardy, J.; Albert, D. The permeability of temperate snow: Preliminary links to microstructure. Proc. East. Snow Conf. 1993, 50, 149–156. [Google Scholar]
- Debeer, C.M.; Pomeroy, J.W. Modelling snow melt and snow cover depletion in a small alpine cirque, Canadian Rocky Mountains. Hydrol. Process. 2009, 23, 2584–2599. [Google Scholar] [CrossRef]
- Farinotti, D.; Magnusson, J.; Huss, M.; Bauder, A. Snow accumulation distribution inferred from time-lapse photography and simple modelling. Hydrol. Process. 2010, 24, 2087–2097. [Google Scholar] [CrossRef]
- Bühler, Y.; Marty, M.; Egli, L.; Veitinger, J.; Jonas, T.; Thee, P.; Ginzler, C. Snow depth mapping in high-alpine catchments using digital photogrammetry. Cryosphere 2015, 9, 229–243. [Google Scholar] [CrossRef] [Green Version]
- Revuelto, J.; Jonas, T.; López-Moreno, J.I. Backward snow depth reconstruction at high spatial resolution based on time-lapse photography. Hydrol. Process. 2016, 30, 2976–2990. [Google Scholar] [CrossRef]
- Bühler, Y.; Adams, M.S.; Bösch, R.; Stoffel, A. Mapping snow depth in alpine terrain with unmanned aerial systems (UASs): Potential and limitations. Cryosphere 2016, 10, 1075–1088. [Google Scholar] [CrossRef]
- de Michele, C.; Avanzi, F.; Passoni, D.; Barzaghi, R.; Pinto, L.; Dosso, P.; Ghezzi, A.; Gianatti, R.; Della Vedova, G. Using a fixed-wing UAS to map snow depth distribution: An evaluation at peak accumulation. Cryosphere 2016, 10, 511–522. [Google Scholar] [CrossRef]
- Nolan, M.; Larsen, C.; Sturm, M. Mapping snow depth from manned aircraft on landscape scales at centimeter resolution using structure-from-motion photogrammetry. Cryosphere 2015, 9, 1445–1463. [Google Scholar] [CrossRef]
- Hakala, T.; Suomalainen, J.; Peltoniemi, J.I. Acquisition of bidirectional reflectance factor dataset using a micro unmanned aerial vehicle and a consumer camera. Remote Sens. 2010, 2, 819–832. [Google Scholar] [CrossRef]
- Anttila, K.; Manninen, T.; Karjalainen, T.; Lahtinen, P.; Riihelä, A.; Siljamo, N. The temporal and spatial variability in submeter scale surface roughness of seasonal snow in Sodankylä Finnish Lapland in 2009–2010. J. Geophys. Res. Atmos. 2014, 119, 9236–9252. [Google Scholar] [CrossRef]
- Irvine-Flynn, T.D.L.; Sant-Ablanedo, E.; Rutter, N.; Smith, M.W.; Chandler, J.H. Measuring glacier Surface roughness using plot-scale, close-range digital photogrammetry. J. Glaciol. 2014, 60. [Google Scholar] [CrossRef] [Green Version]
- Maeno, N.; Naruse, R.; Nishimura, K.; Takei, I.; Ebinuma, T.; Kobayabhi, S.; Nlshlmura, H.; Kaneda, Y.; Ishida, T. Wind-Tunnel Experiments on Blowing Snow. Ann. Glaciol. 1985, 6, 63–67. [Google Scholar] [CrossRef] [Green Version]
- Lönnqvist, J.; Nylander, P. A present weather instrument. In Proceedings of the Instruments and Observing Methods, WMO Technical Conference on Instruments and Methods of Observations (TECO-92), Vienna, Austria, 11–15 May 1992; Report No 49. World Meteorological Organization: Geneva, Switzerland, 1992; pp. 290–294. [Google Scholar]
- Sigrist, C. Measurement of Fracture Mechanical Properties of Snow and Application to Dry Snow Slab Avalanche Release. Ph.D. Thesis, Swiss Federal Institute of Technology, Zurich, Switzerland, 2006. [Google Scholar]
- Gauthier, D.; Jamieson, B. Evaluation of a prototype field test for fracture and failure propagation propensity in weak snowpack layers. Cold Reg. Sci. Technol. 2007. [Google Scholar] [CrossRef]
- Takeuchi, Y.; Nohguchi, Y.; Kawashima, K.; Izumi, K. Measurement of snow-hardness distribution. Ann. Glaciol. 1998, 26, 27–30. [Google Scholar] [CrossRef] [Green Version]
- Höller, P.; Fromm, R. Quantification of the hand hardness test. Ann. Glaciol. 2010, 51, 39–44. [Google Scholar] [CrossRef] [Green Version]
- Singh, P.; Singh, V.P. Snow and Glacier Hydrology; Kluwer Academic Publishers: Dordrecht, The Netherlands, 2001; p. 743. [Google Scholar]
- Ferguson, S.A.; LaChapelle, E.R. The ABCs of Avalanche Safety; The Mountaineers Books: Seattle, WA, USA, 2003. [Google Scholar]
- Perla, R. Strength tests on newly fallen snow. J. Glaciol. 1969, 8, 427–440. [Google Scholar] [CrossRef]
- Wendl, I.A.; Menking, J.A.; Färber, R.; Gysel, M.; Kaspari, S.D.; Laborde, M.J.G.; Schwikowski, M. Optimized method for black carbon analysis in ice and snow using the Single Particle Soot Photometer. Atmos. Meas. Tech. Discuss. 2014, 7, 3075–3111. [Google Scholar] [CrossRef]
- Schwarz, J.P.; Gao, R.S.; Fahey, D.W.; Thomson, D.S.; Watts, L.A.; Wilson, J.C.; Reeves, J.M.; Darbeheshti, M.; Baumgardner, D.G.; Kok, G.L.; et al. Single-particle measurements of midlatitude black carbon and light-scattering aerosols from the boundary layer to the lower stratosphere. J. Geophys. Res. 2006, 111, D16207. [Google Scholar] [CrossRef]
- Proksch, M.; Rutter, N.; Fierz, C.; Schneebeli, M. Intercomparison of snow density measurements: Bias, precision, and vertical resolution. Cryosphere 2016, 10, 371–384. [Google Scholar] [CrossRef]
- Sihvola, A.; Tiuri, M. Snow fork for field determination of the density and wetness profiles of a snow pack. IEEE Trans. Geosci. Remote Sens. 1986, 24, 717–721. [Google Scholar] [CrossRef]
- American Meteorological Society. Snow Gauge, Glossary of Meteorology. 2018. Available online: http://glossary.ametsoc.org/wiki/Snow_gauge (accessed on 22 June 2018).
- Goodison, B.E.; Louie, P.Y.T.; Yang, D. Final report of The WMO Solid Precipitation Measurement Intercomparison; WMO/TD-No. 872, IOM No. 67; World Meteorological Organization: Geneva, Switzerland, 1998; p. 212. [Google Scholar]
- Schneebeli, M.; Pielmeier, C.; Johnson, J.B. Measuring snow microstructure and hardness using a high resolution penetrometer. Cold Reg. Sci. Technol. 1999, 30, 101–114. [Google Scholar] [CrossRef] [Green Version]
- Sato, T.; Kimura, T. Field test of a new Snow-particles-Counter (SPC) system. Ann. Glaciol. 1993, 18, 149–154. [Google Scholar] [CrossRef]
- Beaumont, R. Mt. Hood pressure pillow snow gauge. J. Appl. Meteorol. 1965, 4, 626–631. [Google Scholar] [CrossRef]
- Goodison, B.; Ferguson, H.; McKay, G. Measurement and data analysis. In Handbook of Snow: Principles, Processes, Management and Use; Pergamon Press Canada: Toronto, ON, Canada, 1981; pp. 191–274. [Google Scholar]
- Bormann, K.J.; Westra, S.; Evans, J.P.; McCabe, M.F. Spatial and temporal variability in seasonal snow density. J. Hydrol. 2013, 484, 63–73. [Google Scholar] [CrossRef]
- Doherty, S.J.; Warren, S.G.; Grenfell, T.C.; Clarke, A.D.; Brandt, R.E. Light-absorbing impurities in Arctic snow. Atmos. Chem. Phys. 2010, 10, 11647–11680. [Google Scholar] [CrossRef] [Green Version]
- Carmagnola, C.M.; Dominé, F.; Dumont, M.; Wright, P.; Strellis, B.; Bergin, M.; Dibb, J.; Picard, G.; Libois, Q.; Arnaud, L.; et al. Snow spectral albedo at Summit, Greenland: Measurements and numerical simulations based on physical and chemical properties of the snowpack. Cryosphere 2013, 7, 1139–1160. [Google Scholar] [CrossRef]
- Kuchiki, K.; Aoki, T.; Tanikawa, T.; Kodama, Y. Retrieval of snow physical parameters using a ground-based spectral radiometer. Appl. Opt. 2009, 48, 5567–5582. [Google Scholar] [CrossRef] [PubMed]
- Picard, G.; Libois, Q.; Arnaud, L.; Verin, G.; Dumont, M. Development and calibration of an automatic spectral albedometer to estimate near-surface snow SSA time series. Cryosphere 2016, 10, 1297–1316. [Google Scholar] [CrossRef] [Green Version]
- Painter, T.H.; Molotch, N.P.; Cassidy, M.; Flanner, M.; Steffen, K. Contact spectroscopy for determination of stratigraphy of snow optical grain size. J. Glaciol. 2007, 53, 121–127. [Google Scholar] [CrossRef]
- Vihma, T.; Mattila, O.-P.; Pirazzini, R.; Johansson, M.M. Spatial and temporal variability in summer snow pack in Dronning Maud Land, Antarctica. Cryosphere 2011, 5, 187–201. [Google Scholar] [CrossRef] [Green Version]
- Schneebeli, M.; Coleou, C.; Touvier, F.; Lesaffre, B. Measurement of density and wetness in snow using time-domain reflectometry. Ann. Glaciol. 1998, 26, 69–72. [Google Scholar] [CrossRef] [Green Version]
- Sturm, M.; Johnson, J.B. Thermal conductivity measurements of depth hoar. J. Geophys. Res. 1992, 97, 2129–2139. [Google Scholar] [CrossRef]
- Morin, S.; Domine, F.; Arnaud, L.; Picard, G. In-situ measurement of the effective thermal conductivity of snow. Cold Reg. Sci. Technol. 2010, 64, 73–80. [Google Scholar] [CrossRef]
- Benson, C.S. Stratigraphic studies in the snow and firn of the Greenland ice sheet. SIPRE Res. Rep. 1962, 70, 93. [Google Scholar]
- Good, W.; Krüsi, G. Micro- and macro-analyses of stratigraphic snow profiles. In Proceedings of the International Snow Science Workshop, Breckenridge, CO, USA, 4–8 October 1992. [Google Scholar]


| N° of Answers | Answer |
|---|---|
| 22 | Yes, for all of the measured parameters I applied a written protocol, which describes both the use of the instrumentation and its set up in various environmental conditions. |
| 53 | Yes, for some of the measured parameters I applied a written protocol, which describes both the use of the instrumentation and its set up in various environmental conditions. For some parameters I only followed the general instructions of the instrument and applied measurement strategy based on my own experience or on the oral teaching of senior scientists/operators. |
| 37 | No, I only followed the general instructions of the instrument and applied measurement strategy based on my own experience or on the oral teaching of senior scientists/operators. |
| 8 | No, I do not use any written protocol, and I apply the instrument’s instructions using the instrument as I learned to, by myself. |
| 5 | Other |
© 2018 by the authors. Licensee MDPI, Basel, Switzerland. This article is an open access article distributed under the terms and conditions of the Creative Commons Attribution (CC BY) license (http://creativecommons.org/licenses/by/4.0/).
Share and Cite
Pirazzini, R.; Leppänen, L.; Picard, G.; Lopez-Moreno, J.I.; Marty, C.; Macelloni, G.; Kontu, A.; Von Lerber, A.; Tanis, C.M.; Schneebeli, M.; et al. European In-Situ Snow Measurements: Practices and Purposes. Sensors 2018, 18, 2016. https://doi.org/10.3390/s18072016
Pirazzini R, Leppänen L, Picard G, Lopez-Moreno JI, Marty C, Macelloni G, Kontu A, Von Lerber A, Tanis CM, Schneebeli M, et al. European In-Situ Snow Measurements: Practices and Purposes. Sensors. 2018; 18(7):2016. https://doi.org/10.3390/s18072016
Chicago/Turabian StylePirazzini, Roberta, Leena Leppänen, Ghislain Picard, Juan Ignacio Lopez-Moreno, Christoph Marty, Giovanni Macelloni, Anna Kontu, Annakaisa Von Lerber, Cemal Melih Tanis, Martin Schneebeli, and et al. 2018. "European In-Situ Snow Measurements: Practices and Purposes" Sensors 18, no. 7: 2016. https://doi.org/10.3390/s18072016