Glacier Runoff Variation Since 1981 in the Upper Naryn River Catchments, Central Tien Shan
 Tomas Saks1*
  Eric Pohl1
  Horst Machguth1
  Amaury Dehecq2,3,4
  Martina Barandun1,5
  Ruslan Kenzhebaev6 Olga Kalashnikova6
  Martin Hoelzle1
- 1Department of Geosciences, University of Fribourg, Fribourg, Switzerland
- 2Laboratory of Hydraulics, Hydrology and Glaciology (VAW), ETH Zurich, Zurich, Switzerland
- 3Swiss Federal Institute for Forest, Snow and Landscape Research (WSL), Birmensdorf, Switzerland
- 4CNRS, IRD, IGE, Univ. Grenoble Alpes, Grenoble, France
- 5Institute of Earth Observation, EURAC, Bolzano, Italy
- 6Department 2 “Climate, Water and Natural Resources”, Central-Asian Institute for Applied Geosciences, Bishkek, Kyrgyzstan
Water resources in Central Asia strongly depend on glaciers, which in turn adjust their size in response to climate variations. We investigate glacier runoff in the period 1981–2019 in the upper Naryn basin, Kyrgyzstan. The basins contain more than 1,000 glaciers, which cover a total area of 776 km2. We model the mass balance and runoff contribution of all glaciers with a simplified energy balance melt model and distributed accumulation model driven by ERA5 LAND re-analysis data for the time period of 1981–2019. The results are evaluated against discharge records, satellite-derived snow cover, stake readings from individual glaciers, and geodetic mass balances. Modelled glacier volume decreased by approximately 6.7 km3 or 14%, and the majority of the mass loss took place from 1996 until 2019. The decreasing trend is the result of increasingly negative summer mass balances whereas winter mass balances show no substantial trend. Analysis of the discharge data suggests an increasing runoff for the past two decades, which is, however only partly reflected in an increase of glacier melt. Moreover, the strongest increase in discharge is observed in winter, suggesting either a prolonged melting period and/or increased groundwater discharge. The average runoff from the glacierized areas in summer months (June to August) constitutes approximately 23% of the total contributions to the basin’s runoff. The results highlight the strong regional variability in glacier-climate interactions in Central Asia.
1 Introduction
Ice and snow-melt are principal water resources for the highly populated lowlands of Central Asia (Konovalov and Shchetinnicov, 1994; Schaner et al., 2012; Chen et al., 2016), and have a crucial role for mountain communities (Parveen et al., 2015; Nusser, 2017, 2019). Snow accumulation acts as a seasonal water reservoir by storing water during winter, that is progressively released in spring and early summer. It has been observed that summer precipitation increases towards the East in the Tien Shan mountains (Dyurgerov et al., 1994; Shahgedanova et al., 2018) resulting in frequent summer snowfalls in the study area. Glaciers and permafrost release most of their meltwater during July to September. In these precipitation-poor periods, glacier melt is a vital fresh water source (Kaser et al., 2010; Pohl et al., 2017). Pritchard (2019) showed that the amount of net glacier melt in Aral and Chu-Issyk-Kul basins produce the equivalent to 10 months of municipal and industrial water demand for Afghanistan, Tajikistan, Turkmenistan, Uzbekistan and Kyrgyzstan, or the absolute-scarcity needs of 45 ± 10 million people—over half of Central Asia’s population—for 4 months.
In 1960–1970 total glacier volume of 1048 km3 for the whole Tien Shan Mountains was estimated (Kotlyakov et al., 1983; Aizen et al., 2007) and 555.7 km3 for the former Soviet part of the Gissaro-Alai and Pamir in 1980 (Konovalov and Shchetinnicov, 1994). Farinotti et al. (2019) calculated a total glacier ice volume of 3.27 ± 0.85 × 10 km3 for Central Asia.
Konovalov and Shchetinnicov (1994) estimated the contribution of glaciers to summer river runoff in the Panj, Vakhsh and Zeravshan river basins for the period 1957–1980, suggesting that in average years the total runoff from glacierized surfaces contributed 41% of summer runoff in the Panj River (at gauge Nizhnyi Panj), 44% in the Vakhsh River (at gauge Komsomolabad), and 43% in the Zeravshan River (at gauge Dupuli). In low-flow years, the runoff contribution increased to 55–72%, 40–74% and 44–61%, respectively, while in high-flow years both the absolute and the relative contribution decreased. Aizen et al. (1995) estimated 15–20% glacier meltwater contribution to the total runoff for the Tien Shan mountains, though this view was challenged by Unger-Shayesteh et al. (2013). Based on a degree-day approach (Dikikh, 1993; Dikikh et al., 1995; Dikikh et al., 1995) calculated the total glacier runoff in the Tien Shan, suggesting that the glacier contribution is strongly controlled by the fraction of the glacier area over the total catchment area. For the Tien Shan, the share in total annual runoff was found to be 5.9% for the middle reaches of the Syr-Darya river while it reached 46.7% for the investigated northwestern part of the Tarim river catchment (Dikikh, 1993; Dikikh et al., 1995), though in individual sub-basins higher values were calculated. For the Issyk-Kul basins, depending on the degree of glacier fraction in the catchment, total runoff from glacierized surfaces contributed between 5.6 and 87% of summer runoff, and between 1.5 and 53% of total annual runoff. For the Naryn catchment, glacier melt is roughly estimated to supply about 10% of total annual discharge for the time period of 1940–1991 (Aizen et al., 1995).
Analysis of the regional runoff trends yield inconclusive results. Khan and Holko (2009), analyzed the runoff measurements at two gauges (Chinaz for the Syr-Darya River and Kerki for the Amu-Darya River), representing the Syr-Darya and Amu-Darya basins for the observation period 1961–2005. They suggested increasing trends for both basins, attributed to the enhanced glacier melting. Savitskiy et al. (2007) analyzed long-term runoff series starting from the beginning of the 20th century up to 2006 of the Naryn River. The series were averaged over 7 years window, but no statistical tests for significance were applied. They found a small increase in runoff, particularly for the last two decades, attributing it to enhanced glacier melt. This is in agreement with the findings of Podrezov (2001) who also reported an increase in annual runoff from 11.3 to 17.1% for the Inner Tien Shan comparing the two periods 1930–1962, and 1963–1990. Kalashnikova et al. (2020) detected an increase in runoff through a runoff curve partitioning for the time period 1993 until 2017, attributing it to an increase in snow and glacier melt.
Duethmann et al. (2015) investigated the Tarim River head-water catchments and reported a runoff increase for the 1957–2004 using multiple linear regression analysis applied on observation data and using results from a hydrological model. They found that the observed changes in streamflow were consistent with the changes in temperature and precipitation. In the Sari-Djaz catchment, increasing temperatures and related increase of glacier melt were identified as the dominant drivers, while in the Kakshaal catchment, both increasing temperatures and increasing precipitation played a major role. Glacier melt contributions to runoff of 9–24% for the Kakshaal catchment, and 35–48% for the Sari-Djaz catchment were found. The glacier imbalance contribution to runoff was found to be 4–21% for the Kakshaal catchment and 21–40% for the Sari-Djaz catchment.
Shahgedanova et al. (2018) investigated seasonal and monthly flow in seven natural catchments in the northern Tien Shan mountains, aiming to assess the flow response to climate change. They report an increase in streamflow in autumn and winter, while in summer the mean and high flow increased for catchments with a glacier cover of over 10% after the 1970’s, as well as a prolongation of the melting period with high flows as late as September was detected. Unger-Shayesteh et al. (2013) similarly emphasized a shift in the timing of the onset of the melt season towards the earlier spring due to warmer spring temperatures. Kriegel et al. (2013) performed statistical analysis of the Small and Big Naryn catchments and found negative discharge trends for August for Small Naryn, while for Big Naryn they found no significant trend. They also report a high relative and absolute increase in discharge for Big Naryn from May to July, corresponding to positive temperature trends for the same months.
The contribution of snow and glacier melt to total runoff, however, is often poorly constrained. On the one hand, large uncertainties in the meteorological datasets limit the application of hydrological/glaciological models for estimates on snow and glacier dynamics. This is the result of discrepancies in climate forcing datasets, as well as a scarcity in meteorological stations for validation in Central Asia (e.g. Armstrong, 2010; Palazzi et al., 2013; Hoelzle et al., 2017; Pohl et al., 2017; Zandler et al., 2019).
As an alternative, geodetic mass balance estimates (e.g. Brun et al., 2017; Shean et al., 2020) are limited in their temporal resolution, which prevents exploitation of required information for meltwater contribution. Higher temporal resolutions are obtained by incorporating additional Earth observation datasets (e.g. Barandun et al., 2021) and allow to obtain annual estimates on glacier mass balance. However, these approaches share a common short temporal coverage that limit an analysis of meltwater contribution in a climatological context.
In this study, we present simulated glacier melt contribution for the Big and Small Naryn headwater catchments, for the time period 1981–2019. The work is based on a glacier mass balance model (Machguth et al., 2009, 2013), using meteorological forcing from the European Centre for Medium range Weather Forecast (ECMWF) reanalysis dataset ERA5 (Hersbach et al., 2020), and calibrating the model with direct observations on glacier melt as well as geodetic mass balance estimates for the time period 2000–2018 (Barandun et al., 2021). Validation and analysis of obtained results is performed using available runoff observations for the two catchments. Therefore, this approach combines in situ measurements and recent advances in climate and mass balance modelling.
2 Study Area
The Naryn River is the major tributary of the Syr-Darya River (Figure 1) and forms from the confluence of the Big and Small Naryn Rivers upstream. The upper Naryn basin is constrained by the southern slopes of the Kyrgyz Alatoo and Terskey Alatoo in the North, Akshiirak massif in the east, and Ferghana, At-Bashi and Borkoldoy ranges in the South. It drains into the Toktogul reservoir in Kyrgyzstan, and supplies water to the agriculturally important and heavily irrigated Ferghana Valley in Uzbekistan, downstream of the catchment outlet. The Big and Small Naryn catchments have natural, unregulated river water flow. The catchments are located in the north and central Tien Shan region and stretch over an elevation range from 1700 to nearly 5000 m a.s.l.
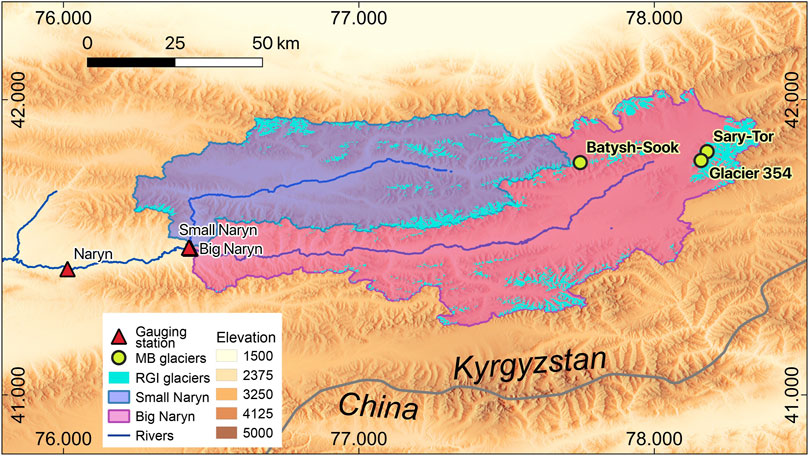
FIGURE 1. Map of the study area. Glaciers with mass balance observations are indicated with yellow dots.
The Small and Big Naryn catchments lie in the inner ranges of the Tien Shan mountains, resulting in a precipitation shielding from western, northwestern and northern air flow, and a drier continental climate than the outer ranges (Sorg et al., 2012). Precipitation maxima occur also later, in late spring to summer, compared to the winter precipitation-dominated outer ranges of Pamir and Tien Shan (Schiemann et al., 2008; Sorg et al., 2012; Pohl et al., 2015). Annual precipitation ranges between 280 and 450 mm (Aizen et al., 1995). According to runoff measurements measurements 4.6, the basin has a nival flow regime with long-term (1963–2008) mean discharge at its tributary into the Toktogul lake of about 350 m3/s (standard deviation of 300 m3/s).
About 8% of the area of both catchments is glacierized according to the Randolph Glacier Inventory (Consortium, 2017) (Figure 1). The total glacierized area is 779 km2, with 462 km2 for the Big Naryn and 317 km2 for the Small Naryn. The mean glacier elevation in the Big Naryn is 4234 m a.s.l. and 4097 m a.s.l. for the Small Naryn catchment, respectively.
3 Data
We delineated both catchments using a digital elevation model (DEM) derived from 1977 KH 9 Hexagon satellite images. The DEM has a native resolution of 24 m and was resampled using inverse distance weighted (IDW) interpolation method to 75 m resolution and void-filled. Voids were filled in two steps. First, voids with a diameter less than 5 pixels were linearly interpolated from the existing DEM. In the next step, larger voids were filled by the SRTM DEM. A detailed description of the KH-9 Hexagon image processing is provided by Dehecq et al. (2020). We modified glacier outlines from Randolph Glacier Inventory (Consortium, 2017) (around the year 2002) by adjusting the glacier tongues using the KH-9 Hexagon orthophotos to represent glacier extents of the year 1977 for all glaciers larger than 1 km2.
For model calibration geodetically-derived mass balance estimates for the time period 2000–2018 were used (Barandun et al., 2021), which are available for all glaciers larger than 1 km2. For glaciers smaller than 1 km2, the mean value of the geodetic mass balance dataset was taken.
The mass balance model is driven by meteorological data from the ERA5-Land re-analysis (Hersbach et al., 2020) at a 0.1° × 0.1° spatial resolution. Hourly values were resampled to daily values. The used parameters comprise 2 m air temperature, total precipitation, and shortwave radiation for the years 1981–2019. Cloud cover was derived from the ECMWF ERA-Interim Re-Analysis (Dee et al., 2011) cloud cover data set.
For model validation, point mass balance observations for the glaciers No. 354, Batysh Sook and Sary-Tor (Figure 1) were available for the time period of 2010–2018. Data from the glaciers No. 354 and Batysh-Sook were obtained within the framework of the CATCOS and CICADA projects (Hoelzle et al., 2017), while data for Sary-Tor glacier were obtained from the World Glacier Monitoring (WGMS) database (Zemp et al., 2020).
For validation of the calculated glacier melt, mean monthly runoff data was used from three gauging stations, situated at the confluence of the Big and Small Naryn rivers and in the Naryn city provided by the Kyrgyz Hydromet (Figure 1). ERA5-Land data products were compared with available daily precipitation and temperature data measured at the Tien Shan meteorological and Kumtor automatic weather station (AWS), located in the north eastern part of the study area (Figure 1).
4 Methods
4.1 Mass Balance Model
The mass balance was computed at a spatial resolution of 75 m for all glaciers using a model developed by Machguth et al. (2009). A detailed description of the model can be found in Machguth et al. (2009), and Machguth et al. (2013). The model runs at daily time steps, and the cumulative mass balance bc on day t+1 is calculated for every time step and over each grid cell of the DEM according to Oerlemans (2001):
where t is the discrete time variable, Δt is the time step (1 day), lm is the latent heat of fusion of ice (334 kJ kg−1) and Psolid is solid precipitation in meter water equivalent (m w.e.). The energy available for melt (Qm) is calculated as follows:
where α is the albedo of the surface, T is the air temperature (in oC at 2 m above ground and outside the glacier boundary layer), and C0 +C1T is the sum of the long-wave radiation balance and the turbulent exchange linearized around the melting point (Oerlemans, 2001).
Global radiation (Sin) is calculated from potential clear sky global radiation (Sin;clr) and fractional cloud cover (n). Both the direct and diffuse part of Sin;clr are computed in a preprocessing routine according to Corripio (2003), Iqbal (1983), considering all effects of surface topography including shading and assuming standard atmospheric transmission coefficients for clear sky conditions. Sin;clr is the sum of diffuse Sin;clrdif and direct radiation Sin;clrdir which are both calculated separately. Daily means of both components of Sin;clr are obtained from a calculation at a temporal resolution of 30 min. This calculation is only performed once in the preprocessing and the resulting 365 arrays of daily mean Sin;clrdif and Sin;clrdir for all days of the year are stored (in leap years the arrays of day number 365 are simply used twice). However, atmospheric transmission coefficients (such as for Rayleigh scattering, water vapor and other gases, aerosol extinction, etc.) are applied in the preprocessing only for a standard atmospheric composition and cannot be altered later. During the mass balance model run, Sin of every individual time step is computed from preprocessed Sin;clr and attenuation of clouds (τcl). The cloud cover (n) was obtained from ERA-Interim re-analysis data Berrisford et al., 2011.
The source of accumulation is solid precipitation (Psolid). A threshold temperature (T_snow) of 1.5°C in combination with a transition range of 0.5° C (i.e. linear increase of the rain fraction from 0% at 1°C to 100% at 2°C) is used to distinguish Psolid from rain. Redistribution of snow by wind or avalanches is not considered in the model. Refreezing of meltwater is parametrized according to Reeh and Reeh (1991) with a maximum retention value of 0.6.
Glaciers are regarded as debris-free which is a reasonable assumption for the bulk of glaciers in Inner Tien Shan (Kraaijenbrink et al., 2017).
4.2 Forcing of the Mass Balance Model
Glacier surface mass balance is calculated at 75 m resolution, orders of magnitude finer than the spatial resolution of the re-analysis used to force the model. We downscale the ERA-5 and ERA-Interim re-analysis as described in detail in Machguth et al. (2009) and Machguth et al. (2013). The downscaling of air temperature involves 1) to remove influence of elevation from the re-analysis by applying a lapse rate to calculate a hypothetical temperature field at 0 m a.s.l. 2) This temperature field is then interpolated to the resolution of the DEM by means of inverse distance weighting. 3) Using the same temperature lapse rate we finally assess air temperature at each glacier (DEM) grid cell. For precipitation we apply the same approach, using an elevation gradient of precipitation. Cloudiness is simply up-sampled from the re-analysis grid to the much finer DEM resolution.
For more details on the downscaling we refer to the two aforementioned studies. Note that these studies also applied de-biasing of RCM data based on weather station data from within the model domains. Such de-biasing was not applied here as the study area includes very few weather stations.
4.3 Mass Balance Model Calibration
Figure 2 is modified after Machguth et al. (2013) and visualizes the process of mass balance model calibration in the context of the full modeling chain. Calibration of the mass balance was carried out in two steps. In the first step, albedo of ice, firn and snow (αs, αf, αi) and constants of the longwave radiation balance and turbulent exchange (C0 and C1) were tuned to match observed point data of the three mass balance glaciers: No. 354, Sary-Tor and Batysh-Sook (Figure 3). Albedo values were used as principal adjustment parameter to fit the melt model to the ablation stake readings of the three glaciers and were compared to in situ albedo measurements and satellite derived albedo maps (Petrakov et al., 2019; Barandun et al., 2021). The resulting longwave radiation constants used in the calculation were C0 = −56 and C1 = 13. We obtain a coefficient of determination of 0.75 between modelled and observed mass balance with a slight positive bias for the most negative mass balances (Figure 3). The tuned parameters were then held constant during the next calibration step when precipitation was iteratively adjusted to match geodetic glacier mass balance from Barandun et al. (2021) and in actual calculation. Depending on the surface characteristics (snow, firn or ice) three different constant values for the surface albedo are calibrated in the first step to be used in the model: αs = 0.78; αf = 0.5 and αi = 0.22.
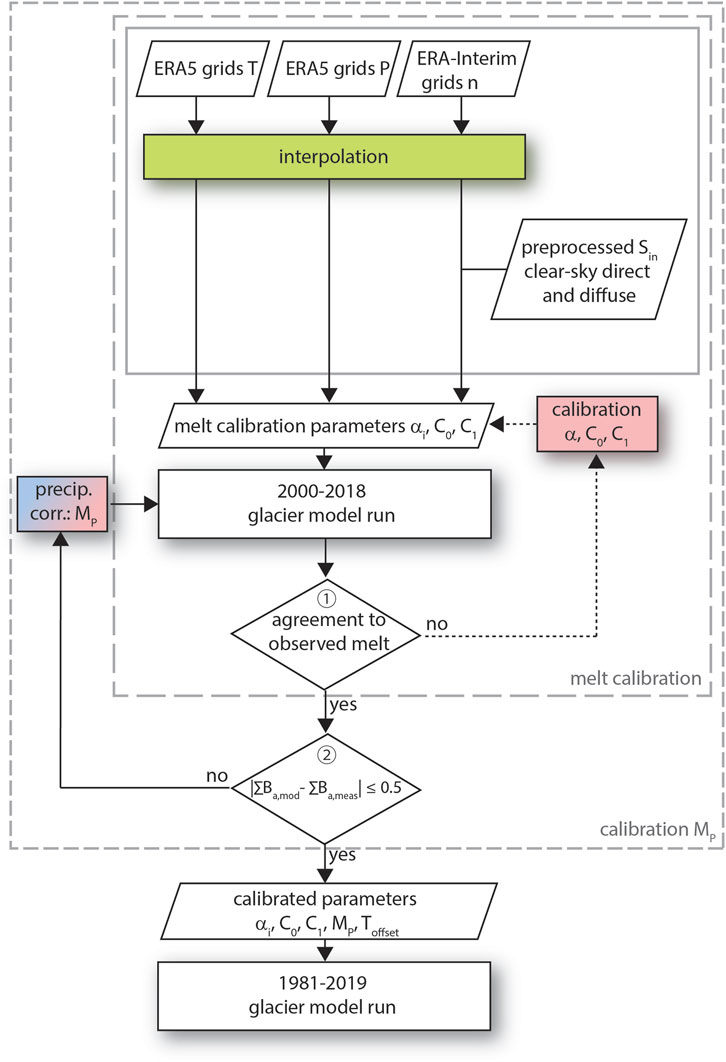
FIGURE 2. Flowchart of the modeling process. Steps related to the simple downscaling-approach are highlighted in light-green and mass balance model calibration in light-red. Arrows with dotted lines denote manual steps. Note that the conditions 1–2 are first tested for ∑Ba,mod = ∑Ba,measintermediate, where Ba is the annual mass balance. Calibrated values α, C0 and C1 are then used in the calibration phase to ∑Ba,mod = ∑Ba,meas maximum and ∑Ba minmod minimum where the conditional steps (1) and (2) are omitted.
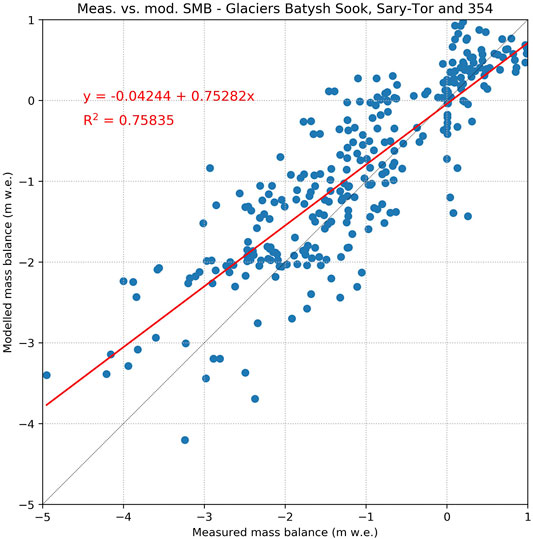
FIGURE 3. Comparison of modelled and observed point measurements for the glaciers Sary-Tor, Batysh-Sook and Glacier 354.
We iteratively adjust precipitation to match geodetic glacier mass balance from Barandun et al. (2021) to account for uncertainties in the ERA5-Land precipitation. We calculated two scenarios using upper and lower error estimates from the geodetic mass balance to account for the model uncertainties. Furthermore, measuring snow accumulation on glaciers is challenging and subject to large uncertainties. Hence, we callibrate this least known parameter of the glacier surface mass balance (Machguth et al., 2013). We allow for a dynamical scaling of P with a model calibration parameter MP for each glacier (Figure 2). MP is determined through iterative runs, reducing the offset in modelled and observed geodetic mass balance below a threshold value of 0.25 m w.e.
4.4 Glacier Retreat Modelling
Glacier bed topography is derived from modeled ice thickness. The chosen approach is based on the perfect plasticity assumption (Cuffey and Paterson, 2010) and is described in full detail in Linsbauer et al. (2012); Frey et al. (2014). Ice thickness is estimated at points along major central branch lines using an approach by Haeberli and Hoelzle (1995). The ice thickness (h) at every individual point is derived from the zonal surface slope (surface slope around each point averaged over a 50 m elevation range along the branch lines) according to:
where f = shape factor (0.8), ρi = ice density (900 kg m−3) and g = acceleration due to gravity (9.81 ms−2). Hence, estimated ice thickness is a function of surface slope. From the estimated point values, ice thickness is interpolated to the entire glacier surface and bed topography is calculated by subtracting the distributed ice thickness from the surface DEM (Linsbauer et al., 2012; Frey et al., 2014).
Glacier retreat is simulated based on a Δh glacier retreat approach following Huss et al. (2010). Glacier surface elevation change originating from ice dynamics and surface mass balance is parameterized by distributing volume gain or loss (resulting from the surface mass balance) over the entire glacier surface according to altitude-dependent functions. These Δh functions are derived from previously observed changes in glacier thickness that incorporate both the influence of ice dynamics and surface mass balance. Glacierized grid cells become ice-free when their elevation falls below the altitude of the glacier bed. The Δh approach is mass-conserving with respect to the surface mass balance, i.e. mass loss or gain in the year n is converted into glacier thickness change and the DEM is updated at the onset of the year n + 1. Glacier surface mass balance calculation in the year n + 1 is performed on the updated topography and thus considers the feedback of surface elevation change on mass balance (Machguth et al., 2013). Glacier advance is not possible in the given approach. The only exception is that grid cells, which have already become ice free can still have positive mass balances when annual accumulation in a given year does not fully melt, and the fresh snow in the next year is considered as firn. In this case, the grid cells are again counted as glacier. Given the current warming trend, such “re-advances” in the model are, however, very short-lived.
4.5 Calculation of Glacier Meltwater
Glacier meltwater is the melt of snow, firn and ice over the glacier surface. The glacier surface is adopted annually according to glacier retreat and mass balance. In each year n + 1, the model considers only runoff from grid cells, which were glaciated in the previous year n. While the model always simulates accumulation over the initial glacier surface, melting winter snow on formerly glaciated terrain is not considered as glacier meltwater. Formerly ice-free grid cells that are still snow covered at the end of year n are again considered as a glacier. Consequently, they contribute to runoff in the year n + 1. However, and as also noted above, this effect is short-lived (Machguth et al., 2013). To provide uncertainties in the meltwater estimation, we calculated two additional scenarios using different reference geodetic mass balances according to the upper and lower uncertainty estimates by Barandun et al. (2021).
4.6 Discharge Analysis
We analyze the discharge time series of the Small and Big Naryn catchments to test if the amount of runoff and seasonality have undergone significant changes, and if such changes are related to the modelled evolution of glacier mass balance. We use the non-parametric statistical method by Pohl et al. (2020) that compares data distributions of a defined reference period with the distributions of different target periods. The reference period is manually defined as a time period at the beginning of the available time series in which there are sufficient data points to generate a probability density function using a Kernel Density Estimator (KDE). The target periods are defined by each year after the reference period is over, extended by a window of some years. In our case this corresponds to target periods starting between 1952 and 1970 with window sizes between 15 and 29 years, both with increments of 2 years. Finally, a dissimilarity of the reference and target distribution with values ranging between 0 (same distribution and complete overlap) and 1 (complete emergence of the signal) is calculated using the Hellinger Distance metric (Hellinger, 1909; Pohl et al., 2020). Because the choice of reference period and the window widths around the target years can impact the results, we test various combinations of these meta-parameters. The calculated deviations of the target data distribution from the reference period are presented as time series of emergence. Additionally, the sign of change (towards lower or higher values) is displayed alongside. A statistically significant change, as determined using a Kolmogorov-Smirnov test, occurred at emergence levels of around ≥0.3 to 0.4 for a study with temperature and precipitation time-series (Pohl et al., 2020). We will use this emergence level range in this study to refer to significant changes.
In order to validate modelled glacier runoff and identify possible meteorological causes for differences between catchment-wide discharge, we incorporate monthly snow cover data that provide an independent data source from the utilized meteorological forcing dataset ERA5. For this we use monthly snow cover data from the Moderate Resolution Imaging Spectroradiometer (MODIS) dataset MOD10CM version 6 (Hall et al., 2016). The dataset provides independent qualitative indications of snow precipitation events. MOD10CM is generated from Normalized Difference Snow Index (NDSI), utilizing the differences in reflectance in the visible (high reflectance) and shortwave infrared (low reflectance) of snow-covered land detected by MODIS. It provides the difference in relative terms in the range of 0–100%. MOD10CM provides monthly averages for 0.05° × 0.05° (approx. 5 km) cells of daily maximum snow cover extent. The dataset is filtered to only utilize clear surface views and remove likely erroneous snow detection.
We first calculate monthly snow cover anomalies as deviation from the multi-annual monthly means. From these anomalies we calculate cumulative sums. The display of cumulative instead of individual monthly anomalies facilitates the identification of long and short-term periods of snow cover build-up and melting phases in a temporal context. The cumulative anomalies are calculated for 100 m elevation bands to showcase if snow accumulation anomalies occurred preferably in the lowlands or on the glaciers.
5 Results
5.1 Modelled Mass Balance and Glacier Retreat
Modelling results indicate an overall shrinkage of the glaciers in both catchments (Figure 4). Our results indicate a decrease in ice volume for both catchments by −15% for the time period 1982–2019. Total glacier ice volume in the Big Naryn catchment declined from 32.8 to 27.7 km3 (−15%), and from 14.1 to 12.4 km3 (−12%) in the Small Naryn catchment. Over the calculation period the glaciers lost more than 6.7 km3 of ice and more than 55 km2 of its extent. Modelling suggests an overall linear volume loss over the modelling period (Figure 4).
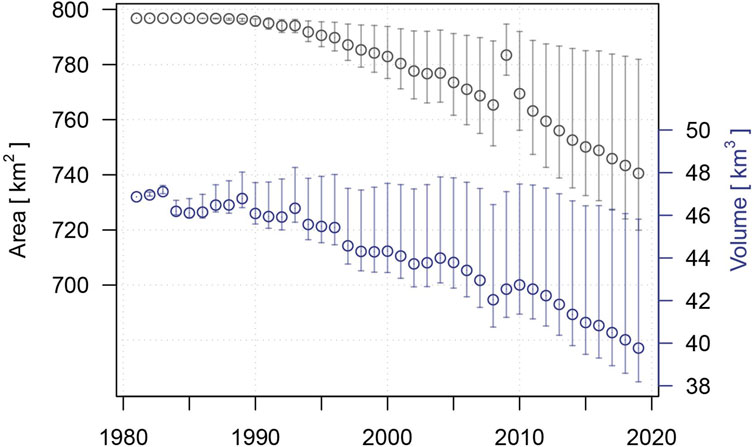
FIGURE 4. Modelled glacier volume and area change for the study area. Besides the glacier ice, the model includes into glacier area also snow, if it does not melt during the ablation season (turns into firn) of the consecutive year and if it occupies the formerly glaciated area. Uncertainty was calculated from two additional scenarios using different reference geodetic mass balances according to the upper and lower uncertainty estimates by Barandun et al. (2021). The strong increase of the glacier area in 2009, is caused by the frequent summer snowfall not melting as it is considered as firn in the model.
The comparison of the modelling results to the measured glacier area according to Consortium (2017) (representing mostly glacier extent around the year 2002, i.e. about 20 years after the initialization of the glacier retreat parametrization) suggest a slightly higher area of 777.6 km2 than the measured 775.4 km2. This overestimation of the glacier area by less than 1% stems from two factors: the calculated initial glacier thickness might have been slightly overestimated resulting in a slower glacier retreat. Secondly, the model setup assumes steady state of the initial glacier conditions, which might not be the case, resulting in a faster glacier retreat. The 1% difference in glacier area, however, does not change the simulated glacier meltwater contribution to the streamflow significantly.
The average glacier-wide mean annual mass balance for the calculation period is −0.20±−0.13 m w.e. Modelled mass losses show the same trends in both catchments, with a slightly more negative mass balance on average calculated for the Small Naryn catchment (Figure 5). Calculated winter balance for Big Naryn catchment glaciers is lower in all years as compared to Small Naryn. In general, the modelling results show good agreement with the observed mass balance of Tuyuksu glacier (Zemp et al., 2020) (Figure 5). Particularly, a good agreement can be observed for the most negative years (Figure 6). The cumulative winter mass balance stayed more or less constant for the whole calculation period, while summer balance displayed a wide range of variability (Figure 6).
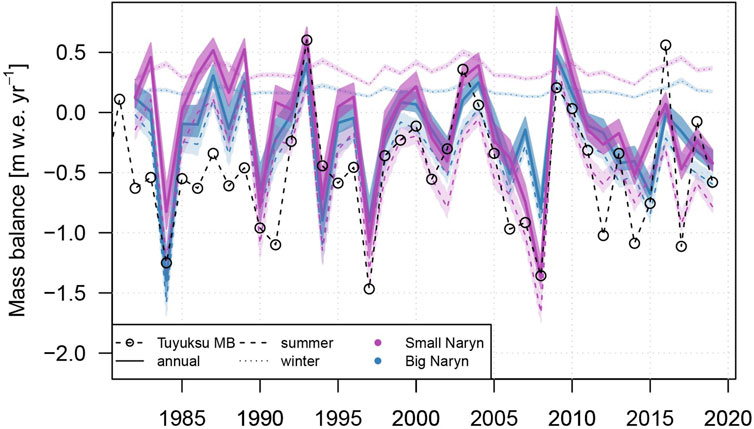
FIGURE 5. Calculated seasonal and annual mass balance for glaciers in the Small and Big Naryn catchments. Long-term observed mass balance series from the Tuyuksu glacier is plotted for comparison (circles).
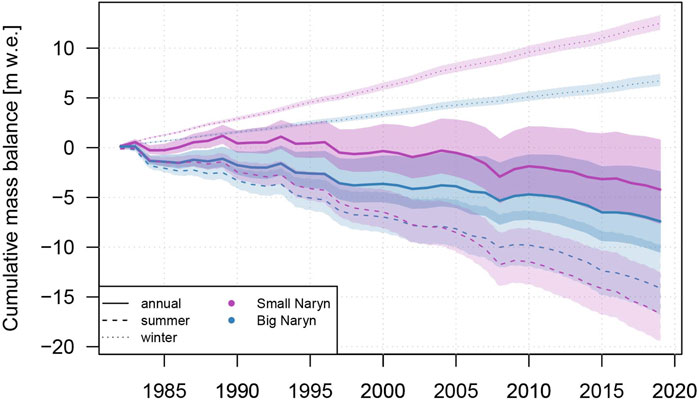
FIGURE 6. Calculated cumulative seasonal and annual mass balance for glaciers in the Small and Big Naryn catchments.
5.2 Streamflow Analysis
An analysis at the annual level did not show any distinguishable trends (not shown). The results for the seasonal (Spring: MAM; Summer: JJA; Autumn: SON; Winter: DJF) runoff trend analysis for the time period of 1942–2017 for the three runoff gauges using the Hellinger distance metric is shown in Figure 7. In the seasonal analysis statistically significant changes exist considering a Hellinger distance of ≥0.3 (see Section 4.6). The choice of different reference periods and windows widths show a low impact on derived Hellinger distances except for some combinations in spring and autumn (up to 20% differences), which indicates that some extreme years have a leverage effect here.
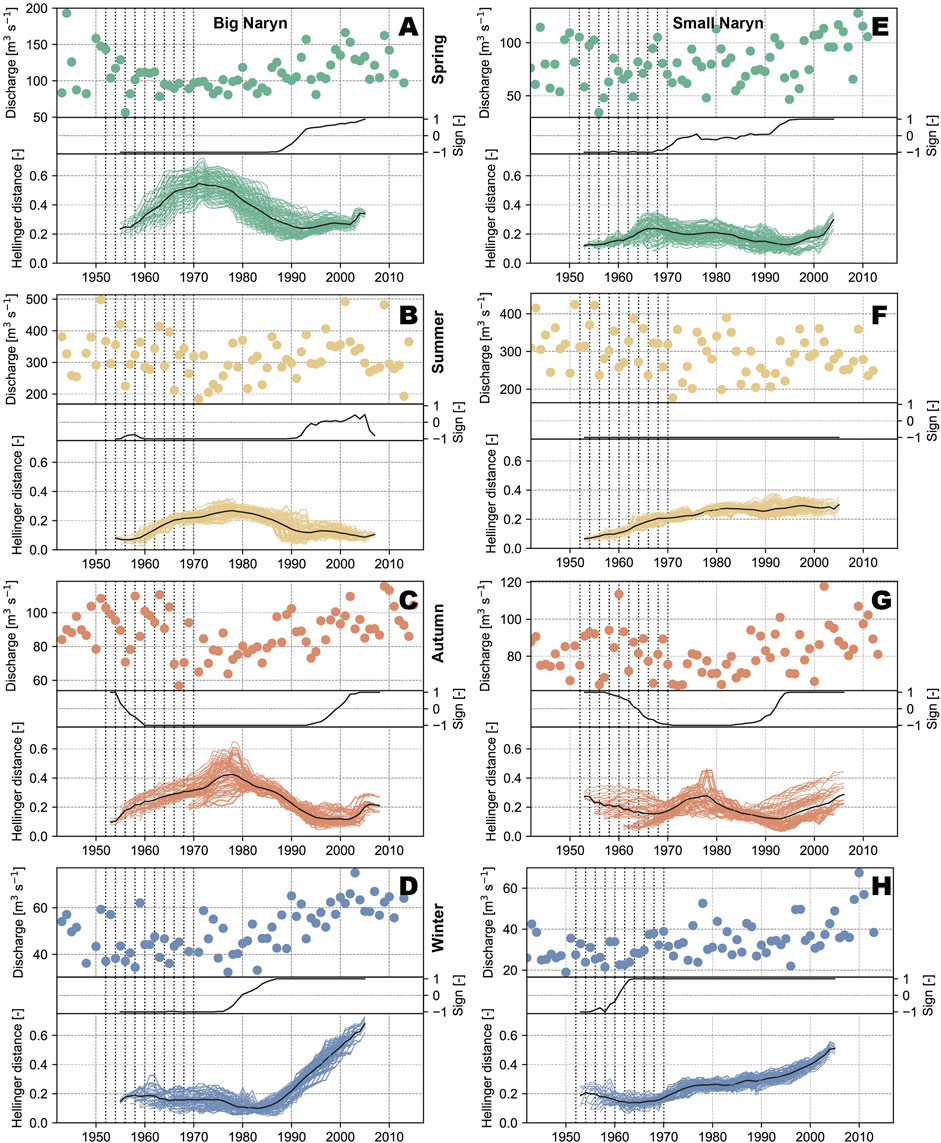
FIGURE 7. Analysis of the mean monthly runoff aggregated into spring (A,E), summer (B,F), autumn (C,G) and winter (D,H) seasons based on Hellinger distance after Pohl et al. (2020), for the Big (left) and Small Naryn (right) catchments. Dashed vertical lines are the years to split the time series into reference and target periods (see Section 4.6). Individual upper graphs show seasonally aggregated discharge data. Middle graphs show the sign of change for each derived Hellinger time series plotted in the bottom graphs (negative–decreasing, positive–increasing). Lower graphs show Hellinger distances with different window widths and reference period end points (one line per combination) and in black the mean of all these combinations.
For both catchments, runoff strongly increased in winter in the past two decades with a sharper starting point between 1980 and 1990 for Big Naryn compared to a more gradually increase starting already around 1970 for Small Naryn (Figures 7D,H). In autumn both catchments show lower discharge with respect to the reference periods that are earlier than our modelling start (Figures 7C,G). The strongest deviation from the reference period occurs around 1970 to 1990. A strong increase in discharge values afterwards results in Hellinger distances similar to those in the reference period, which is characterised by higher discharge than the modelling start in 1981. The summer season shows a low signal emergence from the reference periods (Figures 7B,F). An increase in the Hellinger distance around 1970 to 1990 for the Big Naryn and a gradual increase already in the 1960’s to 1970’s in the Small Naryn result from more negative discharge. Only for the Big Naryn an increase towards the level of the reference period is apparent after 1990.
Similar to the lowest discharge phase for autumn, in summer the most significant emergence from the reference occurred between 1970 and 1990 for Big Naryn. For the Small Naryn, the early reference period is characterised by very high discharge values and a lot of variability. Later values, despite higher low flow years (Figure 7F) than in the 1970 to 1990 period do not result in a return to the reference distributions, nor show an increase in the sign of change. The spring discharge emergence resembles the decrease observed for autumn for the Big Naryn but with an earlier minimum around 1970 (Figure 7A). The sign changes to positive after 1985 to 1995. The Small Naryn does not show the strong significant decrease in the 1970–1980 period but more positive values and a Hellinger distance just reaching the 0.3 level at the end of the observation period (Figure 7). It has to be noted that the period of the runoff analysis does not overlap completely with the simulation period, therefore comparison of both results can be performed only partially.
Modelled glacier melt over the simulation period shows a tendency towards more melt although these trends are not significant at the 0.05 significance level (Figure 8). However, the comparison of the two catchments shows strong differences (Figure 8). Glacier melt contribution to the annual runoff of the Big Naryn catchment is on average 750 ± 69 mm. The annual variation is rather high and ranges between 129 ± 19 mm and 1654 ± 137 mm. This corresponds between 4 and 51% (23% on average) to the total annual river runoff of the catchment. Small Naryn catchment glacier melt contributes to the total annual river runoff on average by 952 ± 58 mm with similar high variation: between 233 ± 19 mm and 1929 ± 56 mm, or 6–45% (23% on average). Glaciers of both catchments contribute to the total Naryn river runoff between 5 and 45% (23% on average). The ratio of glacier melt to total river discharge in Big Naryn catchment does not significantly increase over time (Figures 8A,B) while in Small Naryn catchment an increase in summer runoff can be observed (Figures 8C,D). The increase is most pronounced in August and September, even though not significant at the 0.05 significance level (Figure 8). The comparison between observed streamflow and modelled glacier melt, aggregated to mean monthly values for June to September, suggests that glacier melt contributes between 7 and 69% (32% on average) to the runoff for the same period (Figure 8).
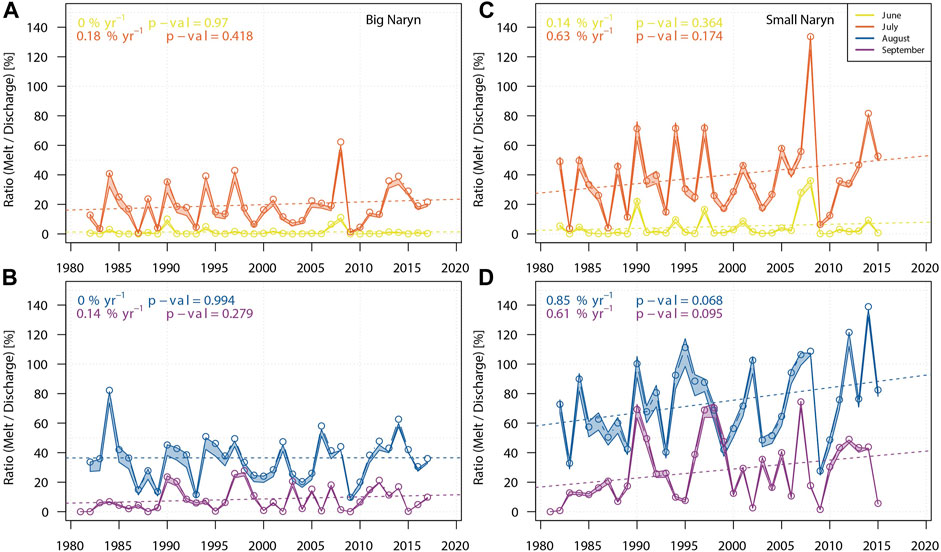
FIGURE 8. Mean measured runoff and modelled glacier melt comparison for (A) June and July, (B) August and September for the Small Naryn and (C) June and July, (D) August and September for Big Naryn catchments.
5.3 Snow Cover Analysis
The cumulative monthly snow cover anomalies using the full 2000 to 2020 period available from the dataset as a reference for the snow evolution are displayed in Figure 9 and Figure 10. The strong negative anomalies in late 2007 (falling limbs in the graphs) for all but the highest permanently snow covered elevation bands indicate a lack of snow precipitation. This deficit corresponds to the most negative mass balance in 2008 for both catchments (Figure 5). The early negative anomalies for 2014 indicate an earlier onset in snow melt. The continuing falling limbs throughout the year to the beginning of 2015 indicate also a weaker snow build-up phase for 2015. The year 2014 marks again a strong negative mass balance year for both catchments. The 2015 mass balance is, however, only strongly negative for the Big Naryn (see Figure 5). The only noticeable difference in the snow anomalies between the catchments is a weaker build-up phase for the Big Naryn above 4000 m.
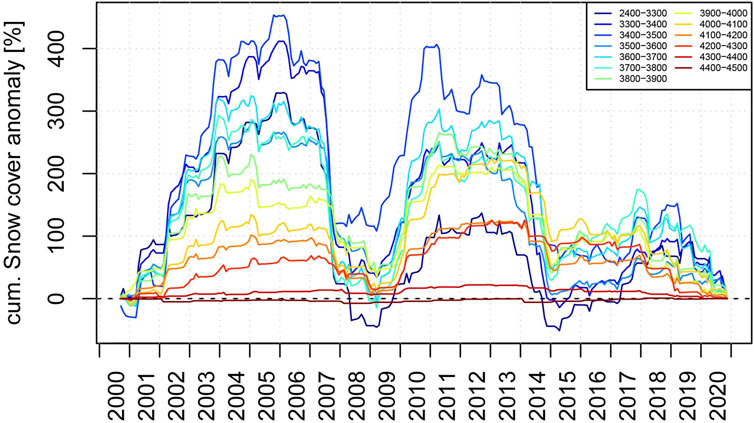
FIGURE 9. MOD10CM-derived cumulative monthly snow cover anomalies for the period 2000–2020 for different elevation bands for the Big Naryn catchment. Periods with weak (2007 and 2014) or strong (2009 and 2010) snowcover buildup are evident.
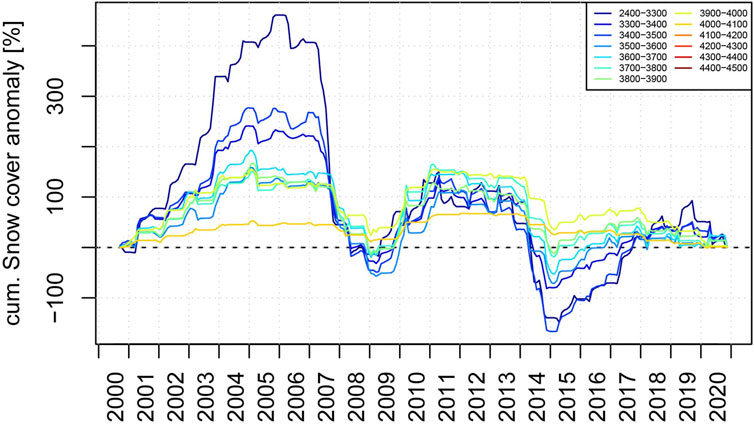
FIGURE 10. Same as Figure 9 but for the Small Naryn catchment. Weaker positive anomalies in 2009 and 2010 compared to the Big Naryn catchment are evident.
On the other hand, strong positive snow cover anomalies in 2003 and 2009 towards the end of the year correspond to more positive mass balances. However, positive snow cover anomalies as in 2002 do not correspond with positive mass balances. While the presented snow cover anomalies do to some extent provide a proxy for the accumulation and melting processes they do not indicate quantities of precipitation or possible rain events during the summer that strongly affect the mass balance (Kronenberg et al., 2016).
6 Discussion
6.1 Seasonal Patterns or Streamflow and Melt Seasonality
Statistical analysis of modelled melt rates suggests a tendency towards increased summer melt for the Small Naryn, whereas no such tendency is visible for the Big Naryn (Figure 8). The linear regression analysis is not significant at a significance level of 0.05 with p-values of 0.174 (July), 0.068 (August), and 0.095 (September) for the Small Naryn. Likewise, no significant trend in the evolution of measured summer discharge was found (Figure 7). However, the performed streamflow analysis using the Hellinger distance was performed over the entire observation time period to have sufficient data points, and, as pointed out in Section 5.2, the actual discharge data shows that in autumn and summer the start of our modelling period falls into a period of rather strong deviation from the early reference periods. The lowest summer discharge values fall into the 1970 to 1990 period for both catchments with a notable increase afterwards for the Naryn catchment.
A similar pattern is present in the autumn streamflow analysis. As there is only little melt happening in the model in September, it might be possible that because we do not account for retardation of meltwater, some portions of August melt should be accounted for as autumn melt. This would align more with the clearer increase in observed discharge after 1990, where the Hellinger distance suggests that this constitutes a discharge distribution similar to the early reference periods (Figure 7). Indications for why a general increase in July to September streamflow is occurring are a growing number of days with temperatures exceeding the melting threshold. This assumption is supported by a general increase in temperatures (Kriegel et al., 2013).
Streamflow analysis also reveals a significant positive trend in winter runoff and partly in the spring months for both catchments, although the absolute changes in monthly discharge of a few cubic meters per second are very small. As there is no glacier melt during this time, this increase is probably driven by an increase of the melt season in autumn, which would positively influence the baseflow during the winter months. Similar positive trends in winter has been reported by Kriegel et al. (2013) for Small and Big Naryn and Shahgedanova et al. (2018) for several catchments in the northern Tien Shan. It has to be noted that the increasing trends in spring, autumn and especially in winter have very little effect on the total runoff amount, as summer makes up more than half of the total runoff in both catchments. Both catchments experienced a reduction in streamflow during the 1970’s and 1980’s, which is also reflected in the modeled mass balances. The Tien Shan weather station data suggest that this period was cooler resulting in a reduction of streamflow in spring and autumn.
Snow cover analysis is only covering the last two decades and we cannot identify a particular trend. Dietz et al. (2013) have shown that since 1985 snow cover fraction in winter has mostly increased although with a later onset of snow cover buildup and earlier melting onset for most regions of the Syr-Darya and Amu-Darya catchments.
Glacier melt simulations for High Mountain Asia are sparse, limiting our understanding of the future impact of glacier retreat on river runoff and its implications to water resources management. Luo et al. (2018) calculated changes in streamflow, induced by glacier melt for 10 catchments across Tien Shan, Pamir and North Karakorum. For Syr-Darya basin they report around 13% contribution of the glacier melt for the time period 1966–1995. Several studies on runoff in eastern Tien Shan and Tibet report runoff increases since the late 1990 (Casassa et al., 2009) attributing it to increased precipitation and enhanced glacier melt. They conclude that in Central Asia the critical point of severe glacier wastage with associated glacier melt reduction has not yet been attained. This finding is supported by Huss and Hock (2018); Rounce et al. (2020), suggesting that for most catchments peak water in Tien Shan will be reached in several decades. Chen et al. (2019) used end-member modelling analysis to show that during the glacier melt period, glacier contributed 12–59% of total runoff in the northern and eastern Tien Shan Mountains. Shahgedanova et al. (2020) modelled future glacier retreat and associated changes in glacier melt in 4 catchments in the Kazakh northern Tien Shan. They predict that summer discharge will decline in catchments with low glacierization and no significant changes are projected for catchments with high glacierization. The reduction of the runoff in catchments with low glacierization is attributed to earlier disappearance of snow cover, while for catchments with high degree of glacierization this effect is projected to be compensated by the enhanced glacier melt.
Our results suggest heterogeneous glacier response, mainly governed by the altitude of the glaciers. The median glacier altitudes in the Small Naryn catchment is 4093 m a.s.l. compared to 4248 m a.s.l. in the Big Naryn catchment (Consortium, 2017) (Figure 8). Therefore, the increase in summer discharge for the Small Naryn catchment is likely caused by the increase in glacier melt. This is supported by the observed increasing trends in summer temperatures (Kriegel et al., 2013). Modelling results for the Small Naryn catchment normalized by glacier area show a statistically significant increase in the summer melt (with p value of 0.057) (Figure 11) even though separate monthly glacier melt does not show any increasing trends. Modelling results for the Big Naryn catchment suggest no significant trend of glacier melt for the calculation period, as well as no significant trends can be observed in the normalized data set (Figure 12). This difference between two close-by catchments suggests that the expected peak flow in the Naryn catchment will probably be less pronounced and more extended in time than suggested by the current projections (Huss and Hock, 2018; Rounce et al., 2020, e.g.) and highlights the necessity for future runoff changes assessments on catchment level.
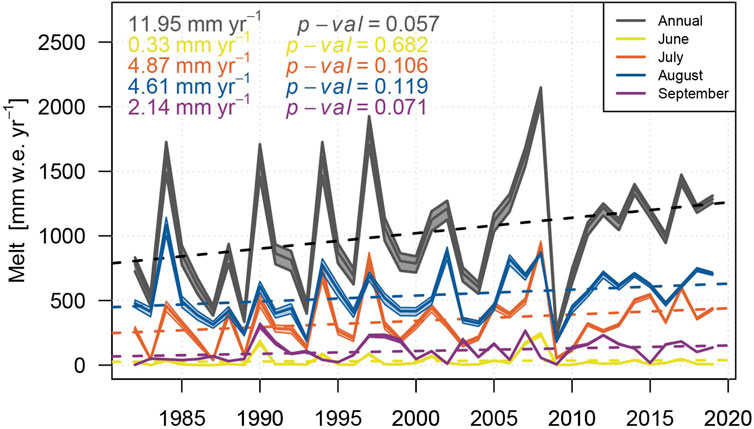
FIGURE 11. Modelled glacier melt in the Small Naryn catchment normalized by glacier area (plain lines) and linear trends (dashed lines).
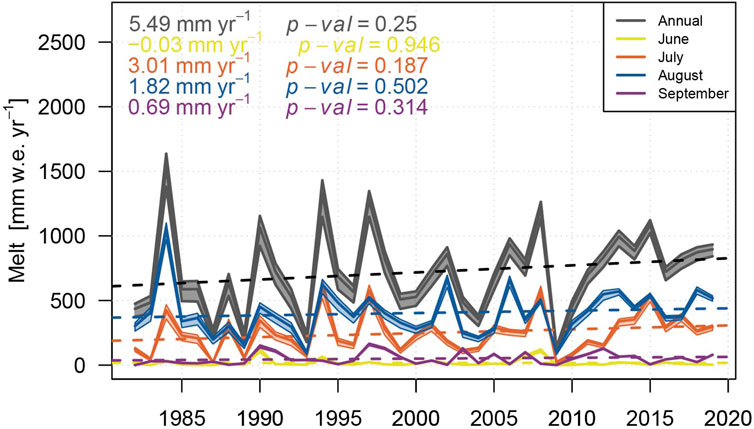
FIGURE 12. Modelled glacier melt in the Big Naryn catchment normalized by glacier area (plain lines) and linear trends (dashed lines).
6.2 Uncertainty of the Modelling Results
A direct comparison of calculated melt and observed runoff is not feasible because of additional runoff sources like precipitation and groundwater discharge as well as the influence of evaporation. Precipitation and groundwater discharge are of high importance for water balance in Central Asia (Aizen et al., 1995). Precipitation distribution in mountainous areas is a well-known problem for gridded climatic data sets. In the current approach this is addressed by calibrating precipitation for each individual glacier(cf. Hersbach et al., 2020).
For both catchments glaciers with less than 1 km2 in size cover a combined area of approximately 266 km2 compared to a combined area of approximately 509 km2 for glaciers larger than 1 km2 according to Consortium (2017). The contribution of the smaller than 1 km2 glacier to the overall glacier melt is approximately 43% therefore any specific parametrization for these glaciers may affect the total result.
The model calibration relies strongly on the glacier point data used for model calibration. Stake readings and snow pit data are subject to random and systematic errors (as described in detail in Elsberg et al. (2001) and Thibert and Vincent (2009)), nevertheless the fit between the model and the data is satisfactory, as the model qualitatively clearly represents the whole elevation range of mass balance. Similarly, we cannot rule out errors in the runoff measurements to which modelled glacier melt is compared.
In the Big Naryn catchment the glacier meltwater contribution greatly exceeds the observed runoff in 1984, and narrowly exceeds the observed runoff in 2006. In the Small Naryn catchment, melt contribution exceeds the observed runoff in three simulated years. All of these maxima correspond to years with the most negative annual mass balance. The glacier melt values exceeding the observed runoff could be partly explained through a retardation of meltwater in the hydrological system by means of groundwater replenishment and other storage effects, which are not taken into account. The reason for the extreme meltwater production in the year 1984 in the Big Naryn catchment is not entirely clear, and could be due to errors in runoff data, as this is the only year where runoff in Big Naryn catchment in July and August is lower than in the Small Naryn catchment. The increase in meltwater contribution to runoff in Small Naryn is most pronounced in July, August and September, while no change in melt ratio can be observed for the Big Naryn catchment (8). The observed increasing trend in Small Naryn catchment could also be due to systematic errors in runoff measurements, but 1) there is no trend observed in June and 2) runoff observations in Small Naryn gauging station and Naryn city gauging station also suggest increasing trend in summer runoff , while no trend was observed for Big Naryn gauging station observations (7).
7 Conclusion
The modelling of all glaciers of the upper Naryn catchment suggests an overall negative glacier mass balance since 1996 induced by an increase in summer temperatures in the study area. From 1977 to present, the glaciers lost 7.1 km3 or 15% in volume and 56.2 km2 (9%) of their initial surface area. Runoff analysis of three runoff gauges suggest an increase in runoff in winter since the early 1990’s in both catchments. In the Small Naryn catchment, there is also a slight increase in summer and autumn runoff. In the Small Naryn catchment, glacier meltwater contributing to the discharge shows an increasing trend, while no trends are observed for the Big Naryn catchment, but the melt intensity of the shrinking glaciers is increasing. Supported by data from the Tien Shan weather station, it seems probable that increasing precipitation and temperatures can explain the observed changes in runoff. Increased but shorter duration snow cover leads to overall more river runoff that is furthermore less concentrated in the summer months but extends further into the cold seasons. Simple analysis of short time series suggests more frequent anomalous (as compared to normalized) precipitation in the last decades. Overall, the modelling suggests that glaciers contribute around 23% to the total annual runoff and 32% to summer runoff. However, the variability from year to year is strong, ranging from 7 to 69% of total summer runoff. Despite their close vicinity, the Small and Big Naryn catchments show a different evolution in river runoff and glacier melt contribution over time. In the Big Naryn these two variables change little over time, but in the Small Naryn catchment a significant increase in glacier melt and meltwater contribution to runoff occurs. The results highlight the strong regional variability in glacier-climate interactions in Central Asia.
Data Availability Statement
KH 9 Hexagon satellite images can be accessed here: https://www.usgs.gov/centers/eros/science/usgs-eros-archive-declassified-data-declassified-satellite-imagery-2. ERA5 Reanalysis data is available at: https://https://cds.climate.copernicus.eu/cdsapp#!/dataset/reanalysis-era5-land?tab=form. ERA-Interim Reanalysis data is available at: https://apps.ecmwf.int/datasets/data/interim-full-daily/. Landsat imagery and SRTM is available at: https://earthexplorer.usgs.gov/. ASTER imagery is available at: https://earthdata.nasa.gov/. MODIS MOD10CM data is available at: https://nsidc.org/data/mod10cm. Detailed discharge data for the Gunt catchment is available from the Tajik Hydromet http://www.meteo.tj/ upon request, discharge for the Naryn is available from the Kyrgyz Hydromet http://meteo.kg upon request. Daily glacier runoff data is available in supplementary information.
Author Contributions
TS and EP share first authorship of the manuscript, HM provided necessary modelling tools as well as largely contributed to the manuscript text, AD provided KH-9 Hexagon orthophotos as well as DEM’s and contributed to the manuscript text, MB provided necessary data for model calibration and validation as well as contributed to the manuscript text, RK contributed to the manuscript text, OK provided necessary validation data as well as contributed to the manuscript text, MH contributed to the manuscript text.
Funding
This work was funded by the project CICADA (Cryospheric Climate Services for improved Adaptation), contract no. 81049674 between Swiss Agency for Development and Cooperation and the University of Fribourg.
Conflict of Interest
The authors declare that the research was conducted in the absence of any commercial or financial relationships that could be construed as a potential conflict of interest.
Publisher’s Note
All claims expressed in this article are solely those of the authors and do not necessarily represent those of their affiliated organizations, or those of the publisher, the editors and the reviewers. Any product that may be evaluated in this article, or claim that may be made by its manufacturer, is not guaranteed or endorsed by the publisher.
Acknowledgments
We thank the project CICADA (Cryospheric Climate Services for improved Adaptation), with contract no. 81049674 between Swiss Agency for Development and Cooperation and the University of Fribourg. The CAWa (Central Asian Water) project (http://www.cawa-project.net) was supported by the German Federal Foreign Office (contract no. AA7090002) as a part of the “Berlin Process”. This work was carried out with the support of the CAWa (“Central Asia Water”) project (contract no. AA7090002) funded by the German Federal Ministry of Foreign Affairs as part of the “Berlin Process”. This study is supported by Snowline4DailyWater. The project Snowline4DailyWater has received funding from the Autonomous Province of Bozen/Bolzano–Department for Innovation, Research and University in the frame of the Seal of Excellence Programme. The authors are grateful to Agency of Hydrometeorology under the Ministry of Emergency Situations of the Kyrgyz Republic (KyrgyzHydromet) for the provision of data.
Supplementary Material
The Supplementary Material for this article can be found online at: https://www.frontiersin.org/articles/10.3389/fenvs.2021.780466/full#supplementary-material
References
Aizen, V. B., Aizen, E. M., and Melack, J. M. (1995). Climate, Snow Cover, Glaciers, and Runoff in the Tien Shan, central Asia. JAWRA J. Am. Water Resour. Assoc. 31. doi:10.1111/j.1752-1688.1995.tb03426.x
Aizen, V. B., Kuzmichenok, V. A., Surazakov, A. B., and Aizen, E. M. (2007). Glacier Changes in the Tien Shan as Determined from Topographic and Remotely Sensed Data. Glob. Planet. Change 56. doi:10.1016/j.gloplacha.2006.07.016
Berrisford, P., Dee, D. P., Poli, P., Brugge, R., Fielding, M., Fuentes, M., et al. (2011). The Era-Interim Archive - Version.
Armstrong, R. L. (2010). The Glaciers of the Hindu Kush-Himalayan Region: A Summary of the Science Regarding Glacier Melt/Retreat in the Himalayan, Hindu Kush, Karakoram, Pamir, and Tien Shan Mountian Ranges. ICIMOD.
Barandun, M., Pohl, E., Naegeli, K., McNabb, R., Huss, M., Berthier, E., et al. (2021). Hot Spots of Glacier Mass Balance Variability in central Asia. Geophys. Res. Lett. 48, 84. doi:10.1029/2020GL092084
Brun, F., Berthier, E., Wagnon, P., Kääb, A., and Treichler, D. (2017). A Spatially Resolved Estimate of High Mountain Asia Glacier Mass Balances from 2000 to 2016. Nat. Geosci. 10. doi:10.1038/ngeo2999
Casassa, G., López, P., Pouyaud, B., and Escobar, F. (2009). Detection of Changes in Glacial Run-Off in alpine Basins: Examples from north america, the Alps, central Asia and the andes. Hydrological Process. 23, 7194. doi:10.1002/hyp.7194
Chen, H., Chen, Y., Li, W., and Li, Z. (2019). Quantifying the Contributions of Snow/glacier Meltwater to River Runoff in the Tianshan Mountains, central Asia. Glob. Planet. Change 174. doi:10.1016/j.gloplacha.2019.01.002
Chen, Y., Li, W., Deng, H., Fang, G., and Li, Z. (2016). Changes in central Asia’s Water tower: Past, Present and Future. Scientific Rep. 6, 458. doi:10.1038/srep35458
Consortium, R. (2017). “Randolph Glacier Inventory – a Dataset of Global Glacier Outlines: Version 6.0 Glims Technical Report Rgi,” in Global Land Ice Measurements from Space (Colorado, USA: Digital Media), 4.
Corripio, J. G. (2003). Vectorial Algebra Algorithms for Calculating Terrain Parameters from Dems and Solar Radiation Modelling in Mountainous Terrain. Int. J. Geographical Inf. Sci. 17, 744. doi:10.1080/713811744
Dee, D. P., Uppala, S. M., Simmons, A. J., Berrisford, P., Poli, P., Kobayashi, S., et al. (2011). The Era-Interim Reanalysis: Configuration and Performance of the Data Assimilation System. Q. J. R. Meteorol. Soc. 137. doi:10.1002/qj.828
Dehecq, A., Gardner, A. S., Alexandrov, O., McMichael, S., Hugonnet, R., Shean, D., et al. (2020). Automated Processing of Declassified Kh-9 Hexagon Satellite Images for Global Elevation Change Analysis since the 1970s. Front. Earth Sci. 8, 802. doi:10.3389/feart.2020.566802
Dietz, A. J., Kuenzer, C., and Conrad, C. (2013). Snow-cover Variability in central Asia between 2000 and 2011 Derived from Improved Modis Daily Snow-Cover Products. Int. J. Remote Sensing 34. doi:10.1080/01431161.2013.767480
Dikikh, A. N., Sokalskaya, A. M., Dyurgerov, M. B., Racek, I. V., and Sinyuan, Y. (1995). “Lednikovyi stok (Glacier runoff), ” in Oledenenie Tyan-Shanya. (The Glaciers of Tien Shan)Editors M. B. Dyurgerov, and M. Kunakhovich (Moscow: VINITI), 131–168.
Dikikh, A. (1993). Lednikovyi Stok Rek Tyan-Shanya I Ego Rol’ V Formirovanii Obshego Stoka (Glacier Runoff in the Rivers of Tien Shan and its Role in Total Runoff Formation). Materialy Glaciologicheskikh Issledovanii, 41–50.
Dikikh, A., Sokalskaya, A. M., Dyurgerov, M., Racek, I., and Sinyuan, Y. (1995). Oledenenie Tyan-Shanya. The Tien Shan Glaciation.
Duethmann, D., Bolch, T., Farinotti, D., Kriegel, D., Vorogushyn, S., Merz, B., et al. (2015). Attribution of Streamflow Trends in Snow and Glacier Melt-Dominated Catchments of the Tarim River, central Asia. Water Resour. Res. 51, 716. doi:10.1002/2014WR016716
Dyurgerov, M. B., Mikhalenko, V. N., Kunakhovitch, M. G., Ushnurtsev, S. N., Liu, C., and Xie, Z. (1994). On the Cause of Glacier Mass Balance Variations in the Tian Shan Mountains. GeoJournal 33. doi:10.1007/BF00812879
Elsberg, D. H., Harrison, W. D., Echelmeyer, K. A., and Krimmel, R. M. (2001). Quantifying the Effects of Climate and Surface Change on Glacier Mass Balance. J. Glaciology 47, 783. doi:10.3189/172756501781831783
Farinotti, D., Huss, M., Fürst, J. J., Landmann, J., Machguth, H., Maussion, F., et al. (2019). A Consensus Estimate for the Ice Thickness Distribution of All Glaciers on Earth. Nat. Geosci. 12, 168–173. doi:10.1038/s41561-019-0300-3
Frey, H., Machguth, H., Huss, M., Huggel, C., Bajracharya, S., Bolch, T., et al. (2014). Estimating the Volume of Glaciers in the Himalayan-Karakoram Region Using Different Methods. Cryosphere 8, 2014. doi:10.5194/tc-8-2313-2014
Haeberli, W., and Hoelzle, M. (1995). Application of Inventory Data for Estimating Characteristics of and Regional Climate-Change Effects on Mountain Glaciers: a Pilot Study with the European Alps. Ann. Glaciology 21, 834. doi:10.1017/s0260305500015834
Hall, D. K., Salomonson, V. V., and Riggs, G. A. (2016). Modis/terra Snow Cover Daily L3 Global 500m gridNASA National Snow and Ice Data Center Distributed Active Archive Center. version 6. Boulder, Colorado USA.
Hellinger, E. (1909). Neue begründung der theorie quadratischer formen von unendlichvielen veränderlichen. J. die Reine Angew. Mathematik 1909 (136), 210–271. doi:10.1515/crll.1909.136.210
Hersbach, H., Bell, B., Berrisford, P., Hirahara, S., Horányi, A., Muñoz-Sabater, J., et al. (2020). The Era5 Global Reanalysis. Q. J. R. Meteorol. Soc. 146, 803. doi:10.1002/qj.3803
Hoelzle, M., Azisov, E., Barandun, M., Huss, M., Farinotti, D., Gafurov, A., et al. (2017). Re-establishing Glacier Monitoring in kyrgyzstan and uzbekistan, central Asia. Geoscientific Instrumentation, Methods Data Syst. 6, 397–418. doi:10.5194/gi-6-397-2017
Huss, M., and Hock, R. (2018). Global-scale Hydrological Response to Future Glacier Mass Loss. Nat. Clim. Change 8. doi:10.1038/s41558-017-0049-x
Huss, M., Jouvet, G., Farinotti, D., and Bauder, A. (2010). Future High-Mountain Hydrology: A New Parameterization of Glacier Retreat. Hydrol. Earth Syst. Sci. 14. doi:10.5194/hess-14-815-2010
Iqbal, M. (1983). An Introduction to Solar Radiation. 1st Edn, 408. doi:10.1016/b978-0-12-373750-2.x5001-0
Kalashnikova, O., Usubalieb, R., and Alamanov, S. (2020). Changes of Runoff Components on High-Altitude Rivers of Glacial Nutrition of the Tien-Shan Mountain under the Conditions of Global Climate Warming. Sci. New Tech. Innovation Kyrgyzstan, 8–13.(In Russian)
Kaser, G., Großhauser, M., and Marzeion, B. (2010). Contribution Potential of Glaciers to Water Availability in Different Climate Regimes. Proc. Natl. Acad. Sci. United States America 107. doi:10.1073/pnas.1008162107
Khan, V. M., and Holko, L. (2009). Snow Cover Characteristics in the Aral Sea basin from Different Data Sources and Their Relation with River Runoff. J. Mar. Syst. 76. doi:10.1016/j.jmarsys.2008.03.012
Konovalov, V. G., and Shchetinnicov, A. S. (1994). Evolution of Glaciation in the Pamiro-Alai Mountains and its Effect on River Run-Off. J. Glaciology 40. doi:10.1017/S0022143000003920
Kotlyakov, V., Ftlas, L., Varnakova, L., and Rototaeva, O. (1983). Water Resources of Ussr, Catalogue of the Ussr Glaciers.
Kraaijenbrink, P., Bierkens, M. F., Lutz, A. F., and Immerzeel, W. W. (2017). Impact of a Global Temperature Rise of 1.5 Degrees Celsius on Asia’s Glaciers. Nature 549, 878. doi:10.1038/nature23878
Kriegel, D., Mayer, C., Hagg, W., Vorogushyn, S., Duethmann, D., Gafurov, A., et al. (2013). Changes in Glacierisation, Climate and Runoff in the Second Half of the 20th century in the Naryn basin, central Asia. Glob. Planet. Change 110, 51–61. doi:10.1016/j.gloplacha.2013.05.014
Kronenberg, M., Barandun, M., Hoelzle, M., Huss, M., Farinotti, D., Azisov, E., et al. (2016). Mass-balance Reconstruction for Glacier No. 354, Tien Shan, from 2003 to 2014. Ann. Glaciology 57, 92–102. doi:10.3189/2016AoG71A032
Linsbauer, A., Paul, F., and Haeberli, W. (2012). Modeling Glacier Thickness Distribution and Bed Topography over Entire Mountain Ranges with Glabtop: Application of a Fast and Robust Approach. J. Geophys. Res. Earth Surf. 117. 2313. doi:10.1029/2011JF002313
Luo, Y., Wang, X., Piao, S., Sun, L., Ciais, P., Zhang, Y., et al. (2018). Contrasting Streamflow Regimes Induced by Melting Glaciers across the Tien Shan – Pamir – north Karakoram. Scientific Rep. 8, 2. doi:10.1038/s41598-018-34829-2
Machguth, H., Paul, F., Kotlarski, S., and Hoelzle, M. (2009). Calculating Distributed Glacier Mass Balance for the Swiss Alps from Regional Climate Model Output: A Methodical Description and Interpretation of the Results. J. Geophys. Res. 114, 19. doi:10.1029/2009jd011775
Machguth, H., Rastner, P., Bolch, T., Mölg, N., Sørensen, L. S., Aalgeirsdottir, G., et al. (2013). The Future Sea-Level Rise Contribution of greenland’s Glaciers and Ice Caps. Environ. Res. Lett. 8, 15. doi:10.1088/1748-9326/8/2/025005
Nusser, M. (2019). Cryosphere-fed Irrigation Networks in the Northwestern Himalaya: Precarious Livelihoods and Adaptation Strategies under the Impact of Climate Change. Mountain Res. Develop. 39, 518–520. doi:10.1659/MRD-JOURNAL-D-18-00072.1
Nusser, M. (2017). Socio-hydrology: A New Perspective on Mountain Waterscapes at the Nexus of Natural and Social Processes. Mountain Res. Develop. 37, 518–520. doi:10.1659/MRD-JOURNAL-D-17-00101.1
Oerlemans, J. (2001). Glaciers and Climate Change: A Meteorologist’s View. Abingdon, Tokyo: Balkema Publisher.
Palazzi, E., Hardenberg, J. V., and Provenzale, A. (2013). Precipitation in the Hindu-Kush Karakoram Himalaya: Observations and Future Scenarios. J. Geophys. Res. Atmospheres 118, 85–100. doi:10.1029/2012JD018697
Parveen, S., Winiger, M., Schmidt, S., and Nüsser, M. (2015). Irrigation in Upper Hunza: Evolution of Socio-Hydrological Interactions in the Karakoram, Northern pakistan. Erdkunde 69, 5. doi:10.3112/erdkunde.2015.01.05
Petrakov, D. A., Tutubalina, O. V., Shpuntova, A. M., Kovalenko, N. V., Usubaliev, R. A., Azisov, E. A., et al. (2019). Assessment of Glacier Albedo in the Ak-Shyirak Mountains (Inner Tien Shan) from Ground-Based and Landsat Data. Earth’s Cryosphere 23, 11–19. doi:10.21782/EC2541-9994-2019-3(11-19)
Podrezov, O. (2001). Izmenchivost’ Klimaticheskikh Usloviy I Oledeneniya Tyan-Shanya Za Poslednie 100 Let. (Variability of the Climatic Conditions and the Glaciation of Tien Shan during the Past 100 years). Vestnik: KRSU, 33–40.
Pohl, E., Gloaguen, R., Andermann, C., and Knoche, M. (2017). Glacier Melt Buffers River Runoff in the Pamir Mountains. Water Resour. Res. 53, 2467–2489. doi:10.1002/2016WR019431
Pohl, E., Grenier, C., Vrac, M., and Kageyama, M. (2020). Emerging Climate Signals in the lena River Catchment: a Non-parametric Statistical Approach. Hydrol. Earth Syst. Sci. 24, 2817–2839. doi:10.5194/hess-24-2817-2020
Pohl, E., Knoche, M., Gloaguen, R., Andermann, C., and Krause, P. (2015). Sensitivity Analysis and Implications for Surface Processes from a Hydrological Modelling Approach in the Gunt Catchment, High Pamir Mountains. Earth Surf. Dyn. 3, 333–362. doi:10.5194/esurf-3-333-2015
Pritchard, H. D. (2019). Asia’s Shrinking Glaciers Protect Large Populations from Drought Stress. Nature 569, 649–654. doi:10.1038/s41586-019-1240-1
Reeh, N., and Reeh, B. N. (1991). Parameterization of Melt Rate and Surface Temperature on the greenland Ice Sheet. Polarforschung 59, 113–128.
Rounce, D. R., Hock, R., and Shean, D. E. (2020). Glacier Mass Change in High Mountain Asia through 2100 Using the Open-Source python Glacier Evolution Model (Pygem). Front. Earth Sci. 7, 20. doi:10.3389/feart.2019.00331
Savitskiy, A. G., Schlüter, M., Taryannikova, R. V., Agaltseva, N. A., and Chub, V. E. (2007). Current and Future Impacts of Climate Change on River Runoff in the central Asian River Basins. Adaptive And Integrated Water Management. doi:10.1007/978-3-540-75941-6_17
Schaner, N., Voisin, N., Nijssen, B., and Lettenmaier, D. P. (2012). The Contribution of Glacier Melt to Streamflow. Environ. Res. Lett. 7, 8. doi:10.1088/1748-9326/7/3/034029
Schiemann, R., Lüthi, D., Vidale, P. L., and Schär, C. (2008). The Precipitation Climate of central Asia - Intercomparison of Observational and Numerical Data Sources in a Remote Semiarid Region. Int. J. Climatology 28, 295–314. doi:10.1002/joc.1532
Shahgedanova, M., Afzal, M., Hagg, W., Kapitsa, V., Kasatkin, N., Mayr, E., et al. (2020). Emptying Water Towers? Impacts of Future Climate and Glacier Change on River Discharge in the Northern Tien Shan, central Asia. Water (Switzerland) 12, 1–32. doi:10.3390/w12030627
Shahgedanova, M., Afzal, M., Severskiy, I., Usmanova, Z., Saidaliyeva, Z., Kapitsa, V., et al. (2018). Changes in the Mountain River Discharge in the Northern Tien Shan since the Mid-20th century: Results from the Analysis of a Homogeneous Daily Streamflow Data Set from Seven Catchments. J. Hydrol. 564, 1133–1152. doi:10.1016/j.jhydrol.2018.08.001
Shean, D. E., Bhushan, S., Montesano, P., Rounce, D. R., Arendt, A., and Osmanoglu, B. (2020). A Systematic, Regional Assessment of High Mountain Asia Glacier Mass Balance. Front. Earth Sci. 7, 363. doi:10.3389/feart.2019.00363
Sorg, A., Bolch, T., Stoffel, M., Solomina, O., and Beniston, M. (2012). Climate Change Impacts on Glaciers and Runoff in Tien Shan (central Asia). Nat. Clim. Change 2, 725–731. doi:10.1038/nclimate1592
Thibert, E., and Vincent, C. (2009). Best Possible Estimation of Mass Balance Combining Glaciological and Geodetic Methods. Ann. Glaciology 50, 112–118. doi:10.3189/172756409787769546
Unger-Shayesteh, K., Vorogushyn, S., Farinotti, D., Gafurov, A., Duethmann, D., Mandychev, A., et al. (2013). What Do We Know about Past Changes in the Water Cycle of central Asian Headwaters? a Review. Glob. Planet. Change 110, 4–25. doi:10.1016/j.gloplacha.2013.02.004
Zandler, H., Haag, I., and Samimi, C. (2019). Evaluation Needs and Temporal Performance Differences of Gridded Precipitation Products in Peripheral Mountain Regions. Scientific Rep. 9. doi:10.1038/s41598-019-51666-z
Keywords: glacier meltwater contribution, glacier mass balance, Tien Shan, Naryn River, Central Asia
Citation: Saks T, Pohl E, Machguth H, Dehecq A, Barandun M, Kenzhebaev R, Kalashnikova O and Hoelzle M (2022) Glacier Runoff Variation Since 1981 in the Upper Naryn River Catchments, Central Tien Shan. Front. Environ. Sci. 9:780466. doi: 10.3389/fenvs.2021.780466
Received: 21 September 2021; Accepted: 30 November 2021;
Published: 14 January 2022.
Edited by:
Irfan Rashid, University of Kashmir, IndiaReviewed by:
Praveen Kumar Thakur, Indian Institute of Remote Sensing, IndiaRaaj Ramsankaran, Indian Institute of Technology Bombay, India
Copyright © 2022 Saks, Pohl, Machguth, Dehecq, Barandun, Kenzhebaev, Kalashnikova and Hoelzle. This is an open-access article distributed under the terms of the Creative Commons Attribution License (CC BY). The use, distribution or reproduction in other forums is permitted, provided the original author(s) and the copyright owner(s) are credited and that the original publication in this journal is cited, in accordance with accepted academic practice. No use, distribution or reproduction is permitted which does not comply with these terms.
*Correspondence: Tomas Saks, tomas.saks@unifr.ch