

Abstract
High elevation headwater catchments are complex hydrological systems that seasonally buffer water and release it in the form of snow and ice melt, modulating downstream runoff regimes and water availability. In High Mountain Asia (HMA), where a wide range of climates from semi-arid to monsoonal exist, the importance of the cryospheric contributions to the water budget varies with the amount and seasonal distribution of precipitation. Losses due to evapotranspiration and sublimation are to date largely unquantified components of the water budget in such catchments, although they can be comparable in magnitude to glacier melt contributions to streamflow. Here, we simulate the hydrology of three high elevation headwater catchments in distinct climates in HMA over 10 years using an ecohydrological model geared towards high-mountain areas including snow and glaciers, forced with reanalysis data. Our results show that evapotranspiration and sublimation together are most important at the semi-arid site, Kyzylsu, on the northernmost slopes of the Pamir mountain range. Here, the evaporative loss amounts to 28% of the water throughput, which we define as the total water added to, or removed from the water balance within a year. In comparison, evaporative losses are 19% at the Central Himalayan site Langtang and 13% at the wettest site, 24 K, on the Southeastern Tibetan Plateau. At the three sites, respectively, sublimation removes 15%, 13% and 6% of snowfall, while evapotranspiration removes the equivalent of 76%, 28% and 19% of rainfall. In absolute terms, and across a comparable elevation range, the highest ET flux is 413 mm yr−1 at 24 K, while the highest sublimation flux is 91 mm yr−1 at Kyzylsu. During warm and dry years, glacier melt was found to only partially compensate for the annual supply deficit.
Export citation and abstract BibTeX RIS

Original content from this work may be used under the terms of the Creative Commons Attribution 4.0 license. Any further distribution of this work must maintain attribution to the author(s) and the title of the work, journal citation and DOI.
1. Introduction
The mountain cryosphere is on a downward trajectory globally, as indicated by widespread declines in seasonal snowpack and negative glacier mass balances (Mudryk et al 2020, Hugonnet et al 2021). However, the importance of snow and glaciers as runoff contributors differs from basin to basin and depends on the local hydro-geographical setting (Bookhagen and Burbank 2010, Lutz et al 2014, Immerzeel et al 2020, Kraajenbrink et al 2021). In monsoonal basins, such as the Ganges–Brahmaputra, concurrent melt, snowfall and rainfall amplify seasonal streamflow variability (Khanal et al 2021). In semi-arid basins, such as the Amu-Darya river basin, glacier melt sustains streamflow during the summer gap in precipitation inputs (Unger-Shayesteh et al 2013, Sorg et al 2014, Pohl et al 2017, Pritchard et al 2019).
A number of processes other than glacier melt shape the mountain water budget, including the amount and seasonality of precipitation, snow cover dynamics, plant transpiration, surface evaporation and sublimation, all of which are highly variable in mountain environments. High vapour pressure deficits and radiative energy inputs drive the latent (LE) and sensible (H) energy fluxes. Cloudy conditions and elevated humidity can reduce turbulent heat fluxes by up to 70%, due to a more stable boundary layer under such conditions, resulting in a lowering of the evaporative fluxes (Mandal et al 2022).
Evaporative fluxes (E) are defined here to include all evaporation, transpiration and sublimation fluxes from the land surface (E = ET + S), while evapotranspiration (ET) and sublimation (S) are treated separately in this study.
Evapotranspiration (ET) represents a crucial mass loss from the hydrologic system, and is estimated to globally return around 60% of water inputs to the atmosphere over land (Seneviratne et al 2010, Katul et al 2012). However, despite its significance, ET has received limited attention in studies of high elevation catchments, which are extreme environments for vegetation. As an example, it remains elusive whether ET is a greater loss term in wet, monsoonal environments characterised by abundant water availability and energy limitations, or in semi-arid places with high energy inputs and potentially water limitations. ET is expected to increase with global warming due to greening and succession (e.g. Zhu et al 2016, Düthmann and Blöschl 2018, Yang et al 2023), while sublimation is expected to decrease with reductions in snow cover and higher temperatures.
In High Mountain Asia (HMA), where sublimation studies are still scarce, many questions remain around sublimation rates at high elevation, its sensitivity to monsoonal conditions, interannual variability and the importance of ground, canopy intercepted, and blowing snow sublimation at the catchment scale (Stigter et al 2018, Mandal et al 2022, Potocki et al 2022, Buri et al 2023). Neglecting sublimation as a mass sink leads to erroneous estimates of melt rates and streamflow when snow and glacier mass balances are calibrated (Stigter et al 2018).
From the water balance perspective, ice melt and evaporative fluxes oppose one another in that ice melt generates runoff, whereas evaporative fluxes generally reduce runoff, while they are sensitive to similar meteorological variables. Modelling in the upper Langtang catchment has shown that the totals of ice melt and evaporative fluxes were comparable in magnitude during the 2018/19 hydrological year (Buri et al 2023). However, it remains unknown under which conditions increased glacier melt would also compensate for precipitation deficits and increased evaporative fluxes (Van Tiel et al 2021) at the seasonal scale in high-elevation catchments.
Serving as research tools, mechanistic models enable new process understanding and detailed quantification of flux partitioning and sensitivity to environmental changes (Poulin et al 2011, Mastrotheodoros et al 2019, Pomeroy et al 2022). Previous applications of such models have highlighted counter-intuitive relationships of ET and water availability, such as an inverse correlation of ET with precipitation under drought conditions (Mastrotheodoros et al 2020). Due to their physical basis, these models are regarded as robust across temperate, humid and sub-humid environments and under shifting boundary conditions, such as climate change and extreme events (Poulin et al 2011, Fatichi et al 2016, Pomeroy et al 2022).
In this study, an ecohydrological model geared towards high mountain hydrological systems is applied to three glacierized headwater catchments in contrasting climates within HMA to constrain the hydrological fluxes at high elevations. After a thorough evaluation of the model, the partitioning of mass and energy fluxes, together with ecohydrological variables, are investigated to determine the main components of runoff generation. We hypothesise that:
- (I)Sublimation is higher in semi-arid, high elevation catchments, where longer periods of cold and clear-sky conditions with high energy inputs occur.
- (II)ET is higher in monsoonal catchments due to the prevalence of concurrent periods of liquid water abundance and high temperatures, along with intensive vegetation coverage.
- (III)In warm and dry years, increased glacier melt fully compensates, or even overcompensates for precipitation deficits and enhanced evaporative losses.
2. Study sites
Three glacio-hydrological reference catchments are investigated, with the common features of steep topography, vegetation cover, substantial glacier coverage, abundance of supraglacial debris and large, but comparable elevation ranges (figures 1(a)–(e)). Since they span the climatic spectrum of HMA, these catchments are ideally suited for a comparative perspective on the diversity of HMA headwater hydrology.

Figure 1. (a) Map of the region with the location of the three study catchments indicated, along with (b)-(d) detailed maps showing land cover and station locations and station identifiers. (e) Land cover hypsometry. (f) Average monthly meteorological conditions over the study period and hypsometry of precipitation partitioning.
Download figure:
Standard image High-resolution imageKyzylsu (KYZ, 168 km2) is located in the headwaters of the Amu Darya river basin, on the northernmost slopes of the Pamir mountain range in Tajikistan (figures 1(a) and (b)). The local weather is controlled by a continental climate and has no direct influence from the Indian summer monsoon (Schienmann et al 2008). Monitoring in this new reference catchment has only recently started (June 2021), and observations were geared towards glacio-hydrological modelling. The initial network is detailed in supplementary section 1. The region, with a mean glacier mass balance of −0.17 m w.e. yr−1 (Pamir and Pamir Alai regions, 2000–2016, Miles et al 2021), has been regarded as part of the Pamir-Karakoram Anomaly (Hewitt et al 2005, Farinotti et al 2019, Barandun et al 2021, Miles et al 2021). Recent evidence however suggests that the region might be trending towards overall negative mass balances (Hugonnet et al 2021).
Located in the Central Himalaya of Nepal and seasonally governed by the Indian Summer Monsoon (figures 1(a) and (c)), Langtang (LAN, 586 km2) is a well-studied Ganges headwater catchment, where monitoring has taken place since the 1980s, and systematic meteorological and glaciological measurements have been made since 2012 (e.g. Higuchi 1984, Fujita et al 1997, 1998, Steiner et al 2021). The region exhibits rapidly shrinking glaciers, with a mean mass balance of −0.43 m w.e. yr−1 (Everest region, 2000–2016, Miles et al 2021).
Parlung 24k (24 K, 64 km2), is a small Yarlung Tsangpo/Brahmaputra headwater basin on the Southeastern Tibetan Plateau (figures 1(a) and (d)) that has been monitored since 2016 (Yang et al 2017). Out of the three study sites, it has the wettest climate, with heavy precipitation occurring from March to September (figure 1(f)), since it is affected by both the Indian and East Asian summer monsoons (Bookhagen and Burbank 2010, Ding and Chan 2005). Glacier mass balances in the region have been shown to be amongst the most negative in HMA, averaging around −0.68 m w.e. yr−1 (Nyainqentangla region, 2000–2016, Miles et al 2021), which has been partly attributed to a shift in precipitation from snowfall to rain (Jouberton et al 2022).
3. Methods
3.1. The model
To simulate the coupled dynamics of water, snow and glaciers, energy, vegetation physiology and carbon in the three catchments, the Tethys-Chloris model (T&C; Fatichi et al 2012a, 2012b, Manoli et al 2018, Mastrotheodoros et al 2019, Botter et al 2021, Paschalis et al 2022) (figure S3), was applied to the period October 2010 to September 2022. The period October 2010 to September 2012 was considered a spin-up period and was not included into the analysis of model outputs. For each grid cell, the energy balance is solved for the surface temperature of any type of land cover, including vegetated and bare land, rock, surface water, snow, glaciers and supraglacial debris, and includes the computation of net radiation, sensible and latent heat, heat consumed by photosynthesis and heat exchange with the subsurface. The model also resolves infiltration and exfiltration, deep percolation, lateral surface and subsurface water flows, soil moisture dynamics in the unsaturated zone including root water uptake at different depths at the grid level. Glaciers are represented as a single-layered ice-pack including a retention capacity for water. Glacier outlines and debris covered areas were manually corrected, based on the Randolph glacier inventory (RGI-6) and the debris thicknesses product was prepared combining remote sensing data and in-situ observations (supplementary section 4). The snow-, ice and ice-under-debris mass balance models are described in detail in Fugger et al (2022) and Fyffe et al (2021). A more detailed description of T&C is provided in Fatichi et al (2012a, 2012b, 2020), and a setup in the upper part of Langtang and additional model details are described in Buri et al (2023). Advances implemented for this study include a 2-layer snowpack model, where the surface energy balance is solved at a skin layer, and a parameterization for glacier geometry changes as detailed in supplementary section 5. The sensitivity of the energy and mass fluxes involved in the computation of the glacier and snow mass balances to model parameters and meteorological forcing were presented in Fyffe et al (2021) and Fugger et al (2022).
The model parameters were not calibrated in the traditional sense, e.g. through automatic calibration of multiple parameters against spatially integrated variables like runoff. Instead they were estimated from the literature and using expert knowledge (e.g. Fatichi et al 2016). Parameters requiring optimization and manual adjustments from the T&C standard setup were related to the thermal properties of the supraglacial debris, the glacier geometry updates, bare-ice albedo, the vegetation phenology and to high-elevation precipitation at one of the sites (supplementary section 5).
3.2. Forcing data
The model was forced using downscaled hourly air temperature (Ta), relative humidity (RH), total precipitation (P), incoming shortwave radiation (Sin), incoming longwave radiation (Lin), wind speed (Ws) and air pressure (Pa) data from the ERA5-Land 9 km reanalysis (Muñoz-Sabater et al 2021). Statistical downscaling to 100 m spatial resolution was performed following the approach of Machguth et al (2009), which combines simple parameterisations with spatial interpolation (supplementary section 2, figures S1 and S2). Bias correction of forcing variables was performed using empirical quantile mapping against local station data (supplementary section 3). Independent stations were used, where possible, to assess the efficacy of the bias-correction in space and time (figures S4–S21). Despite minor discrepancies, the forcing data are deemed acceptable for the representation of spatial and temporal variability in the catchment-wide meteorology, as indicated by low biases, RMSE values and high correlation coefficients against observations (figures S4–S21, table S3).
3.3. Model evaluation
Model performance was evaluated using a combination of in-situ and remote sensing data. Snowlines were derived from the MODIS Terra snow cover V6.1 product (Fugger 2018, Hall and Riggs 2021) and compared to the modelled snowlines. Snow cover was additionally evaluated scene-by-scene against Sentinel-2/Landsat-8 and Dice coefficients (Dice 1945) were calculated. The modelled surface mass balance of glaciers was evaluated against two references: the geodetic mass balance results of Hugonnet et al (2021); and altitudinal values derived following the approach of Miles et al (2021) that uses the thinning data of Hugonnet et al (2021) and the surface velocities of Millan et al (2022) at Langtang. At Kyzylsu and 24 K the velocity and geodetic mass balance data quality prevented the second approach. Modelled snow depth (all sites) and ice melt (Kyzylsu, Langtang) were evaluated using automatic measurements of surface height. Catchment mean leaf area index (LAI) was compared against MODIS (MCD15A3H v.6, Myneni et al 2015) and VIIRRS (VNP15A2H v.1; Myneni and Knyazkhin 2018) LAI products. Modelled discharge was evaluated against data from gauging stations in proglacial streams of Kyzylsu, Langtang and 24 K glaciers.
4. Results
4.1. Evaluation of model performance
Modelled snowlines correspond well with remote sensing observations are typically within the uncertainty ranges of the observed snowlines, with biases (R2 values) of −52.2 m (0.74), −16.6 m (0.43), −194.4 m (0.41) for Kyzylsu, Langtang and 24 K, respectively (figure S22).
Modelled snow cover agreed well with Landsat-8/Sentinel-2 scenes in a scene-by-scene comparison, and average Dice coefficients for each site were 0.66, 0.66, 0.76 (figure S23), with higher performance during periods of more extensive snow cover and lower performance during patchy snow cover.
Compared to observations, the timing of local snow accumulation and glacier melt was very well reproduced, while some under- and overestimations of the snowpack height up to 45 cm occurred at 24 K and Kyzylsu (figure S24). These local discrepancies are likely related to the absence of a wind-driven snow redistribution scheme in the model.
The model agrees very well with the remote-sensing-based glacier-wide and altitudinal mass balance values at Langtang (0.65 m w.e.yr−1 vs 0.62 ± 0.13 w.e.yr−1), to within observational uncertainty at 24 K (−0.42 m w.e. yr−1 vs. 0.25 ± 2.07 m w.e. yr−1), and with a slight negative overestimation at the Kyzylsu glaciers (−0.46 m w.e. yr−1 vs. 0.18 ± 0.22 m w.e. yr−1) (figures S25–S27).
LAI values show overall good agreement with observations in terms of magnitude (figure S28), while there are mismatches in terms of timing at Kyzylsu (RMSE: 0.52) and Langtang (0.71) and peak LAI magnitudes at 24 K (0.36).
Both the magnitude and timing of streamflow variations are well reproduced at the pro-glacial stream gauges, with NSE values of 0.5 at Kyzylsu, 0.55 at 24 K, and a somewhat weaker agreement at Langtang with 0.27 (figure S29).
4.2. Precipitation determines the relative importance of evaporative fluxes and glacier melt
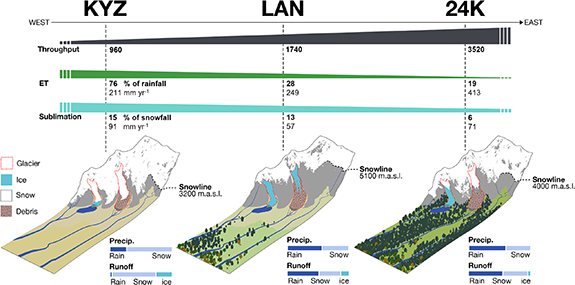
The annual water throughput of the catchments, which is defined as the total water added to or removed from the water balance within a year in either liquid, solid or gaseous form, increases from west to east (figures 2 and 5). The annual water throughput is highest in 24 K, followed by Langtang and Kyzylsu: Langtang and 24 K respectively receive around 1.8 times (1742 mm yr−1) and 3.7 times (3523 mm yr−1) more precipitation than Kyzylsu (961 mm yr−1) (figures 2 and 5). The partitioning of inputs into rain and snowfall is controlled by the precipitation seasonality: with a winter-accumulation regime, 70.6% of annual precipitation falls as snow at Kyzylsu, while those portions are smaller in Langtang (42.7%) and 24 K (39.7%) (figure 1(f)), where the bulk of the precipitation falls in the summer half-year.

Figure 2. (a) Annual catchment average water balances, (b) catchment average snowpack balances, and (c) catchment average ice mass balances for three catchments following a standard water balance formula (Precipitation = Runoff + Vapour fluxes + Storage Changes). Snow on glaciers is counted towards the catchment-wide snowpack rather than towards the ice pack. Numbers in segments show the percentage contribution to or withdrawal from the water balance. Once reaching the ground, precipitation in solid or liquid form passes through the snow- and/or ice-pack-, interception- or groundwater-storages, before being transferred out of the catchment in the form of runoff or vapour. An imbalance of those storages at the annual scale results in net addition or net removal of water to or from the water budget (Δ-components); ΔOther symbolises the summed differences of the interception storages of all surfaces including vegetation, the surface water and soil water storages.
Download figure:
Standard image High-resolution imageAcross the common elevation range of the three catchments (2500–5700 m asl), snowmelt contributes 67% of annual runoff in Kyzylsu, 35% in Langtang, and 41% in 24 K (figure 3(a)). Once most of the snow has melted out in Kyzylsu between the middle and end of August, ice melt becomes the dominant runoff contribution with 55% in September (annually 24%). In Langtang, which has a similar proportion of glacier area, the ice melt contribution peaks in post-monsoon with 21.7% in October, while later during summer, it is dwarfed by monsoonal rainfall so that the ice melt contribution is only 14% annually. At 24 K, which hosts around half the proportion of glacier area compared to the other sites, but gets substantially higher liquid precipitation inputs, ice melt contributes only 8% to the runoff in August (3% annually) (figure 3(a)). Note that snowmelt above glacier surfaces is counted towards the catchment-wide snowmelt rather than to the ice melt.
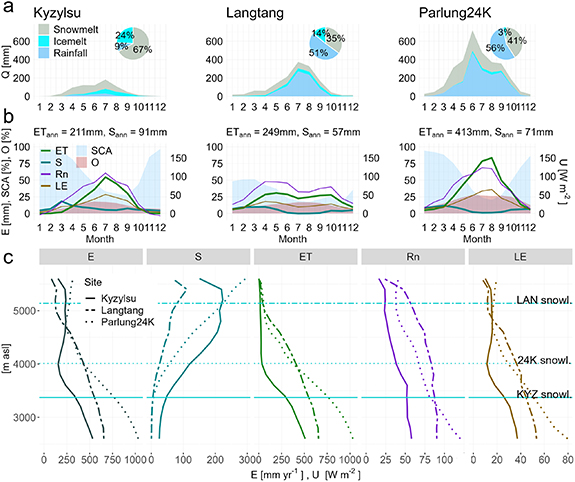
Figure 3. (a) Mean monthly runoff contributions of snowmelt, ice melt and rainfall (stacked bars), and shares of the total annual runoff (Q) (pie charts). Snowmelt from glacier surfaces is included in the snow share rather than in the ice share. (b) Mean monthly evaporative fluxes ET and S together with energy fluxes (U) net radiation (Rn) and latent energy (LE); snow covered area (SCA) and soil moisture (O) as shaded areas in the figure background. (c) Site comparison of evaporative and energy fluxes by altitude; turquoise horizontal lines indicate catchment annual mean snowline at each site. All values for the common elevation range (2500–5700 m asl).
Download figure:
Standard image High-resolution imageRainfall runoff contributes the largest share (56%) to total runoff in 24 K, followed by Langtang (51%), and Kyzylsu (9%) (figure 3(a)). During the period March to August rainfall is transformed into runoff in Kyzylsu, while from September to October the majority of rainfall is evaporated (figure 3(a)).
In all three catchments, catchment-wide, modelled glacier mass balances were negative over the study period with −0.46, −0.65 and −0.42 m w.e. yr−1 in Kyzylsu, Langtang and 24 K respectively (figures S25-S27). The imbalance melt, defined as the glacier melt not replenished by new ice formation, accounted for 13, 9 and 2% of the mass inputs to the water balance in Kyzylsu, Langtang and 24 K, respectively (figure 2). In all catchments, sub-debris ice melt is larger than bare-ice melt, with 66.8, 62.5, 57.9% for Kyzylsu, Langtang and 24 K, respectively (figure 2). The total E (combined ET and S) accounts for 28, 19 and 13% of the catchment water output (figure 2(a)) of Kyzylsu, Langtang and 24 K, respectively. ET alone corresponds to 76% of the liquid precipitation falling in Kyzylsu, 28% in Langtang, and 19% in 24 K. The relative importance of glacier melt and evaporative fluxes therefore decreases with an increasing water throughput from west to east. A spatial distribution of annual melt, evapotranspiration and sublimation is shown in figure S30.
4.3. Net radiation is the main control on evaporative fluxes at all sites
Across the common elevation range, the evaporative fluxes follow the seasonality of net radiation (Rn) that is available for the turbulent heat transfer in the case of ET and additionally the snow covered area and temperature regime in the case of S (figure 3(b)). Soil water limitations do not affect the ET rates in either of the catchments during average years, since the latent energy (LE) and ET follow the Rn regime throughout the season, and soil water limitations do not occur, as indicated by the soil moisture seasonality (figure 3(b)). A high availability of intercepted water on leafs and rock surfaces however boosts evaporation rates in the wet climate of 24 K (figure 3(b)). Evaporation from supraglacial debris is a small flux for the catchment (not shown), but helps insulate the glacier ice by removing energy in the form of LE from entering the glacier (Fugger et al 2022).
4.4. Sublimation is important, especially at the semi-arid site
In all three catchments, sublimation removes mass from the ground and canopy intercepted snowpack year-round (figures 3(b) and (c)). Relative to the snowfall amounts, sublimation is largest in Kyzylsu, followed by Langtang and 24 K (15, 13, 6%, respectively) (figure 2(b)). In absolute terms and for the common elevation range, sublimation is also largest in Kyzylsu (91 mm yr−1), but it is second largest in 24 K (71 mm yr−1) and smallest in Langtang (57 mm yr−1). In Langtang, however, where the snowline is generally higher, most sublimation happens above the elevation range of the other basins, amounting to 84 mm yr−1 over the whole elevation range of Langtang (figure S32).
During the warmest months of the year, sublimation rates are low (e.g. Kyzylsu 0.2 mm d−1, Langtang <0.01 mm d−1, Parlung24K 0.03 mm d−1), since snow retreats to the highest elevations, and temperatures are often above the melting point during the periods of high radiation inputs, favouring snow and ice melt rather than sublimation (figure 3(c)). Only in Kyzylsu there is notable snowpack sublimation also in the lower reaches of the catchment, owing to the lower temperatures and heavier snowfalls there during winter (figure 3(c)).
4.5. Melt partially compensates for supply deficits in warm-dry years
Under warmer- and drier-than-average conditions, such as during the hydrological years 2021/22 (Kyzylsu) and 2016/17 (Langtang) and 2017/18 (24 K), additional ice melt of +35 mm, +33 mm and +10 mm partially compensates for the supply deficits. The supply deficit is here defined as the combination of precipitation deficits and ET losses, which amount to −225 mm, −153 mm and −368 mm compared to the multi-year average (2010/11-2021/22), at Kyzylsu, Langtang and 24 K, respectively (figure S31). Snowmelt under warm conditions has an even greater replenishing effect on the water yield, since old snow, e.g. from glacier accumulation zones, is being depleted: the snowmelt deficit (−32 mm, −22 mm, −170 mm) is considerably smaller than the snowfall deficit (−141 mm, −61 mm, −236 mm) (figure S31), implying a net snowmelt increase of 109 mm, 39 mm and 66 mm. While ice melt alone offsets only around 16%, 22% and 3% of the supply deficits, the ice and snow melt enhancements together offset 64%, 47%, and 21% of the precipitation deficits. As a result of compensations due to enhanced glacier and snow melt, the driest and warmest hydrological years (such as 2021/22 at Kyzylsu, 2016/17 at Langtang and 2017/18 at 24 K) do not correspond to the greatest runoff deficits (figure 4(a)).
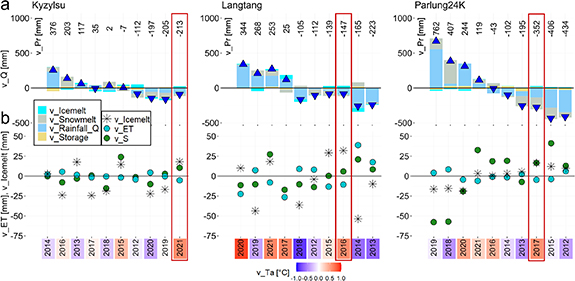
Figure 4. (a) Annual runoff anomalies and their components (stacked bars), ranked by the precipitation anomaly (v_Pr) of each hydrological year from left to right (positive to negative v_Pr). Blue triangles show the runoff surplus (up) or deficit (down). Temperature anomalies (v_Ta) are shown in red to blue on the year labels; Precipitation anomalies (v_Pr) are given as numbers above the bars. (b) Annual evapotranspiration (v_ET) and sublimation (v_S) anomalies along with ice melt anomalies (v_Icemelt). Red boxes indicate warm-dry focus years, which are detailed in figure S31. All values are relative to the mean over the reference period (Oct-2012 to Sep-2022). Years on the x-axis indicate hydrological years (e.g. 2014 indicates the hydrological year 2014/15).
Download figure:
Standard image High-resolution imageEvapotranspiration anomalies can reach values similar to those of enhanced ice melt under warmer conditions (e.g. Kyzylsu: 2015, 2021; Langtang: 2021; 24K: 2017; figure 4(b)), implying that evapotranspiration counterbalances the additional ice melt contribution to streamflow. Note however, that the level of this balancing is strongly related to the proportion of glacier cover versus the remaining land cover in a catchment.
5. Discussion
5.1. Importance of evapotranspiration and sublimation
Sublimation is highest in both relative and absolute terms and across the common elevation range in Kyzylsu, supporting our first hypothesis (I) that sublimation is most important in semi-arid, high elevation catchments (figures 2 and 3). Clear-sky conditions, with low winter temperatures and high snowfall rates create favourable conditions for sublimation. In contrast, cloudy, warm conditions during the accumulation period drastically reduce sublimation but favour melt (Mandal et al 2022, Fugger et al 2022). Snow sublimation has long been recognized as an important mass flux in snowy alpine environments, including in the Alps (Strasser et al 2008), glacierized catchments in the Canadian Rockies (Pradhanga et al 2022, Aubry-Wake et al 2022), the Himalaya (Buri et al 2023), and at the glacier scale in the Andes (Ayala et al 2017). The share of snowfall removed by sublimation ranges between 5% and 90% in previous literature, depending on the study site's environment, elevation range and topography. Here, we estimate this share for the three catchments as 15% (Kyzylsu), 13% (Langtang) and 6% (24 K). Modelling scenarios not including sublimation would overestimate the annual snowmelt runoff by this share, affecting especially summer season runoff and peak flows (Stigter et al 2018).
Our second hypothesis (II), that ET is higher in monsoonal catchments, can also be confirmed, since Kyzylsu shows less overall ET than Langtang and 24 K. This is mostly a result of the energy regimes and snow cover dynamics, rather than a result of soil water limitations (figure 3). However, intense rainfalls over the greater part of the year provide additional water to evaporate from leaf-, rock- and other interception-storages, boosting ET at 24 K.
5.2. Trade-offs between ice melt and evaporative fluxes under warm-dry conditions
In none of the catchments and years did ice melt alone overcome the supply deficit during warm-dry years, although this may happen at the seasonal or event timescale (Van Tiel et al 2021). While ice melt enhancements reach similar magnitudes as the evaporative loss enhancements, the third hypothesis, that ice melt can compensate for the combination of both precipitation deficits and enhanced evaporative losses during warm-dry years, is not supported by our results. Ice melt combined with melt from old snow can however offset as much as 64% of the supply deficit in Kyzylsu. These results reveal important implications for the system behaviour under climate change and should contribute to the discussion around future water yield under a vanishing cryosphere (e.g. Immerzeel et al 2013, Ragettli et al 2016, Huss and Hock 2018, McCarthy et al 2022).
5.3. Sensitivity to climate change
The interannual anomalies of sublimation and evapotranspiration can reach similar magnitudes as the ice melt anomalies (figure 4(b)), depending on the catchment configuration. The interannual variability in evaporative fluxes is generally smaller than the interannual variability of rain- and snowfall inputs at all sites, in agreement with previous studies (Roberts 1983, Fatichi and Ivanov 2014). Under a warming climate, therefore, shifts in precipitation volume and phase (Jouberton et al 2022, Shaw et al 2022), as well as the decline in glacier cover will probably be more important to streamflow variability (e.g. Ragettli et al 2016, Huss and Hock 2018) than changes in the evaporative fluxes. The streamflow at the semi-arid site is likely the most sensitive to climate change, due to the important role of the cryosphere in runoff generation for two reasons: (i) glacier melt sustains summer runoff and glaciers are shrinking, even in the domains affected by the Pamir–Karakoram anomaly (Hugonnet et al 2021). Where 'imbalance' ice melt at present compensates for runoff deficits under warm-dry conditions, this effect will initially increase, but eventually vanish, once ice masses have shrunken further (e.g. McCarthy et al 2022); (ii) Our analysis shows that the melting of old snow can buffer streamflow deficits during warm-dry years to an even greater extent than the melting glacier ice, with the highest degree of compensation at Kyzylsu. These old snow reserves would however vanish quickly over a few consecutive warm-dry years. Additionally, seasonal snowpacks are thinning and global warming is bringing the bulk snowmelt events earlier in the season (Unger-Shayesteh et al 2013). Modelling experiments based on future scenarios are needed, in order to fully understand the High Mountain Asian headwaters' sensitivity to climate change.
5.4. Limitations
Uncertainties in model outputs were not explicitly quantified due to the high computational demand of the model (table S4) limiting our ability to perform a large number of simulations. Instead, the model results were compared against a large range of ground and remotely sensed data, confirming its ability to replicate the necessary physical processes. While sublimation from the ground- and canopy-intercepted snowpack is simulated, blowing snow sublimation is not, and so sublimation on wind-exposed mountain ridges is potentially underestimated in this study (Strasser et al 2008). Similarly, due to the absence of a blowing snow transport scheme, the heterogeneity of snow depths between ridges and valleys is underrepresented (Aubry-Wake et al 2022). The model does not have a separate firn layer representation. This might affect the mass balance of the accumulation zones, since the thermal and surface properties of firn differ from those of snow and ice (Pradhanga and Pomeroy 2022). Supraglacial ice cliffs and ponds were not modelled, but these features are expected to enhance melt-rates of debris-covered glaciers (Miles et al 2018, 2022, Buri et al 2021, Kneib et al 2022). Finally, measurements of the surface latent heat fluxes are needed to better evaluate these fluxes in high elevation catchments and should be a goal of future fieldwork.
6. Conclusion
Our mechanistic modelling approach, forced with downscaled reanalysis data at a spatial resolution suited to steep mountain topography, proved transferable across three glacierized catchments, which span the geographic and climatic spectrum of HMA. Minimising the risk of equifinality issues, our approach requires minimal calibration, and addresses several key challenges for this domain (Azam et al 2021): a detailed representation of supraglacial debris and an energy-balance based calculation of ice melt under debris cover, bias-corrected and spatially variable meteorological inputs, the computation of sublimation, as well as evapotranspiration and all-surface-evaporation. Our simulations show that water throughput determines the importance of the evaporative fluxes, and varies by a factor of 3.7 between the 'climatic ends' of HMA studied here (Kyzylsu vs. 24 K, figure 1). We find that over the 10 year study period, sublimation losses accounted for an average of 15, 13 and 6% of the snow falling in Kyzylsu, Langtang and 24 K, respectively. They are highest at the site with the largest amount of winter and spring accumulation, Kyzylsu, also in absolute terms (figure 5). Evapotranspiration removes 76, 28 and 19% of the liquid precipitation from the three catchments, respectively, and prevents almost any runoff generation from rainfall during the low-flow months in Kyzylsu. However, annual evapotranspiration is highest in absolute terms at 24 K (figure 5). Ice compensates for up to 17% of the supply deficit during a warm, dry year at the site with the highest glacier cover, Kyzylsu, but neither fully, nor over-compensates at the annual timescale and in either of the catchments. Old snow melt and ice melt combined, however, can offset as much as 64% of the supply deficit. Increased evapotranspiration during those years can reach similar magnitudes to the additional ice melt, intensifying the deficit in the runoff. In order to better anticipate future water yields, the sensitivity of HMA headwaters to global warming should be further tested with experiments using mechanistic models.
Figure 5. Conceptual summary of catchment features, hydro-climatic setting, land cover and study outcomes.
Download figure:
Standard image High-resolution image
Acknowledgments
We would like to thank the team at the Center for the Research of Glaciers, Tajik National Academy of Sciences, Abduhamid Kayumov, Khusrav Kabutov, Ardamehr Halimov, among others, for their invaluable support over multiple field seasons in Kyzylsu. We thank Wei Yang, Zhao Xhuanxi and Zhen Cheng from the Institute of Tibetan Plateau Research, Chinese Academy of Sciences, for facilitating and supporting fieldwork and for sharing crucial data from the Parlung 24K catchment. We thank Reeju Shrestha and Himalayan Research Expeditions for their great support in Langtang. We extend our thanks to Jakob Steiner and the team at ICIMOD for their relentless efforts in data acquisition and curation in Langtang. Additionally, we are indebted to Masashi Niwano from the Meteorological Research Institute, Japan Meteorological Agency, for providing NHM atmospheric simulation outputs, which proved very valuable in the downscaling process.
Data availability statement
The data that support the findings of this study are openly available at the following URL/DOI: 10.5281/zenodo.10407300.
Funding
This project has received funding from the European Research Council (ERC) under the European Union's Horizon 2020 research and innovation program Grant Agreements No. 772751 (RAVEN, Rapid mass losses of debris-covered glaciers in High Mountain Asia). Further funding was provided by JSPS-SNSF (Japan Society for the Promotion of Science and Swiss National Science Foundation) Bilateral Programmes project (HOPE, High-elevation precipitation in High Mountain Asia; Grant 183633). Fieldwork support for Tajikistan was received from the Swiss Polar Institute Flagship Programme PAMIR, SPI-FLAG-2021-001. The project also received funding from the ESA and NRSCC Dragon 5 cooperation project 'Cryosphere-hydrosphere interactions of the Asian water towers: using remote sensing to drive hyper-resolution ecohydrological modeling' (grant no. 59199). The National Natural Science Foundation of China (41961134035) financially supported the data collection at 24K.
Conflict of interest
The authors declare no conflicts of interest in relation to this research paper.
Supplementary material (4.5 MB PDF)