

Abstract
While daily extreme precipitation intensities increase with global warming on average at approximately the same rate as the availability of water vapor (∼7%/°C), a debated topic is whether sub-daily extremes increase more. Modelling at convection-permitting scales has been deemed necessary to reproduce extreme summer precipitation at local scale. Here we analyze multi-model ensembles and apply a 3 km horizontal resolution model over four regions across Europe (S. Norway, Denmark, Benelux and Albania) and find very good agreement with observed daily and hourly summer precipitation extremes. Projections show that daily extreme precipitation intensifies compared to the mean in all regions and across a wide range of models and resolutions. Hourly and 10 min extremes intensify at a higher rate in nearly all regions. Unlike most recent studies, we do not find sub-daily precipitation extremes increasing much more than 7%/°C, even for sub-hourly extremes, but this may be due to robust summer drying over large parts of Europe. However, the absolute strongest local daily precipitation event in a 20 year period will increase by 10%–20%/°C. At the same time, model projections strongly indicate that summer drying will be more pronounced for extremely dry years.
Export citation and abstract BibTeX RIS

Original content from this work may be used under the terms of the Creative Commons Attribution 3.0 licence. Any further distribution of this work must maintain attribution to the author(s) and the title of the work, journal citation and DOI.
1. Introduction
The intensity of extreme precipitation events is estimated based on observations and models to increase with the availability of water vapor in the atmosphere, at around 7% per degree global warming, which is much faster than the 1%–3%/°C increase in mean precipitation (Allen and Ingram 2002, Held and Soden 2006, Boucher et al 2013). However, precipitation changes are far from homogeneously distributed spatially (Pfahl et al 2017) and global climate models (GCMs) have too coarse resolution to realistically represent extreme precipitation and its changes on local scales. Effects of climate change are often separated into thermodynamic and dynamic contributions. Thermodynamic contributions involve large-scale warming of the atmosphere and associated humidity increases typically leading to extreme precipitation changes of around 7%/°C, while dynamic contributions involve atmospheric circulation changes and can lead to extreme precipitation changes larger or smaller than 7%/°C (Pfahl et al 2017).
Regional climate modelling at convection-permitting scales (typically <4 km horizontal resolution) is an emerging research topic and has been shown to improve modelling of present-day extreme events, in particular sub-daily extremes, compared to larger-scale models (Westra et al 2014, Prein et al 2015). This is partly because, in these models, deep convection is calculated explicitly rather than parameterized. The required high-resolution makes convection-permitting modelling computationally expensive, but scientific advances and increasing computer capacity have recently made regional climate modelling on convection-permitting scales more feasible. This was for instance shown in a recent study over the Euro-Mediterranean region using an ensemble of different convection-permitting models (Coppola et al 2018).
Kendon et al (2017) concluded that models with very high-resolution are needed for accurate future projections of summertime rainfall intensity and duration, and of daily and hourly rainfall extremes in summer. While the intensity of daily precipitation extremes is expected to increase following the Clausius–Clapeyron (CC) scaling of around 7%/°C, there is currently a debate whether hourly precipitation extremes increase faster than this rate, a situation also referred to as superadiabatic scaling. A modelling study over the Alpine region did not find indications of such superadiabatic intensity increase at hourly time-scales (<6.5%/°C) (Ban et al 2015), while other modelling studies found strong superadiabatic intensity increases for England (∼8%/°C) (Kendon et al 2014), Africa (∼8%/°C, but locally much higher) (Kendon et al 2019) and central Europe (∼14%/°C, but based on a coarser resolution RCM) (Lenderink and van Meijgaard 2008). While no clear evidence of superadiabatic scaling is found in hourly precipitation observations over the US (Shaw et al 2011), observations over the Netherlands show twice the CC scaling (∼14%/°C) for hourly precipitation extremes when temperatures are above 12 °C (Lenderink and van Meijgaard 2008), and for 10 min precipitation extremes for all temperature ranges (Loriaux et al 2013). In the studies based on observations, the %/°C scaling was derived by segregating sub-daily precipitation intensities into daily mean local temperature bins of size 2 °C. The shift from CC to twice the CC scaling is attributed to a shift from stratiform to convective precipitation (Berg et al 2013, Loriaux et al 2013).
For changes in mean summer precipitation in Europe, future model projections show a strong north-south difference with increases in the north and a strong drying in the Mediterranean (IPCC 2013). Kroner et al (2017) investigated the underlying mechanisms of mean summer precipitation changes in Europe, using one RCM, and found that large-scale thermodynamic effects lead to a significant precipitation increase over all of Europe, while temperature lapse-rate and circulation effects cause the decrease in the south. They further indicate that the strong model dependency for summer precipitation changes in the transition zone in central Europe is due to opposing signs of the thermodynamic and circulation effects in this region.
While most previous studies involving convection-permitting modelling have focused on single small regions, here we investigate future mean and extreme precipitation changes for several European regions from north to south. This study also goes beyond most previous studies by investigating changes in sub-hourly (i.e. 10 min) extreme precipitation, and by directly comparing the very high-resolution single model results to coarser resolution RCMs and GCMs, allowing us to address questions about the influence of natural variability and inter-model spread.
2. Methods
2.1. Regional and global climate models
We have applied the Weather Research and Forecasting model (WRF) (Skamarock and Klemp 2008) at convection-permitting 3 km horizontal resolution for four different regions across Europe (see section 2.3). An overview of domain setups and parameterization schemes is given in tables S1, S2. For each of the four regions, the 3 km horizontal resolution domain was one-way nested from an intermediate 15 km domain, which was again nested from a 45 km domain. 50 vertical levels were used, and spectral nudging was applied for temperature, horizontal winds, humidity and geopotential height in the outermost (45 km) domains. Two 20 year time periods were simulated to represent recent (1986–2005) and future (2081–2100) climate for the summer and early fall. Each year was initialized on May 1 and the run ended on September 30, but the first month was excluded from the analysis and considered as spin-up.
The initial and 6 hourly boundary conditions and sea-surface temperatures to WRF were from a coupled atmosphere-ocean simulation using the National Center for Atmospheric Research (NCAR) Community Earth System Model (CESM1.0.4) (Gent et al 2011). The CESM was set up with the CAM4 atmosphere module (Neale et al 2010) at 1.9°× 2.5° horizontal resolution and 26 vertical levels, the CLM4 land module (Lawrence et al 2011), the CICE4 sea-ice model (Hunke and Lipscomb 2008), and a full ocean model (Danabasoglu et al 2012), which is based on the Parallel Ocean Program version 2 (Smith et al 2010). Soil temperature and moisture was initialized in WRF by interpolating the 15 CLM4 soil levels to the four soil levels used in WRF. The CESM model was run from 1850 to 2100 using the high emission Representative Concentration Pathway 8.5 (RCP8.5) (van Vuuren et al 2011), and necessary variables to drive WRF were stored. Additional WRF experiments were run for the 1996–2005 (1 May–30 Sep) period with initial and boundary conditions from the 2.5° × 2.5° resolution NCEP/NCAR reanalysis (Kalnay et al 1996).
For comparison with the CESM and WRF results, further GCM output was retrieved from the Coupled Model Intercomparison Project phase 5 (CMIP5) archive (Taylor et al 2011) and regridded to 1°×1° horizontal resolution for the analysis (see table S3). Further RCM output has been taken from two large ensemble datasets and their driving GCMs. First, from the 21-member COSMO-CLM model ensemble over Europe (Addor and Fischer 2015), at approximately 50 km × 50 km horizontal resolution for 1950–2100 (RCP8.5), downscaled from an ensemble of CESM1-CAM4 simulations (Fischer et al 2013) (hereafter 'COSMO-LE' and 'CESM1-LE', respectively). Second, from the 50-member ensemble with the Canadian Regional Climate Model (CRCM5) downscaled over Europe for 1950–2099 (RCP8.5) at 12 km × 12 km resolution from an ensemble of CanESM2 GCM simulations (Leduc et al 2019, von Trentini et al 2019) (hereafter 'CRCM5-LE' and 'CanESM2-LE', respectively).
2.2. Precipitation observations
This study makes use of hourly and daily precipitation from rain gauges at observational sites for validation of model results. The hourly precipitation data were from the Norwegian Meteorological Institute through the eKlima data server (eKlima 2017), the Swedish Meteorological and Hydrological Institute through their portal for weather observations (SMHI 2017), the Royal Netherlands Meteorological Institute (KNMI 2017) and the MIDAS UK Hourly Rainfall Data catalogue (Met Office 2006). Daily precipitation data are taken from the non-blend version European Climate Assessment & Dataset (Klein Tank et al 2002). For the United Kingdom, daily precipitation was calculated based on the observed hourly precipitation.
2.3. Definitions of regions and precipitation extremes
The four high-resolution domains simulated by WRF cover southern Norway (hereafter 'S Norway'), Denmark incl. Southern Sweden and Northern Germany ('Denmark'), Benelux incl. Northern France and Southeast England ('Benelux'), and the Balkans focused on Albania ('Albania'). The extent of the domains, minus a boundary of 10 grid cells, is shown in figure 1 (figure S1 is available online at stacks.iop.org/ERL/14/124050/mmedia for Albania) and corner points of the domains are given in table S4.

Figure 1. Comparison of (a), (c) Rx1day and (b), (d) Rx1hour between WRF downscaled from CESM1-CAM4 (filled contours in (a), (b)) and station observations (circles) for the June–September season in the period 1986–2005. Maps and scatter plots show means over the 20 year period while the histograms count the number of occurrences in each size bin for each of the 20 summer seasons. In the histograms and scatter plots, WRF data are extracted for the grid box that is closest to the rain gauge station. Plots are not shown for the Albania region due to very sparse observations (see figure S1 for map plots). Note the different scales in each plot.
Download figure:
Standard image High-resolution imageFor all model datasets, we have analyzed future changes in mean and extreme summer precipitation per °C global- and annual-mean near-surface temperature change from each GCM simulation (or driving GCM simulation in the case of the RCMs). Here, we define the extreme indices we have used, Rx1day/Rx1hour/Rx10min, as 20 year averages of the day/hour/10 min with highest precipitation amount during each summer season (JJAS).
3. Results and discussion
3.1. Evaluation of WRF simulations
Figure 1 shows comparisons between station observations and WRF model results for three of the four regions simulated at convection-permitting scales. Observed Rx1day is generally very well reproduced by WRF in terms of magnitude and distribution, except for an overestimation of Rx1day along the west coast of S Norway and parts of Northern Germany (figures 1(a), (c)). A WRF simulation driven with reanalysis data instead of free-running climate data improves the comparison against observations for the S Norway region (figure S2). The overestimation is larger for mean summer precipitation than for Rx1day (figure S3). Further inspection shows that the altitude of the WRF grid box closest to each observation station is in many cases several hundred meters higher than the actual altitude of the station (figure S4). Stations are often located in valleys where there is less precipitation. This indicates that an even higher resolution than 3 km may be needed to properly resolve the complex terrain in S Norway. For the Albania domain, the very few stations that exist indicate an underestimation of Rx1day and mean precipitation by WRF (figures S1 and S3).
Moving from Rx1day to Rx1hour, we see that the spatial distribution is quite different, especially in S Norway (figure 1(b)). This is because maximum hourly compared to daily precipitation amounts during summer are more often a result of intense convective events. Comparison with station observations for Rx1hour shows that WRF is again slightly overestimated for S Norway, but compares very well for the other two regions (no hourly observations could be obtained for the Albania region) (figures 1(b), (d)).
3.2. CMIP5 analysis of precipitation and evaporation
Considering the strong regional differences in projections of mean summer precipitation in Europe (see section 1), analysis of the CMIP5 model projections, their water budget and how they agree over Europe, could give some more insight and be useful to have in mind before analyzing future precipitation projections from WRF. Figure 2(a) shows that future projections of mean summer precipitation are divided into three zones: an area of robust increase in the north, robust decrease in the south, and a transition zone in central Europe with large model diversity. Compared with annual mean precipitation changes (figure S5), this transition zone is located further north, and the region of precipitation decrease is more prominent and covers a larger area in Europe during the summer. The large inter-model standard deviation over central Europe seems greatest over the Alps (figure S6), indicating perhaps that the models' representation of orographic precipitation leads to larger uncertainty. In terms of extreme Rx1day precipitation, models agree on an annual increase in most of Europe, while uncertainties are large for Central and Southern Europe for the summer season (figure S5).
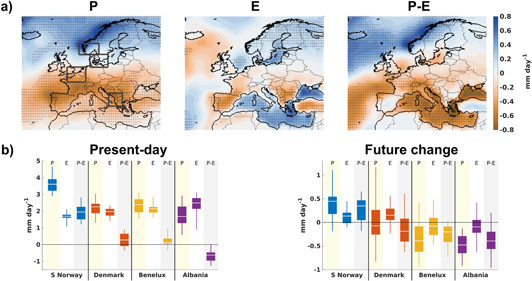
Figure 2. (a) Future change in precipitation (P), evaporation (E) and P–E (unit: mm day−1) in 2081–2100 (RCP8.5) versus 1986–2005 (JJAS season) from an ensemble of CMIP5 models. Symbols indicate agreement between models (where the model mean absolute change is higher than the standard deviation across models). (b) Boxplot showing JJAS season present-day P, E and P–E, and future 2081–2100 (RCP8.5) versus 1986–2005 change for the four focus regions (see grey boxes in a). Boxes show the 25th and 75th percentiles and whiskers show the minimum and maximum value from the CMIP5 models. In contrast to the other figures, ocean grid boxes are included in this analysis.
Download figure:
Standard image High-resolution imageThe net surface water budget, or precipitation minus evaporation (P–E) (e.g. Byrne and O'Gorman 2015), shows to a large extent the same pattern as for precipitation, but is modulated by evaporation changes, which show a strong land-ocean contrast over southern Europe (figure 2(a)). This leads to less drying over land for P–E compared with the pure precipitation changes, and the opposite over the Mediterranean Sea. Contrasted with present-day P–E conditions (figure S6), we see a strong tendency of the so-called 'wet-get-wetter, dry-get-drier' conditions, except over land in central Europe, and this is also seen for S Norway ('wet-get-wetter') and Albania ('dry-get-drier') in figure 2(b). In general, present-day and future change in evaporation shows higher agreement between models compared to precipitation and P–E (figure 2(b)). Except for S Norway, uncertainties are much larger for the summer season compared to the annual mean (figures 2(b); S7). The drying over the Albania region is striking—it is the only one among the four regions where the change in summer precipitation is robustly different from zero, and the model-median decrease is large with around 25% of the present-day value. Drying in the Mediterranean region has already been observed over the last decades, and has mainly been attributed to changes in horizontal energy transport and a shift in the jet stream, due to increased concentrations of well-mixed greenhouse gases (Tang et al 2018).
3.3. Mean and extreme precipitation changes from GCMs and RCMs
In figure 3 we show averages over the four regions for mean and extreme precipitation, and for several models and resolutions (results for JJA and September separately are shown in figure S8). Most models show a future decrease in mean precipitation, but with some diversity in the sign of the change between CMIP5 models for the regions located in northern/central Europe. In terms of dry summers, all model medians show clear indications of more dry summers in the future, with stronger precipitation decreases in the 1-in-20-year driest (JJA) summer compared with the 20 year summer average precipitation (figure S8).
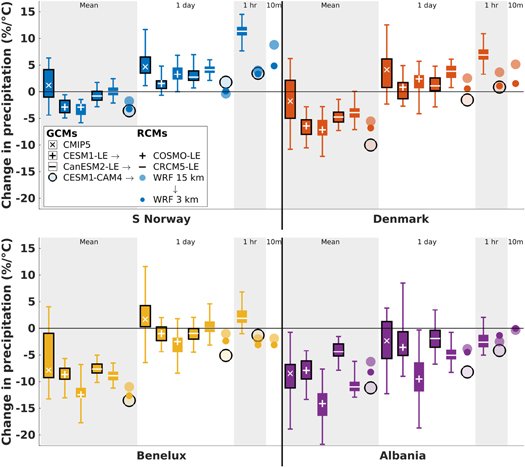
Figure 3. Relative change in mean and extreme precipitation per degree global- and annual-mean near-surface temperature change (%/°C) in 2081–2100 (RCP8.5) versus 1986–2005 (JJAS) from different models and averaged over the four regions (land-only) shown in figure 4 and averaged over the 20 years. Boxplots illustrate the spread between models (CMIP5) and ensemble members (CESM1-LE, COSMO-LE, CanESM2-LE, and CRCM5-LE) with boxes showing the 25th and 75th percentiles and whiskers showing the minimum and maximum value. Relative changes in % are calculated after taking the regional mean of absolute precipitation values. CMIP5, CESM1-LE, COSMO-LE and CanESM2-LE are only available for mean and Rx1day, and only WRF results are available for Rx10min.
Download figure:
Standard image High-resolution imageWhen going from changes in mean to daily (Rx1day) extreme precipitation (figure 3), there is an intensification, or less reduction, for all models and regions. The signals of reduced future mean and increased Rx1day precipitation have been found for Western Europe in a single-model large-ensemble RCM study (Aalbers et al 2018). Further analysis of CMIP5 results shows that this intensification is also very clear for mid-century (2041–2060) but that the model spread is larger due to a weaker climate change signal compared to the end-of-the-century (figure S9). For nearly all regions and models, there is an intensification (or less reduction in regions with negative Rx1day change) when going from daily to hourly (Rx1hour) extreme precipitation (figure 3), and this is much more evident for CRCM5-LE than CESM1-CAM4 and WRF, including the WRF results at comparable resolution (15 km) as CRCM5-LE (12 km). However, the ability to simulate sub-daily precipitation in models with parameterized convection is questionable, and, for a given realization, more confidence should be given to WRF 3 km. When going from hourly to sub-hourly (Rx10min) extremes, available in WRF only, there is a further intensification for all regions except Benelux.
Uncertainties are in most cases dominated by the variation between different models (CMIP5), but natural variability, represented in figure 3 by the two large ensemble studies CESM1-LE/COSMO-LE and CanESM2-LE/CRCM5-LE, can also be large, e.g. spanning from −17 to 0%/°C for Rx1day over Albania for COSMO-LE. To investigate whether 2 × 20 summer seasons are enough to get robust results and get an indication of the influence of natural variability, which may be especially important for WRF since it is based on a single realization, we have analyzed the first and last ten summer seasons separately (see alternative versions of figure 3 in figure S10). We still find a consistent upward trend in the precipitation change versus duration, and this strongly indicates that our result of an intensification of precipitation with shorter time-scales, based on 20 summer seasons, is robust.
3.4. Precipitation changes from convection-permitting WRF simulations
An interesting question is whether the convection-permitting model results (WRF 3 km) are notably different from the simulations in which convection is parameterized (WRF 15 km). With only a few exceptions (e.g. Rx1hour for Albania), the 3 km resolution results seem to have slightly lower values, i.e. smaller future increases and larger reductions, than the 15 km results (figure 3). However, the relatively coarse resolution driving model (i.e. CESM1-CAM4) shows in most cases even lower values than WRF 3 km, and this makes it difficult to conclude that there is a clear dependence on model resolution. Other factors than resolution can also lead to differences between CESM1-CAM4 and WRF results. Nevertheless, the convection-permitting WRF 3 km results do not differ greatly from its driving GCM, and the same is true for the two other RCMs, COSMO-LE and CRCM5-LE, and their driving models.
Separating the JJAS summer season into JJA and September, which is normally an autumn month in northern Europe, shows that the level of intensification when going from changes in daily to sub-daily extreme precipitation in WRF 3 km is more evident for September than JJA (figure S8). Previous research has shown that Rx1day will occur later in the year (Marelle et al 2018), and a subject for future research would be to investigate the robustness of the intensification across different seasons, and to see whether the close correspondence between the convection-permitting simulations and their driving data applies to other seasons.
Figure 4 shows that the future decrease in summer (JJAS) mean precipitation from WRF is evident throughout all four regions, except for the west coast of S Norway and parts of the Balkan Peninsula. It also shows that the projected decrease is less strong for the regions located furthest to the north (S Norway and Denmark). As for CMIP5 (figure S5), this decrease is not so evident for Rx1day, and an increase is projected in many areas. In WRF, some of the strongest increases in Rx1day seem to occur on mountain lee sides (north in the S Norway and Albania domains) (figure 4), where Rx1day in the historical period is lower than in its surroundings (figures 1; S1). The further intensification for shorter duration extremes, Rx1hour and Rx10min, is most pronounced for the two northernmost regions (S Norway and Denmark) (figure 4). Interestingly, there does not seem to be major differences in the intensification with shorter time-scales between regions of different weather regimes, such as between the low-altitude Denmark region and the S Norway region, where the western part is dominated by orographic precipitation and the eastern part is on the mountain lee side. Increases in short-duration extremes, which are more dominated by convection than for mean precipitation, would be consistent with the already observed increase in convective precipitation (and decrease in non-convective precipitation) over Eurasia (Ye et al 2017).
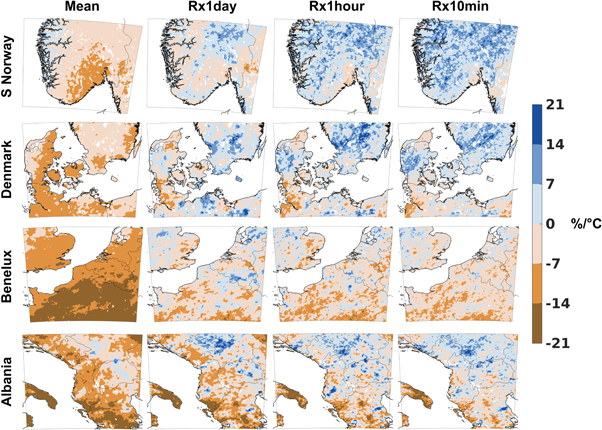
Figure 4. Relative change in mean and extreme precipitation in 2081–2100 (RCP8.5) versus 1986–2005 (JJAS season) from WRF for each of the four high-resolution (3 km) regions. The results have been normalized by the global- and annual mean temperature change of 3.1 °C from the driving model (CESM1-CAM4) over the given period.
Download figure:
Standard image High-resolution imageSoil moisture can be an important driver of convection and how this variable is initialized in the WRF model is important. The effect of running WRF in seasonal time slices with one month of spin-up (see section 2.1) rather than simulations with a longer spin-up period has been investigated at 15 km resolution (table S5), and these results indicate that our main results and conclusions are not likely to be altered if a longer spin-up period would be used.
3.5. Clausius–Clapeyron versus superadiabatic scaling
Our results show future increases in Rx1day, Rx1hour and Rx10min extreme indices from WRF 3 km of 5%/°C or less for all four regions (figure 3). The corresponding number is 6%/°C or less when the extreme indices are calculated as 1-in-20 year maximums rather than 20 year averages of these extreme indices (figure S8). Spatially, the projected changes in extremes are also in general below 7%/°C and only exceed this value locally over small areas, most notably in the S Norway and Denmark regions (figure 4). Thus, there is no direct indication of superadiabatic (>7%/°C) scaling, a finding that is in agreement with Ban et al (2015) and in contrast to Kendon et al (2014, 2019). Part of the reason could be that both Ban et al (2015) and this study have investigated summer seasons for regions with a relatively strong decrease projected for mean precipitation, and this implies the need for further investigating mechanisms of any relationship between seasonal mean and extreme precipitation changes.
3.6. Changes in the heaviest extreme precipitation events
In figure S8, the convection-permitting model results (WRF 3 km) show that the 1-in-20-year maximum for all extreme indices (Rx1day, Rx1hour and Rx10min) and nearly all regions (both JJA and September) increase more than the 20 year average of these extreme indices and are only rarely below zero. This strongly indicates that the extremes of the extremes increase more than the mean of extremes.
An interesting metric that has not been given much attention before, but could be of importance for society, is how the heaviest local precipitation event in a region may change in a future climate. The WRF results show that the precipitation amount in the land gridbox with the maximum summer Rx1day event throughout the entire 20 year period increases at around 10%–20%/°C depending on the region (figure 5). While this increase is based on only one value from each of the 20-year simulations, results for N = 10 (the 10 most extreme local precipitation events) are similar, indicating that the increase of 10%–20%/°C is a fairly robust result. For higher values of N, the change in precipitation is lower and approaches zero, consistent with the projected decrease in mean precipitation.

Figure 5. Relative change in the most extreme 1-in-20-year seasonal (JJAS) daily precipitation events locally over land from the WRF 3 km results. N is number of events, and for N = 1, the land gridbox with the highest 1 d precipitation amount in 1986–2005 has been compared with the land gridbox with the highest 1 d precipitation amount in 2081–2100 (RCP8.5). For N > 1, the relative change has been calculated based on means of daily precipitation for the top N number of events. The total number of datapoints in each region is approximately 5 × 10⁷ (2440 days × 20 713 land grid boxes), 5 × 10⁷, 8 × 10⁷ and 5 × 10⁷ for S Norway, Denmark, Benelux and Albania, respectively. The results have been normalized by the global- and annual mean temperature change of 3.1 °C from the driving model (CESM1-CAM4) over the given period.
Download figure:
Standard image High-resolution image
3.7. Effect of temperature scaling and choice of extreme indices
Previous modelling studies have often used the local or regional (dew point) temperature when scaling with precipitation (Kendon et al 2014, Ban et al 2015, Kendon et al 2019) and observational studies typically use local daily mean (dew point) temperature to derive precipitation scaling (Lenderink and van Meijgaard 2008, 2010, Shaw et al 2011, Loriaux et al 2013). We have scaled precipitation with the global and annual mean temperature because precipitation is constrained by the global energy budget (e.g. O'Gorman et al 2012) and because local temperature does not necessarily represent the origin of the air masses leading to extreme precipitation. For the WRF results, we have tested the effect of using the seasonal mean temperature for each region, instead of the global and annual mean, and find only small differences. The magnitude of precipitation changes is larger in S Norway, smaller in Albania, and almost unchanged in the two other regions, but Rx10min for S Norway still does not show superadiabatic scaling (now 6.4%/°C compared to 4.8%/°C when scaling with global and annual mean temperature change) (not shown).
While the Rx1day extreme index is widely used, many previous studies (including Kendon et al 2014, Ban et al 2015, Kendon et al 2019) have calculated future changes in extremes using percentiles. We have tested the effect of analyzing percentile indices instead of Rx1day, Rx1hour and Rx10min in the WRF results and find only small differences when choosing percentiles that correspond to extreme precipitation events occurring, on average, once every summer (JJAS) (figure S11). In fact, all four regions show a further intensification of extremes for sub-daily and sub-hourly extremes when using percentiles.
4. Summary and conclusions
We demonstrate that the regional WRF model run at convection-permitting scale (3 km) is able to reproduce the spatial distribution and magnitude of mean and daily and hourly extreme precipitation over selected regions in Europe during summer. Consistent with earlier findings, a widespread future decrease in mean summer precipitation is projected, particularly in southern Europe. A wide range of models strongly indicate that the 1-in-20-year driest summer will experience a much stronger precipitation reduction than the 20 year summer mean.
In all four focus regions, GCMs and RCMs show that daily extreme precipitation intensifies compared to the mean (including a less negative change where the mean is negative). While this analysis is focused on an end-of-the-century high greenhouse gas emission scenario, we find similar intensification for the mid-century in CMIP5. For three out of four regions, there is a further intensification of sub-daily extremes compared to daily extremes in our convection-permitting results, but there is no sign of superadiabatic (>7%/°C) scaling. Unlike most studies we have also investigated sub-hourly (i.e. 10 min) precipitation extremes, and find a further intensification compared to changes in sub-daily extremes in three out of four regions. While the regional means do not show superadiabatic scaling, values >7%/°C can be seen in part of the regions, and the most extreme local 1-in-20-year Rx1day events increase at 10%–20%/°C.
An important finding is that the intensification does not differ greatly between the RCMs and their driving GCMs, even for the convection-permitting simulations, but that different models can show quite different results for different regions. Results from two RCM large-ensembles show that natural variability can have a relatively large influence on the results even when the climate forcing is strong (RCP8.5). Still, the result of an upward trend in extreme precipitation change for shorter event duration is robust across the regions and for all models.
Acknowledgments
The work has received support from the projects SUPER (no. 250573) and HYPRE (243942) funded through the Research Council of Norway, and supercomputing resources have been provided by NOTUR (nn9188k). SUPER is also partly funded through the insurance company If, and HYPRE is partly funded through the hydropower company Statkraft. We acknowledge the open data on hourly precipitation provided by the Swedish Meteorological and Hydrological Institute (SMHI), by the Norwegian Meteorological Institute via the eKlima.no server, by the Royal Netherlands Meteorological Institute (KNMI) and by the UK Met Office through the Met Office Integrated Data Archive System (MIDAS). We further acknowledge the data providers in the ECA&D project (www.ecad.eu). We acknowledge the World Climate Research Programme's Working Group on Coupled Modelling, which is responsible for CMIP, and we thank the climate modeling groups for producing and making available their model output. For CMIP the US Department of Energy's Program for Climate Model Diagnosis and Intercomparison provides coordinating support and led development of software infrastructure in partnership with the Global Organization for Earth System Science Portals. We thank three anonymous reviewers for valuable comments that helped improved the manuscript substantially.
Data availability statement
The CESM and WRF data that support the findings of this study are openly available at http://doi.org/10.11582/2019.00027. The CMIP5 data are available at http://pcmdi9.llnl.gov/. The CRCM5-LE was made available through the ClimEx project and data are available at http://www.climex-project.org/en/data-access?language=en. The ClimEx project is funded by the Bavarian State Ministry for the Environment and Consumer Protection. The COSMO data are available upon request and people are welcome to contact Erich Fischer (erich.fischer@env.ethz.ch) to get either processed or raw data.