

Abstract
Groundwater forms the basis of water supplies across much of Africa and its development is rising as demand for secure water increases. Recharge rates are a key component for assessing groundwater development potential, but have not been mapped across Africa, other than from global models. Here we quantify long-term average (LTA) distributed groundwater recharge rates across Africa for the period 1970–2019 from 134 ground-based estimates and upscaled statistically. Natural diffuse and local focussed recharge, where this mechanism is widespread, are included but discrete leakage from large rivers, lakes or from irrigation are excluded. We find that measurable LTA recharge is found in most environments with average decadal recharge depths in arid and semi-arid areas of 60 mm (30–140 mm) and 200 mm (90–430 mm) respectively. A linear mixed model shows that at the scale of the African continent only LTA rainfall is related to LTA recharge—the inclusion of other climate and terrestrial factors do not improve the model. Kriging methods indicate spatial dependency to 900 km suggesting that factors other than LTA rainfall are important at local scales. We estimate that average decadal recharge in Africa is 15 000 km3 (4900–45 000 km3), approximately 2% of estimated groundwater storage across the continent, but is characterised by stark variability between high-storage/low-recharge sedimentary aquifers in North Africa, and low-storage/high-recharge weathered crystalline-rock aquifers across much of tropical Africa. African water security is greatly enhanced by this distribution, as many countries with low recharge possess substantial groundwater storage, whereas countries with low storage experience high, regular recharge. The dataset provides a first, ground-based approximation of the renewability of groundwater storage in Africa and can be used to refine and validate global and continental hydrological models while also providing a baseline against future change.
Export citation and abstract BibTeX RIS

Original content from this work may be used under the terms of the Creative Commons Attribution 4.0 license. Any further distribution of this work must maintain attribution to the author(s) and the title of the work, journal citation and DOI.
1. Introduction
Quantifying the rate of groundwater recharge is fundamental to assessing current water security and help forecast future changes (Taylor et al 2013a, Gleeson et al 2020). However, recharge is a hydrological parameter that is difficult to quantify accurately (Scanlon et al 2002, Healy 2010). In Africa, where considerable groundwater resources exist (MacDonald et al 2012), groundwater south of the Sahara has not yet been widely exploited other than for low-yielding drinking-water supplies (WHO and UNICEF 2015). Only 1% of the cultivated land of Africa is estimated to be irrigated by groundwater (Siebert et al 2010); 80% of this occurs in North Africa. Across the continent there is no recent evidence of significant widespread decline in groundwater storage in regional aquifers (Bonsor et al 2018) but localised depletion, particularly in urban areas, has been observed (Adelana et al 2008, Oiro et al 2020).
Rapid population growth and development in many African countries, together with the increasing availability of solar powered pumps (Wu et al 2017) have now focused attention on increased development of groundwater for irrigation and piped drinking-water supplies (Gaye and Tindimugaya 2019, Cobbing 2020). In many other parts of the world, rapid increases in groundwater abstraction have led to unsustainable conditions, characterised by falling water tables and problems with water quality (Scanlon et al 2012, MacDonald et al 2016, Rodell et al 2018). Consequently, reliance alone on maps of groundwater storage and aquifer permeability is insufficient to inform effective governance and investment decisions (Edmunds 2012). Quantifying the scale of groundwater recharge is required to characterise the resilience of groundwater supplies to both increased abstraction and climate change.
Estimating groundwater recharge is challenging with no widely applicable method available that can directly and accurately quantify the volume of rainwater that reaches the water table (Scanlon et al 2002, Healy 2010). Instead, several different methods are relied upon to estimate recharge. The most common are: chloride mass balance (CMB); soil physics methods; environmental and isotopic tracers; groundwater-level fluctuation methods; water balance (WB) methods (including groundwater models (GMs)); and the estimation of baseflow (BF) to rivers. Regional, continental and global estimates of recharge commonly derive from global hydrological models (e.g. Döll and Fiedler 2008) and have proved useful in providing a first estimate of the likely magnitude of groundwater recharge compared to surface water. However, global models have been shown to be unreliable at predicting long-term trends in groundwater storage when compared to variations in terrestrial water storage measured using GRACE (Scanlon et al 2018). There is therefore renewed interest in using ground-based estimates of groundwater recharge to constrain global models (e.g. Mohan et al 2017, Moeck et al 2020) and to provide an independent estimate of groundwater recharge rates. However, to aggregate and map recharge from a meta-analysis of published, ground-based studies is challenging, as these can feature spatial and temporal biases, duplicate studies, and inappropriate applications of recharge methodologies.
Africa has a long history of groundwater recharge research with three areas particularly well studied. In southern Africa (Xu and Beekman 2003, 2019, Abiye 2017) and particularly the Kalahari desert (the site of several long-term research projects (Verhagen et al 1974, de Vries et al 2000)), work has focussed on the role of vegetation and rainfall intensity on controlling recharge. The North African sedimentary basins have benefited from many research projects in collaboration with the International Atomic Energy Agency primarily examining paleo recharge during wetter climates (Edmunds and Wright 1979, Guendouz et al 2003, Sturchio et al 2004) and localised depletion, for example in Morocco (Bouchaou et al 2008). Finally, research continues in the Sudano-Sahel of West Africa where research focuses on the impact of land clearing and coupling between groundwater and climate (Edmunds and Gaye 1994, Leduc et al 2001, Leblanc et al 2008, Favreau et al 2009). Recent research, focussed on groundwater-level responses to rainfall, has illustrated the complexity and episodic nature of recharge, and its large year-to-year variability particularly in drylands (Taylor et al 2013b, Cuthbert et al 2019a). Characterising the resilience of groundwater systems is therefore more meaningful using recharge volumes evaluated over decades, rather than annual, time periods.
Groundwater recharge can occur through diffuse or focused mechanisms (Lerner et al 1990, Healy 2010). Diffuse recharge occurs when precipitation infiltrates through the soil to the water table, and is by definition distributed over large areas. Focussed recharge occurs where water leaks from surface water sources (rivers, lakes, wadis, wetlands) or land surface depressions, and generally becomes more dominant with aridity (Scanlon et al 2006, Cuthbert et al 2019a). Focussed recharge can be widely distributed where ephemeral rivers, depressions or rock fractures are common over a large area and contribute to regional recharge (e.g. parts of the Sahel (Leduc et al 2001)) or discrete, where an individual river or water body provides significant local recharge (e.g. the Nile (Aly et al 1993)). Groundwater recharge can also be significantly enhanced by returns from irrigation (Scanlon et al 2010) or from urban areas (Lapworth et al 2017).
Here we quantify long-term (multi-decadal) distributed natural groundwater recharge volumes for Africa for the period 1970–2019 by mapping existing estimates from ground-based studies. We include both diffuse and focussed recharge where this is widespread, since many methods cannot distinguish which process dominates; estimates of focussed recharge from an identified large discrete feature such as a river or lake are excluded. A quality assurance procedure was used to provide a robust dataset of 134 long-term estimates that minimised duplication. These estimates were then related to a range of climatic and terrestrial parameters to scale across the African continent. The results are used to discuss water security implications for different African countries.
2. Methods
2.1. Collating recharge studies
We developed a database of existing recharge studies for Africa. Recharge studies were compiled using published and grey literature identified from online databases, Google Scholar® and the Africa Groundwater Atlas (accessed May 2020) for the period 1970–2019, supplemented from the authors' personal databases and knowledge. For each study, meta-data including the time period of the recharge estimate, the geographic extent of the study, and an accurate geolocation checked using aerial photography from Google Maps®. Long-term average recharge (LTA recharge) values were recorded for each study area along with the employed methods noting the primary and secondary methods used. Each study was critically reviewed and given a confidence rating based on the number and type of methods applied, the quality of the application of the methods, and the number of sites included in the study (see supplementary data for more information (available online at stacks.iop.org/ERL/16/034012/mmedia)). A range of uncertainty was also included for each study: for studies with many measurements uncertainty was often the quoted standard deviation, interquartile range (IQR), or range; where studies noted uncertainty in input factors (such as specific yield or rainfall chloride) these were included in calculating the uncertainty. Estimates of groundwater recharge are inherently uncertain due to the assumptions made, therefore particular care was taken to exclude studies where the assumptions were invalid, and uncertainty was reduced when multiple independent methods were applied.
Different recharge-estimation methods included: CMB; water-table fluctuation (WTF) methods; environmental tracers (EnTs); WB; calibrated GMs; BF; and soil physics methods. Studies of groundwater recharge explicitly from river or lake infiltration, irrigation returns or urban leakage were excluded, leaving only studies representing distributed recharge from rainfall, which can include both diffuse and distributed focussed pathways. After the database was completed, studies for individual countries were assessed together to identify and remove duplicates; preference was given to syntheses and studies with higher confidence ratings. Studies with lower confidence were retained if no other study had been repeated at the location. Records in the final dataset had equal weighting in the analysis.
2.2. Sources of additional African data
An analysis in a geographical information system (GIS) was then used to attribute various physical parameters known from previous studies to have an influence on groundwater recharge: long-term (1981–2010) climate data (Harris and Osborn 2020) (LTA rainfall, aridity index, number of wet days in a year, potential evapotranspiration (PET)); aquifer domain (MacDonald et al 2012), land cover (Arino et al 2007); the reference soil group as mapped in the Soil Atlas of Africa (Jones et al 2013), and normalised difference vegetation index (NDVI) (Didan et al 2015). Maps of these data are shown in the supplementary material. Each of these parameters were used in the linear mixed model (LMM) described below.
2.3. Statistical analysis
We required a statistical model which used a suitable subset of the measured covariates to predict LTA recharge at unsampled sites so that LTA Recharge could be mapped at continental scale. It was necessary to use an approach that was suitable for data with significant clustering (and therefore not an independent random sample) and that also selected a subset of predictor variables without over-fitting. To achieve this we used an LMM. Technical details are given in supplementary material and by Lark et al (2006). In an LMM a variable is modelled as a combination of fixed effects and random effects. The fixed effects define the expected value of the dependent variable given values of covariates (including categorical variables such as aquifer domain or soil group, and continuous ones such as LTA rainfall). The fixed effects therefore constitute a regression-type model.
Random effects in the LMM comprised a spatially dependent Gaussian random variable, and an independent error term (see supplementary material). The spatial term accounts for variability in LTA recharge observations around the fitted value, given that fixed effects are likely to be spatially dependent such that observations at nearby locations are expected to be more similar than those further apart. The independent error term accounts for factors such as error in the processes of estimating LTA recharge at a site, as well as any fine-scale sources of variation in the variable which are not resolved by the spatial distribution of the sample locations.
To fit the LMM, the parameters of the random effects were first estimated by residual maximum likelihood. The parameters of the fixed effects were then estimated by generalised least squares (Lark et al 2006). To select the final subset from predictors listed above, we considered predictors sequentially, starting with a simple 'null' model in which the only fixed effect was a constant mean value. A model with the first predictor was then fitted, and the strength of evidence that the predictor should be retained was assessed by a log-likelihood ratio (LLR) test following Welham and Thompson (1997). A continuous predictor would appear in the model as a regression-type predictor with an estimated coefficient. A categorical predictor (such as soil group) would appear in the model as a set of different intercept terms for the prediction. If a categorical predictor was accepted by the LLR test, then its interactions with continuous predictors already in the model would be tested next. Once all predictors had been considered, the evidence for each one included was reassessed against a threshold for the P-value determined to control the false discovery rate (FDR) over all tests conducted. The FDR is the probability that a predictor which has no relation to the target variable is incorrectly regarded as significant within a set of multiple hypothesis tests. We followed the approach described by Lark (2017) to maximise power to detect meaningful predictors while controlling FDR by ordering the initial sequence of predictors so that those thought most likely to be predictive were considered first.
The final model was then used to compute the empirical best linear unbiased prediction (E-BLUP) of LTA recharge at unsampled sites on a prediction grid. The E-BLUP combines the predicted value from the fixed effects with an interpolation of the random effect by a kriging-type predictor. The E-BLUP thus minimises the expected squared prediction error (prediction error variance), and computes this value as a measure of uncertainty. After an exploratory least-squares fit of a model with all predictors, and examination of the distribution of residuals, we transformed LTA recharge to natural logarithms to make the assumption of Gaussian errors plausible; continuous predictors were also transformed to logarithms because of their marked skewness. The prediction was back-transformed to the original scales of measurement by exponentiation, which gives a median-unbiased prediction, appropriate for skewed variables.
2.4. Water security analysis
Average decadal groundwater recharge was subsequently calculated for each African country with uncertainty characterised by the prediction error variance of the best linear unbiased predictor. Groundwater recharge was then compared with published estimates of groundwater storage for each country (MacDonald et al 2012) to form a basis to discuss water security in terms of a combination of LTA recharge and storage (Foster and MacDonald 2014).
3. Results
3.1. Summary of groundwater recharge data
A total of 134 separate studies with robust quantitative LTA recharge data were identified for Africa. Figure 1 shows their location and the primary method employed in their analysis of recharge (MacDonald et al 2020). In arid, semi-arid and dry sub-humid areas, CMB was the most commonly applied method whereas EnT (such as tritium) and WTF methods were the most common methods in arid and humid areas respectively. However, 75% of the studies used two or more methods to estimate recharge, with CMB and EnT representing the most common combination. Studies are generally well distributed across Africa, though there is a relative dearth of studies in humid areas, such as the Congo basin, coastal West Africa, and southeastern Africa including Madagascar. Most arid and semi-arid areas are well represented with the exception of the Horn of Africa (figure 1).

Figure 1. The distribution of quantitative recharge studies for Africa; (a) map of the location of the studies; (b) the number of studies according to aridity of study location; and (c) the type of methodologies used for calculating recharge.
Download figure:
Standard image High-resolution imageMeasurable modern groundwater recharge was found in studies across much of Africa and rates decrease with aridity (figure 2). Although recharge is not detected in the majority of studies in hyper-arid areas, 40% of studies indicated some measurable recharge, and was generally associated with episodic rainfall and wadi infiltration (Edmunds et al 1992, Gonçalvès et al 2013). In arid and semi-arid climates, some component of modern groundwater recharge was detected in all studies, with median values of 60 mm (IQR 30–140 mm) and 200 mm (IQR 90–430 mm) respectively decade−1, although recharge rarely occurred every year but was episodic (e.g. Taylor et al 2013b). In dry sub humid and humid areas groundwater recharge is significantly higher and recharge is recorded to occur during most years (figure 2): dry sub humid 920 mm (IQR 480–1600 mm) decade−1; humid 1300 mm (IQR 760–2200 mm) decade−1.

Figure 2. Long-term average (LTA) groundwater recharge for Africa from in situ studies; (a) map of LTA recharge according to aridity zone; (b) cumulative frequency plot of LTA recharge for each aridity zone; and (c) table of percentiles of recharge estimates.
Download figure:
Standard image High-resolution image3.2. Mapping groundwater recharge across Africa
Table 1 shows the results for successive addition of predictors in the fixed effects of the model. In row one of the table, a model with loge LTA rainfall as the only predictor is tested against the null model with the only fixed effect a constant mean (µ). The LLR is a measure of the strength of evidence against the null model, with larger values reflecting stronger evidence. The P-value (≪0.0001) indicates the low probability that there is evidence to support the preference of the null model, therefore loge LTA rainfall is retained. In the next row a model in which loge PET is added as a second predictor is tested against the alternative model with LTA rainfall only. In this, and for all subsequent predictors considered, the evidence to retain the new predictor is weak. Because none of the categorical predictors were included, their interaction with LTA rainfall was not considered. Applying the FDA control, only LTA rainfall was retained as a predictor in the model. The final fixed effect model therefore takes the form of equation (1):

Table 1. Sequence of linear mixed models for LTA recharge with log-likelihood ratio (LLR) test and probability (p-value) for the addition of each new predictor to a null model.
| Model | Null model | LLR | P-value | |
|---|---|---|---|---|
| 1 | loge LTA rainfall | μ | 48.20 | ≪0.0001 |
| 2 | loge LTA rainfall + loge LTA PET | loge LTA rainfall | 1.47 | 0.225 |
| 3 | loge LTA rainfall + soil group | loge LTA rainfall | 10.04 | 0.968 |
| 4 | loge LTA rainfall + aquifer domain | loge LTA rainfall | 1.05 | 0.593 |
| 5 | loge LTA rainfall + loge NDVI | loge LTA rainfall | 3.28 | 0.070 |
| 6 | loge LTA rainfall + loge LTA wet days | loge LTA rainfall | 0.90 | 0.344 |
| 7 | log LTA rainfall + loge LTA aridity | loge LTA rainfall | 1.48 | 0.224 |
where β0 is −5 and β1 is 1.388 (table 2). Random effects parameter estimates are also shown for the overall null model where a constant mean is the only fixed effect and for the selected model. Spatially correlated random effects showspatial dependence up to distances approximately three times the distance parameter, φ (see supplementary material). Using a constant mean as the only fixed effect there is spatial dependence in the LTA recharge data at distances up to approximately 6000 km (reflecting the spatial dependence of long-term climatic trends). The spatial dependence of the random variation after including LTA rainfall as a predictor is restricted to a shorter range of 900 km. The term c1 is the variance of this spatially correlated random effect. Note that c1 is much reduced on inclusion of rainfall as a fixed effect. The term c0 is the variance of the uncorrelated random error. The adjusted R2 for the model, computed from the reduction in random variance on inclusion of the fixed effect, is 0.82. This is the proportion of the variance in loge LTA recharge accounted for by including LTA rainfall in the model. The non-linearity in the relationship between LTA rainfall and LTA recharge represented by the model is consistent with ground-based studies highlighting the disproportionate contribution of heavy rainfall to groundwater recharge in Africa (e.g. Taylor et al 2013b, Cuthbert et al 2019a, Banks et al 2020).
Table 2. Parameters for the selected model.
| Fixed effects parameters | |||||||
|---|---|---|---|---|---|---|---|
| Parameter | Estimate | Standard error | |||||
| β0 | −5.00 | 0.574 | |||||
| β1 | 1.338 | 0.096 | |||||
| Random effects parameters | |||||||
| Fixed effects | κ | φ | c0 | c1 | R2 adj | ||
| ∼μ | 0.5 | 2001.1 | 0.551 | 6.203 | — | ||
| ∼loge [LTA rainfall] | 0.5 | 288.0 | 0.759 | 0.489 | 0.82 | ||
The LMM was used to produce the map of LTA recharge (figure 3) along with observed data for comparison. The mapped value at any location is obtained as a combination of the predicted value obtained by applying the model in equation (1) to the known LTA rainfall values, and a kriging-type prediction from the residuals for this fit to minimise the expected prediction error variance. Figure 3(b) plots the relationship between LTA recharge and LTA rainfall along with the modelled relationship and data from Cuthbert et al (2019a) for comparison. Recharge estimates are more uncertain in the wetter areas of Congo basin, coastal West Africa and Madagascar as there are no recharge observations where LTA rainfall exceeds 2000 mm a−1. Using this method the LTA decadal groundwater recharge for Africa is estimated to be 15 000 km3 (4900–45 000 km3). The range is the prediction error variance of E-BLUP.

Figure 3. LTA groundwater recharge for Africa; (a) map of best linear unbiased prediction of LTA recharge from observations and the fitted linear mixed model, with study values for comparison and (b) relationship between LTA groundwater recharge and LTA rainfall with data from Cuthbert et al (2019a) plotted for comparison, the only independent predictor was LTA rainfall.
Download figure:
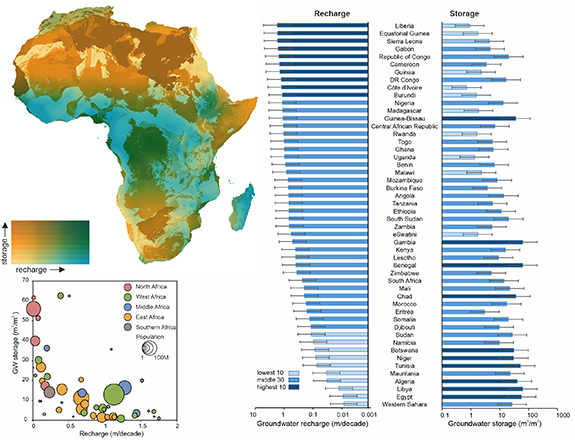
Standard image High-resolution imageThe countries with the lowest rates of distributed groundwater recharge flux are Western Sahara, Egypt, Libya, Algeria and Mauritania with less than 50 mm decade−1, and the highest groundwater recharge fluxes (>1500 mm decade−1) are found in Liberia, Equatorial Guinea, Sierra Leone, Gabon and the Republic of Congo. Figure 4 shows the LTA recharge volume for individual countries and table 3 reports the total recharge volume for each country along with the average decadal recharge depth.
Figure 4. Average groundwater recharge and groundwater storage for each African country; (a) map of LTA recharge and groundwater storage; (b) bar graph of recharge depth and groundwater storage m−2 with ten top and bottom countries highlighted and (c) cross plot of groundwater storage and recharge for African countries scaled by population of the country. Groundwater storage from MacDonald et al (2012).
Download figure:
Standard image High-resolution image
Table 3. Distributed groundwater recharge estimates for each African country, the range is the calculated prediction error variance. Groundwater storage from MacDonald et al (2012) is shown for comparison. Average annual recharge and storage per capita is also calculated.
| Recharge | Storage | Groundwater per capita | ||||||
|---|---|---|---|---|---|---|---|---|
| Country | Volume (km3 decade−1) | Depth (mm decade−1) | Volume (km3) | Annual recharge (m3) | Storage (×1000 m3) | |||
| Algeria | 75 | 24–220 | 33 | 10–96 | 92 000 | 56 000–243 000 | 170 | 2100 |
| Angola | 850 | 270–2600 | 680 | 220–2100 | 17 000 | 7800–46 500 | 2600 | 520 |
| Benin | 99 | 37–280 | 880 | 330–2500 | 720 | 320–2000 | 820 | 59 |
| Botswana | 49 | 17–140 | 84 | 30–240 | 18 000 | 9560–58 300 | 2100 | 7700 |
| Burkina Faso | 190 | 67–540 | 710 | 250–2000 | 980 | 319–3330 | 900 | 47 |
| Burundi | 35 | 12–100 | 1100 | 390–3300 | 47 | 8–183 | 290 | 3.9 |
| Cameroon | 650 | 220–1900 | 1400 | 490–4200 | 1600 | 667–4810 | 2500 | 59 |
| Cent African Rep | 660 | 210–2100 | 1100 | 340–3300 | 4200 | 1900–13 100 | 14 000 | 880 |
| Chad | 250 | 82–770 | 200 | 64–610 | 46 000 | 26 600–112 000 | 1500 | 2800 |
| Côte d'Ivoire | 410 | 140–1300 | 1200 | 400–3700 | 240 | 49–1020 | 1600 | 9.1 |
| Djibouti | 2.1 | 0.7–5.9 | 120 | 39–330 | 170 | 35–546 | 210 | 170 |
| DR Congo | 3000 | 970–9200 | 1300 | 410–3900 | 38 000 | 18 600–103 000 | 3300 | 430 |
| Egypt | 8.8 | 2.6–24 | 8.9 | 2.6–24 | 55 000 | 36 000–130 000 | 8.6 | 540 |
| Equatorial Guinea | 47 | 15–140 | 1700 | 530–4900 | 48 | 20–147 | 3300 | 34 |
| Eritrea | 18 | 6.3–56 | 160 | 56–490 | 330 | 94–1120 | 510 | 95 |
| eSwatini | 7.7 | 2.8–23 | 560 | 200–1700 | 24 | 6–104 | 660 | 21 |
| Ethiopia | 770 | 260–2200 | 670 | 220–2000 | 13 000 | 4340–39 300 | 670 | 110 |
| Gabon | 420 | 140–1300 | 1600 | 520–5000 | 1200 | 499–4190 | 19 000 | 550 |
| Gambia | 6 | 2.1–19 | 510 | 170–1600 | 750 | 498–1750 | 250 | 310 |
| Ghana | 230 | 80–660 | 970 | 340–2800 | 1400 | 369–4418 | 730 | 45 |
| Guinea | 340 | 110–1000 | 1400 | 460–4300 | 540 | 133–1935 | 2600 | 41 |
| Guinea-Bissau | 36 | 12–110 | 1100 | 350–3300 | 1200 | 742–2824 | 1800 | 600 |
| Kenya | 230 | 78–710 | 400 | 140–1200 | 8800 | 4090–23 300 | 430 | 160 |
| Lesotho | 13 | 4.3–37 | 400 | 130–1200 | 290 | 78–936 | 620 | 140 |
| Liberia | 170 | 55–530 | 1800 | 580–5600 | 86 | 25–333 | 3300 | 17 |
| Libya | 20 | 6.3–58 | 13 | 3.9–36 | 100 000 | 64 600–234 000 | 300 | 15 000 |
| Madagascar | 640 | 200–2000 | 1100 | 350–3400 | 1100 | 207–4160 | 2300 | 38 |
| Malawi | 98 | 33–300 | 840 | 280–2500 | 270 | 91–885 | 510 | 14 |
| Mali | 250 | 86–750 | 200 | 69–610 | 27 000 | 10 600–87 000 | 1200 | 1300 |
| Mauritania | 36 | 12–110 | 34 | 12–110 | 23 000 | 10 500–67 200 | 770 | 5100 |
| Morocco | 74 | 24–220 | 170 | 56–500 | 7400 | 3970–20 700 | 200 | 200 |
| Mozambique | 560 | 180–1700 | 720 | 240–2200 | 6300 | 2684–20 300 | 1800 | 200 |
| Namibia | 79 | 27–220 | 97 | 33–270 | 7700 | 3520–24 600 | 3100 | 3100 |
| Niger | 93 | 33–300 | 79 | 28–260 | 36 000 | 19 000–94 700 | 380 | 1500 |
| Nigeria | 1000 | 350–3100 | 1100 | 380–3400 | 12 000 | 5710–33 600 | 500 | 57 |
| Rep of Congo | 510 | 170–1600 | 1500 | 500–4700 | 6700 | 3 350–18 300 | 9300 | 1200 |
| Rwanda | 32 | 11–92 | 1000 | 370–3000 | 49 | 6–198 | 240 | 3.8 |
| Senegal | 77 | 26–230 | 390 | 130–1200 | 13 000 | 8280–29 100 | 460 | 750 |
| Sierra Leone | 130 | 42–420 | 1700 | 550–5500 | 330 | 160–850 | 1600 | 41 |
| Somalia | 81 | 27–250 | 130 | 43–400 | 12 000 | 5210–34 500 | 510 | 770 |
| South Africa | 290 | 100–820 | 230 | 81–660 | 17 000 | 6400–56 100 | 480 | 290 |
| South Sudan | 420 | 140–1300 | 670 | 220–2100 | 13 000 | 8800–36 200 | 3700 | 1100 |
| Sudan | 210 | 70–650 | 110 | 38–350 | 50 000 | 35 100–143 000 | 480 | 1100 |
| Tanzania | 630 | 210–1900 | 680 | 230–2000 | 5300 | 2040–17 900 | 1100 | 88 |
| Togo | 54 | 20–150 | 990 | 360–2800 | 300 | 102–879 | 650 | 36 |
| Tunisia | 11 | 308–31 | 74 | 26–210 | 7600 | 4 910–18 100 | 92 | 640 |
| Uganda | 240 | 84–690 | 960 | 330–2800 | 340 | 73–1270 | 530 | 7.4 |
| Western Sahara | 2.2 | 0.7–6.6 | 8.5 | 2.6–26 | 6800 | 3770–21 400 | 370 | 11 000 |
| Zambia | 490 | 160–1500 | 650 | 210–2000 | 4000 | 1430–12 300 | 2700 | 210 |
| Zimbabwe | 140 | 50–410 | 360 | 130–1000 | 2000 | 906–7230 | 960 | 130 |
| Africa | 14 750 (4900–45 000) | 490 (160–1500) | 0.66 × 10⁶ (0.36–1.8 × 10⁶) km3 | 1100 | 490 | |||
3.3. Water security
Combining estimates of LTA recharge with available groundwater storage provides a platform to discuss water security (Foster and MacDonald 2014) and the resilience of aquifer systems to drought (Calow et al 2010). This analysis can be undertaken at different scales, from individual aquifers to regions or countries. Figure 4(a) shows a map of combined groundwater recharge fluxes and groundwater storage for Africa and highlights high storage but low recharge in many of the North African sedimentary aquifers, and low storage but high recharge across many crystalline basement aquifers. Figures 4(b) and (c) compare groundwater storage and recharge for individual countries—with a combination of high groundwater storage and recharge giving increased water security. Countries in this situation are rare with only five countries, Guinea Bissau, the Republic of Congo, the Democratic Republic of Congo, Nigeria and Angola having both recharge and storage above the median for Africa. Having both low groundwater storage and recharge considerably reduces water security; again countries in this condition are rare with only five, eSwatini, Zambia, Lesotho, Zimbabwe and Eritrea having both recharge and storage below the African median.
The majority of African countries have either high storage, or high groundwater recharge. Where storage is high, but LTA recharge low, groundwater is resilient to short-term change in climate, but prone to long-term depletion. In Africa, six of the countries with least recharge have highest storage: Egypt, Algeria, Libya, Tunisia, Niger and Botswana and represent some of the highest groundwater abstractors in Africa (Wada et al 2012). In areas where groundwater storage is low but recharge is high, groundwater supplies are more vulnerable to drought but resilient to long-term irreversible depletion (figure 4). Five of the countries with highest recharge have the least groundwater storage: Liberia, Equatorial Guinea, Guinea, Cote D'Ivoire and Burundi. A similar picture of water security is given by considering the groundwater recharge and storage available per capita (table 3).
4. Discussion
4.1. Recharge and long-term average rainfall
The LMM shows that at the scale of the African continent only LTA rainfall is related to LTA recharge. The inclusion of other factors, PET, NDVI, number of wet days, soil group, aquifer domain and land cover does not improve the model. This outcome contrasts with that of some other large-scale studies (e.g. Mohan et al 2017), which required several different climate and land-cover parameters to improve model fitting. The good fit of the model presented here using only LTA rainfall may be due to the extra care taken to geolocate studies and only include studies that passed stringent quality assurance tests to give data that estimate long-term recharge. However, the random effect in the LMM still show spatial dependence (up to 900 km), and local prediction of recharge can be improved by using the BLUP, with its kriging-type component, relative to a prediction from rainfall alone. This spatial dependence reflects the importance of local soil and land use conditions in mediating the relationship between recharge and rainfall as demonstrated by many studies (e.g. Sami and Hughes 1996, Scanlon et al 2005, Ibrahim et al 2014). However, in modelling LTA recharge across Africa using continental-scale datasets, these parameters do not have a consistent effect, and LTA rainfall dominates the relationship. The scale of these local effects is represented by the variance observed in the relationship between LTA rainfall and recharge (figure 3 and table 3). Therefore, the approach taken here has most value for estimating recharge at a regional scale.
There is little evidence from the data to support a threshold value of LTA rainfall below which recharge cannot occur. Measurable distributed modern groundwater recharge is found to occur where average annual rainfall is considerably less than 250 mm (figure 2) and even in some hyper-arid areas. This deduction is most likely explained by the increased probability of high rainfall events occurring when observing over several decades and the dominance of convective precipitation in arid areas. For example in the dune covered Stampriet Basin in Namibia where average rainfall is less than 250 mm a−1, rainfall can be as high as 600 mm in some years—leading to significant diffuse recharge events (Stone and Edmunds 2012). Lack of vegetation in some arid and hyper-arid areas can also contribute to diffuse groundwater recharge, as heavy rainfall can infiltrate beneath the shallow zero flux plane (Dincer et al 1974, Gates et al 2008, Scanlon et al 2010). Focussed groundwater recharge is also of increased importance in arid areas (Scanlon et al 2006, Cuthbert et al 2019a) and can contribute to regional distributed groundwater recharge. In Niger for example, research has demonstrated highly localised redistribution of runoff by vegetation and geomorphology (Bromley et al 1997) and more widely distributed recharge through temporary ponds and ephemeral streams (Leduc et al 1997). The presence of karst feature can also increase focused recharge in arid regions (Schulz et al 2016). This current study examining long-term relationships complements recent findings examining patterns in annual recharge (Taylor et al 2013b, Kolusu et al 2019. Cuthbert et al 2019a), which demonstrate increasing annual variability in recharge with aridity and many years with no measurable observed recharge. These results strongly support measuring and reporting recharge values over decades rather than annually.
4.2. Water security
Most African countries with little groundwater storage have high annual rainfall and therefore regular recharge. Conversely, many African countries with low rainfall, usually considered as water insecure, have considerable groundwater storage which was mostly recharged millennia ago (figure 4). Generally, assessments of water stress and water security ignore groundwater storage (Taylor 2009), but concentrate on annual ratios between renewable water and water use by people and the environment (Vörösmarty et al 2010). Even where groundwater is considered, early thinking was dominated by the concept of safe yield and ratios between abstraction and recharge (Zhou 2009). However over the last 2 decades this conceptualisation has evolved beyond simple ratios to broader issues of sustainability (Morris et al 2003, Alley and Leake 2004); and include both the response time of groundwater systems to change (Cuthbert et al 2019b) and dynamic groundwater storage (Damkjaer and Taylor 2017, Bierkens and Wada 2019). Sustainability is increasingly being considered as context specific (Gleeson et al 2020) with an acknowledgement that countries have different priorities depending on other pressures and aims, such as the Sustainable Development Goals. With increasing calls to draw from groundwater storage in order to stimulate economic growth and improve food security in Africa (Wijnen et al 2018, Cobbing 2020) a more nuanced approach to water security is necessary.
Several countries, particularly, (but not exclusively) in North Africa (figure 4(c)) have considerable water security when groundwater storage is taken into consideration. This storage provides a significant buffer before abstraction will impact the regional groundwater system. Since there is little dependency on modern recharge, the supply is secure against current climate variability. Examples from elsewhere, including the High Plains and Californian Central Valley aquifers in the US (Scanlon et al 2012), as well as the Indo-Gangetic Basin in northern India and Pakistan (MacDonald et al 2016) demonstrate that such abstraction can be continued in large aquifers but not without degradation. Similar degradation occurs in smaller heavily exploited aquifers North Africa, such as the Souss in Morocco (Bouchaou et al 2008). In Libya, where groundwater recharge is negligible, groundwater storage was developed as part of the Great Man Made River Project without convincing evidence of its sustainability (Edmunds and Wright 1979, Ahmad 1983). Unsustainable groundwater abstraction increased current water supply considerably but at the expense of water security for future generations. Eventually limits can be reached as abstraction increases and becomes more widespread. As groundwater-levels fall, and groundwater discharge reduces in response to abstraction, ecological consequences can occur and include the destruction of wetlands, reduction of baseflow to rivers, land subsidence and increases in salinity. Equally important is the impact on other groundwater users as shallow wells and boreholes dry up, leaving only those with access to the deepest and most expensive boreholes able to access groundwater.
Countries with low groundwater storage but high groundwater recharge are common in Africa, mainly because of the wide prevalence of crystalline-rock and volcanic aquifers. When abstraction is low (e.g. supporting widespread community hands pumps) the water supply is secure, even through short-term droughts (MacDonald et al 2019). Where aquifers are more permeable however, the increase in abstraction (enabled by the geology) for irrigation or urban supply, can quickly deplete storage in dry years—as shown in the crystalline basement aquifers in Peninsular India (Collins et al 2020).
Both these examples above highlight the importance of ongoing dedicated groundwater monitoring to act as an early warning of rapid changes in storage or water quality in response to pumping. Although the use of GRACE has proved useful at scales of >100 000 km2, it cannot substitute for in situ monitoring to capture changes in groundwater levels (Shamsudduha and Taylor 2020), water quality (Lapworth et al 2020) and abstraction (Oiro et al 2020) to identify threats to water security for individual aquifers, regions or countries.
4.3. Estimating recharge
The three most common methods used to estimate LTA recharge in Africa are CMB, WTF methods and the use of EnTs. The majority of studies used several techniques to assess recharge, and the most reliable studies (those in the Sahel and the Kalahari) have developed understanding and data over decades, with different methods and new techniques used to challenge and refine previous results. There is no evidence of bias in the dataset from the method used (see supplementary material). This observation likely arises, however, from the quality assurance procedure, which eliminated studies where techniques had been applied incorrectly and gave a lower priority to studies where only one technique was applied.
Where correctly applied (e.g. accounting for surface runoff, and constraining rainfall and atmospheric inputs) CMB offers useful insight for integrating recharge over the long-term. Studies where unsaturated zone profiles of chloride concentrations are combined with measurements at the water -table are particularly helpful (e.g. de Vries et al 2000, Edmunds et al 2002), as are the additional use of EnTs in more arid areas to indicate if recharge has occurred within recent decades (Lapworth et al 2013). The WTF method is the only method which directly measures groundwater storage responses and is well suited for examining temporal responses to recharge. However to estimate LTA recharge in more arid areas a sufficiently long record is required to capture important episodic recharge events (Taylor et al 2013b, Cuthbert et al 2019a) and sufficient local knowledge is needed of the aquifer properties and the groundwater discharge regime (Cuthbert 2010). In humid areas however, where annual recharge is less variable (Cuthbert et al 2019a), shorter hydrographs can also provide valuable data particularly when in combination with other methods. In arid and hyper-arid areas, combinations of EnTs are used to estimate the residence times of groundwater, and in particular identify any component of modern recharge.
There are large parts of Africa including 19 countries lacking a reliable recharge study. In humid areas of Central Africa, West Africa and Madagascar, there is a particular dearth of studies, probably due to high rainfall and limited reliance on groundwater. The limited understanding of recharge process and volumes in these areas has consequences when modelling continental and global processes and constraining terrestrial WBs. In more arid areas, the Horn of Africa is lacking in studies—an area where groundwater is fundamental for buffering drought (MacAllister et al 2020).
5. Conclusions
The development of a quantitative map and database of long-term distributed groundwater recharge for Africa from ground-based observations is a useful addition to current knowledge of groundwater resources in Africa. Estimated average decadal recharge is 15 000 km3 (4900–45 000 km3) and the statistical model and 134 individual studies can be used to help constrain global and continental models (e.g. Döll and Fiedler 2008). Measurable long-term distributed recharge is found in most environments; average decadal recharge fluxes in arid and semi-arid areas are 60 mm (IQR 30–140 mm) and 200 mm (IQR 90–430 mm), respectively. Recharge occurs episodically in dryland environments so that integrative methods such as CMB, EnTs or multi-decadal hydrographs are required to estimate long-term recharge. As a result, recharge is best reported as decadal rather than annual averages. Average decadal recharge is approximately 2% of estimated groundwater storage across the continent as a whole but with stark variability between the high-storage/low-recharge sedimentary aquifers in North Africa and low-storage/high-recharge crystalline-rock aquifers across much of tropical Africa. African water security is greatly enhance by the distribution of groundwater storage and recharge; many countries that feature low recharge, possess substantial groundwater storage, whereas countries with low storage typically have high, regular recharge.
Acknowledgments
This paper was written in memory of Prof Mike Edmunds of Oxford University. Mike dedicated much of his career to understanding groundwater recharge in drylands and was an integral part of this project team until his sudden death in 2015. The research was funded by the UPGro research programme (Grant Number NE/L001926/1) co-funded by the Natural Environment Research Council (NERC), UK Foreign, Commonwealth & Development Office (FCDO), and the Economic and Social Research Council (ESRC). AMM and RGT also acknowledge support from NE/M008606/1 and NE/M008932/1 for additional analysis since 2016. George Darling helped with initial gathering of recharge studies. The paper is published by permission of the Director of the British Geological Survey. 10.5285/45d2b71c-d413-44d4-8b4b-6190527912ff
Data availability statement
The data that support the findings of this study are openly available at the following URL/DOI: https://doi.org/10.5285/45d2b71c-d413-44d4-8b4b-6190527912ff.