Review

New Particle Formation: A Review of Ground-Based Observations at Mountain Research Stations

1
Laboratoire de Météorologie Physique (LaMP), CNRS, Université Clermont Auvergne, F-63000 Clermont-Ferrand, France
2
Institute of Atmospheric Sciences and Climate (ISAC), CNR, 40129 Bologna, Italy
3
TROPOS, Permoserstr. 15, 04318 Leipzig, Germany
4
Laboratory for Atmospheric Physics, Institute for Physics Research, Universidad Mayor de San Andrés, La Paz, Bolivia
5
Department of Atmospheric and Oceanic Sciences, University of Maryland, College Park, MD 20742, USA
6
CNRS, IRD, G-INP, IGE, University of Grenoble Alpes, 38000 Grenoble, France
*
Author to whom correspondence should be addressed.
Atmosphere 2019, 10(9), 493; https://doi.org/10.3390/atmos10090493
Submission received: 4 July 2019 / Revised: 6 August 2019 / Accepted: 13 August 2019 / Published: 26 August 2019
(This article belongs to the Special Issue Atmospheric New Particle Formation)

Abstract

:
New particle formation (NPF) was predicted to contribute to a major fraction of free tropospheric particle number and cloud condensation nuclei (CCN) concentrations by global models. At high altitudes, pre-existing particle concentrations are low, leading to limited condensational sinks for nucleation precursor gases, and temperatures are cooler compared to lower altitudes, whereas radiation is higher. These factors would all be in favor of nucleation to occur with an enhanced frequency at high altitudes. In the present work, long term data from six altitude stations (and four continents) at various altitudes (from 1465 to 5240 m a.s.l) were used to derive statistically relevant NPF features (frequency, formation rates, and growth rates) and seasonal variability. The combined information together with literature data showed that the frequencies of NPF events at the two Southern hemisphere (SH) stations are some of the highest reported thus far (64% and 67%, respectively). There are indications that NPF would be favored at a preferential altitude close to the interface of the free troposphere (FT) with the planetary boundary layer (PBL) and/or at the vicinity with clouds, which otherwise inhibit the occurrence of NPF. Particle formation rates are found to be lower at high altitudes than at low altitude sites, but a higher fraction of particles are formed via the charged pathway (mainly related to positive ions) compared to boundary layer (BL) sites. Low condensational sinks (CS) are not necessarily needed at high altitudes to promote the occurrence of NPF. For stations at altitudes higher than 1000 m a.s.l., higher CSs favor NPF and are thought to be associated with precursor gases needed to initiate nucleation and early growth.

1. Introduction

New particle formation (NPF) is a key process driving the aerosol number in the atmosphere; it is the source of over half of the atmosphere’s cloud condensation nuclei, thus influencing cloud properties and Earth’s energy balance. NPF events are frequently observed at mountain atmospheric observatories [1,2,3].
New particle formation is a two-step process during which ~1 nm particle clusters are formed by nucleation of gas-phase precursors and then grow to larger sizes by condensation [4]. The process was shown to be ubiquitous in the atmosphere from observations performed at various locations [5,6], and it was shown to be a major source of condensation nuclei (CN) and cloud condensation nuclei (CCN) from several modeling studies [7,8,9,10,11].
According to Merikanto et al. (2009) [8], 45% of global low-level cloud CCN at 0.2% supersaturation could derive from nucleation, with a significant fraction created in the free troposphere (FT) (35%). In fact, this modeling study revealed that nucleation is expected to be a major contributor to the total particle number concentration in the upper troposphere [8]. More recently, the study by Dunne et al. (2016) [12] combined model and chamber experiments at low temperatures representative of high altitudes, suggesting a large source of new particles via nucleation in the upper free troposphere as well. Once produced via nucleation, FT aerosols can return to the planetary boundary layer (PBL) by subsidence and can constitute a major part of the total aerosol number concentration in the remote areas of the PBL [13,14,15,16,17,18]. However, as a result of multiple uncertainties, model outcomes can differ significantly. Besides the uncertainties that affect emissions of both primary particles and gaseous precursors, our lack of knowledge regarding nucleation prevents an optimal description of the process in models [19]. In the FT, our knowledge of the exact mechanism and the precursors of NPF is even more limited. Indeed, the evaluation of the nucleation accuracy in the models is more complicated at high altitudes compared to boundary layer (BL) sites. Process studies and long term observations at high altitudes are more difficult to perform than at lower altitudes due to the lack of availability of suitable sites and due to adverse meteorological conditions. Moreover, interpretation of data from high altitude stations must be done with care, as a station may not always be representative of the altitude it lays at due to frequent valley winds and topographic effects that bring lower atmospheric air masses to the stations [20]. Airborne studies can overcome such problems but are usually limited to short time scales, which may not provide statistically representative information on NPF processes on seasonal time scales, although they can provide Lagrangian sampling approaches to understanding NPF and its evolution.
Airborne measurements performed in the marine troposphere show that nucleation occurs preferentially in the FT compared to the marine boundary layer (MBL), and particularly in tropical convective regions and clouds outflows [21,22,23]. Young et al. (2007) [24] also used airborne measurements to show that NPF occurs with a high frequency (up to 86–100%) in the free troposphere and the lower stratosphere. Within the atmospheric column, the free troposphere is much cleaner and less turbulent than the PBL. The interface between the PBL and the FT would offer favorable conditions for nucleation to occur, as aerosol precursors and water vapor from lower altitudes are mixed with clean and cold air, usually under enhanced photochemical conditions. At the Jungfraujoch station (3580 m a.s.l.), recent studies showed that NPF events occur within FT air masses given that they had contact with the PBL in a given time window [25,26]. According to Wehner et al. (2015) [27], the location of the events at the cloud edge supports the hypothesis that NPF is favored by turbulent mixing and enhanced UV radiation. Korhonen et al. (2008) [28] suggest that CCN concentrations observed in the MBL are formed by nucleation of DMS (dimethyl sulfide)-derived H2SO4 in the free troposphere followed by subsequent condensational growth and coagulation, which takes from days to over a week. When CCNs are finally entrained into the MBL, they may be hundreds or even thousands of kilometers away from the site of the original DMS emissions. However, contradictory observations have reported that NPF occurs either within the whole PBL but not in the FT [29], preferentially in the upper FT [21,30,31], or at the interface between the PBL and the FT [27].
In the present work, we gathered information from experimental NPF studies performed at high altitude (above 1000 m a.s.l.) ground-based stations in order to provide an overall picture of the frequency of occurrence of the process as well as particle formation and growth rates with their seasonal variability. We selected six high altitude sites for which more than one year of data were available for the study of the NPF process from the lowest sizes. For these sites, from which most data have already been published, we re-processed the main NPF features (frequency, formation rates, and growth rates) in a homogeneous way. We examined the influence of the very specific conditions encountered at high altitudes on NPF, such as cloud presence at the sites, higher ion concentrations, and lower CS, in comparison to BL sites.

2. Sites and Measurements and Methods

2.1. Sites

This part will be diplayed below.

2.1.1. The Puy de Dôme Station (PUY)

The Puy de Dôme (PUY) station is located in central France (45°77′ N, 2°96′ E) at the top of the Puy de Dôme mountain (1465 m a.s.l.) within a mountain chain oriented North-South that faces dominant western winds [32]. The surroundings of the station are mainly characterized by fields and forest of a protected natural park, and the closest city (Clermont-Ferrand, 300,000 inhabitants) is situated 16 km east of the station. Data used in the present work cover the period February 2007–February 2012 (see Table 1 for more details regarding data availability).

2.1.2. The Chacaltaya Station (CHC)

The Chacaltaya (CHC) regional GAW (Global Atmosphere Watch) station is located at 5240 m a.s.l. in the Bolivian Andes near the summit of Mount Chacaltaya (16°21.014′ S, 68°07.886′ W), 15 km north of La Paz—El Alto metropolitan area (2 million inhabitants). In this region, meteorological conditions are governed by wet (December to March) and dry seasons (May to August). During the period of August–September, land clearing related to agricultural practices in the nearby Yungas and Zongo valleys (valleys connecting La Paz metropolitan area and the lowlands) and the Amazon basin lead to intense but strong interannual variability vegetation burning. Data used in the present study are from the period January–December 2012.

2.1.3. The Nepal Climate Observatory Pyramid Station (PYR)

The Nepal Climate Observatory Pyramid (PYR) (Nepal, 27.95° N, 86.82° E). PYR is located at 5079 m a.s.l. in the Khumbu valley, a South-North valley in the High Himalayas situated between China and India [33]. Data discussed in this review are from the period between March 2006 and August 2007.

2.1.4. The Maido Station (MDO)

Maïdo observatory (MDO) (21.080° S 55.383° E) is situated at 2160 m a.s.l on La Reunion Island in the Indian Ocean. The facility dominates, in the east, the natural amphitheater of Mafate, characterized by lush tropical vegetation, and, in the west, the highland tamarind forests. The nearest urban areas are the coastal cities of Saint Paul and Le Port with 105,000 and 40,000 inhabitants, respectively, located 13 and 15 km away from the Maïdo observatory [34]. Data measured between January and December 2015 are used in the present work.

2.1.5. The Jungfraujoch Station (JFJ)

The Jungfraujoch station (JFJ) (3580 m a.s.l.) is situated on the Northerly crest in a saddle between the mountains Mönch (4099 m a.s.l.) and Jungfrau (4158 m a. s. l.) and belongs to the glacier accumulation zone. Aerosol measurements were performed at the Sphinx laboratory located on the southern side of the Jungfraujoch at 3580 m a.s.l. (46°32′5100″ N, 7°59′600″ E) in Switzerland, 100 m below the main crest of the Bernese Alps. Data used in this study spread over the period between April 2008 and May 2009.

2.1.6. The Monte Cimone Station (CMN)

The Monte Cimone (CMN) GAW global station is located at 2165 m a.s.l. on the highest peak of the Northern Apennines. It is the only high mountain station for atmospheric research located south of both the Alps and the Po basin. Due to the 360° free horizon, it can be considered representative of the background conditions of the Southern Europe/North Mediterranean basin; it is particularly suitable to characterize the background conditions as well as the influence of the polluted Po Valley carried up with valley breezes during summertime [35].
The aerosol size distribution measurements were carried out continuously from November 2005 to March 2013 in the framework of EUSAAR and ACTRIS projects.

2.2. Instrumentation

The naturally charged cluster and particle size distributions were measured using an Air Ion Spectrometer (AIS, Airel Ltd., Tõravere, Estonia [36]), which allowed ion detection in the mobility range 0.0013–3.2 cm2 V−1 s−1, corresponding to a mobility diameter, i.e., Millikan diameter, of 0.8–42 nm in standard conditions [37]. The AIS has two identical differential mobility analyzers (DMA) for the simultaneous measurement of positively and negatively charged particles.
Neutral cluster and particle size distributions were measured additionally to the naturally charged clusters and particles with a Neutral Air Ion Spectrometer (NAIS, Airel Ltd., Tõravere, Estonia [38]). NAIS measurements were performed in the same manner as the AIS measurements, except that a sequence of artificially charging clusters and particles with a known equilibrium was added. The particles were unipolarly charged by ion currents produced by a corona discharge.
In the absence of (N)AIS measurements, scanning mobility particle sizer (SMPS) or differential mobility particle sizer (DMPS) data could also be used to document the occurrence of NPF, as was done by Venzac et al. (2008) [39] for PYR and Foucart et al. (2018) [40] for MDO. SMPS and DMPS provide the aerosol size distribution between ~10 and ~600–1000 nm, depending on both the settings of the instrument and the model. In addition to NPF identification, SMPS and DMPS measurements are also commonly used to calculate the condensation sink (CS), which represents the loss rate of precursor vapors on pre-existing particles [41]. The TROPOS-SMPS in operation at CHC [42] together with the SMPS and the DMPS at all other stations was custom built [39]. At CMN, a DMPS assembled by Kuopio University measured the aerosol size distribution from 10 to 500 nm. The DMPS was replaced in July 2017 by a TROPOS-SMPS. More details about the SMPS/DMPS design can be found in the publications listed in Table 1 together with an overview of the datasets discussed in this review, including the type of instrument [SMPS/DMPS or (N)AIS] used for the investigation of NPF as well as the corresponding measurement period.

2.3. Methods

The identification of the NPF events was performed visually, as in all studies referring to NPF at the sites of the present study, using the daily contour plots of particle and/or ion size distributions. When based on D-SMPS data, the classification followed the criteria from Dal Maso et al. (2005) [48], which was later adapted to (N)AIS measurements [49,50,51]. In both classifications—SMPS or (N)AIS based—measurement days were first divided into three groups: event, non event, and undefined days. In a second step, the identified events could be further classified into sub classes depending on their shape, which would directly reflect the potential of the newly formed particles to grow. However, this detailed classification was not discussed in the present study. The particle formation and the growth rates calculated for the events with clear particle growth [i.e., belonging to the so-called class I in both SMPS and (N)AIS based classifications] are instead reported.
Particle formation rates (J) and growth rates (GR) are key parameters to describe NPF. Following the recommendations by Hirsikko et al. (2005) [52], the early growth of particles is usually described using three diameter ranges (1.5–3 nm, 3–7 nm, and 7–20 nm) characteristic of the different growth steps of the newly formed particles to larger sizes. These size ranges can, however, be adjusted depending on available data. For example, in the absence of measurements at lower sizes, the diameter range between 12 and 19 nm was selected by Foucart et al. (2018) [40] at MDO. The growth rates reported in the present work were all calculated following the “maximum concentration” method developed by Hirsikko et al. (2005) [52], which is only briefly described here. In a first step, the times (tm) when the concentration maximum reached each size bin of a selected diameter range (e.g., 1.5–3 nm) were determined by fitting a normal distribution to the concentration time series of each bin. The particle growth rate in the targeted diameter range was further obtained by fitting a linear least square fit through the tm values previously identified.
The neutral particle formation rate at size d p , denoted by J d p , was calculated as the production term contributing to the time evolution of the particle number concentration N d p in the size range [ d p , d p + Δ d p ], as reported in Kulmala et al. (2012) [41]:
J d p = d N d p d t + C o a g S d p × N d p + G R Δ d p × N d p
The second and the third terms on the right-hand side of Equation (1) represent the loss of particles in the size range [ d p , d p + Δ d p ] due to (1) their coagulation on pre-existing larger particles ( C o a g S d p ) and (2) their growth out of the considered size range, using the growth rate calculated as described later (GRdp). In case of ions or charged particles, the calculation of the formation rate J d p ± included two additional loss terms to account for the recombination of ions with opposite polarities and for the attachment of ions on neutral particles:
J d p ± = d N d p ± d t + C o a g S d p × N d p ± + G R Δ d p × N d p ± + α × N d p ± × N < d p β × N d p × N < d p ±
The superscripts and + indicate the polarity of the ions, and the subscript < d p refers to all particles smaller than d p . α and β are the ion–ion recombination and the ion–particle attachment coefficients, respectively, which are usually set to α = 1.6 × 10 6 cm 3 s 1 and β = 0.01 × 10 6 cm 3 s 1 according to Tammet and Kulmala (2005) [53]. The use of (N)AIS data allowed for the direct calculation of ion and particle formation rates at sizes down to 2 nm using the particle 1 3 GR1–3 calculated between 1.5 and 3 nm, as was done for at PUY, JFJ, and CHC, respectively, by Boulon et al. (2011) [43], Boulon et al. (2010) [45], and Rose et al. (2015) [47]. In contrast, DMPS measurements conducted at MDO only allowed for the direct calculation of 𝐽12, which was used in a second step to derive the formation rate of 2 nm particles based on Lehtinen et al. (2007) [54], assuming a constant particle growth between 2 and 19 nm approximated by G R 12 19 .

3. Frequencies of Occurrence, Formation Rates, and Growth Rates

The different NPF characteristics of the mountain research stations mentioned in the following sections are reported in Table 2.

3.1. Frequencies of Occurrence

The average frequencies of occurrence of NPF events and their seasonal variations are reported in Figure 1 for the six high altitude stations. From a general point of view, it is difficult to demonstrate that nucleation occurs with a statistically relevant higher frequency at stations of high altitudes than at low altitude stations (Figure 1A). In the literature, annual averages of NPF frequencies at high altitudes were extremely variable and were reported to be 52% at Storm Peak (3210 m a.s.l., [55]), 39% in the High Himalayas at PYR (5079 m a.s.l., [39]), 30% at the Izaña mountain (2373 m a.s.l.) in the north Atlantic [56], and down to 14.5% at the Mukteshwar station in the Himalayan foothills (2180 m a.s.l., [57]) as well as at the JFJ station [3]. Factors other than altitude only seem to influence the NPF frequency at a given station. However, in earlier studies, NPF events were shown to be significantly more frequent at high altitude than at low altitude when comparing the frequencies of NPF events simultaneously monitored at the same geographical location (PUY) but at different altitudes over a one year period [43]. Boulon et al. (2011) [43] reported that NPF events occurred 36% of the time at the PUY station, while they only occurred 21% of the time over the same measurement period at the lower altitude station Opme (660 m a.s.l.) located 12 km away.
The two high altitude stations of the Southern hemisphere (CHC and MDO) showed the highest yearly average NPF event frequencies of the whole dataset (64% and 67% of the time, respectively). Although there were not enough data from the Southern hemisphere station to derive a statistically robust conclusion, it would be worth addressing the question of a preferential occurrence of high altitude NPF in this hemisphere in future studies. This question has only been partially addressed with airborne studies. Clarke and Kapustin (2002) [21] summarized 10 years of airborne measurements over the Pacific Ocean and showed that ultrafine (dp > 3 nm) particle concentrations were in a similar range in the Southern and the Northern hemispheres. In Minikin et al. (2003) [61], aircraft studies showed relatively high concentrations of ultrafine particle concentration (dp > 6 nm) (up to 10,000 cm−3) in the tropical region of the Southern hemisphere for altitudes higher than 7 km, which was found to be relatively higher than the corresponding concentration in the tropics of the Northern hemisphere for the same altitude. The authors found that high concentrations of this geographical area originated from uplifted air masses above the central South American continent. The opposite was, however, found for mid-latitudes, where ultrafine particle concentrations were a factor two to four times higher in the upper Northern hemisphere than in the upper Southern hemisphere. Since the two Southern hemisphere high altitude stations of CHC and MDO are located close to the tropical latitudes, our results were in line with those of Minikin et al. (2003) [61]. However, data acquired during the flight campaign represent only a few flights, and more statistical data are needed at stations in the mid-latitude range of the Southern hemisphere. The seasonal variation of the NPF frequency usually presented higher values during early spring and early autumn seasons for the high altitude stations of the Northern hemisphere (Figure 1B), as was commonly observed for the PBL stations [59]. In line with this observation, maximum concentrations of aerosol number concentrations in the 3–10 nm range were reported in the literature during spring and autumn at Storm Peak (Colorado, 3210 m a.s.l.) [60]. Neitola (2011) [57] also observed the highest NPF events frequencies during spring at the Mukteshwar station in the Himalaya foothills (2180 m a.s.l.). At Mount Tai in China (1534 m a.s.l.), measurements performed during autumn and summer seasons again showed higher frequencies in autumn (56%) than in summer (21%) [61]. The seasonal variation of the NPF frequency observed at MDO also displayed a frequency peak during the Southern hemisphere autumn (March–April) and early spring (August–October). While the springtime frequency peak is usually explained by a burst of vegetation, it is more difficult to explain the autumn frequency peak. One exception to this springtime maximum of the NPF events frequency was reported by Garcia et al. (2014) [56], who highlighted a clearly marked NPF season at Izaña in summer (May–August), where events occurred on 50–60% of the days. A similar seasonality was observed at PYR, where summer (57%) and fall (48%) showed much higher frequencies (57% and 48%, respectively) with respect to winter (25%) and spring (38%) [39].
For all stations of the present study except MDO, the frequency of occurrence was usually lowest for winter, when photochemistry, boundary layer heights, and vegetation emissions were the lowest. The peak observed during winter (May–August) at CHC might have been related to the specific feature of the seasons at the tropical Southern hemisphere stations, which are usually separated into a wet season (December–March) and a dry season (May–August). In these tropical regions, the nucleation frequencies may have been rather driven by the presence of clouds below, at, and above the station (see Section 4.1). At the CHC station, a very pronounced air mass type seasonal variability could also partially drive the NPF frequency of occurrence (Section 4.4).

3.2. Formation Rates

Formation rates of neutral cluster particles (J2) are shown in Figure 2 for PUY, JFJ, MDO, and CHC stations. Average J2 usually did not exceed 2.5 cm−3 s−1 for all high altitude sites and were usually lower than those measured on average at low altitude sites (12 cm−3 s−1, [59]). Formation rates were not directly linked to frequencies of occurrences, as the highest J2 was found at the JFJ station, which had the lowest frequency of occurrence of NPF of all sites in this study. Also, formation rates did not appear to be enhanced in the Southern hemisphere compared to the Northern hemisphere, although, again, we do not have sufficient statistics in each hemisphere to confirm this hypothesis. In the literature, we found that, at the Izaña station in the Atlantic Ocean, the mean formation rate of the nucleation mode particles (10–25 nm) over the four-years study period was 0.46 ± 0.57 cm−3 s−1 [56], also a much lower rate than for BL sites. At Mauna Loa in the Pacific Ocean, a similar value (0.50 cm−3 s−1) was calculated for the formation rate of particles in the size range 3–10 nm [58], similar to the one reported for the Mukteshwar station in the Himalayan foothills (0.40 cm−3 s−1) [57]. Only at the Storm Peak Laboratory was the formation rate of particles in the 6–10 nm size range found to be higher (7.47 ± 5.1 cm−3 s−1) [55]. However, NPF events reported at SPL had specificities likely linked to the presence of coal-fired power plants located in the vicinity of the station, providing SO2 in sufficient concentrations [62].
When considering the formation rates of charged clusters, we observed that, opposite to neutral 2 nm formation rates, high altitude stations generally showed higher values than the average charged formation rates (J2+−) for the BL sites. Also, for two of the three altitude sites for which we had data (JFJ and CHC), negative ion formation rates were higher than the positive ion formation rates, which was not the case for the PUY station located at the lowest altitude or for the average of the BL sites. The contribution of ion-induced nucleation at high altitude sites is discussed in more detail in Section 4.2.
The seasonal variation of the 2 nm particles nucleation rates is rarely reported in the literature for high altitude sites. At CHC, Rose et al. (2015) [47] observed lower nucleation rates during the wet season (1.02 cm−3 s−1) compared to the dry season (1.90 cm−3 s−1), in agreement with the seasonal variation of the NPF event frequency. Consistent with CHC, the seasonal variation of J2 reported for MDO showed a clear maximum during the dry season (July–September, 2.39 cm−3 s−1). No seasonal variation of nucleation rates measured over a year long period or more at Northern hemisphere high altitude sites was reported in the literature to our knowledge. At Mount Tai (China), 3 nm particles formation rates were found relatively high compared to other high altitude sites. They are reported to vary between 0.94 and 23.90 cm−3 s−1 during the autumn season and between 0.99 and 16 cm−3 s−1 during the summer season [63].

3.3. Growth Rates

Growth rates for size ranges 1.5–3 nm, 3–7 nm, and 7–20 nm are reported in Figure 3. The growth rates (GR) calculated for the two European high altitude sites for which we had long term data were not significantly different from the average GR reported in the literature for BL sites for all size classes. The GR observed from the Southern hemisphere (SH) high altitude sites were higher than those measured in the Northern hemisphere (NH). The CHC and the MDO stations showed higher GR1–3 than PUY and JFJ, in reasonable coherence with the NPF frequency of occurrence shown in Figure 1, although the contrast between SH and NH stations was not as high for the GR as for the NPF frequency of occurrence. At CHC, the average GR1–3 was close to 5 nm h−1, being frequently higher than 10 nm h−1, and the average GR7–20 was 13 nm h−1, often reaching 30 nm h−1. At MDO, GR12–19 was even higher with an average of 20 nm h−1. Lower GR was found in the literature for high altitude sites of the NH. At the Izaña station, the mean growth rates during the four-year study period were 0.43 ± 0.21 nm h−1 for the 10–25 nm size range [56], and a similar value was found for the Mauna Loa Observatory (0.40 nm h−1 in the 3–10 nm size range; [64] Weber et al. 1995) and the Storm Peak Laboratory (0.65 nm h−1 in the range of particles larger than 9 nm [55]). We noticed that GRs were not necessarily in line with nucleation rates. In fact, while the marine stations (Izaña and Mauna Loa) showed both lower formation rates and lower GRs than PUY and JFJ, the Storm Peak Laboratory nucleation rates were higher, but GRs were lower than PUY and JFJ stations. As mentioned in several previous studies, condensable species involved in the nucleation process are not the same as those involved in the growth process [26,41].
At MDO, Foucart et al. (2018) [40] reported a clear seasonal variation of GR12–19, with the highest values measured during the SH winter and spring and the lowest during autumn, while in CHC, Rose et al. (2015b) [47] showed that the GRs were, in contrast, enhanced during the late summer and lowest during winter. As mentioned previously, the meteorological conditions at these two stations are strongly influenced by the presence of wet and dry seasons, and differences in the topography of each station relative to cloud location during the wet season (see Section 4.1) or differences in the seasonal variation of condensable species responsible for the particle growth may explain differences in the GR seasonality. Boulon et al. (2011a) [43] did not find a significant seasonal pattern in the GR variation at the PUY station. At Mount Tai, the newly formed particles GR were higher during the wet summer (1.08–7.76 nm h−1) than during the dryer autumn (0.72–2.76 nm h−1) [63].
The determination of the GR at mountainous stations can be biased by upslope winds inducing non-stationary conditions. At the time corresponding to the growth of newly formed particles, air masses are usually progressively transported to high altitude sites from lower altitudes and may transport clusters and ultrafine particles that have already nucleated and grown at lower altitudes. Thus, the GRs that are usually reported for high altitude sites (and those calculated in the present study) are “apparent” growth rates that may be overestimated. Some specific BL environments, such as marine or urban environments, also show high GR values [65,68]. However, for these specific environments, the stationary/spatially homogeneous conditions necessary to calculate a real growth rate may not be verified either. Particle GRs are either constant with size (PUY and CHC) or decreasing with size (JFJ). This feature is opposite to BL sites, as already pointed out by Maninnen et al. (2010) [59], and is likely due, again, to inhomogeneity in the advection of air masses at the high altitude sites. For some stations, it was possible to segregate between BL and FT air masses and thus derive a “true” GR. At the JFJ station, Herrmann et al., (2015) [3] and Tröstl et al., (2016) [26] reported that only a minor fraction of <50 nm particles (likely resulting from nucleation) were growing beyond 90 nm, even on a time scale of several days.

4. Special Features of NPF Specific to High Altitude Sites

4.1. Influence of Clouds

Clouds often form at high altitudes and may interrupt or inhibit NPF, both due to their role in shielding the amount of solar radiation reaching the sites and due to their role in scavenging the newly formed clusters and eventually their precursors. In the literature, it was shown that clouds had an inhibiting effect on NPF [69,70], but there is still a debate as to whether clouds can also promote the formation of new particles. Parameters that may enhance NPF in cloud conditions are the electrostatic effects due to the presence of droplets, evaporating gases from droplets at the edge of clouds, enhanced UV radiation, or enhanced mixing of air masses with poor pre-existing aerosols and those rich in condensable gases. NPF was found to be favored in the FT mainly in the outflow of deep convective clouds [23] and frequently at cloud edges [27]. Over the Mediterranean Sea, clouds were present at the same altitude range (although they were filtered out of the dataset) and increased concentrations of small particles on four out of 17 profiles [31]. The authors suggest that NPF was likely induced from fresh uplifted air within convective clouds. Using airborne NAIS measurements over North-Western Europe, Mirme et al. (2010) [71] found enhanced charged cluster concentrations within clouds, but they suggested that the main formation mechanism was connected to the occurrence of rain rather than to gas-to-particle conversion. At the PUY and the JFJ stations, the cluster ion concentration was significantly lower for cloudy conditions observed at the station compared to clear sky conditions, showing that the large condensational sink that cloud droplets represent is an efficient scavenger of cluster ions [1,45]. At both stations, the frequency of NPF events was significantly lowered during cloudy conditions and, when occurring, NPF seemed limited to the cloud edges. At Mount Tai (China), the lower NPF events frequencies observed during summer compared to autumn were also attributed to rainy and foggy conditions observed during the summer months [63]. However, it was observed that concentrations of ions of intermediate sizes (1.4–6 nm) did not decrease in cloudy compared to clear skies at the PUY station [1] and even increased during cloudy conditions at the JFJ, especially for the negative cluster ions [45] (Boulon et al. 2010). Moreover, NPF events with interrupted growth were observed to occur in the vicinity of clouds at PUY (i.e., when a period of cloudy conditions was observed during the course of the NPF event) [1], while sporadic events of intense concentrations of large ions were also detected under cloudy conditions at JFJ [45]. Stations located in regions of strong seasonal variations in cloud coverage offer good opportunities to study the influence of clouds on NPF from a statistical point of view. The influence of cloud coverage depends on the specific configuration of the station location within the mountain chain surrounding it. At PYR, Venzac et al. (2008) [39] identified that the frequency of NPF events was twice as high under clear sky conditions (defined from the ratio of measured versus theoretical solar radiation) as under cloudy conditions, even though they observed a higher frequency of NPF event occurrence during the monsoon season. On the contrary, at CHC, Rose et al. (2015) [47] observed that nucleation frequency was lowest during the wet season and highest during the dry season. Rose et al. (2015) [47] determined that, at CHC, this was explained by the highest frequency of the station being within a cloud at the onset of nucleation during the wet season and by clouds frequently rising above the station during this season, thus decreasing the availability of solar radiation for photochemical processes. By comparing CHC and PYR, we could hypothesize that, at PYR, the station was not necessarily more frequently cloudy or below a cloud during the monsoon season but that clouds and rain occurred before the air masses reached the site, thus bringing air with low pre-existing aerosol loadings. All together, these observations suggested that clouds were likely inhibiting NPF within and below them but promoting NPF at the edges and above them.

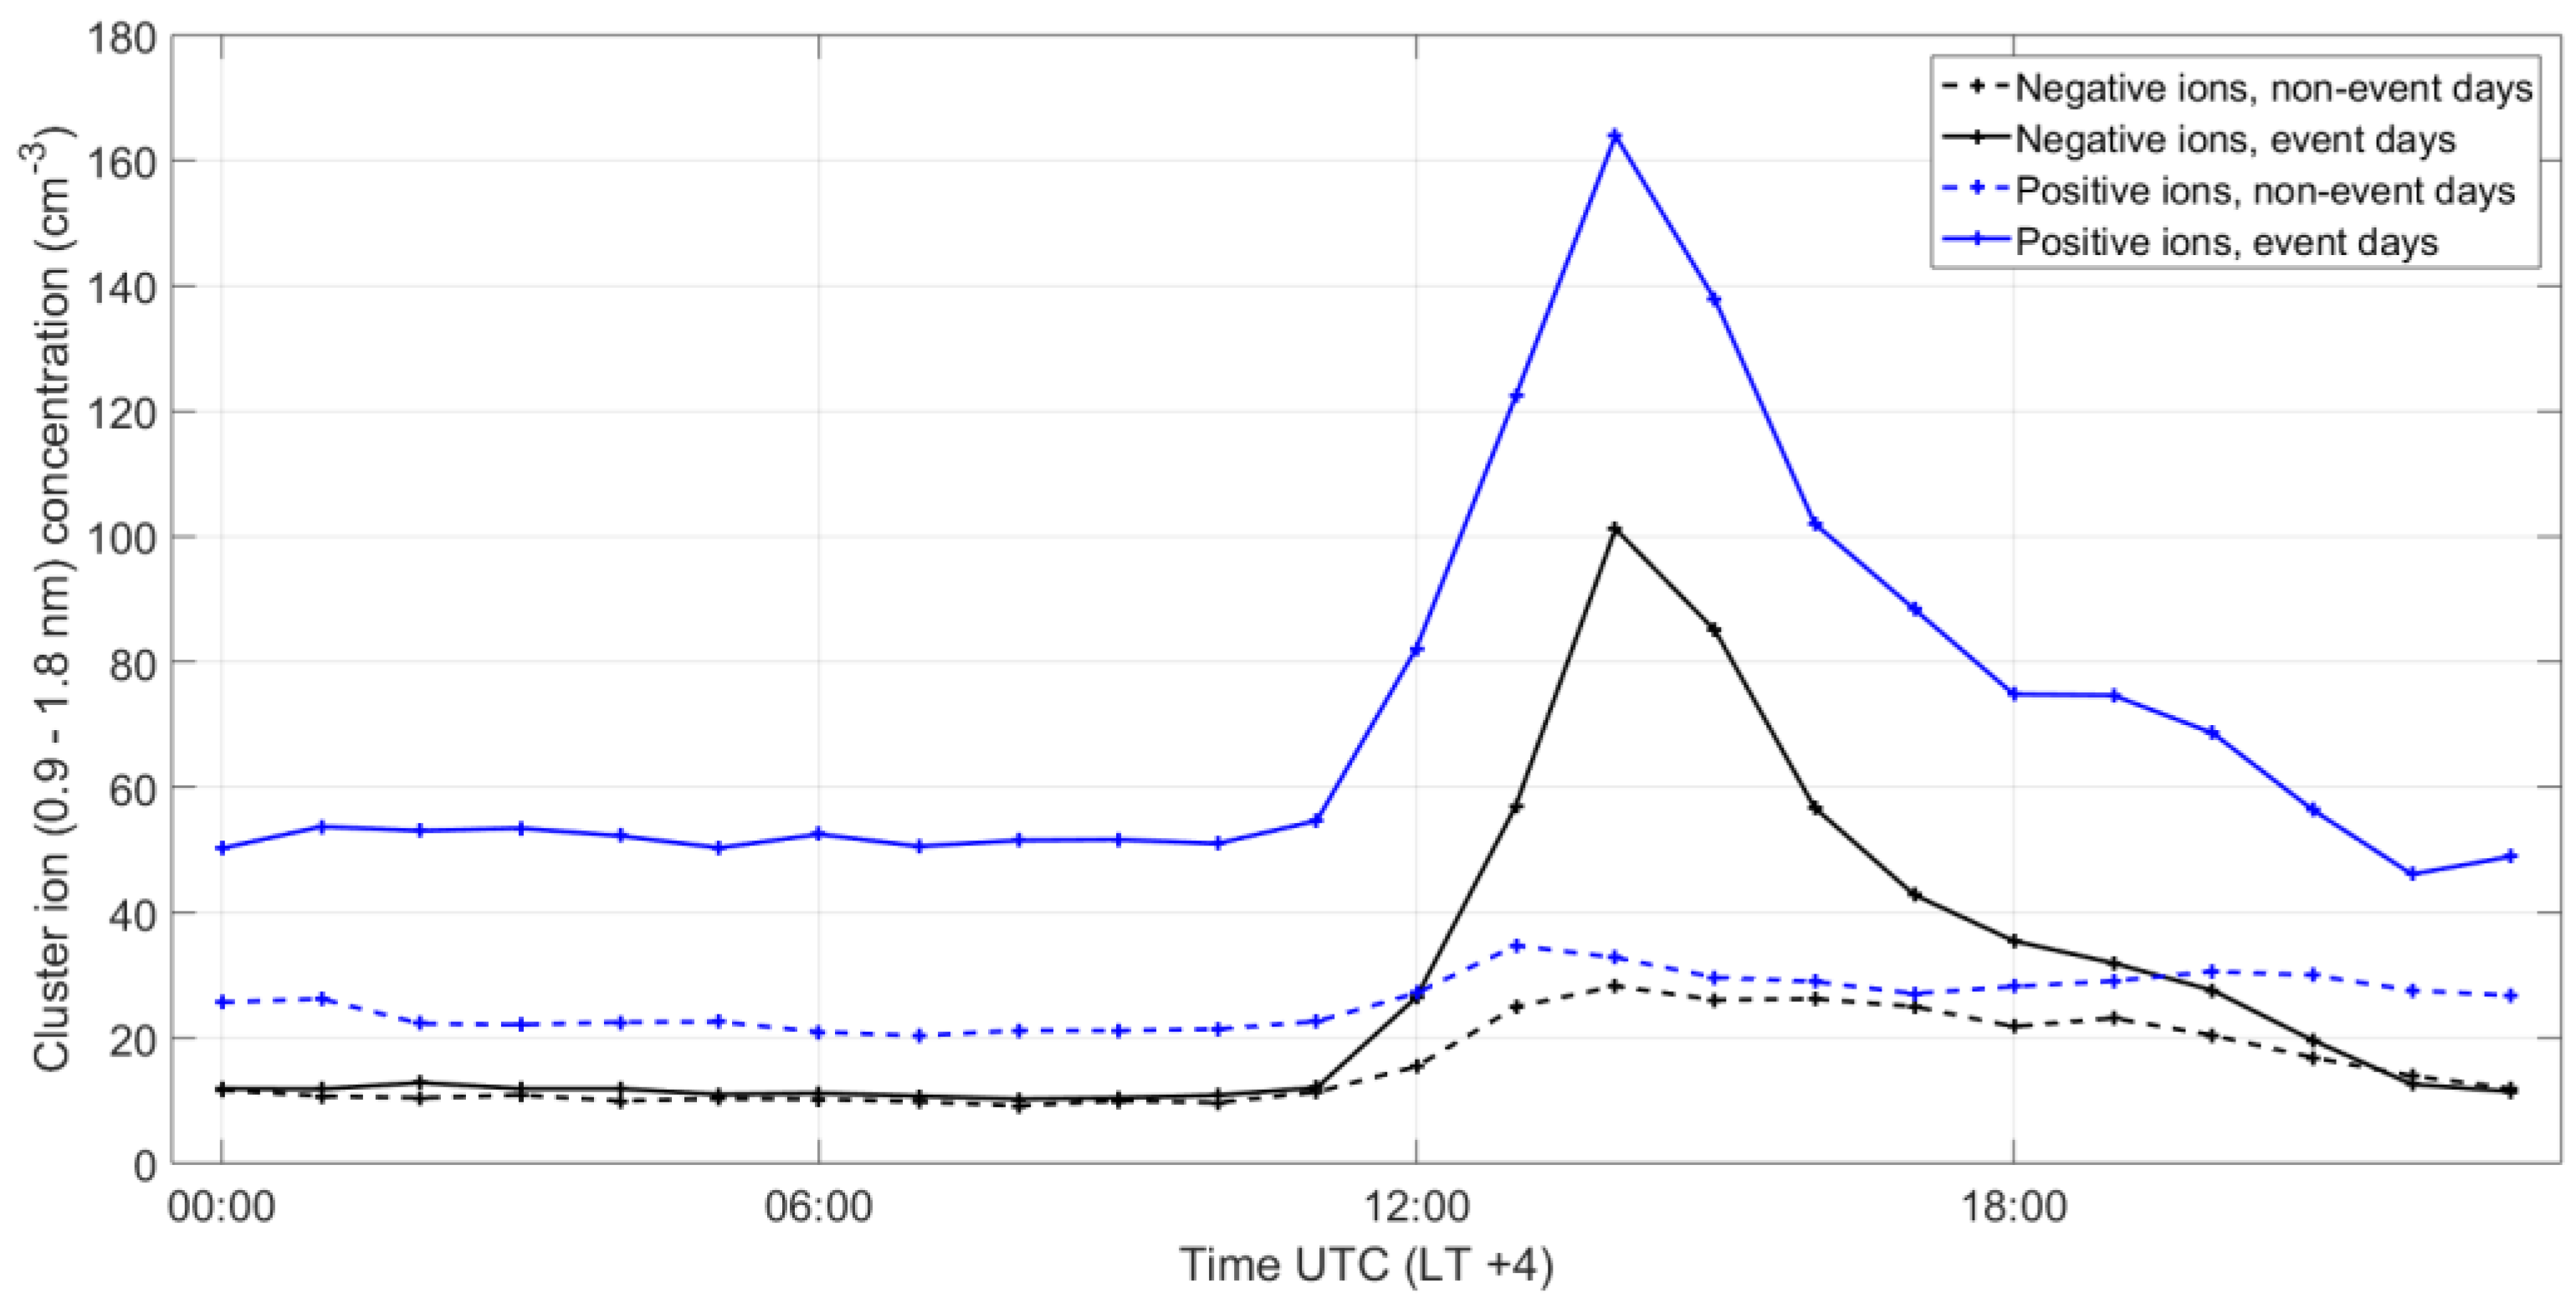
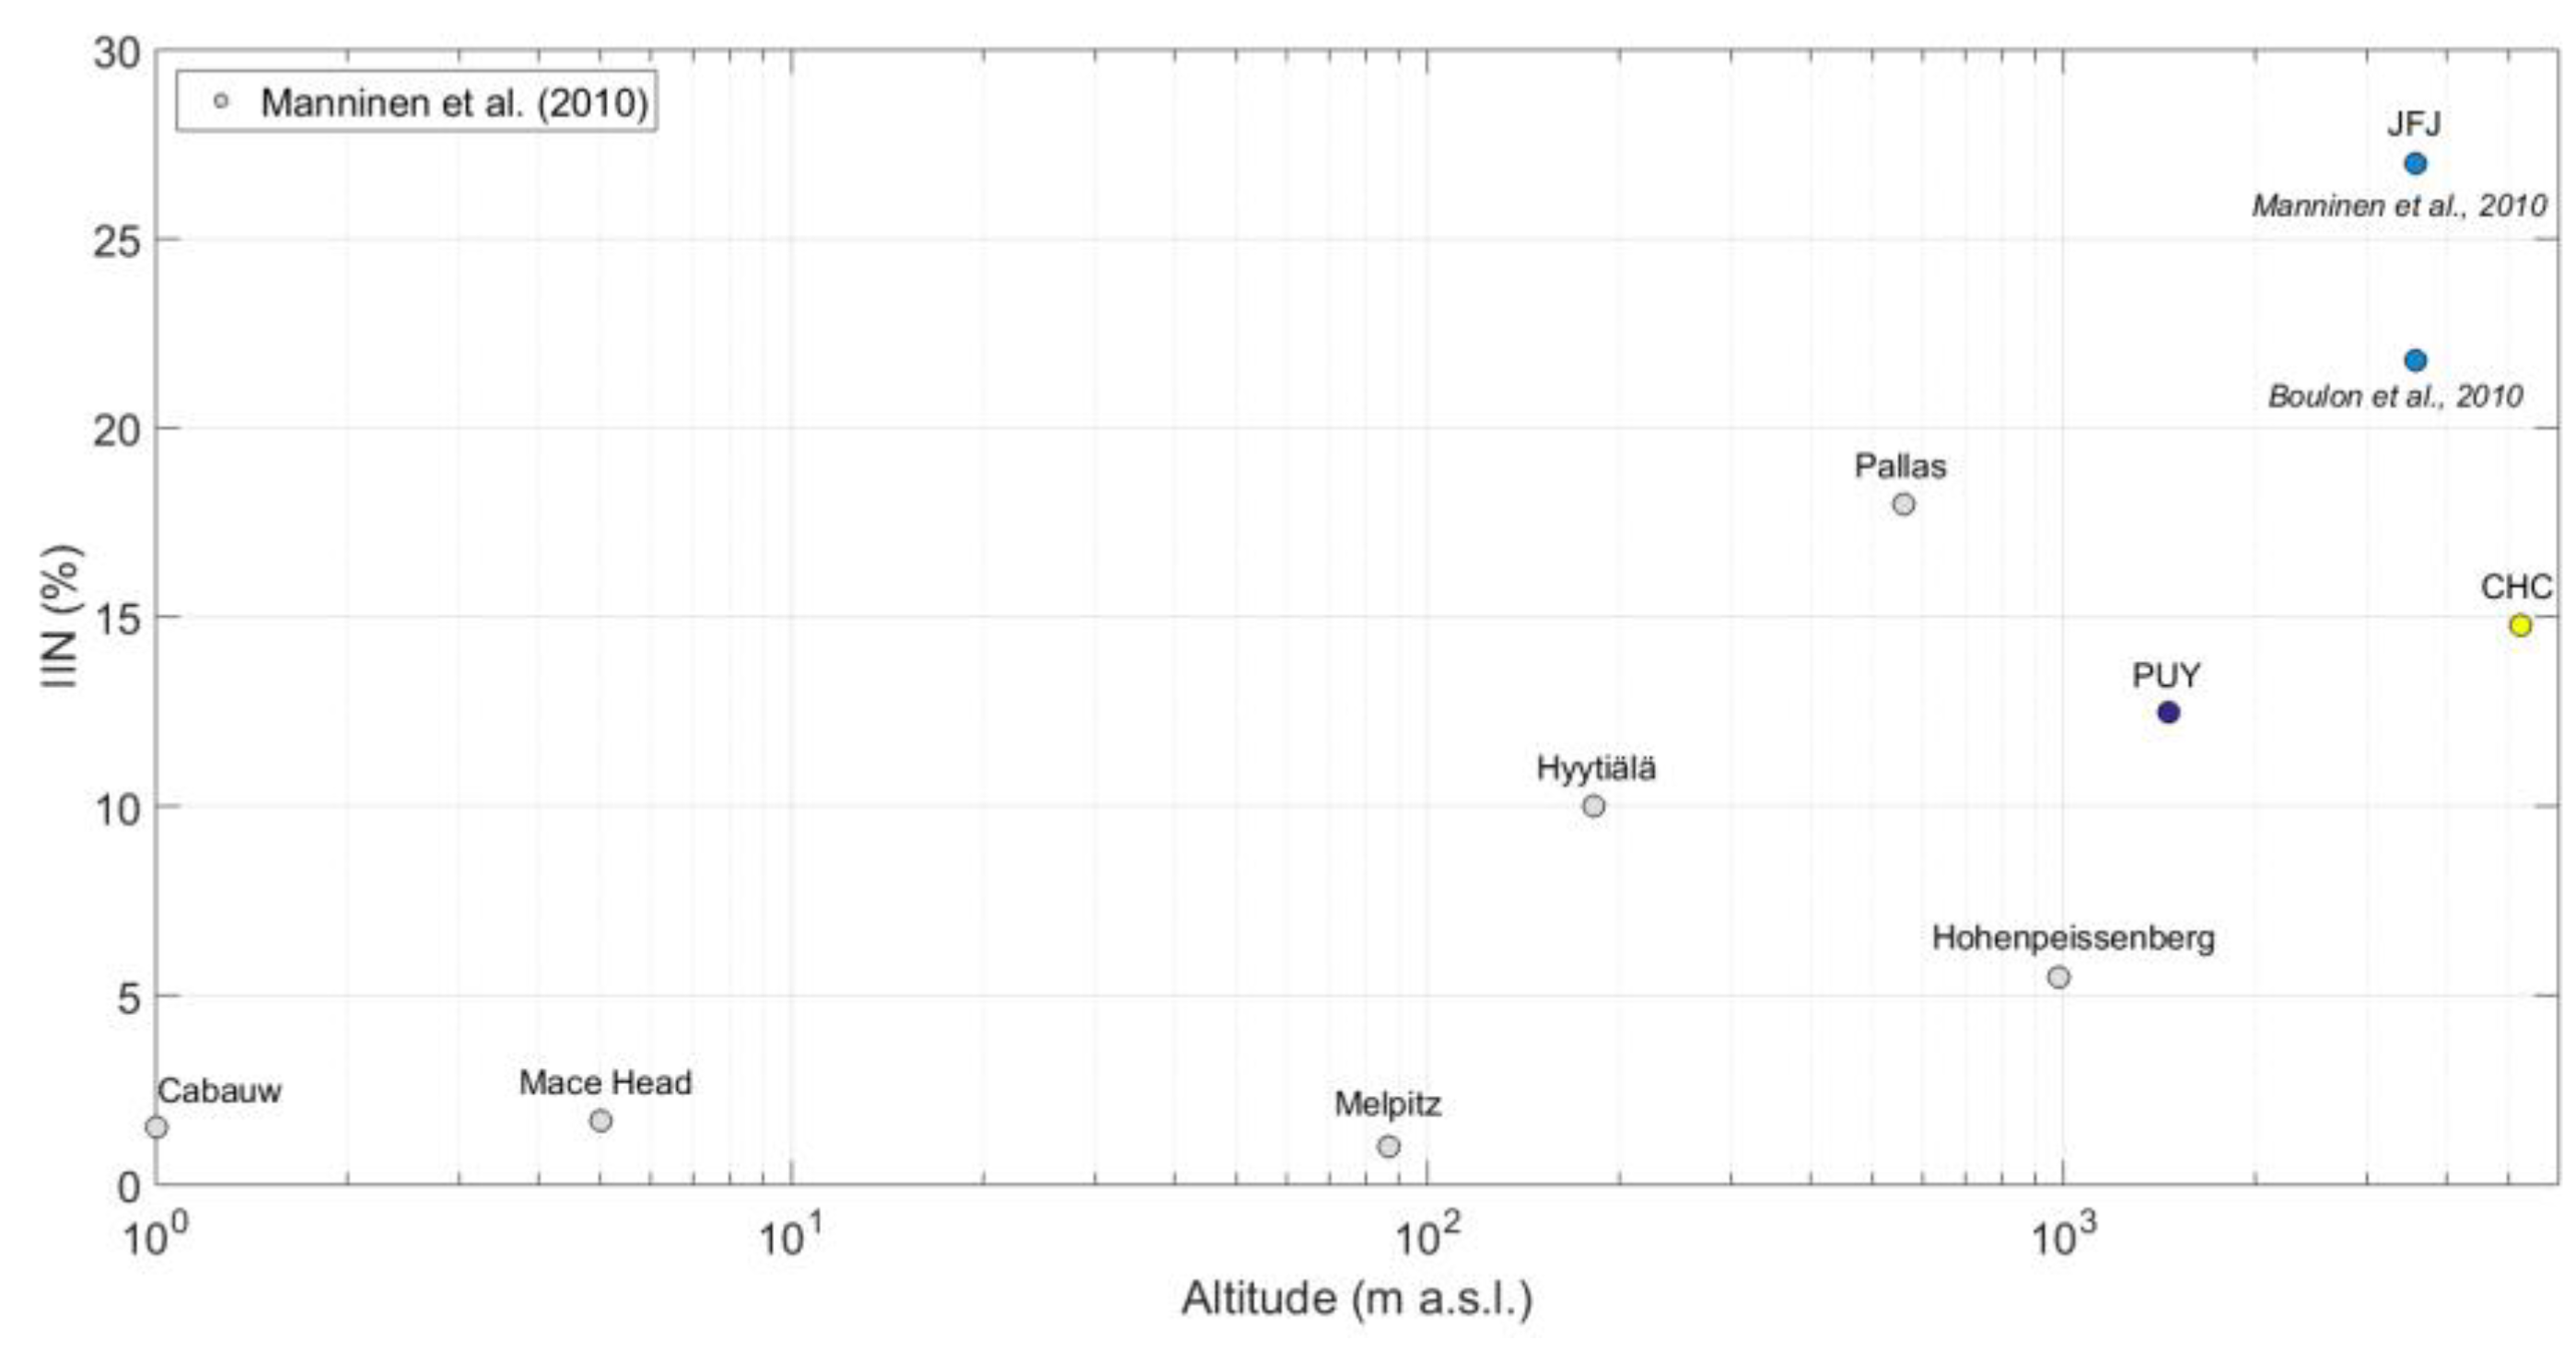
4.2. Influence of Ions

Ions were expected to favor the formation of new cluster particles [72,73,74,75,76]. Modeling exercises involving the ion mediated nucleation scheme predicted that ions could contribute significantly to new particle formation not only in the upper troposphere but also in the lower troposphere [77], and that ion mediated nucleation is significant in the tropical upper troposphere, the entire middle latitude troposphere, and over Antarctica [78]. In the CLOUD chamber, experiments also showed that ions were increasing nucleation rates, especially at lower temperatures [79], and that they had a stabilizing role for the nucleation of biogenic compounds [80] or in general conditions where neutral clusters were unstable [81]. In the ambient boundary layer, observations showed the involvement of ions in new particle formation events by studying the overcharging of freshly nucleated particles [49,65,82]. At high altitudes, observations of charged nanoparticle size distributions were relatively scarce. The study by Rose et al. (2013) [44] at the PUY station showed that positive ion concentrations and diameters increased on NPF event days compared to non events days, while negative ion concentrations and sizes were not different on event and non event days. At CHC, positive ion concentrations were also higher than negative ion concentrations, especially for NPF event days (Figure 4).
Ions are produced in the atmosphere either by radioactive decay of radionuclides (mainly radon and thoron) emitted from the ground or by external radiation [gamma radiation or galactic cosmic rays (GCR)]. While radionuclides decay decreases with altitude, cosmic rays and gamma radiation increase with altitude. The influence of GCR on the Earth’s climate through their impact on particle nucleation and growth as well as cloud formation has long been debated [83,84,85,86,87]. At high altitude stations, ions may play a more pronounced role in the formation of new particles due to the presence of higher levels of external radiations or a reduced role due to lower radionuclide concentrations. At the PUY station, the higher positive ion concentrations observed during NPF events could not be explained by an increase of ionization sources (radon or GCR) or by a decrease of ion sinks on NPF event days compared to non event days. Rose et al. (2013) [44] estimated that ionization rate variability was dominated by external radiation. At PYR, negative ion concentrations showed a clear diurnal variation, reaching 2000 to 3000 cluster ions cm−3 during the day, while they were in the range 100–800 cm−3 during the night. The calculated ion source was nine ion pairs cm−3, which was twice as high as the one calculated for the boundary layer site of Hyytiälä [72,88] but of the same order as the ion source calculated at the PUY station [44] when using external radiations (gamma and GCR) measured at the Basic Environmental Observatory (BEO) located at peak Moussalain Rila mountain (2925 m a.s.l.) in Bulgaria [89]. At CHC, a significantly stronger daytime increase (compared to night time concentrations) of both negative and positive ions was observed on NPF event days compared to non event days (Figure 4), but daytime concentrations were lower than at the PYR station despite the very similar altitude. Both positive and negative ion concentrations were increased by about 90–100 ions cm−3 from night time to daytime during NPF event days, while they only increased by less than 20 ions cm−3 during non event days (Figure 4). At JFJ, positive and negative cluster ion concentrations varied from around 700 cm−3 during night time to 850 cm−3 during daytime [45]. A shift of the positive cluster mode diameter to larger sizes and an increase of the positive cluster ion concentrations were specifically observed on event days. At PUY, an increase of positive cluster ion concentrations (no increase was observed for the negative cluster ion concentrations) was detected on nucleation event days from the range 200–300 cm−3 to 400–500 cm−3 [44].
The relationship between night time ion concentrations (which would be representative of the pristine free troposphere) and altitude was not straightforward unless we excluded the Southern hemisphere station CHC; the highest altitude stations showed the highest positive and negative ion concentrations when PUY, JFJ, and PYR stations were compared. Because total particle formation rates (neutral and ion induced) were globally observed to be lower at high altitudes, ion-induced nucleation was more significant relative to neutral nucleation at higher altitudes. Ion induced nucleation (IIN) rates could be calculated to evaluate the role of ions on particle formation rates. Figure 5 shows the IIN fraction for stations of different altitudes as a function of the altitudes of these stations. There was a clear tendency for there to be higher IIN fractions for higher altitudes, at least for Northern hemispheric sites. From Figure 2, one could infer that this tendency was likely due to the lower neutral particle formation rate at high altitudes combined with the higher charged particle formation rate at high altitudes compared to low altitudes. A more detailed study on the IIN rate in the FT or the BL performed by Rose et al. (2015c) [90] at the PUY station pointed to the IIN fraction reaching 50% in the FT (detected via LIDAR measurements) versus 4% at the site in the PBL. A statistical test (Ranksum function in Matlab) was applied to high altitude versus low altitude datasets, concluding the statistical robustness of the difference between INN at high altitude compared to INN at low altitude. To conclude this section, at the altitudes considered in this study, ions, and especially positive ions, seemed to contribute to the formation of new particles to a higher extent compared to boundary layer sites, but their contribution stayed at a modest level since the total concentration of particles produced was lower than at BL sites.

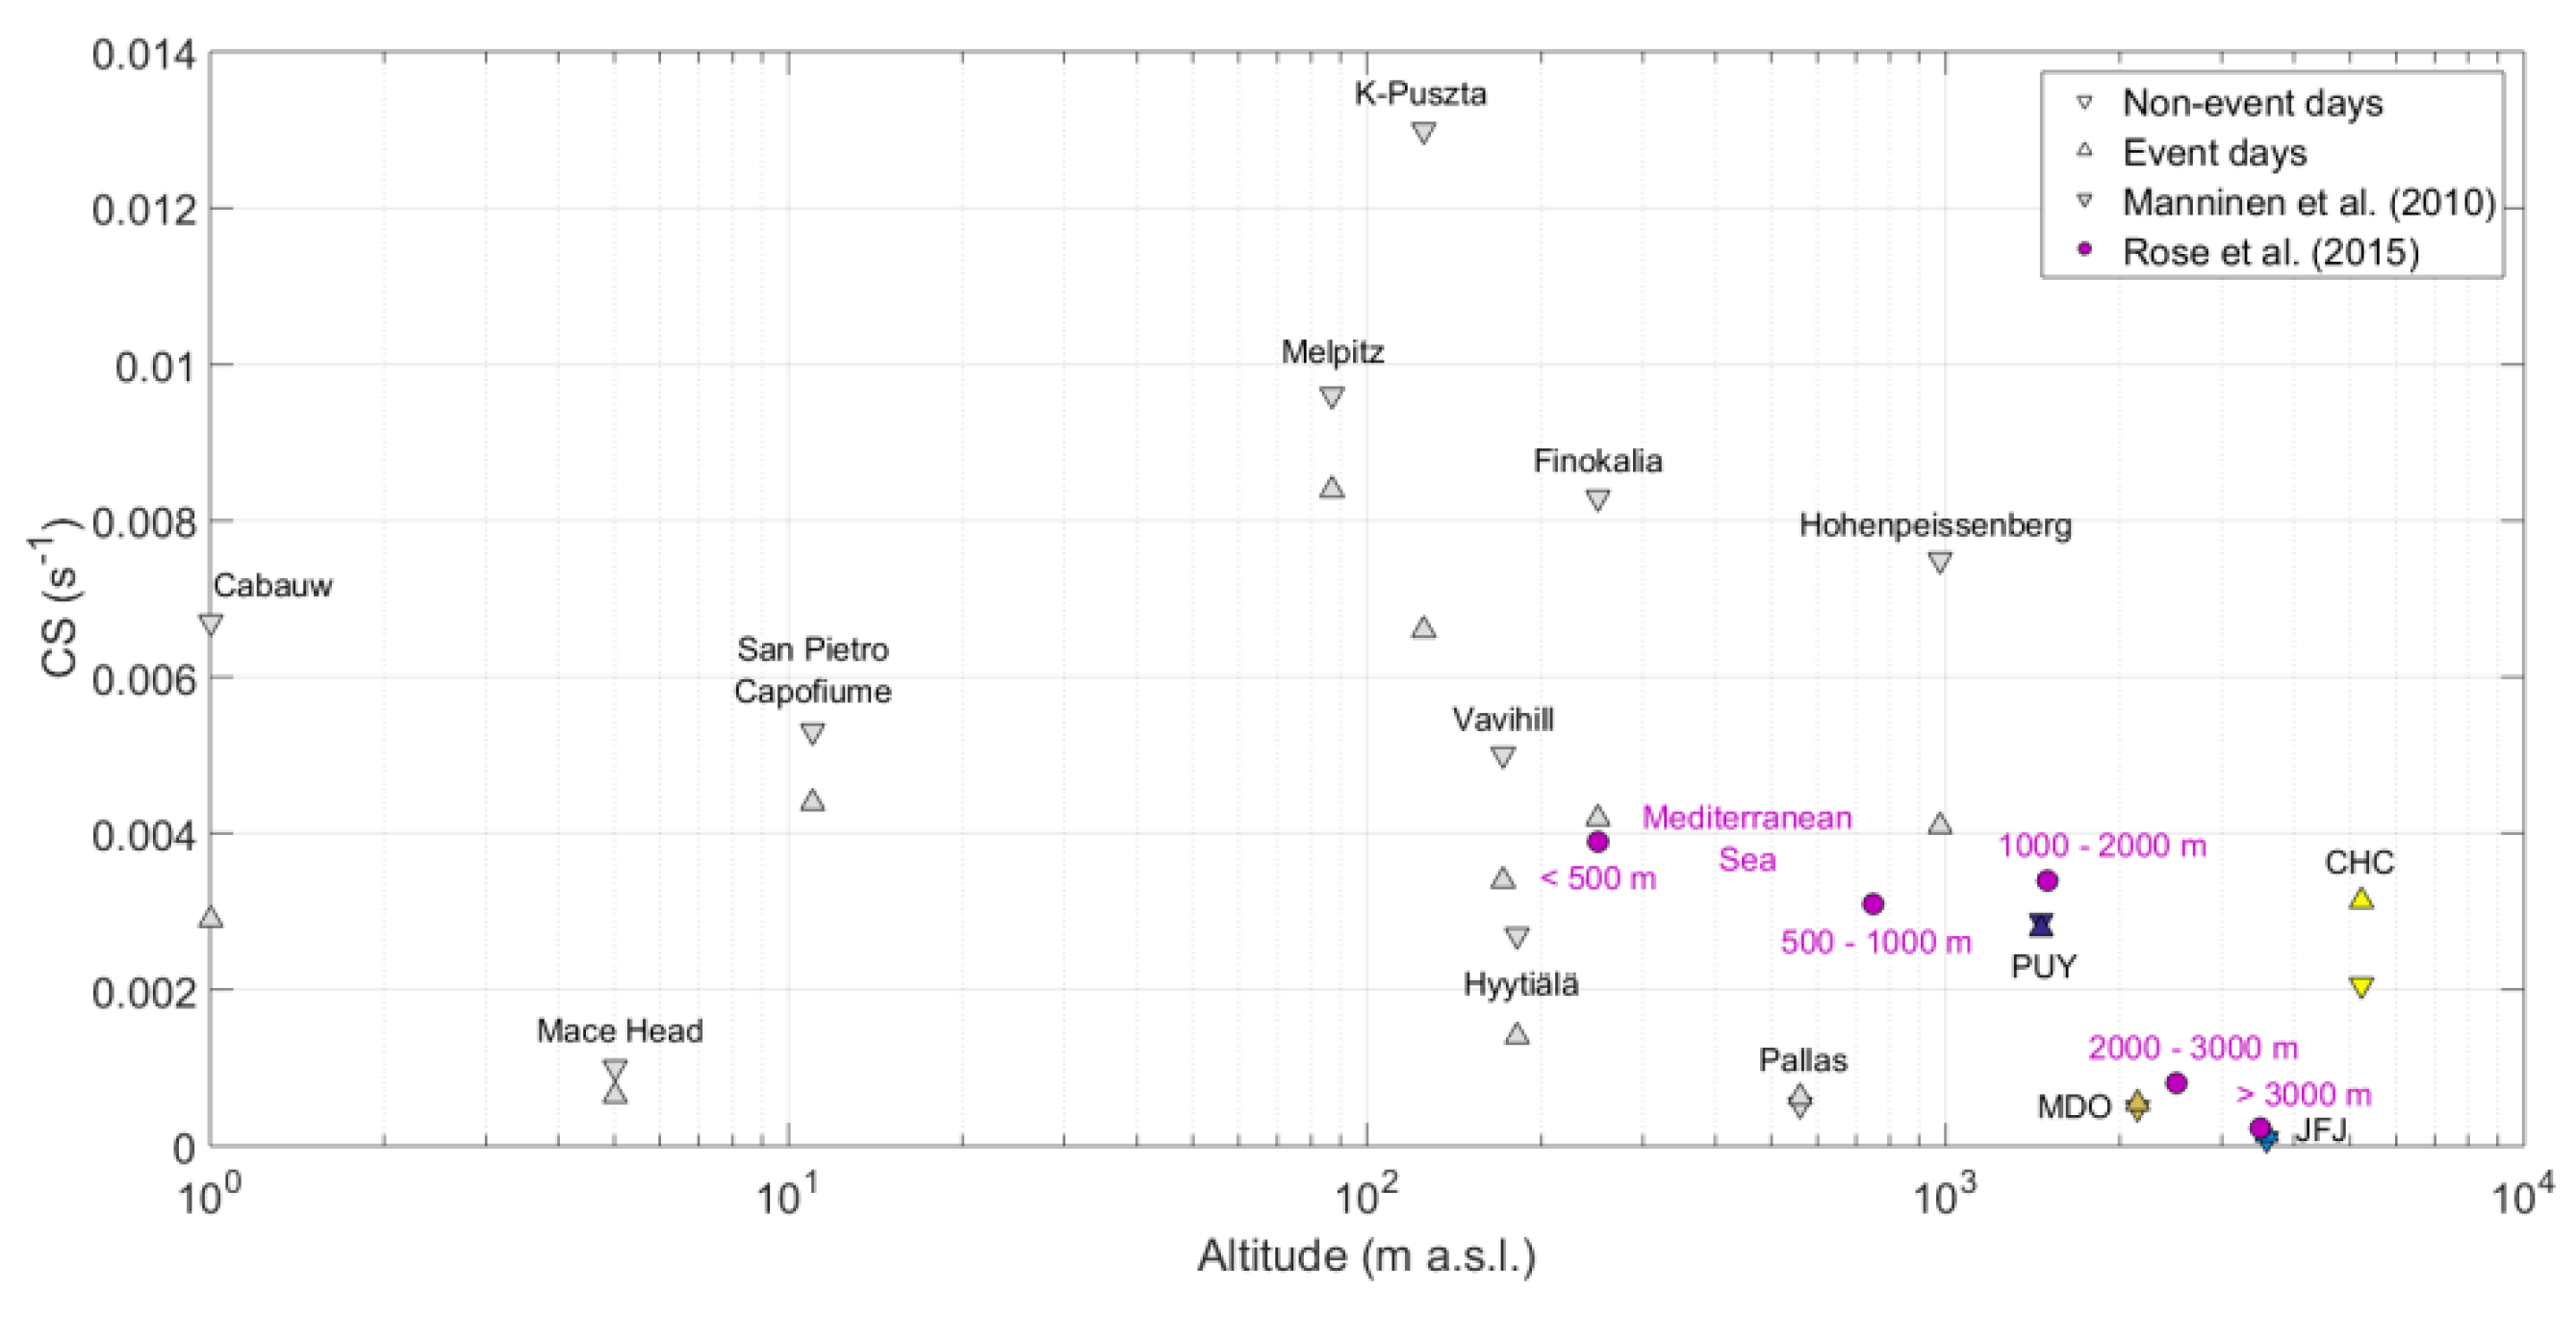
4.3. Role of the Condensational Sink

The CS represents the loss of condensable gases due to pre-existing particles [91]. High CS was thus expected to have an inhibiting effect on NPF. Aerosol particle concentrations generally decreased with altitude, which was reflected by a simultaneous decrease of CS (as illustrated by Figure 6) and may have offered favorable conditions for NPF to occur at high altitude. However, the impact of CS on the occurrence of NPF at high altitude was not straightforward and appeared to be different from one high altitude site to the other. At the PUY station, Boulon et al. (2011) [43] calculated the mean CS during the few hours preceding the average nucleation onset time (06:00–09:00 LT) and under out-of-cloud conditions. They found that, on average, the CS was lower for NPF event days than for non event days, illustrating the inhibiting effect of high CS on nucleation. At Mount Tai, Lv et al. (2018) [63] also reported that the hourly average CS calculated on non-NPF event days was higher than on NPF days. In line with these findings, Venzac et al. (2008) [39] found that, at PYR, high CS was inhibiting the occurrence of NPF events, as a frequency less than 10% was observed for CS higher than 2.1 × 10⁻³ s−1, while a frequency of nearly 50% was observed when the CS was lower than this value. This relation of CS to the occurrence of NPF is often reported in literature and is illustrated in Figure 5 for the sites located below 1000 m a.s.l. However, for several sites above this altitude, the opposite behavior was observed. At JFJ, Boulon et al. (2010) [45] found that the NPF frequency was positively correlated to the CS, suggesting that the high CS was not reducing the occurrence of NPF. This feature was reported in the literature for the Izana station, where high condensation sinks were observed during NPF events [56]. At CHC, Rose et al. (2015) [47] also found a higher CS value in the hours prior to nucleation onset for the NPF event days compared to the non event days. Lastly, at MDO, the annual median CS (2 h prior to nucleation) was higher for NPF event days than for non event days [40]. The authors also evaluated whether the frequency of nucleation was correlated to a frequency of exceeding a CS threshold. They found a similar seasonal variation between the frequency of CS exceeding a threshold value of 1.04 × 10⁻³ s−1 and the frequency of occurrence of NPF events. For these high altitude sites, the occurrence of the NPF process might be determined rather by the availability of condensable vapors, which are likely to be transported together with pre-existing particles from lower altitudes. At lower altitude sites, the presence of condensable vapors is probably not as strong a limiting factor to trigger the nucleation as at the higher altitude stations, because condensable vapors are always present at relatively high concentrations due to the proximity of the sources. In these condensable species- enriched environments, a low CS becomes the main condition for nucleation to occur. An exception to these general features is the Storm Peak Laboratory (SPL) which, although located at 3210 m a.s.l., showed NPF events associated with a low surface area of pre-existing particles [55]. The Storm Peak Laboratory may have special features due to the proximity of higher SO2 local emissions compared to other high altitude sites.

4.4. Favorable Air Mass Types and Precursors at High Altitudes

Because the upper troposphere is naturally a condensing vapor-poor environment, intrusions of polluted air are most likely to bring the necessary precursors to nucleating and/or condensing vapors despite the higher levels of CS observed in these air masses, as shown in the previous section. Mountain wind circulation and convective uplifting can bring emissions from continental surface sources up to the FT, enhancing the NPF frequency and intensity. In line with this assumption, polluted air masses were shown to be more favorable to NPF events at some high altitude locations, contrary to observations reported for locations of the lower planetary boundary layer.
At JFJ, more polluted air masses from Eastern Europe [92] had the highest probability to trigger NPF events, especially in comparison to cleaner air masses coming from Western Europe (mainly of oceanic origin) and from Nordic origin [45]. Within cleaner air masses, NPF events were less frequent than in polluted air masses, but the cluster concentrations were increased during the nucleation hours compared to non event days. In contrast, pre-existing cluster concentrations measured prior to nucleation hours in polluted air masses on NPF event days were already three times as high as for non event days, and new clusters were not further produced during nucleation hours [45]. This finding indicated that, at high altitudes, polluted air masses transported clusters formed previously and precursors to condensable gases that would further grow on NPF event days. At MDO, Foucart et al. (2018) [40] found similarities between the seasonal variation of black carbon (BC) concentration and that of the particle formation rate. In this remote high altitude location, NPF was not more frequent in air masses with an anthropogenic influence, but the events were of a stronger intensity. The growth rate of newly formed particles was found to have the same seasonal variability as CO concentrations rather than BC concentrations. Again, this showed that condensable gases contributing to nucleation were different from the ones contributing to the growth of newly formed particles, but also that more polluted air could be more favorable to increased nucleation and growth rates at high altitudes. These features were in contrast to BL locations such as the Boreal forest, where Nordic air masses were found to favor NPF [93,94]. In areas where precursors of condensable species were found in abundance, such as forested areas, the inhibiting effect of a high condensational sink seemed to be a determining factor for NPF occurrence and intensity.
However, polluted air masses did not universally favor NPF at high altitudes. Some other nucleation precursors, such as compounds of marine origin transported over long distances at high altitude rather than low altitude, would also promote nucleation and growth. At PYR, the nucleation mode particle concentrations were highest during monsoon and post-monsoon seasons, and within these seasons, NPF preferentially occurred within air masses of Western origin (monsoon) and Southwest origin from the Arabian Sea (post-monsoon), which likely contained a marine component [95]. At CHC, air masses from the oceanic sector, although they did not occur often (less than 10% of the time), showed a frequency of NPF occurrence close to 100% of the days of observation, while NPF in air masses originating from the Amazonian region and the continental sector were much less frequent [47]. The high seasonal variability of air mass types at CHC may have partially explained the observed NPF frequency seasonal variation. The MDO station is located on an island surrounded by air masses containing compounds of marine origin, and one of the highest NPF frequencies of occurrence was found at this site compared to the others. This high frequency could be linked to marine precursors and/or to the overall low CS of the Southern Indian Ocean.
In the Andes, the particle formation rate did not have a strong air mass dependency except for oceanic air masses that traveled north on the western coast line of Chile before reaching the CHC station and favoring particle formation. Growth rates did not differ from one air mass type to the other except for the GRs of larger clusters (7–20 nm) that were significantly increased in air masses traveling over the Amazonian rainforest containing high levels of biogenic sources and continental air masses containing more anthropogenic compounds. Air masses promoting nucleation or growth were not the same for CHC as the ones promoting nucleation or growth reported by Boulon et al. (2010) [45] for the JFJ station, but both datasets confirmed that different species of different air mass type origins contributed either to nucleation or to cluster growth. Rose et al. (2015a) [47] argued that the Amazonian air masses were likely rich in isoprene, which is more a growth-promoting precursor than a nucleation precursor [96,97].
There are few indications of the nature of nucleation and growth precursor species available in literature for high altitude stations. At the Izana station, which is located in a marine environment, higher SO2 concentrations and UV radiation were observed during NPF events compared to during non events [56]. Garcia and co-workers (2014) [56] calculated that the condensation of sulphuric acid vapor accounted for most of the measured particle growth during most of the year. At Mount Tai, higher SO2 concentrations were measured during NPF days compared to non-NPF days on average, and air masses from the continental origin were identified to be more favorable to the occurrence of NPF [63]. The dominant role of SO2/H2SO4 was not confirmed at the PUY station. Boulon et al. (2011) [43] reported that, at this site, sulphuric acid concentrations calculated with the parameterization from Petäjä et al. (2009) [98] were not significantly different between event and non event days, and their average calculated over the 09:00–11:00 (LT) period during which NPF occurred was not correlated to the 2 nm particle formation rates. Hence, neither the frequency of occurrence nor the intensity of NPF seemed to be primarily driven by sulphuric acid. Also, the study by Rose et al. (2015c) [90] at the PUY station showed that, when isolating FT air masses from PBL air masses, sulphuric acid was not correlated to cluster concentrations. The same conclusion was found at the JFJ station [45]. Both for the PUY and the JFJ stations, the hypothesis of a minor contribution of sulphuric acid contribution to NPF was reinforced by the larger role of positive ions played during nucleation, as mentioned in Section 4.2 [44,45]. At the JFJ, further measurements of the nature of nucleating clusters performed by Bianchi et al. (2016) [25] confirmed that pure sulphuric acid nucleation could not explain the NPF observed at the site and that highly oxidized organic compounds were either contributing or were mainly responsible for the formation of new particles.

5. Is NPF Favored at a Preferential Altitude?

As already mentioned, ground-based high altitude stations offer the possibility to study the occurrence and characteristics of NPF events over large time scale, but the analysis suffers from difficulties in identifying the atmospheric layer these NPF events are representative of. The diurnal and seasonal variability of the vertical transport of particulate and gas-phase components from the PBL to the altitude of the station is at the origin of these difficulties, and they are highly dependent on the local surrounding topography of each station. Several studies have attempted to elucidate if NPF was actually occurring within the FT or already occurred in the PBL before reaching the sites that occasionally offer FT conditions. One method to provide this information is to analyse the time at which the concentrations of the freshly formed cluster particles start to rise compared to the time at which PBL tracers start to increase. At PYR, intermediate ions concentration increases are detectable about an hour after the change of water content indicates that boundary layer air reaches the site [39]. The authors estimated that this timing corresponded to nucleation occurring at the interface between the PBL and FT. At MDO, the increase of the small ions concentration is occurring from 09:00 (LT) during summer to 10:00 (LT) during winter, which corresponds to about 3 h after sunrise. The concentration of BC increases half an hour later than the occurrence of the cluster ion mode [40], indicating that nucleation may be initiated at the interface between the PBL and the FT again. Another methodology to infer if NPF is occurring in the PBL or in the FT is to segregate air masses sampled at the high altitude site using a PBL tracer. At CHC, Rose et al. (2017) [2] used the wind turbulence to segregate these two air mass types. They found that NPF event occurred nearly with the same frequency in the FT (39% of the time) than in the PBL (48% of the time). The identification of the air mass layer where that station lay when nucleation occurs was performed over the period of the day when the lowest size of ultrafine particles are detected (early morning), for which the FT air is close to the PBL interface. A short time period analysis of NPF events occurring at Mt Norikura (Japan, 2770 m a.s.l.) (Nishita et al. 2008) [99] showed that nucleation mode particles were observed in the mixed layer air, but not detected in the FT. However, the study was performed only over a period of 23 clear-sky days of analysis.
The most common experimental strategy used to investigate the vertical extent of NPF over statistically relevant time periods is to deploy the same instrumentation at a mountain top and at a nearby lower altitude station. This strategy was adopted in the work from Boulon et al. (2011) [43] at the PUY station over a multiyear period. The authors show that the frequency of NPF was significantly higher at the high altitude site (PUY, 35.9%) compared to the lower altitude site (Opme, 660 m a.s.l., 20.8%). 30% of detected NPF events occurred simultaneously at both sites, 25% occurred first at the lower altitude site, and then at the PUY station with a time delay of about 30 min, and 45% of the NPF events occurred above the PBL height, i.e., at the PUY station only, within what the authors determined to be an “interface layer”. An interesting result also reported in this study is the higher INN fraction (32%) for the NPF detected in the interface layer, compared to INN fraction calculated for NPF occurring within the whole PBL (6%).
Although limited to a shorter time period, airborne measurements performed above the Mediterranean Sea actually confirmed the occurrence of NPF in the upper layers of the atmosphere. Rose et al. (2015b) [31] showed that the frequency of occurrence of particles in the 5–10 nm size range was significantly higher, 50%, at altitudes between 2000–3000 m, compared with much lower occurrences (<10%) at altitudes less than 1000 m a.s.l. Minikin et al. (2003) [61] provide profiles of Aitken mode particles that show an increase of concentrations and a higher variability in the concentrations in the 3000–5000 m altitude range in both the Southern and Northern hemispheres. Also using airborne observations performed in the vicinity of the Cabaw station (The Netherlands), Wehner et al. (2010) [100] demonstrated that ultrafine particle concentrations were enhanced in the turbulent residual layer above the PBL, in the altitude range close to 800 m a.s.l. in the early morning hours. The authors suggest that the particles newly formed in the residual layer are entrained within the PBL during the PBL development, and are being detected at the ground-based station later on when they experience further growth. Several authors mention that on top of higher radiation and lower condensational sinks, turbulent mixing could lead to local supersaturation of condensable vapours promoting the nucleation process. The need for a recent contact of the higher altitude air masses with the PBL seems however to be necessary. Tröstl et al. (2016) [26] applied an original classification methodology to the meteorological, gas-phase and aerosol data sets to isolate FT conditions at the JFJ station, and report that NPF is actually occurring within the FT, when the air mass has had a contact with the PBL within the last 24–48 h time window. The growth of particles newly formed within the mid-altitude range has often been reported to be low [26,31,99].

6. Importance of NPF at High Altitude for the Production of Cloud Condensation Nuclei

Methods based on the analysis of the particle size distribution were developed to evaluate the contribution of nucleation to the formation of new CCN by assuming a CCN threshold size [101] and applying it to high altitude stations [2,26,46,102]. Because of the dynamics that occur around these altitude sites, such an analysis becomes even more challenging than at BL sites. It can take anywhere from a few hours to several days for the clusters to reach CCN sizes, which means that particles measured at the station may have been formed away in the troposphere, transported to the site, and further mixed with primary particles entrained from the BL, making it difficult to distinguish between the different contributions.
Rose et al. (2017) [2] evaluated the concentration of CCN formed during NPF events at the CHC station. These concentrations are reported in Figure 7 together with the values obtained at other stations using similar methods. Significant differences were seen among the stations, with the highest CCN production observed at a polluted urban site (7300 #>50. cm−3), followed by the CHC station and Botsalano (South Africa, 1424 m a.s.l. [103]).
Regarding the relative contributions of primary and secondary particles to the CCN budget, additional analysis is reported in the literature. Combining in-situ measurements and modeled CCN concentrations provided by the aerosol model GLOMAP, Laakso et al. (2013) [103] showed that CCN could most probably originate from BL nucleation at Botsalano during the wet season and could, in contrast, derive from primary emissions during the dry season. Similar seasonal contrasts were observed by Tröstl et al. (2016) [26] at JFJ and by Rose et al. (2017) [2] at CHC. However, this last study was, to our knowledge, the only one that tried to really separate the contribution of particles grown after nucleation from the contribution of particles transported to the site. At CHC, when corrected from pre-existing particles transported to the station, NPF represented around 2500–3500 #>50. cm−3 and around 400–650 #>100. cm−3, with a larger contribution on average compared to transport, especially during the wet season. Lower CCN production number concentrations were found for the MDO station (1600 #>50. cm−3). Overall, even though CCN number concentration increases due to NPF seemed to be larger for high altitude sites (CHC, MDO, Botsalano) compared to lower altitude sites (Figure 7), we do not have enough high altitude data for a statistically robust conclusion.
Conditions that might favor the NPF production of new CCN at high altitudes were specifically investigated by Rose et al. (2017) [2] regarding the location of the station in the tropospheric layers. This analysis demonstrated that the potential to form new CCN was higher for NPF events started in the BL (67% against 56% in the FT), most probably due to increased amounts of condensable species compared to the FT. In contrast, higher CCN concentrations were found when nucleation initially occurred in the FT, suggesting that the cleaner free tropospheric conditions could favor the survival of the clusters. These last results thus support model outcomes that predict that FT nucleation could produce significant amounts of aerosol particles and feed the whole tropospheric column.
Because the growth of nucleated particles was found to be relatively low within FT air masses [3,26], the contribution of NPF to the production of CCN was likely taking place over several days after NPF occurred. Hence, it is likely that the above mentioned estimations were a lower estimate of the contribution of NPF to CCN concentrations.

7. Outlook

At high altitude monitoring stations, the frequency of NPF events was shown to be high (from 30% to 67% of the time) up to altitudes over 5000 m a.s.l. This high frequency of NPF events was observed to strongly impact the average aerosol size distribution daily variation, which implied that it was a significant source of particles in the upper troposphere. The seasonal variation of NPF frequencies observed at high altitudes usually showed a maximum during spring and autumn periods, as was also reported for PBL stations. Exceptions to this were observed for stations located in tropical areas where cloud occurrence relative to the station location modulated the NPF frequency seasonal variability. Clouds had an overall inhibiting effect on the occurrence of NPF in the case of in-cloud observations, but they promoted NPF when they formed or dissipated below the high altitude station.
Particle formation rates did not exceed 2.5 cm−3 s−1 for all high altitude sites; they were clearly lower than those measured on average at low altitude sites and were not always linked to NPF frequency. There were indications that different mechanisms for nucleation and NPF were occurring at higher altitudes, involving a higher fraction of particle formation via the charged pathway and especially via positive ions. Also, specific to high altitudes, authors reported that low condensational sinks were not necessarily conditioning the occurrence of NPF; for a majority of stations (and especially for stations at altitudes higher than 1000 m a.s.l.), higher mean CS was found on NPF event days compared to non event days, indicating that the precursor gases associated with higher CS were needed to initiate nucleation and early growth. This finding was in line with the suggestion that NPF occurred in the FT when the air mass had recent contact with the PBL. There—and especially at the interface with the previous day’s PBL—increased radiation, lower temperatures, and pre-existing CS favored the formation of clusters that took a few hours to up to several days to grow to CCN sizes or to be reinjected in the PBL. The increase of CCN concentrations due to the occurrence of NPF at high altitudes appeared higher than the CCN formed from NPF at lower altitudes, but more statistics at high altitudes are needed to support this hypothesis. Lastly, for most high altitude stations, sulphuric acid was not found to be the main precursor to form new particles. However, there is a crucial lack of simultaneous measurements of NPF physical characteristics and environmental precursor gases that limits the interpretation. Our conclusions are based on a few datasets from which indirect observations were cross-compared. Overall, high altitude stations differ considerably from one another in their geographical locations and altitudes as well as in their surrounding topography, which determines how the boundary layer influences the measurements and which may be critical for understanding the process affecting NPF. Hence, in order to compare the occurrence of nucleation within FT air masses for different altitudes and geographical locations, a careful screening of the datasets should be applied, segregating FT air masses from PBL air masses using a set of PBL tracers, as performed by Farah et al. 2018 [104] for the PUY station. Because most high altitude stations mostly lay within the PBL during the day when NPF occurs, the data classification needs to be performed on sufficiently long-term time series that will provide statistically robust analysis of NPF within the FT.

8. Data Availability

DMPS data are accessible from the EBAS website (http://ebas.nilu.no/). (A)(N)AIS data can be provided upon request.

Author Contributions

K.S. and C.R. wrote the manuscript, C.R. performed figures. P.L., P.B., A.W., M.A. and A.M. commented on the first draft of the manuscript and contributed to the research design in stations PUY, CHC, MDO and PYR. A.M. and A.L. performed data acquisition at CMN.

Acknowledgments

Data analyzed for the present work were acquired within the frame of the project ACTRIS-2 (Aerosols, Clouds, and Trace gases Research InfraStructure) under the European Union—Research Infrastructure Action in the frame of the H2020 program for “Integrating and opening existing national and regional research infrastructures of European interest” under Grant Agreement N°654109. Measurements performed at PUY, MDO and CHC received support from CNRS-INSU and Ministry for Research and Education under ACTRIS-FR and long-term monitoring aerosol program SNO-CLAP. Measurements at CHC were made possible due to the support of UMSA through the Institute for Physics Research and the support from IRD (Institut de Recherche pour le Développement) under Jeune Equipe program CHARME awarded to LFA and by Labex OSUG@2020 (Investissements d’avenir—ANR10 LABX56). Measurements at PYR were carried out in the framework of the UNEP-ABC (Atmospheric Brown Clouds) and Ev-K2-CNR SHARE (Stations at High Altitude for Research on the Environment) projects. The contribution of CNRS through the PICS bilateral program between CNR and CNRS and through the LEFE-INSU program is gratefully acknowledged.

Conflicts of Interest

The authors declare no conflict of interest.

References

  1. Venzac, H.; Sellegri, K.; Laj, P. Nucleation events detected at the high altitude site of the Puy de Dôme Research Station, France. Boreal Environ. Res. 2007, 12, 345–359. [Google Scholar]
  2. Rose, C.; Sellegri, K.; Moreno, I.; Velarde, F.; Ramonet, M.; Weinhold, K.; Krejci, R.; Andrade, M.; Wiedensohler, A.; Ginot, P.; et al. CCN production by new particle formation in the free troposphere. Atmos. Chem. Phys. 2017. [Google Scholar] [CrossRef]
  3. Herrmann, E.; Weingartner, E.; Henne, S.; Vuilleumier, L.; Bukowiecki, N.; Steinbacher, M.; Conen, F.; Collaud Coen, M.; Hammer, E.; Jurányi, Z.; et al. Analysis of long-term aerosol size distribution data from Jungfraujoch with emphasis on free tropospheric conditions, cloud influence, and air mass transport. J. Geophys. Res. Atmos. 2015. [Google Scholar] [CrossRef]
  4. Kulmala, M.; Kontkanen, J.; Junninen, H.; Lehtipalo, K.; Manninen, H.E.; Nieminen, T.; Petäjä, T.; Sipilä, M.; Schobesberger, S.; Rantala, P.; et al. Direct Observations of Atmospheric Aerosol Nucleation. Science 2013, 339, 943–946. [Google Scholar] [CrossRef] [PubMed]
  5. Kulmala, M.; Vehkamäki, H.; Petäjä, T.; Dal Maso, M.; Lauri, A.; Kerminen, V.-M.; Birmili, W.; McMurry, P.H. Formation and growth rates of ultrafine atmospheric particles: A review of observations. J. Aerosol Sci. 2004, 35, 143–176. [Google Scholar] [CrossRef]
  6. Kerminen, V.-M.; Chen, X.; Vakkari, V.; Petäjä, T.; Kulmala, M.; Bianchi, F. Atmospheric new particle formation and growth: Review of field observations. Environ. Res. Lett. 2018, 10. [Google Scholar] [CrossRef]
  7. Spracklen, D.V.; Carslaw, K.S.; Kulmala, M.; Kerminen, V.M.; Sihto, S.L.; Riipinen, I.; Merikanto, J.; Mann, G.W.; Chipperfield, M.P.; Wiedensohler, A.; et al. Contribution of particle formation to global cloud condensation nuclei concentrations. Geophys. Res. Lett. 2008, 35, L06808. [Google Scholar] [CrossRef]
  8. Merikanto, J.; Spracklen, D.V.; Mann, G.W.; Pickering, S.J.; Carslaw, K.S. Impact of nucleation on global CCN. Atmos. Chem. Phys. 2009, 9, 8601–8616. [Google Scholar] [CrossRef] [Green Version]
  9. Makkonen, R.; Asmi, A.; Korhonen, H.; Kokkola, H.; Järvenoja, S.; Räisänen, P.; Lehtinen, K.E.J.; Laaksonen, A.; Kerminen, V.-M.; Järvinen, H.; et al. Sensitivity of aerosol concentrations and cloud properties to nucleation and secondary organic distribution in ECHAM5-HAM global circulation model. Atmos. Chem. Phys. 2009, 9, 1747–1766. [Google Scholar] [CrossRef] [Green Version]
  10. Pierce, J.R.; Adams, P.J. Uncertainty in global CCN concentrations from uncertain aerosol nucleation and primary emission rates. Atmos. Chem. Phys. 2009, 9, 1339–1356. [Google Scholar] [CrossRef] [Green Version]
  11. Makkonen, R.; Asmi, A.; Kerminen, V.-M.; Boy, M.; Arneth, A.; Hari, P.; Kulmala, M. Air pollution control and decreasing new particle formation lead to strong climate warming. Atmos. Chem. Phys. 2012, 12, 1515–1524. [Google Scholar] [CrossRef] [Green Version]
  12. Dunne, E.M.; Gordon, H.; Kürten, A.; Almeida, J.; Duplissy, J.; Williamson, C.; Ortega, I.K.; Pringle, K.J.; Adamov, A.; Baltensperger, U.; et al. Global atmospheric particle formation from CERN CLOUD measurements. Science 2016, 354, 1119–1124. [Google Scholar] [CrossRef] [Green Version]
  13. Clarke, A.D. Atmospheric Nuclei in the Pacific Midtroposphere: Their Nature, Concentration, and Evolution. J. Geophys. Res. 1993, 98, 20633–20647. [Google Scholar] [CrossRef]
  14. Clarke, A.D.; Li, Z.; Litchy, M. Aerosol dynamics in the equatorial Pacific marine boundary layer: Microphysics, diurnal cycles and entrainment. Geophys. Res. Lett. 1996, 23, 733–736. [Google Scholar] [CrossRef]
  15. Clarke, A.D.; Varner, J.L.; Eisele, F.; Mauldin, R.L.; Tanner, D.; Litchy, M. Particle production in the remote marine atmosphere: Cloud outflow and subsidence during ACE 1. J. Geophys. Res. 1998, 103, 16397–16409. [Google Scholar] [CrossRef]
  16. Clarke, A.D.; Kapustin, V.N.; Eisele, F.L.; Weber, R.J.; Mc-Murry, P.H. Particle production near marine clouds: Sulfuric acid and predictions from classical binary nucleation. Geophys. Res. Lett. 1999, 26, 2425–2428. [Google Scholar] [CrossRef]
  17. Clarke, A.D.; Eisele, F.; Kapustin, V.N.; Moore, K.; Tanner, D.; Mauldin, L.; Litchy, M.; Lienert, B.; Carroll, M.A.; Albercook, G. Nucleation in the equatorial free troposphere: Favorable environments during PEM-Tropics. J. Geophys. Res. 1999, 104, 5735–5744. [Google Scholar] [CrossRef]
  18. Quinn, P.; Bates, T.S. The case against climate regulation via oceanic phytoplankton sulphur emissions. Nature 2011, 480, 51–56. [Google Scholar] [CrossRef]
  19. Pietikäinen, J.-P.; Mikkonen, S.; Hamed, A.; Hienola, A.I.; Birmili, W.; Kulmala, M.; Laaksonen, A. Analysis of nucleation events in the European boundary layer using the regional aerosol–climate model REMO-HAM with a solar radiation-driven OH-proxy. Atmos. Chem. Phys. 2014, 14, 11711–11729. [Google Scholar] [CrossRef]
  20. Collaud Coen, M.; Andrews, E.; Aliaga, D.; Andrade, M.; Angelov, H.; Bukowiecki, N.; Ealo, M.; Fialho, P.; Flentje, H.; Hallar, A.; et al. Identification of topographic features influencing aérosol observations at High altitude stations. Atmos. Chem. Phys. 2018, 18, 12289–12313. [Google Scholar] [CrossRef]
  21. Clarke, A.D.; Kapustin, V.N. A Pacific Aerosol Survey. Part I: A Decade of Data on Particle Production, Transport, Evolution, and Mixing in the Troposphere. J. Atmos. Sci. 2002, 59, 363–382. [Google Scholar] [CrossRef]
  22. Waddicor, D.A.; Vaughan, G.; Choularton, T.W.; Bower, K.N.; Coe, H.; Gallagher, M.; Williams, P.I.; Flynn, M.; Volz-Thomas, A.; Pätz, H.W.; et al. Aerosol observations and growth rates downwind of the anvil of a deep tropical thunderstorm. Atmos. Chem. Phys. 2012, 12, 6157–6172. [Google Scholar] [CrossRef] [Green Version]
  23. Clarke, A.D.; Kapustin, V.N. Hemispheric Aerosol Vertical Profiles Anthropogenic Impacts on Optical Depth and Cloud Nuclei. Science 2010, 329, 1488–1492. [Google Scholar] [CrossRef]
  24. Young, L.-H.; Benson, D.R.; Montanaro, W.M.; Lee, S.-H.; Pan, L.L.; Rogers, D.C.; Jensen, J.; Stith, J.L.; Davis, C.A.; Campos, T.L.; et al. Enhanced new particle formation observed in the northern midlatitude tropopause region. J. Geophys. Res. 2007, 112, D10218. [Google Scholar] [CrossRef]
  25. Bianchi, F.; Tröstl, J.; Junninen, H.; Frege, C.; Henne, S.; Hoyle, C.R.; Molteni, U.; Herrmann, E.; Adamov, A.; Bukowiecki, N.; et al. New particle formation in the free troposphere A question of chemistry and timing. Science 2016, 352, 1109–1112. [Google Scholar] [CrossRef]
  26. Tröstl, J.; Wayne, K.; Chuang, H.; Gordon, M.; Heinritzi, C.; Yan, U.; Molteni, L.; Ahlm, C.; Frege, F.; Bianchi, R.; et al. The role of low-volatility organic compounds in initial particle growth in the atmosphere. Nature 2016, 533, 527–531. [Google Scholar] [CrossRef] [Green Version]
  27. Wehner, B.; Werner, F.; Ditas, F.; Shaw, R.A.; Kulmala, M.; Siebert, H. Observations of new particle formation in enhanced UV irradiance zones near cumulus clouds. Atmos. Chem. Phys. 2015, 15, 11701–11711. [Google Scholar] [CrossRef] [Green Version]
  28. Korhonen, H.; Carslaw, K.S.; Spracklen, D.V.; Mann, G.W.; Woodhouse, M.T. Influence of oceanic dimethyl sulfide emissions on cloud condensation nuclei concentrations and seasonality over the remote Southern Hemisphere oceans: A global model study. J. Geophys. Res. 2008, 113, D15204. [Google Scholar] [CrossRef]
  29. Crumeyrolle, S.; Manninen, H.E.; Sellegri, K.; Roberts, G.; Gomes, L.; Kulmala, M.; Weigel, R.; Laj, P.; Schwarzenboeck, A. New particle formation events measured on board the ATR-42 aircraft during the EUCAARI campaign. Atmos. Chem. Phys. 2010, 10, 6721–6735. [Google Scholar] [CrossRef] [Green Version]
  30. Hamburger, T.; McMeeking, G.; Minikin, A.; Birmili, W.; Dall’Osto, M.; O’Dowd, C.; Flentje, H.; Henzing, B.; Junninen, H.; Kristensson, A.; et al. Overview of the synoptic and pollution situation over Europe during the EUCAARI-LONGREX field campaign. Atmos. Chem. Phys. 2011, 11, 1065–1082. [Google Scholar] [CrossRef] [Green Version]
  31. Rose, C.; Sellegri, K.; Freney, E.; Dupuy, R.; Colomb, A.; Pichon, J.-M.; Ribeiro, M.; Bourianne, T.; Burnet, F.; Schwarzenboeck, A. Airborne measurements of new particle formation in the free troposphere above the Mediterranean Sea during the HYMEX campaign. Atmos. Chem. Phys. 2015, 15, 10203–10218. [Google Scholar] [CrossRef] [Green Version]
  32. Sellegri, K.; Laj, P.; Peron, F.; Dupuy, R.; Legrand, M.; Preunkert, S.; Putaud, J.-P.; Cachier, H.; Ghermandi, G. Mass balance of free tropospheric aerosol at the Puy de Dôme (France) in winter. J. Geophys. Res. 2003, 108. [Google Scholar] [CrossRef]
  33. Bonasoni, P.; Laj, P.; Angelini, F.; Arduini, J.; Bonafè, U.; Calzolari, F.; Cristofanelli, P.; Decesari, S.; Facchini, M.C.; Fuzzi, S.; et al. The ABC-Pyramid Atmospheric Research Observatory in Himalaya for aerosol, ozone and halocarbon measurements. Sci. Total Environ. 2008, 391, 252–261. [Google Scholar] [CrossRef]
  34. Baray, J.L.; Courcoux, Y.; Keckhut, P.; Portafaix, T.; Tulet, P.; Cammas, J.P.; Hauchecorne, A.; Godin Beekmann, S.; De Mazière, M.; Hermans, C.; et al. Maïdo observatory: A new high-altitude station facility at Reunion Island (21° S, 55° E) for long-term atmospheric remote sensing and in situ measurements. Atmos. Meas. Tech. 2013, 6, 2865–2877. [Google Scholar] [CrossRef]
  35. Fischer, H.; Kormann, R.; Klüpfel, T.; Gurk, C.; Königstedt, R.; Parchatka, U.; Mühle, J.; Rhee, T.S.; Brenninkmeijer, C.A.M.; Bonasoni, P.; et al. Ozone production and trace gas correlationsduring the June MINATROC intensive measurement campaign at Mt. Cimone. Atmos. Chem. Phys. 2003, 3, 725–738. [Google Scholar] [CrossRef]
  36. Mirme, A.; Tamm, E.; Mordas, G.; Vana, M.; Uin, J.; Mirme, S.; Bernotas, T.; Laakso, L.; Hirsikko, A.; Kulmala, M. A widerange multi-channel Air Ion Spectrometer. Boreal Environ. Res. 2007, 12, 247–264. [Google Scholar]
  37. Mäkelä, J.M.; Riihelä, M.; Ukkonen, A.; Jokinen, V.; Keskinen, J. Comparison of mobility equivalent diameter with Kelvin-Thomson diameter using ion mobility data. J. Chem. Phys. 1996, 105, 1562–1571. [Google Scholar] [CrossRef]
  38. Mirme, S.; Mirme, A. The mathematical principles and design of the NAIS—A spectrometer for the measurement of cluster ion and nanometer aerosol size distributions. Atmos. Meas. Tech. 2013, 6, 1061–1071. [Google Scholar] [CrossRef]
  39. Venzac, H.; Sellegri, K.; Laj, P.; Villani, P.; Bonasoni, P.; Marinoni, A.; Cristofanelli, P.; Calzolari, F.; Fuzzi, S.; Decesari, S.; et al. High frequency new particle formation in the Himalayas. Proc. Natl Acad. Sci. USA 2008, 105, 15666–15671. [Google Scholar] [CrossRef] [Green Version]
  40. Foucart, B.; Sellegri, K.; Tulet, P.; Rose, C.; Metzger, J.M.; Picard, D. High occurrence of new particle formation events at the Maïdo high altitude observatory (2150 m), Reunion Island (Indian Ocean). Atmos. Chem. Phys. 2018, 18, 9243–9261. [Google Scholar] [CrossRef]
  41. Kulmala, M.; Petäjä, T.; Nieminen, T.; Sipilä, M.; Manninen, H.E.; Lehtipalo, K.; Dal Maso, M.; Aalto, P.P.; Junninen, H.; Paasonen, P. Measurement of the nucleation of atmospheric aerosol particles. Nat. Protoc. 2012, 7, 1651–1667. [Google Scholar] [CrossRef]
  42. Wiedensohler, A.; Birmili, W.; Nowak, A.; Sonntag, A.; Weinhold, K.; Merkel, M.; Wehner, B.; Tuch, T.; Pfeifer, S.; Fiebig, M.; et al. Mobility particle size spectrometers: Harmonization of technical standards and data structure to facilitate high quality long-term observations of atmospheric particle number size distributions. Atmos. Meas. Tech. 2012, 5, 657–685. [Google Scholar] [CrossRef]
  43. Boulon, J.; Sellegri, K.; Hervo, M.; Picard, D.; Pichon, J.-M.; Freville, P.; Laj, P. Investigation of nucleation events vertical extent: A long term study at two different altitude sites. Atmos. Chem. Phys. 2011, 11, 5625–5639. [Google Scholar] [CrossRef]
  44. Rose, C.; Boulon, J.; Hervo, M.; Holmgren, H.; Asmi, E.; Ramonet, M.; Laj, P.; Sellegri, K. Long-term observations of cluster ion concentration, sources and sinks in clear sky conditions at the high-altitude site of the Puy de Dôme, France. Atmos. Chem. Phys. 2013, 13, 11573–11594. [Google Scholar] [CrossRef]
  45. Boulon, J.; Sellegri, K.; Venzac, H.; Picard, D.; Weingartner, E.; Wehrle, G.; Collaud Coen, M.; Bütikofer, R.; Flückiger, E.; Baltensperger, U.; et al. New particle formation and ultrafine charged aerosol climatology at a high altitude site in the Alps (Jungfraujoch, 3580 m a.s.l.; Switzerland). Atmos. Chem. Phys. 2010, 10, 9333–9349. [Google Scholar] [CrossRef]
  46. Rose, C.; Foucart, B.; Picard, D.; Colomb, A.; Metzger, J.-M.; Tulet, P.; Sellegri, K. New particle formation in the active volcanic plume of the Piton de la Fournaise: Specific features from a long-term dataset. Atmos. Chem. Phys. 2019. [Google Scholar] [CrossRef]
  47. Rose, C.; Sellegri, K.; Velarde, F.; Moreno, I.; Ramonet, M.; Weinhold, K.; Krejci, R.; Ginot, P.; Andrade, M.; Wiedensohler, A.; et al. Frequent nucleation events at the high altitude station of Chacaltaya (5240 m a.s.l.), Bolivia. Atmos. Environ. 2015, 102, 18–29. [Google Scholar] [CrossRef]
  48. Dal Maso, M.; Kulmala, M.; Riipinen, I.; Wagner, R.; Hussein, T.; Aalto, P.P.; Lehtinen, K.E.J. Formation and growth of fresh atmospheric aerosols: Eight years of aerosol size distribution data from SMEAR II, Hyytiälä, Finland. Boreal Environ. Res. 2005, 10, 323–336. [Google Scholar]
  49. Hirsikko, A.; Bergman, T.; Laakso, L.; Dal Maso, M.; Riipinen, I.; Hõrrak, U.; Kulmala, M. Identification and classification of the formation of intermediate ions measured in boreal forest. Atmos. Chem. Phys. 2007, 7, 201–210. [Google Scholar] [CrossRef] [Green Version]
  50. Vana, M.; Ehn, M.; Petäjä, T.; Vuollekoski, H.; Aalto, P.; de Leeuw, G.; Ceburnis, D.; O’Dowd, C.D.; Kulmala, M. Characteristic features of air ions at Mace Head on the west coast of Ireland. Atmos. Res. 2008, 90, 278–286. [Google Scholar] [CrossRef]
  51. Yli-Juuti, T.; Riipinen, I.; Aalto, P.P.; Nieminen, T.; Maenhaut, W.; Janssens, I.A.; Claeys, M.; Salma, I.; Ocskay, R.; Hoffer, A. Characteristics of new particle formation events and cluster ions at Kpuszta, Hungary. Boreal Environ. Res. 2009, 14, 683–698. [Google Scholar]
  52. Hirsikko, A.; Laakso, L.; Horrak, U.; Aalto, P.P.; Kerminen, V.; Kulmala, M. Annual and size dependent variation of growth rates and ion concentrations in boreal forest. Boreal Environ. Res. 2005, 10, 357. [Google Scholar]
  53. Tammet, H.; Kulmala, M. Simulation tool for atmospheric aerosol nucleation bursts. J. Aerosol Sci. 2005, 36, 173–196. [Google Scholar] [CrossRef]
  54. Lehtinen, K.E.J.; Dal Maso, M.; Kulmala, M.; Kerminen, V.-M. Estimating nucleation rates from apparent particle formation rates and vice versa: Revised formulation of the Kerminen–Kulmala equation. J. Aerosol Sci. 2007, 38, 988–994. [Google Scholar] [CrossRef]
  55. Hallar, A.G.; Lowenthal, D.H.; Chirokova, G.; Borys, R.D.; Wiedinmyer, C. Persistent daily new particle formation at a mountain-top location. Atmos. Environ. 2011, 45, 4111–4115. [Google Scholar] [CrossRef]
  56. García, M.I.; Rodríguez, S.; González, Y.; García, R.D. Climatology of new particle formation at Izaña mountain GAW observatory in the subtropical North Atlantic. Atmos. Chem. Phys. 2014, 14, 3865–3881. [Google Scholar] [CrossRef]
  57. Neitola, K.; Asmi, E.; Komppula, M.; Hyvärinen, A.-P.; Raatikainen, T.; Panwar, T.S.; Sharma, V.P.; Lihavainen, H. New particle formation infrequently observed in Himalayan foothills—Why? Atmos. Chem. Phys. 2011, 11, 8447–8458. [Google Scholar] [CrossRef]
  58. Minikin, A.; Petzold, A.; Ström, J.; Krejci, R.; Seifert, M.; van Velthoven, P.; Schlager, H.; Schumann, U. Aircraft observations of the upper tropospheric fine particle aerosol in the northern and southern hemispheres at midlatitudes. Geophys. Res. Lett. 2003, 30, 1503. [Google Scholar] [CrossRef]
  59. Manninen, H.E.; Nieminen, T.; Asmi, E.; Gagné, S.; Häkkinen, S.; Lehtipalo, K.; Aalto, P.; Vana, M.; Mirme, A.; Mirme, S.; et al. EUCAARI ion spectrometer measurements at 12 European sites—Analysis of new particle formation events. Atmos. Chem. Phys. 2010, 10, 7907–7927. [Google Scholar] [CrossRef]
  60. Hallar, A.G.; Petersen, R.; McCubbin, I.B.; Lowenthal, D.; Lee, S.; Andrews, E.; Yu, F.Q. Climatology of New Particle Formation and Corresponding Precursors at Storm Peak Laboratory. Aerosol Air Qual. Res. 2016, 16, 816–826. [Google Scholar] [CrossRef] [Green Version]
  61. Lv, G.; Sui, X.; Chen, J.; Jayaratne, R.; Mellouki, A. Investigation of new particle formation at the summit of Mt. Tai, China. Atmos. Chem. Phys. 2018, 18, 2243–2258. [Google Scholar] [CrossRef] [Green Version]
  62. Weber, J.R.; McMurry, P.H.; Mauldin, R.L., III; Tanner, D.J.; Eisele, F.L.; Clarke, A.D.; Kapustin, V.N. New particle formation in the remote troposphere: A comparison of observations at various sites. Geophys. Res. Lett. 1999, 26, 307–310. [Google Scholar] [CrossRef]
  63. Weber, J.R.; McMurry, P.H.; Eisele, F.L.; Tanner, D.J. Measurements ofexpected nucleation precursors species and 3–500 nm diameter particles at Mauna Loa, Hawaii. J. Atmos. Sci. 1995, 52, 2242–2257. [Google Scholar] [CrossRef]
  64. Modini, R.L.; Ristovski, Z.D.; Johnson, G.R.; He, C.; Surawski, N.; Morawska, L.; Suni, T.; Kulmala, M. New particle formation and growth at a remote, sub-tropical coastal location. Atmos. Chem. Phys. 2009, 9, 7607–7621. [Google Scholar] [CrossRef] [Green Version]
  65. Iida, K.; Stolzenburg, M.R.; McMurry, P.H.; Smith, J.N. Estimating nanoparticle growth rates from size-dependent charged fractions: Analysis of new particle formation events in Mexico City. J. Geophys. Res. Atmos. 2008, 113. [Google Scholar] [CrossRef] [Green Version]
  66. Perry, K.D.; Hobbs, P.V. Further evidence for particle nucleation in clean air adjacent to marine cumulus clouds. J. Geophys. Res. 1994, 99, 22803–22818. [Google Scholar] [CrossRef]
  67. Keil, A.; Wendisch, M. Bursts of Aitken mode and ultrafine particles observed at the top of continental boundary layer clouds. J. Aerosol Sci. 2001, 32, 649–660. [Google Scholar] [CrossRef]
  68. Mirme, S.; Mirme, A.; Minikin, A.; Petzold, A.; Horrak, U.; Kerminen, V.-M.; Kulmala, M. Atmospheric sub-3 nm particles at high altitudes. Atmos. Chem. Phys. 2010, 10, 437–451. [Google Scholar] [CrossRef] [Green Version]
  69. Laakso, L.; Petäjä, T.; Lehtinen, K.E.; Kulmala, M.; Paatero, J.; Horrak, U.; Tammet, H.; Joutsensaari, J. Ion production rate in a boreal forest based on ion, particle and radiation measurements. Atmos. Chem. Phys. 2004, 4, 3947–3973. [Google Scholar] [CrossRef]
  70. Lovejoy, E.R.; Curtius, J.; Froyd, K.D. Atmospheric ion induced nucleation of sulfuric acid and water. J. Geophys. Res. 2004, 109, D08204. [Google Scholar] [CrossRef]
  71. Luts, A.; Parts, T.-E.; Vana, M. New aerosol particle formation via certain ion driven processes. Atmos. Res. 2006, 82, 547–553. [Google Scholar] [CrossRef]
  72. Kazil, J.; Harrison, R.G.; Lovejoy, E.R. Tropospheric New Particle Formation and the Role of Ions. Space Sci. Rev. 2008, 137, 241–255. [Google Scholar] [CrossRef] [Green Version]
  73. Nieminen, T.; Paasonen, P.; Manninen, H.E.; Sellegri, K.; Kerminen, V.-M.; Kulmala, M. Parameterization of ion-induced nucleation rates based on ambient observations. Atmos. Chem. Phys. 2011, 11, 3393–3402. [Google Scholar] [CrossRef] [Green Version]
  74. Yu, F. From molecular clusters to nanoparticles: Second-generation ion-mediated nucleation model. Atmos. Chem. Phys. 2006, 6, 5193–5211. [Google Scholar] [CrossRef]
  75. Yu, F.; Wang, Z.; Luo, G.; Turco, R. Ion-mediated nucleation as an important global source of tropospheric aerosols. Atmos. Chem. Phys. 2008, 8, 2537–2554. [Google Scholar] [CrossRef] [Green Version]
  76. Kirkby, J.; Curtius, J.; Almeida, J.; Dunne, E.; Duplissy, J.; Ehrhart, S.; Franchin, A.; Gagné, S.; Ickes, L.; Kürten, A.; et al. Role of sulphuric acid, ammonia and galactic cosmic rays in atmospheric aérosol nucleation. Nat. Lett. 2011, 476, 429. [Google Scholar] [CrossRef]
  77. Kirkby, J.; Duplissy, J.; Sengupta, K.; Frege, C.; Gordon, H.; Williamson, C.; Heinritzi, M.; Simon, M.; Yan, C.; Almeida, J.; et al. Ion-induced nucleation of pure biogenic particles? Nature 2016, 533, 521–526. [Google Scholar] [CrossRef]
  78. Wagner, R.; Chao, Y.; Lehtipalo, K.; Duplissy, J.; Nieminen, T.; Kangasluoma, J.; Ahonen, L.R.; Dada, L.; Kontkanen, J.; Hanna, E.; et al. The role of ions in new particle formation. Atmos. Chem. Phys. 2017, 17, 15181–15197. [Google Scholar] [CrossRef]
  79. Laakso, L.; Hirsikko, A.; Grönholm, T.; Kulmala, M.; Luts, A.; Parts, T.-E. Waterfalls as sources of small charged aerosol particles. Atmos. Chem. Phys. 2007, 7, 2271–2275. [Google Scholar] [CrossRef] [Green Version]
  80. Dickinson, R.E. Solar variability and the lower atmosphere. Bull. Am. Meteorol. Soc. 1975, 56, 1240–1248. [Google Scholar] [CrossRef]
  81. Marsh, N.D.; Svensmark, H. Low Cloud Properties Influenced by Cosmic Rays. Phys. Rev. Lett. 2000, 85, 5004. [Google Scholar] [CrossRef]
  82. Marsh, N.; Svensmark, H. Galactic cosmic ray and El Niño–Southern Oscillation trends in International Satellite Cloud Climatology Project D2 low-cloud properties. J. Geophys. Res. 2003, 108, 4195. [Google Scholar] [CrossRef]
  83. Sloan, T.; Wolfendale, A.W. Testing the proposed causal link between cosmic rays and cloud cover. Environ. Res. Lett. 2008, 3, 024001. [Google Scholar] [CrossRef] [Green Version]
  84. Eichler, A.; Olivier, S.; Henderson, K.; Laube, A.; Beer, J.; Papina, T.; Gäggeler, H.W.; Schwikowski, M. Temperature response in the Altai region lags solar forcing. Geophys. Res. Lett. 2009. [Google Scholar] [CrossRef]
  85. Horrak, U.; Aalto, P.P.; Salm, J.; Komsaare, K.; Tammet, H.; Mäkelä, J.M.; Laakso, L.; Kulmala, M. Characterization of positive air ions in boreal air at the HyytiälÄ SMEAR station. Atmos. Chem. Phys. 2007, 7, 9465–9517. [Google Scholar] [CrossRef]
  86. Mishev, A.; Hristova, E. Gamma Background Measurements at BEO Moussala, Institute for Nuclear Research and Nuclear Energy. Bulg. Acad. Sci. 2011, 1–18. [Google Scholar]
  87. Rose, C.; Sellegri, K.; Asmi, E.; Hervo, M.; Freney, E.; Junninen, H.; Duplissy, J.; Sipilä, M.; Kontkanen, J.; Lehtipalo, K.; et al. Observation of neutral clusters during particle formation in the free troposphere. Atmos. Chem. Phys. 2015, 15, 3413–3428. [Google Scholar] [CrossRef]
  88. Pirjola, L.; Kulmala, M.; Wilck, M.; Bischoff, A.; Stratmann, F.; Otto, E. Formation of sulphuric acid aerosols and cloud condensation nuclei: An expression for significant nucleation and model comparison. J. Aerosol Sci. 1999, 30, 1079–1094. [Google Scholar] [CrossRef]
  89. Lanz, V.A.; Prévôt, A.S.H.; Alfarra, M.R.; Weimer, S.; Mohr, C.; DeCarlo, P.F.; Gianini, M.F.D.; Hueglin, C.; Schneider, J.; Favez, O.; et al. Characterization of aerosol chemical composition with aerosol mass spectrometry in Central Europe: An overview. Atmos. Chem. Phys. 2010, 10, 10453–10471. [Google Scholar] [CrossRef]
  90. Sogacheva, L.; Dal Maso, M.; Kerminen, V.-M.; Kulmala, M. Probability of nucleation events and aerosol particle concentration in different air mass types arriving at Hyytiälä, Southern Finland, based on back trajectories analysis. Boreal Environ. Res. 2005, 10, 479–491. [Google Scholar]
  91. Dada, L.; Paasonen, P.; Nieminen, T.; Buenrostro Mazon, S.; Kontkanen, J.; Peräkylä, O.; Lehtipalo, K.; Hussein, T.; Petäjä, T.; Kerminen, V.-M.; et al. Long-term analysis of clear-sky new particle formation events and nonevents in Hyytiälä. Atmos. Chem. Phys. 2017, 17, 6227–6241. [Google Scholar] [CrossRef]
  92. Sellegri, K.; Laj, P.; Venzac, H.; Boulon, J.; Picard, D.; Villani, P.; Bonasoni, P.; Marinoni, A.; Cristofanelli, P.; Vuillermoz, E. Seasonal variations of aerosol size distributions based on long-term measurements at the high altitude Himalayan site of Nepal Climate Observatory-Pyramid (5079 m), Nepal. Atmos. Chem. Phys. 2010, 10, 10679–10690. [Google Scholar] [CrossRef] [Green Version]
  93. Kiendler-Scharr, A.; Wildt, J.; Dal Maso, M.; Hohaus, T.; Kleist, E.; Mentel, T.F.; Tillmann, R.; Uerlings, R.; Schurr, U.; Wahner, A. New particle formation in forests inhibited by isoprene emissions. Nature 2009, 461, 381–384. [Google Scholar] [CrossRef] [Green Version]
  94. Freney, E.; Sellegri, K.; Chrit, M.; Adachi, K.; Brito, J.; Waked, A.; Borbon, A.; Colomb, A.; Dupuy, R.; Pichon, J.-M.; et al. Aerosol composition and the contribution of SOA formation over Mediterranean forests. Atmos. Chem. Phys. 2018, 18, 7041–7056. [Google Scholar] [Green Version]
  95. Petäjä, T.; Mauldin, R.L., III; Kosciuch, E.; McGrath, J.; Nieminen, T.; Boy, M.; Adamov, A.; Kotiaho, T.; Kulmala, M. Sulfuric acid and OH concentrations in a boreal forest site. Atmos. Chem. Phys. 2009, 9, 7435–7448. [Google Scholar] [CrossRef] [Green Version]
  96. Nishita, C.; Osada, K.; Kido, M.; Matsunaga, K.; Iwasaka, Y. Nucleation mode particles in upslope valley winds at Mount Norikura, Japan: Implications for the vertical extent of new particle formation events in the lower troposphere. J. Geophys. Res. 2008, 113, D06202. [Google Scholar] [CrossRef]
  97. Wehner, B.; Siebert, H.; Ansmann, A.; Ditas, F.; Seifert, P.; Stratmann, F.; Wiedensohler, A.; Apituley, A.; Shaw, R.A.; Manninen, H.E.; et al. Observations of turbulence-induced new particle formation in the residual layer. Atmos. Chem. Phys. 2010, 10, 4319–4330. [Google Scholar] [CrossRef] [Green Version]
  98. Lihavainen, H.; Kerminen, V.-M.; Komppula, M.; Hatakka, J.; Aal-tonen, V.; Kulmala, M.; Viisanen, Y. Prodution of “potential” cloud condensation nuclei production associated with atmo-spheric new-particle formation in northern Finland. J. Geophys. Res. 2003, 108, 4782. [Google Scholar] [CrossRef]
  99. Kerminen, V.-M.; Paramonov, M.; Anttila, T.; Riipinen, I.; Fountoukis, C.; Korhonen, H.; Asmi, E.; Laakso, L.; Lihavainen, H.; Swietlicki, E.; et al. Cloud condensation nuclei production associated with atmospheric nucleation: A synthesis based on existing literature and new results. Atmos. Chem. Phys. 2012, 12, 12037–12059. [Google Scholar] [CrossRef]
  100. Laakso, L.; Merikanto, J.; Vakkari, V.; Laakso, H.; Kulmala, M.; Molefe, M.; Kgabi, N.; Mabaso, D.; Carslaw, K.S.; Spracklen, D.V.; et al. Boundary layer nucleation as a source of new CCN in savannah environment. Atmos. Chem. Phys. 2013, 13, 1957–1972. [Google Scholar] [CrossRef] [Green Version]
  101. Farah, A.; Freney, E.; Chauvigné, A.; Baray, J.L.; Rose, C.; Picard, D.; Colomb, A.; Hadad, D.; Abboud, M.; Farah, W.; et al. Seasonal variation of aerosol size distribution data at the puy de Dôme station with emphasis on the boundary layer/free troposphere segregation. Atmosphere 2018, 9, 244. [Google Scholar] [CrossRef]
  102. Yli-Juuti, T.; Nieminen, T.; Hirsikko, A.; Aalto, P.P.; Asmi, E.; Hõrrak, U.; Manninen, H.E.; Patokoski, J.; Dal Maso, M.; Petäjä, T.; et al. Growth rates of nucleation mode particles in Hyytiälä during 2003−2009: Variation with particle size, season, data analysis method and ambient conditions. Atmos. Chem. Phys. 2011, 11, 12865–12886. [Google Scholar] [CrossRef]
  103. Suni, T.; Kulmala, M.; Hirsikko, A.; Bergman, T.; Laakso, L.; Aalto, P.P.; Leuning, R.; Cleugh, H.; Zegelin, S.; Hughes, D.; et al. Formation and characteristics of ions and charged aerosol particles in a native Australian Eucalypt forest. Atmos. Chem. Phys. 2008, 8, 129–139. [Google Scholar] [CrossRef] [Green Version]
  104. Virkkula, A.; Hirsikko, A.; Vana, M.; Aalto, P.P.; Hillamo, R.; Kulmala, M. Charged particle size distributions and analysis of particle formation events at the Finnish antarctic research station aboa. Boreal Environ. Res. 2007, 12, 397–408. [Google Scholar]
Figure 1. Frequency of occurrence of NPF events (A) over the whole observational period calculated for the high altitude stations PUY, CMN, JFJ, PYR, MDO, and CHC and for high altitude stations, as reported in the literature, and (B) calculated as monthly averages for PUY, CMN, JFJ, NCO, MDO, and CHC. See details in the methods (Table 1) for periods over which calculations were performed.
Atmosphere 10 00493 g001
Figure 2. Average formation rates of (A) 2 nm neutral cluster particles, (B) 2 nm negatively charged cluster ions, and (C) 2 nm positively charged cluster ions calculated over the whole available dataset reported in Table 1. Error bars represent the standard deviation from the average. Dotted lines and the grey area represent the average and the standard deviation, respectively, of the formation rates reported in the literature for boundary layer (BL) sites (from Maninnen et al., 2010) [59].
Atmosphere 10 00493 g002
Figure 3. Average GRs of newly formed particles in (A) 1.5–3 nm size range, (B) 3–7 nm size range, and (C) 7–20 nm size range calculated over the whole available dataset reported in Table 1. Error bars represent the standard deviation from the average. The dotted line and the grey area represent the average and the standard variation of corresponding GR calculated for all boundary layer sites reported in Manninen et al. (2010) [59] except for Hyytiälä, for which GRs were taken from Yli-Juuti et al. (2011) [60]. Note that three other sites discussed in the work by Yli-Juuti et al. (2011) [60] were also considered in the BL average: the two Australian sites of Agnes water (Modini et al., 2009) [65] and Tumbarumba (Suni et al., 2008) [66] and Aboa in Antarctica (Virkkula et al., 2007) [67].
Atmosphere 10 00493 g003
Figure 4. Averaged diurnal variation of positive and negative ion concentrations calculated from CHC data separately for event and non event days.
Atmosphere 10 00493 g004
Figure 5. Ion-induced nucleation (IIN) percentages as a function of the altitude of stations PUY, JFJ, and CHC (colored dots) compared to the previously published values from several sites (grey dots) by Maninnen et al. (2010) [59].
Atmosphere 10 00493 g005
Figure 6. Median condensational sinks as a function of altitude calculated over the period 07:00–09:00 (LT) and segregated into NPF event and non event days for PUY, JFJ, MDO, and CHC stations, for the stations reported in Manninen et al. 2010, and for airborne measurements over the Mediterranean Sea reported in Rose et al. (2015). The averaged values reported for JFJ, MDO, and CHC were derived from earlier calculation of the CS by Boulon et al. (2010), Foucart et al. (2018), and Rose et al. (2015), respectively. The values shown for the PUY station were calculated for the present study using measurements conducted between February 2007 and February 2012.
Atmosphere 10 00493 g006
Figure 7. Average increase of the particle concentration following NPF events in the size ranges > 50 nm (N50), >80 nm (N80) and >100 nm (N100) as proxies of the cloud condensation nuclei (CCN) concentrations produced from NPF events. Observations reported in the literature for planetary boundary layer (PBL) stations (grey scale) are compared to the high altitude sites CHC and MDO.
Atmosphere 10 00493 g007
Table 1. Global overview of the datasets discussed in the present work for PUY, JFJ, PYR, CMN, MDO, and CHC stations and related publications.
StationInstrumentData AvailabilityReferences
PeriodNumber of sampled days for NPF frequency calculation
PUYAIS/NAISFebruary 2007–June 2010, extended until February 2012 for the calculation of NPF frequency and CS statistics952 (1440 for the calculation of NPF frequency)[43] Boulon et al., 2011 [44] Rose et al., 2013
JFJNAIS April 2008–May 2009309[45] Boulon et al., 2010
PYRSMPSMarch 2006–August 2007511[39] Venzac et al., 2008
CMNDMPSJanuary 2009–December 2009316-
MDODMPSJanuary 2015–December 2015250 *[40] Foucart et al., 2018; [46] Rose et al., 2019
CHCNAISJanuary 2012–December 2012362[2,47] Rose et al., 2015, 2017
* Measurements performed in volcanic plume conditions are excluded from the present study. PUY: Puy de Dôme; JFJ: Jungfraujoch; PYR: Nepal Climate Observatory Pyramid; CMN: Monte Cimone; MDO: Maïdo observatory; CHC: Chacaltaya; AIS: Air Ion Spectrometer; NAIS: Neutral Air Ion Spectrometer; SMPS: scanning mobility particle sizer; DMPS: differential mobility particle sizer; NPF: new particle formation; CS: condensational sinks.
Table 2. NPF related main parameters for high altitude stations.
StationLocation, Altitude (m a.s.l.), [ref]NPF Mean Freq.NPF Mean J (cm−3 s−1)NPF Mean GR (nm h−1)NPF INN (%)Median CS [25ile–75ile] (10−3 s−1)
PUYFrance, 1465, [43]30% *J2 = 1.38 ± 1.64 *GR3–7 = 6.52 ± 4.61 *12.49 ± 2.032.77 [0.86–7.24] (NPF)
GR7–20 = 8.86 ± 5.50 *2.87 [0.80–7.37] (no NPF) *
JFJSwitzerland, 3580, [45]14.5%J2 = 2.65 ± 2.0 *GR3–7 = 5.3 ± 3.521.80.157 [0.07–0.31] (NPF)
GR7–20 = 5.7 ± 2.20.093 [0.04–0.20] (no NPF) *
PYRHimalaya, 5079, [39]39% *J10 = 0.18 1.8 ± 0.7
CMNItaly, 216528% *
MDOIndian Ocean, 216067% *J2 = 1.57 ± 2.07 *GR12–19 = 19.98 ± 12.7 0.55 [0.34–0.88] (NPF)
0.49 [0.22–1.27] (no NPF) *
CHCBolivian Andes, [47]64%J2 = 2.33 ± 2.06 *GR3–7 = 10.31 ± 14.6514.83.13 [2.03–4.13] (NPF)
GR7–20 = 13.65 ± 15.912.06 [0.84–3.44] (no NPF)
Storm PeakUSA, 3210, [55]52%J8 = 7.47 ± 5.1GR3–15 = 0.65 ± 0.14 1.20
IzañaAtlantic O., 2373, [56]30%J10 = 0.46 ± 0.57GR10–25 = 0.43 ± 0.21 1.55
MukteshwarHimalaya, 2180 [57]14.5%J25 = 0.40GR15–25 = 2.43 7.30
Mauna LoaPacific Ocean, 3400 J3 = 0.5 [58]GR3–15 = 0.40
Average low altitudeLow altitude sites from [59] and [60] ** <1000 m a.s.l.38 ± 13.7%J2 = 12.03 ± 13.15GR3–7 = 4.18 ± 1.146.28 ± 6.693.7 ± 2.5 (NPF) 6.0 ± 3.9 (no NPF)
GR7–20 = 6.45 ± 4.06
* Calculated in the present work. ** Statistics calculated from data from sites Pallas, Hyytiälä, Vavihill, Mace Head, Cabauw, Melpitz, Hohenpeissenberg, K-Puszta, San Pietro Capofiume, Finokalia. J formation rates GR: growth rate. INN: ion induced nucleation.

