

Abstract
Long-term changes in convective and stratiform precipitation in Northern Eurasia (NE) over the last five decades are estimated. Different types of precipitation are separated according to their genesis using routine meteorological observations of precipitation, weather conditions, and morphological cloud types for the period 1966–2016. From an initial 538 stations, the main analysis is performed for 326 stations that have no gaps and meet criteria regarding the artificial discontinuity absence in the data. A moderate increase in total precipitation over the analyzed period is accompanied by a relatively strong growth of convective precipitation and a concurrent decrease in stratiform precipitation. Convective and stratiform precipitation totals, precipitation intensity and heavy precipitation sums depict major changes in summer, while the relative contribution of the two precipitation types to the total precipitation (including the contribution of heavy rain events) show the strongest trends in transition seasons. The contribution of heavy convective showers to the total precipitation increases with the statistically significant trend of 1%–2% per decade in vast NE regions, reaching 5% per decade at a number of stations. The largest increase is found over the southern Far East region, mostly because of positive changes in convective precipitation intensity with a linear trend of more than 1 mm/day/decade, implying a 13.8% increase per 1 °C warming. In general, stratiform precipitation decreases over the majority of NE regions in all seasons except for winter. This decrease happens at slower rates in comparison to the convective precipitation changes. The overall changes in the character of precipitation over the majority of NE regions are characterized by a redistribution of precipitation types toward more heavy showers.
Export citation and abstract BibTeX RIS

Original content from this work may be used under the terms of the Creative Commons Attribution 3.0 licence. Any further distribution of this work must maintain attribution to the author(s) and the title of the work, journal citation and DOI.
1. Introduction
A considerable threat to society from the observed global climate change comes from the changes in precipitation characteristics. In Northern Eurasia (NE), increasing precipitation intensities and the occurrence of heavy rain events (Semenov and Bengtsson 2002, Groisman et al 2005, Mokhov et al 2005, Ye et al 2015, Donat et al 2016, Zolina and Bulygina 2016), and changes in the duration of wet and dry spells (Khon et al 2007, Zolina et al 2010, 2013, Ye 2018), affect national economies by modulating streamflow and water availability (Mokhov et al 2003, Milly et al 2005, Shkolnik et al 2018) and causing local devastating flashfloods (Meredith et al 2015b) or large-scale deluges (Mokhov 2014, Mokhov and Semenov 2016). A careful look at the structural changes in precipitation is required in order to understand the observed tendencies and estimate future changes (Groisman et al 1999). Whereas in the climate models distinguishing between stratiform and convective precipitation is straightforward, as they are simulated as different variables, separating these precipitation types in the real world is challenging (Houze 1997) and requires an analysis of supplementary weather parameters. This problem is the focus of ongoing large environmental and climate dynamics regional initiatives (Groisman et al 2017, Collins et al 2018).
Global climate change may impact the static stability of the troposphere. In particular, a significant increase of the tropospheric lapse rate was found over NE and Europe in the second half of the 20th century (Mokhov and Akperov 2006) with the possible intensification of convective processes. An indication of such a tendency is the increase of convective cloud cover (Sun et al 2001, Chernokulsky et al 2011, 2017a) and convective instability indices (Riemann-Campe et al 2009, Pistotnik et al 2017) over NE, which may lead to the more frequent formation of severe convective events (Kurgansky et al 2013, Chernokulsky et al 2017b, Taszarek et al 2018). Favorable conditions for severe convective events may become more frequent over the course of the 21st century, according to climate model projections (Marsh et al 2009, Púčik et al 2017, Chernokulsky et al 2017b).
Intensification of convective processes may increase the contribution of convective rainfall to the total precipitation. Recent studies show an increase in the convective precipitation in central Europe (Rulfová and Kyselý 2014) and NE (Han et al 2016, Ye et al 2017), which could be a consequcne of the warming (Berg et al 2013, Ye et al 2016, Peleg et al 2018). In particular, Ye et al (2017) found a very strong increase in convective precipitation (with the trend in the annual total being of 36.7 mm/decade and sensitivity to temperature amounting to 18% °C–1) accompanied by a simultaneous decrease of stratiform precipitation for the 1966–2000 period. However, many of these trends should be treated with caution due to the impact of abrupt step-like discontinuities in three-hourly observation records for clouds (Eastman and Warren 2013) and corresponding weather character.
In this paper, we separately analyze changes in the convective and stratiform precipitation for the 1966–2016 period using routine meteorological observations of precipitation, present and past weather, and morphological cloud types to classify the two precipitation types. We demonstrate that for this longer period an observed increase in the total precipitation intensity is also associated with an increase in convective rainfall intensity and a growing contribution of heavy and intense showers. However, the increase in convective precipitation is smaller compared to that reported previously due to the exclusion of station data exhibiting artificial changes and, to a lesser degree, due to choosing a longer period.
2. Data and methods
2.1. Discriminating between different types of precipitation by their genesis
Various approaches have been proposed to discriminate between convective (solely thermodynamic driven) and stratiform (dynamic driven) precipitation. Some approaches reveal the type of precipitation by establishing thresholds for precipitation characteristics and associated measures (for instance, radar reflectivity, rain intensity, cloud drop size, ice and liquid water paths, graupel presence, etc), which can be measured using remote sensing by radars, satellites, and optical disdrometers (see e.g. Alibegova 1985, Steiner and Smith 1998, Sempere-Torres et al 2000, Anagnostou 2006, Sui et al 2007, Xu et al 2013, Yang et al 2013, Ahmed and Schumacher 2015). Other methods differentiate between convective and stratiform precipitation by analyzing their spatio-temporal structure (Tremblay 2005, Ruiz-Leo et al 2013, Han et al 2016). The third approach is to use information from routine meteorological observations of weather (present only, or present and past) and/or cloud morphological types. Within this approach, showers and thunderstorms (nonshowery rainfalls and snowfalls) can be attributed to convective (stratiform) precipitation (Evseev 1958, Dai 2001, Berg et al 2013, Rulfová and Kyselý 2013, Ye et al 2016, Chernokulsky et al 2018). Because observations of weather and clouds are synchronized with precipitation observations and have the same time coverage, the approach can be used for estimating decadal variability of different precipitation types (Rulfová and Kyselý 2014, Ye et al 2017).
Here, we have utilized routine observations from 538 Russian meteorological stations, collected at the All-Russian Research Institute of Hydrometeorological Information—World Data Center (RIHMI-WDC) for the 1966–2016 period (Bulygina et al 2014). We used data on present and past weather (three-hourly observations), cloud morphological types (three-hourly) and precipitation rate (twelve-hourly). Until 1986, precipitation at Russian meteorological stations was measured four-times-a-day (evenly, every six hours, or unevenly, at 3-9-3-9 h, depending on the station). To maintain the temporal homogeneity of data series, we recalculated these earlier four-times-a-day observations to two-times-a-day ones (with 12 h interval). Furthermore, through the comparison with the existing RIHMI-WDC datasets on daily and monthly precipitation rates, we corrected 700 records in the initial dataset that were erroneous due to digitizing mistakes during the manual transfer of information from punch cards for the 1960–1980 period (e.g. a 12.2 mm value was digitized as a 102.2 mm value) (see Chernokulsky et al 2018 for more details).
To discriminate among different types of precipitation (specifically, showery, nonshowery, and drizzle), we used codes of present and past weather and information on cloud morphological types that were recorded concurrently with the precipitation report and for three preceding reports (equivalent to 12 h) (Chernokulsky et al 2018). We used information on present weather as the primary criterion (82% of precipitation reports were assigned to a particular type using this criterion), past weather as the second priority criterion (16.5%) and morphological cloud types as the third priority criterion (1.5%). In other words, if a code (or codes) of present weather was attributed to a convective event (in particular, WMO codes 13, 17–19, 25–27, 29, 80–99) (see, for details, Dai 2001, Chernokulsky et al 2018) the precipitation report was considered as showery. If four codes of present weather were not associated with a particular precipitation type, then the past weather codes were checked. If they also failed to separate precipitation type, then information on clouds was used to finally provide attribution. Nonshowery and drizzle precipitation were identified in a similar way (see supplementary figure S1, available online at stacks.iop.org/ERL/14/045001/mmedia, for more details). Occasionally, codes of various precipitation types may occur over 12 h; it this case, the corresponding precipitation value is considered as compound. If none of the criteria unambiguously defined the precipitation type, the related rainfall event was marked as undefined.
Utilizing information on both past and present weather together with information on cloud types and using 12 h precipitation data (instead of daily) we are capable of substantially reducing the number of reports with compound and undefined precipitation (down to 9.2% and 0.9% of all reports, respectively). In particular, the number of reports with compound precipitation is half that estimated by Ye et al (2017).
2.2. Exclusion of stations with erroneous reports
The accuracy of the proposed method depends on the homogeneity of standard weather observations that are uniform for various seasons, various regions, and various temporal periods (at least for the examined period 1966–2016, when the observation procedure has not been changed). This allows us to restore consistent values of different precipitation types in space and time. Inherent uncertainties of the method are associated with the peculiarities of the weather observing procedure and practices, such as the restriction of the visible horizon, difficulty of embedded convection determination, coding specifications and some other issues (see Chernokulsky et al 2018 for more details). These uncertainties may alter the retrieval of precipitation characteristics, but their impact is largely of a random nature and has a minor effect on trend estimates. The method is also sensitive to the training of observers. Thus, a well trained observer being replaced by a poorly trained one may apparently result in the appearance of inhomogeneity in time series. Such time series (if any) should be excluded from the analysis.
When examining variations of cloud types worldwide, Eastman and Warren (2013) revealed an artifact-like character of instant reversal in time series of the cumulonimbus and nimbostratus cloud amount for many Russian meteorological stations. Since the observed weather and cloud types are inherently related, the corresponding artifact-like changes can be found in present weather code time series. Indeed, an inspection of time series with the frequencies of reports that were associated with particular precipitation types revealed the presence of such artificial reversals for several stations (figure S2) (with the absence of such changes at the neighboring stations). The nature of these local instant reversals is still unclear. They are not linked to the station location or year of changes. Because reversals had occurred in different years, they tend to be masked when the regional analysis based on the aggregation of many stations is performed. We assumed that these abrupt changes were associated with a change of observer; but confirmation was not possible due to the lack of metadata.
To eliminate problematic stations from further analysis, we applied a step-testing procedure similar to one used by Eastman and Warren (2013). At the beginning, discontinuity was taken as the maximum of the time derivative of the five-year running mean of the ratio between showery reports and all precipitation-weather reports. Further, significance of abrupt change was tested by comparing the samples of the ratio between the preceding and subsequent (with respect to the break) values in two ways. First, the two means were verified for overlapping (within their standard deviations) (as in Eastman and Warren 2013). Second, the nonparametric Mann–Whitney U-test for the comparison of two sample means was carried out. We performed further analysis only for the stations where the before-reversal and after-reversal means overlapped or (and) two samples passed the U-test (at the significant level of 0.05).
In addition, we restricted our consideration to records for which the number of totally missing years was less than five years (we considered the whole year to be missing if data for any day of the year was missing) and to the stations with an elevation of below 1000 m. We also excluded all stations that had been relocated during the analyzed period. In total, 111 stations were omitted. From the remaining 427 stations, we excluded an additional 101 stations because they failed to pass both tests on the artificial instant reversal insignificance. Finally, 326 stations in total (with 154 passing one of the tests, and 172 passing both) were selected for the analysis (figure 1).

Figure 1. Location of Russian meteorological stations from RIHMI-WDC dataset. Stations that have gaps of ≥5 years, had been relocated, or have elevation ≥1000 m are shown with small grey dots. Stations that failed to pass tests on artificial instant reversal absence are shown with black circles. Orange (red) circles denote stations that passed only one (both) test(s). Green dashed lines show the division into five regions (I—northern European part (north of 60 N, west of 75E), II—northern Asian part (north of 60 N, east of 75E), III—southern European part (south of 60 N, west of 60E), IV—southern Siberia (south of 60 N, between 60E and 110E), V—southern Far East (south of 60 N, east of 110E)).
Download figure:
Standard image High-resolution image2.3. Precipitation characteristics
We analyzed the seasonal/annual precipitation totals P (in mm), frequency of precipitation events pP (fraction of wet days over a season/year), and precipitation intensity I (precipitation total scaled by the number of wet days, in mm/day). We also evaluated the precipitation accumulated during very wet days (>95th percentile, which is obtained from empirical distribution for each station for the whole period) (P95, in mm) and its contribution to precipitation totals (R95p = 100 · P95/P, in %) (Klein Tank and Konnen 2003). All values were counted for both convective and stratiform precipitation and were denoted by subscripts 'Conv' and 'Strat', respectively (for example, R95pConv = P95Conv/PConv). The variable without the subscript stands for the characteristic of total precipitation (sum of all types). In addition, we calculated the fraction of PConv and PStrat in the total precipitation P (fConv and fStrat respectively; thus, fConv = 100 · PConv/P, in %) and the contribution of P95Conv and P95Strat to P (R95pTOTConv and R95pTOTStrat, respectively; thus, R95pTOTConv = 100 · P95Conv/P, in %). We note that the results related to R95p and R95pTOT indices should be treated with caution due to a finite number of wet days per season (it is even more restricted for various precipitation types) (Zolina et al 2009, Leander et al 2014, Schär et al 2016).
We estimated linear trends of the aforementioned precipitation characteristics for each station separately and for five regions (where all stations were simply averaged with equal weight) (region boundaries are shown in figure 1). We used a nonparametric linear Theil–Sen slope estimator (which is less sensitive to outliers than standard linear regression, it is of particular importance for estimating R95p and R95pTOT trends) to calculate the trend slope, and a nonparametric Mann–Kendall test to estimate the significance of the trend. To estimate whether the trend (of either sign) pattern holds field (or group) significance (i.e. the conclusion about growing/declining tendency can be attributed to the considered domain), we calculated the field significance of the trend patterns. The analysis was performed, according to Livezey and Chen (1983), using binominal distribution and with the assumption that all individual trend estimates are independent.
3. Results
Total precipitation P has experienced a moderate increase over the NE region over the last five decades (figure 2) (see also Bogdanova et al 2010). The most pronounced statistically significant trends are found in the south of the Far East (figure 2(a)) which is in concordance with previously obtained results (e.g. Groisman et al 2014). The opposite trends of annual PConv and PStrat (increase and decrease, respectively) are significant for the majority of stations. Absolute magnitudes of the trends exceed 50 mm/decade for several regions (figures 2(b), (c)). The major increase of PConv occurs at Sakhalin Island (up to 120 mm/decade), while PStrat is reduced dramatically at the lower basin of the Amur River (down to –76 mm/decade). Similar magnitudes of PConv and PStrat trends were found by Ye et al (2017) for a shorter period (up to 2000), but in the south of Siberia. Note that very few stations display reverse trends (decrease of PConv and increase of PStrat). Several seasonal peculiarities of PConv and PStrat changes are revealed (figure 3). In winter, positive trends for PStrat are found at stations in the European part of Russia (up to 17 mm/decade) (figure 3(b)). The strongest decline in PStrat occurs in the Far East regions in summer (down to –25 mm/decade) and autumn (down to –26 mm/decade) (figures 3(f), (h)). It is collocated with the PConv increase in this region in the same seasons (up to 40 mm/decade) (figures 3(e), (g)). For the European part, the highest rates of the seasonal PConv trend are revealed in spring (the absolute maximum is found in Sochi with 28 mm/decade) (figure 3(c)). In general, the increase of PConv and the decrease of PStrat happen in different seasons. Specifically, the largest number of stations exhibit significant positive PConv trends in spring and autumn, while the largest number of stations show significant negative PStrat trends for summer. A more pronounced increase in convective clouds occurrence in transition seasons than in summer was revealed previously in Northern Eurasia and North America by Sun et al (2001). They associated it with the 'saturation' of summer seasons with convective event frequency, while unsaturated spring and autumn become more 'summer-like' seasons, which is partly confirmed by the obtained tendencies of precipitation (see also Ye et al 2016).

Figure 2. Trends (obtained with the nonparametric Theil–Sen estimator) for annual total precipitation totals P (a), convective precipitation totals PConv (b), and stratiform precipitation totals PStrat (c) for the 1966–2016 period. Trends are shown only for 326 stations that passed at least one of the tests on artificial instant reversal absence. Large circles stand for statistical significant trends. Significance is computed with the nonparametric Mann–Kendall test (at 0.05 significant level). Plus and minus signs denote the entire NE patterns that holds field significance (at 0.1 significance level).
Download figure:
Standard image High-resolution image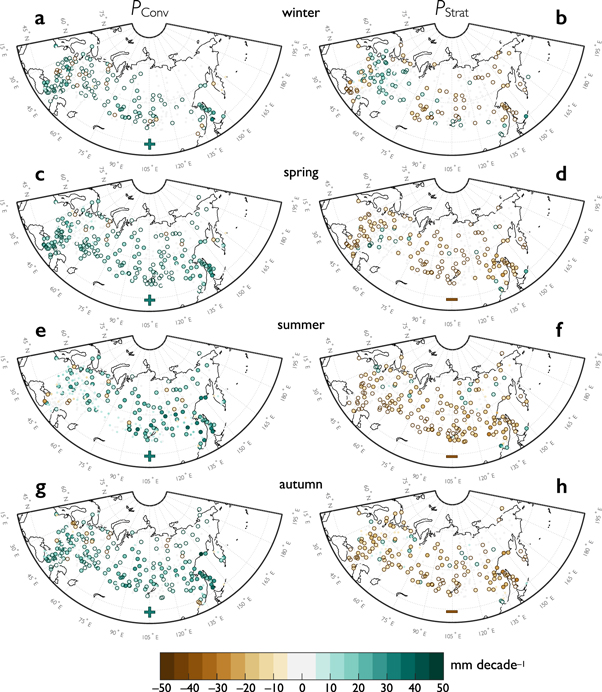
Figure 3. The same as for figure 3, but for winter (a), (b), spring (c), (d), summer (e), (f), and autumn (g), (h) totals of convective precipitation PConv (a), (c), (e), (g) and stratiform precipitation PStrat (b), (d), (f), (h).
Download figure:
Standard image High-resolution imageChanges in fConv and fStrat (figure S3) reflect the joint effect of changes in PConv and PStrat and are linked to the absolute values of P. Thus, maximum trends of fConv and fStrat are revealed in winter when P is relatively small (close to 20%/decade for several stations, which means almost an entire replacement of stratiform by convective precipitation). For annual means, fConv and fStrat have significant trends within 2%–15%/decade.
Similar tendencies are obtained for the frequency of convective and stratiform precipitation (pPConv and pPStrat) (figure S4). For annual means, the majority of stations display a pPConv increase (up to 0.06/decade) and pPStrat decline (down to –0.03/decade) with generally higher values in southern regions and lower in northern regions of NE. Similar tendencies for pPConv and pPStrat are obtained for seasons. Opposite tendencies are also revealed. Thus, positive trends of pPStrat are common for winter, while negative trends of pPConv are found in summer (almost a third of stations show a significant decrease in pPConv).
Changes in P and pP determine variations in daily precipitation intensity I (increase in P and decrease in pP both tend to increase I). On an annual basis (figures 4(a), (b)), the growth of PConv is more prominent than that of pPConv, which results in a general increase in IConv (especially evident over the Far East regions, where IConv trends are up to 1.4 mm/day/decade). Positive IConv trends are found in all seasons (figures 4(c), (e), (g), (i)), with the highest increase in the Far East region (up to 1.8 mm/day/decade for several stations in summer). Decreasing PStrat dominates over decreasing pPStrat on an annual basis in some southern regions (especially over the Okhotsk and Black Sea coasts, where IStrat trends amount to –1.0 mm/day/decade). In the northern part of NE (and in the south of Ural) annual means of IStrat tend to increase (with trends up to 0.5 mm/day/decade). Positive seasonal trends of IStrat are found in the most regions of NE in winter (figure 4(d)) and in some regions in spring (figure 4(f)) and summer (figure 4(h)). The largest IStrat decrease is found at southern stations in summer (with the absolute minimum of –1.87 mm/day/decade in the city of Blagoveshchensk).

Figure 4. The same as for figure 3, but for intensity of convective (stratiform) precipitation IConv (IStrat) for annual (a), (b), winter (c), (d), spring (e), (f), summer (g), (h), and autumn values (i), (j).
Download figure:
Standard image High-resolution imagePositive PConv trends and negative PStrat trends are accompanied by same-sign tendencies of heavy precipitation events, specifically, the increase of P95Conv and decrease of P95Strat (figure S5). A significant positive trend of annual P95Conv was obtained for most of the stations (with the maximum value of 52 mm/decade for Nevelsk station at Sakhalin Island). A significant increase of P95Conv is found from spring through autumn. The annual P95Strat tends to decline (with the negative trend down to –30 mm/decade), while changes of seasonal P95Strat are mostly insignificant. Changes in the contribution of heavy precipitation to totals of related precipitation type (R95p) are more pronounced for stratiform precipitation. The annual R95pStrat shows a negative trend with the strongest decrease of –10%/decade for several stations in the south of Siberia (figure S6). The largest significant positive trends of annual R95pConv are found for Sakhalin Island (up to 8%/decade). Seasonal trends of R95pConv and R95pStrat are generally insignificant (rare heavy precipitation events are often treated as outliers by the Mann–Kendall test and Theil–Sen estimator).
Heavy convective showers tend to contribute more to total precipitation, whereas a portion of heavy stratiform rainfalls in the total precipitation is declining over the analyzed period. That is, changes in R95pTOTConv and R95pTOTStrat are in general concordance with P95Conv and P95Strat changes. Significant positive annual trends of R95pTOTConv are revealed for many stations with the slopes up to 5%/decade in the south of Siberia and the Far East (figure 5(a)). Changes in R95pTOTStrat are negative with the largest decrease in the central and northern Far East (significant negative trends amount to –6%/decade) (figure 5(b)). Seasonal trends (figures 5(c)–(j)) are significant for a fewer number of stations due to the rarity of heavy precipitation events. The R95pTOTConv index markedly increases for the warm period of a year (with the maximum trend in summer of 7.1%/decade in the center of the European part of Russia). R95pTOTStrat noticeably decreases only in autumn (down to –4.5%/decade), while in winter, significant positive trends are also found (up to 5%/decade for several stations).
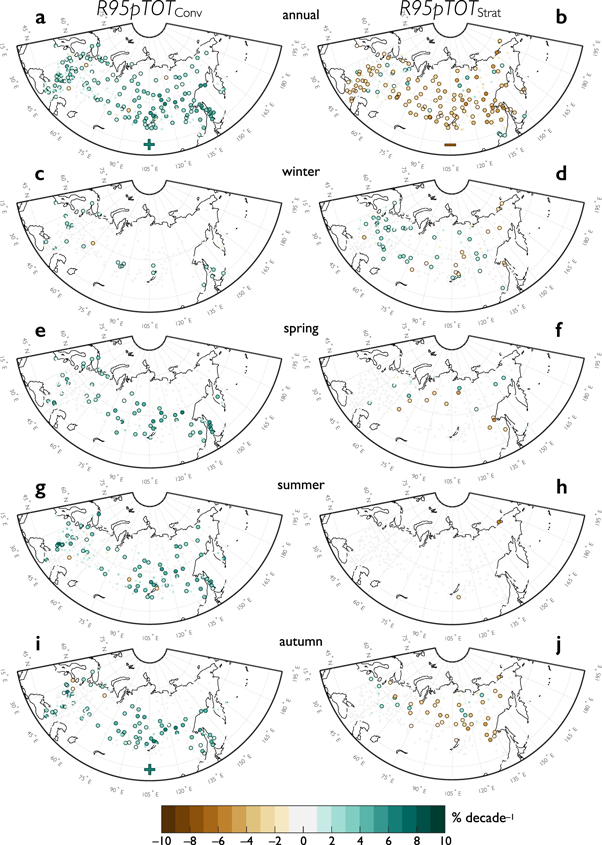
Figure 5. The same as for figure 4, but for contribution of heavy convective (stratiform) precipitation to total precipitation, R95pTOTConv (R95pTOTStrat).
Download figure:
Standard image High-resolution imageOf particular interest is the variability and trends of different precipitation type characteristics aggregated over large regions. Figure 6 shows the long-term variability of annual precipitation totals for five regions (see figure 1 for specification of regions) that were obtained by averaging over all stations in the regions and using only stations that passed tests on artificial instant reversal insignificance. Table 1 summarizes corresponding trend estimates. An elimination of problematic stations with data discontinuities substantially (more than twice for some regions) reduces the magnitude of positive trends in PConv and negative trends in PStrat, while the difference between stations that passed one or both tests is less prominent.
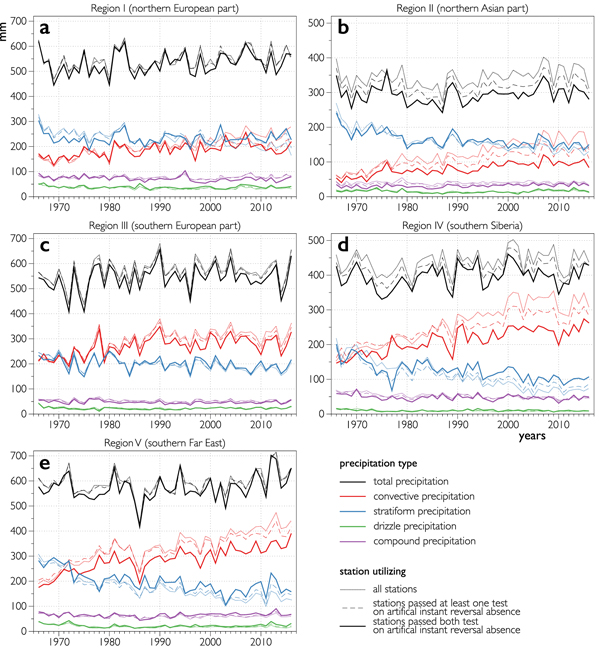
Figure 6. Interannual variations of annual precipitation totals aggregated for five regions (see figure 1 for information on region boundaries). Black, red, blue, green, and magenta colors denote total, convective, stratiform, drizzle, and compound precipitation totals, respectively. Solid (dashed) lines stand for the result of aggregation of stations that passed both tests (only one test) on artificial instant reversal absence; dotted lines display the result of aggregation of all stations.
Download figure:
Standard image High-resolution imageTable 1. Trends of annual precipitation totals (mm/decade) for different regions (see figure 1 for information on region boundaries) and different stations utilized (all stations—all stations in region except those that have too many gaps (>5 missing years), are located at high elevation (>1000 m), or have been relocated; one test passing—stations that passed only one test on the artificial instant reversal absence; both tests passing—stations that passed both tests on the artificial instant reversal absence). Trends are computed with the Theil–Sen estimator. Bold fonts denote statistically significant trends (at a level of 0.05). Significance is obtained with the nonparametric Mann–Kendall test. Numbers of utilized stations are also shown.
| Precipitation type | Regions | I | II | III | IV | V |
|---|---|---|---|---|---|---|
| All precipitation | All stations | 8.44 | 6.17 | 8.64 | 5.86 | 7.70 |
| One test passing | 7.85 | 4.38 | 6.75 | 4.94 | 7.24 | |
| Both tests passing | 8.05 | 2.38 | 5.95 | 5.10 | 7.12 | |
| Convective precipitation | All stations | 24.90 | 23.70 | 22.95 | 39.77 | 41.32 |
| One test passing | 14.14 | 15.28 | 18.59 | 24.87 | 31.62 | |
| Both tests passing | 9.45 | 9.89 | 15.40 | 20.18 | 28.04 | |
| Stratiform precipitation | All stations | −15.55 | −15.67 | −11.45 | −25.58 | −28.15 |
| One test passing | −6.38 | −10.79 | −8.93 | −15.05 | −20.54 | |
| Both tests passing | 0.89 | −8.82 | −6.44 | −12.30 | −20.33 | |
| Drizzle precipitation | All stations | −1.98 | −0.78 | −0.34 | −0.79 | −1.79 |
| One test passing | −0.78 | −0.23 | 0.08 | −0.44 | −0.80 | |
| Both tests passing | −0.34 | 0.24 | 0.37 | −0.12 | 0.18 | |
| Compound precipitation | All stations | 0.57 | 0.23 | −1.36 | −3.95 | −0.76 |
| One test passing | 0.44 | 0.55 | −0.94 | −2.51 | 0.42 | |
| Both tests passing | −2.77 | 1.54 | −0.85 | −1.50 | 1.00 | |
| Number of stations | All stations | 49 | 73 | 121 | 86 | 98 |
| One test passing | 36 | 58 | 109 | 54 | 69 | |
| Both tests passing | 17 | 40 | 57 | 25 | 33 |
Among all regions, the largest trends in the precipitation totals are noted for the south of the Far East (the region V), where PStrat declines from 250–300 mm in the 1960s to 150–200 mm in the 2010s, while PConv shows the upward change from 200 mm to 300–350 mm during the same period. Note that for all southern regions (the regions III–V) absolute values of PConv were comparable to those of PStrat in the 1970s but started to prevail from the 1980s. In the northern regions (regions I and II), fStrat is still greater than fConv but their difference is decreasing. The long-term increase of convective precipitation and decrease of stratiform are in agreement with previously reported decadal changes of cloud type variations (Sun et al 2001, Khlebnikova and Sall 2009). The redistribution of the total precipitation between stratiform and convective has no effect on the drizzle and compound precipitation, which both show generally low variability and mostly insignificant trends (figure 6, table 1).
The largest trends of absolute precipitation characteristics (P, P95, I) are noted for most of the regions in the summer (table 2), except for region V, where changes in autumn are also prominent. For relative characteristics (f, R95p, and R95pTOT), changes in spring and autumn are greater than in summer. Convective precipitation characteristics tend to show statistically significant positive trends for all regions and for all seasons except winter (when insignificant trends of both signs are identified, table 2). Instead, stratiform precipitation characteristics generally show significant negative trends but with smaller magnitudes however (especially for the regions II and III). Moreover, region I is dominated by positive changes in stratiform precipitation characteristics (P, I, R95p) which may be associated with a poleward shift of midlatitude storm tracks (Mokhov et al 2009, Bender et al 2012, Eastman and Warren 2013, Tilinina et al 2013).
Table 2. Trends in annual and seasonal precipitation characteristics of convective (C) and stratiform (S) precipitation types for different regions (see figure 1 for information on region boundaries). Only stations that passed both tests on the artificial instant reversal absence were used (number of stations are shown in brackets for each region). Trends are computed with the Theil–Sen estimator. Bold fonts denote statistically significant trends (at 0.05 level). Significance is obtained with the nonparametric Mann–Kendall test.
| I (17) | II (40) | III (57) | IV (25) | V (33) | |||||||
|---|---|---|---|---|---|---|---|---|---|---|---|
| Precipitation characteristics | Regions | C | S | C | S | C | S | C | S | C | S |
| Precipitation totals, PConv and PStrat (mm/decade) | Annual | 9.45 | 0.89 | 9.89 | −8.82 | 15.40 | −6.44 | 20.18 | −12.30 | 28.04 | −20.33 |
| Winter | −0.05 | 3.02 | 0.38 | −1.76 | 2.49 | 1.06 | 1.03 | 1.46 | 1.61 | −0.75 | |
| Spring | 2.10 | −0.10 | 1.72 | −1.23 | 5.10 | −0.79 | 4.77 | −1.64 | 7.14 | −4.70 | |
| Summer | 5.68 | −1.96 | 4.89 | −3.18 | 3.60 | −3.25 | 9.38 | −7.23 | 10.19 | −7.73 | |
| Autumn | 1.00 | −0.94 | 2.93 | −1.86 | 3.86 | −1.59 | 4.89 | −3.28 | 8.48 | −6.35 | |
| Frequency of precipitation events, pPConv and pPStrat (per decade) | Annual | 0.01 | −0.01 | 0.01 | −0.01 | 0.01 | −0.01 | 0.01 | −0.01 | 0.01 | −0.01 |
| Winter | 0.01 | 0 | 0.01 | −0.02 | 0.01 | 0 | 0.01 | 0 | 0 | 0 | |
| Spring | 0.01 | −0.01 | 0.01 | −0.01 | 0.01 | −0.01 | 0.01 | −0.01 | 0.01 | −0.01 | |
| Summer | 0.01 | −0.01 | 0.01 | −0.01 | 0 | −0.01 | 0.01 | −0.01 | 0 | −0.01 | |
| Autumn | 0 | −0.01 | 0.01 | −0.01 | 0.01 | −0.01 | 0.02 | −0.02 | 0.01 | −0.01 | |
| Daily precipitation intensity, IConv and IStrat (mm/day/decade) | Annual | 0.05 | 0.06 | 0.11 | −0.01 | 0.08 | 0.02 | 0.09 | −0.07 | 0.38 | −0.18 |
| Winter | 0.03 | 0.05 | 0.09 | 0 | 0.05 | 0.05 | 0.04 | 0.05 | 0.26 | −0.04 | |
| Spring | 0.06 | 0.08 | 0.12 | 0.01 | 0.11 | 0.06 | 0.16 | 0.02 | 0.40 | −0.12 | |
| Summer | 0.10 | 0.26 | 0.15 | 0 | 0.12 | 0.07 | 0.16 | −0.01 | 0.47 | −0.08 | |
| Autumn | 0.02 | 0.05 | 0.11 | −0.01 | 0.17 | 0.07 | 0.04 | −0.07 | 0.38 | −0.26 | |
| Fraction of PConv and PStrat in total precipitation P, fConv and fStrat (%/decade) | Annual | 1.66 | −0.85 | 2.59 | −3.10 | 2.25 | −1.86 | 4.36 | −3.83 | 3.88 | −3.86 |
| Winter | 0.72 | 0.38 | 0.69 | −0.87 | 1.81 | −0.95 | 1.52 | −1.39 | 2.03 | −2.61 | |
| Spring | 1.86 | −0.36 | 2.92 | −3.29 | 2.87 | −2.24 | 5.15 | −4.48 | 5.47 | −5.77 | |
| Summer | 2.06 | −1.78 | 2.68 | −3.10 | 1.83 | −1.94 | 4.64 | −3.80 | 3.12 | −3.16 | |
| Autumn | 1.26 | −0.57 | 2.67 | −3.07 | 2.77 | −2.66 | 5.73 | −5.45 | 4.82 | −4.94 | |
| Precipitation sum obtained during very wet days, P95Conv and P95Strat (mm/decade) | Annual | 3.80 | 1.29 | 3.40 | −3.61 | 6.72 | −0.89 | 7.36 | −6.13 | 12.04 | −8.54 |
| Winter | −0.20 | 1.27 | 0.07 | −0.51 | 0.68 | 1.07 | 0.26 | 0.74 | 0.72 | −0.11 | |
| Spring | 0.99 | 0.68 | 0.61 | −0.21 | 1.95 | 0.06 | 2.03 | −0.63 | 3.34 | −1.76 | |
| Summer | 2.52 | −0.07 | 1.83 | −0.97 | 2.48 | −0.80 | 4.19 | −1.81 | 5.21 | −1.60 | |
| Autumn | 0.36 | −0.05 | 1.08 | −0.57 | 2.07 | 0.45 | 1.61 | −1.05 | 3.21 | −2.28 | |
| Contribution of heavy precipitation to precipitation totals, R95pConv and R95pStrat (%/decade) | Annual | 0.90 | 0.83 | 1.05 | −0.97 | 0.86 | 0.10 | 1.16 | −2.71 | 1.81 | −1.85 |
| Winter | 0.13 | 1.04 | 1.64 | 0.03 | 1.51 | 0.70 | 0.70 | 0.95 | 1.93 | 0.42 | |
| Spring | 2.31 | 1.40 | 1.80 | −0.14 | 1.32 | 0.35 | 3.33 | −1.72 | 3.70 | −2.18 | |
| Summer | 1.61 | 0.31 | 1.21 | −1.12 | 0.90 | −0.81 | 1.68 | −1.13 | 2.12 | −0.77 | |
| Autumn | 0.38 | 0.74 | 2.65 | −0.51 | 2.01 | 0.79 | 1.58 | −2.14 | 2.50 | −1.37 | |
| Contribution of P95Conv and P95Strat to P, PR95pTOTConv and R95pTOTStrat (%/decade) | Annual | 0.73 | 0.10 | 0.93 | −1.43 | 0.92 | −0.35 | 1.52 | −1.83 | 1.79 | −1.46 |
| Winter | −0.05 | 0.89 | 0.12 | −0.12 | 0.49 | 0.39 | 0.33 | 0.63 | 0.84 | 0.16 | |
| Spring | 1.13 | 0.78 | 1.02 | −0.51 | 1.17 | −0.22 | 2.49 | −1.30 | 2.62 | −1.64 | |
| Summer | 1.32 | −0.25 | 0.99 | −1.01 | 1.05 | −0.50 | 1.95 | −1.00 | 1.91 | −0.63 | |
| Autumn | 0.33 | 0.15 | 1.08 | −0.89 | 1.26 | 0.14 | 1.57 | −1.51 | 1.81 | −1.21 | |
4. Discussion and conclusions
The moderate increase in the total precipitation over NE over the last five decades is accompanied by the tremendous growth of convective precipitation and the concurrent reduction of stratiform precipitation throughout the entire region. In general, rates of convective precipitation increase are greater than those of stratiform precipitation decrease (the latter even shows positive trends, primarily in winter in the northern regions of NE). Generally, convective and stratiform precipitation totals and heavy precipitation sums exhibit major changes in summer, while fractional contributions of these two precipitation types to the total precipitation (including the contribution of heavy precipitation events) show the strongest trends in transition seasons. This singles out spring and autumn as more summer-like seasons in terms of precipitation regime, which is in line with the previous results by Sun et al (2001) who found this tendency for cloud types.
Heavy convective precipitation events have started to contribute more to total precipitation. The statistically significant trends amount to 1%–2%/decade for broad regions (resulting in an increase of up to 10% for the last fifty years) being even higher at particular stations (up to 5%/decade). The largest increase is found over the southern Far East region (mostly because of the increase in the intensity of convective precipitation with trends of about 0.4–0.5 mm/day/decade for the entire region and up to 1.4 mm/day/decade for several stations). The obtained trends highlight the changing character of precipitation over NE with the increasing role of heavy showers.
Our results are in agreement with the previous findings that showed the increase of convective precipitation over the Eurasian continent. Particularly, positive trends for showery precipitation were found for central Europe (Rulfová and Kyselý 2014), Northern China (Han et al 2016), and Russia (Ye et al 2017). Ye et al (2017), who restricted their analysis of data up until the year 2000 and used all stations (including those with questionable reports), obtained trends for precipitation totals that are twice as strong as our findings. Such strong trends may result either from using all stations without a discontinuity check or from the analyzed period being shorter. To reveal the main cause of the overestimation, we calculated precipitation trends for the two additional temporal periods: 1966–2000 (the same as in Ye et al (2017)) and 2001–2016 (tables S1, S2). For the longer period, the trend slopes get reduced by 2%–10% for convective precipitation (by 35% in region III) and by 5%–25% for stratiform precipitation. The use of only stations passing both tests on artificial change absence results in a considerably stronger decrease in trend slopes (by 30%–60%). Thus, the use of stations with temporally homogeneous time series of weather and cloud types is crucial for estimating robust trends in the convective and stratiform precipitation.
Different causes may determine seasonal and regional patterns of changes in precipitation types. From a thermodynamic perspective, ongoing air temperature increase yields air moisture increase with the rate for saturated vapor pressure at 7% °C–1 (the so-called Clausius–Clapeyron (CC) rate (Trenberth et al 2003)) that suggests a scale for precipitation extreme intensity growth with the warming. For central Europe, for an eight year period, Berg et al (2013) found the CC rate of increase of stratiform precipitation extreme intensity with temperature, and the exceedance of this rate for convective extremes. Similar results were obtained for South Korea for a 24-year period (Park and Min 2017). For the long-term view, annual means of convective (stratiform) precipitation intensity increase (decrease) with rising temperature (Ye et al 2017). Our results confirm previous findings and show seasonal variation of long-term precipitation response to changing temperature (table 3) with the maximum in summer. A particularly large summer response is found in the southern Far East region where it is close to the so-called super (doubled) CC rate (13.8% °C–1). Such a high CC rate in this region in summer may be associated with high surface air humidity (figure S7) that is critical for establishing a doubled CC rate (Lenderink et al 2017). The vertical structure of temperature and humidity sets a convective instability of the atmosphere, which is an important factor for convective precipitation intensity (Loriaux et al 2017). Specifically, characteristics of convective precipitation have a positive statistically significant correlation with the convective available potential energy (CAPE) for most of the stations, while stratiform precipitation is almost uncorrelated with CAPE (figure 7, table S3). Presumably, a large part of the positive trends of convective precipitation in transition seasons is associated with the observed increase of CAPE (Chernokulsky et al 2017b); however, this assumption needs more in-depth analysis. In summer, CAPE significantly increases over the European part of Russia (especially near the Black Sea), but decreases over the large part of the Far East (figure S8), and hence plays a smaller role in shaping the observed precipitation trends in this region (table S3). The diversity in the obtained regional responses is linked with the nonlinearity of the temperature–precipitation and instability–precipitation relationships that are determined by atmosphere dynamics and microphysics.
Table 3. Slope of regression of mean seasonal daily intensity of convective (C) and stratiform (S) precipitation to mean seasonal temperature for different regions (see figure 1 for information on region boundaries) (in % °C–1). Regression slopes are computed with the Theil–Sen estimator. Bold fonts denote statistically significant trends (at a level of 0.05). Significance is obtained with the nonparametric Mann–Kendall test. Only stations that passed both tests on the artificial instant reversal absence are used. Temperature is calculated by simple averaging of seasonal mean temperature for the same stations (since temperature data are missing for several stations for regions I–III, fewer stations are used for these regions; number of used stations is shown in brackets). Percentage of intensity is calculated with respect to 51 years mean of intensity.
| Regions | I (16) | II (39) | III (54) | IV (25) | V (33) | |||||
|---|---|---|---|---|---|---|---|---|---|---|
| Precipitation type | C | S | C | S | C | S | C | S | C | S |
| Winter | 1.59 | 1.43 | 3.45 | 0.61 | 2.75 | 0.71 | 1.11 | −0.32 | 5.13 | −3.03 |
| Spring | 2.66 | 1.54 | 2.36 | −0.26 | 1.02 | 0.13 | 1.20 | −2.63 | 6.18 | −5.96 |
| Summer | 4.78 | 3.07 | 9.76 | −1.15 | 2.34 | 1.47 | 2.81 | −0.96 | 13.76 | −8.17 |
| Autumn | 2.98 | 2.10 | 4.80 | 0.78 | 2.29 | 2.60 | 1.48 | −2.24 | 8.20 | −3.84 |

Figure 7. Mann–Kendall correlation coefficient between detrended time series of summer PConv (a), PStrat (b), P95Conv (c), P95Strat (d), and frequency of CAPE > 100 J kg–1 in summer (from ERA-Interim data (Dee et al 2011) that is calculated for the reanalysis grid boxes that include the meteorological station locations) for the 1979–2016 period. Coefficients are shown only for the 326 stations that passed at least one of the tests on artificial instant reversal absence.
Download figure:
Standard image High-resolution image
Atmospheric dynamics and microphysics are supposed to be important for the observed redistribution between two types of precipitation over NE. In particular, atmospheric fronts frequency changes (Berry et al 2011a), together with changes in the number of extremely strong fronts (Schemm et al 2017), may influence the balance between convective and stratiform precipitation. The increase in the frequency of strong fronts in summer (Schemm et al 2017) (when cold fronts are prevailing (Berry et al 2011b)) may result in an increased role of convective precipitation. The poleward shift of storm tracks (Mokhov et al 2009, Bender et al 2012, Eastman and Warren 2013), especially pronounced in winter, leads to a decrease in large-scale (stratiform) precipitation in southern regions of NE and to an increase in central and northern regions. This tendency has been confirmed with the presented results that showed an increase in stratiform precipitation in the north and center of the European part of Russia. In line with this, while the transportation of atmospheric moisture in Northern Eurasia does not show significant trends, the relative contribution of the transient eddies does show a significant increase from 1979 onwards (Dufour et al 2016). Regional and local processes may also play a role. Specifically, the increasing intensity of the Siberian High leads to a decline in stratiform clouds and associated precipitation in the south of NE in winter (Chernokulsky et al 2013). Near the Black Sea, sea surface temperature warming leads to tropical-like convection development (enhanced by orography) that yields heavy and devastating showers (Meredith et al 2015a, 2015b). At the western Arctic coast, convective precipitation may have positive trends in the cold part of a year associated with intensified cold air outbreaks (and the consequent development of convection) due to sea-ice retreat (Esau and Chernokulsky 2015). Tropospheric aerosols may also have regional effects since they diversely influence convective and stratiform precipitation (Tao et al 2012). Ongoing variations in aerosol properties (see e.g. Chin et al 2014, Zhao et al 2017) may alter precipitation characteristics, especially over polluted regions like the south of the Far East (Kinne et al 2013) where the largest trends in convective precipitation are found.
The observed change in NE precipitation structure is an important regional consequence of global climate change that may influence the regional water cycle. Redistribution of total precipitation between convective and stratiform types is likely a result of a delicate balance among various causes including thermodynamics, dynamics, and microphysics. Further analysis based on various observations (surface, weather radars, satellites) and specially conducted model simulations is needed to disentangle the role of individual drivers in the discovered precipitation redistribution in order to attribute the revealed tendencies to climate change and internal climate variability.
Acknowledgments
This paper is dedicated to the memory of Dr Olga Bulygina, our deeply esteemed colleague and an ardent scientist. She largely contributed to this paper before she passed away in early 2018. She will be dearly missed. The study has been supported by the Russian Science Foundation (project no. 18-77-10076). Station data have been processed under the RFBR 17-29-05098 project. Support for OZ from the Agence Nationale de la Recherché through the ARCTIC-ERA project is appreciated. The authors are grateful to the editor and two anonymous reviewers for their helpful comments on the manuscript.