


Abstract
The lake level dynamics of the Qinghai–Tibetan Plateau (QTP, also called the 'Third Pole') are a crucial indicator of climate change and human activities; however, they remain poorly measured due to extremely high elevation and cold climate. The existing satellite altimeters also suffer from relatively coarse temporal resolution or low spatial coverage, preventing effective monitoring of lake level change at such a large spatial scale. The recently launched surface water and ocean topography (SWOT) mission is expected to greatly enhance the current lake level monitoring capabilities. However, a systematic evaluation is still lacking in the region. To elucidate this potential, here, we generated SWOT-like lake products for 38 major lakes (>150 km2) over the QTP during 2000–2018 using a large-scale SWOT hydrology simulator with the input of satellite altimetry and water mask databases. The comparative assessments between the satellite altimetry data and SWOT simulations using various statistical metrics and decomposed time series components demonstrate that SWOT can successfully monitor both short-term dynamics and long-term trends. Extended experiments to derive SWOT-like data of 783 lakes (>1 km2) based on the synthetic lake level series present the spatial pattern of SWOT performance that tends to improve with the increasing lake area. Our findings provide comprehensive inferences and confidence for lake level monitoring in the Third Pole in the early period of the SWOT satellite.
Export citation and abstract BibTeX RIS

Original content from this work may be used under the terms of the Creative Commons Attribution 4.0 license. Any further distribution of this work must maintain attribution to the author(s) and the title of the work, journal citation and DOI.
1. Introduction
The largest global storage of frozen water after the polar regions—the Qinghai–Tibetan Plateau (QTP) and its surroundings—is called 'the Third Pole' of the Earth owing to an average elevation of more than 4000 m asl, which is the highest and largest plateau in the world, covering an area of about 2.5 million km2 (Harris 2010, Yao et al 2022). As the source area of five major rivers of Asia, the QTP has approximately 37,861 glaciers with a total area of 41,137 km2 (∼2% of the QTP) in 2013 (Ye et al 2017), governing the freshwater availability of almost two billion people (Immerzeel et al 2010, Yao et al 2022). Hence the QTP is also known as the 'water tower of Asia' (Immerzeel et al 2020). In addition, roughly 1,400 lakes larger than 1 km2 in the region account for more than 45% of the total area of lakes in China, which play a significant role in the regional and global hydrological cycle (status: 2021) (Zhang et al 2014, 2018, 2019a). However, climate change has impacted the QTP over the last four decades and induced evident environmental issues regionally. For example, the rapidly warming temperature has led to continuous glaciers melting and accelerating permafrost degradation over the past few decades (Brun et al 2017, Li et al 2021, Zhang and Duan 2021), and is expected to intensify under climate change scenarios (Li et al 2022). Increasing precipitation triggered by the changes in atmospheric circulations has distinctly affected the regional eco-hydrological processes and water resource regimes, exerting a major influence on the water and energy cycles of lake systems (Wan et al 2017, Wang et al 2021, Yang et al 2022). Furthermore, lakes remaining free from substantial human impact over the QTP are direct indicators of climate change and have undergone continuous growth in water levels since the 1990s (Zhang et al 2011, 2019b, 2020, Zhang 2018, Yue et al 2020). Therefore, monitoring the lake water level change over the QTP is of vital importance for better understanding climate change and freshwater resource management for this region and its surroundings (Ding et al 2013, Shen et al 2014, Gao et al 2016). However, the long-term in-situ measurements of lake levels are lacking due to the extreme topographic conditions in the QTP, as well as the considerable cost of instrument installation and maintenance costs (Qiao et al 2019, Jiang et al 2020, Liu et al 2021).
Given the limitation of in-situ lake level data, space-borne observations provide a diagnostic tool for high-resolution monitoring of lake level changes. Such observations, which can be broadly classified into the main categories of radar and laser altimetry (Giles et al 2008), have enabled long-term lake level monitoring for the lake groups over the QTP (Kleinherenbrink et al 2015, Crétaux et al 2016, Zhang et al 2021a, Ma et al 2022). For the former category, data from the Topex/Poseidon family mission (Hwang et al 2016), CryoSat-2 radar altimetry (Jiang et al 2017), and Sentinal-3 satellite altimetry (Huang et al 2019, Ma et al 2022) have supported continuous lake level monitoring for the lakes over the QTP. Multi-sensor altimetry data synergistically applied with the global reservoir and lake database have significantly advanced our understanding of the long-term characteristics of water levels in large lakes and with embedded uncertainties and sparse ground tracks (for example, the inter-track distance of ∼80 km at the Equator for Envisat) (Yuan et al 2017, Zhang et al 2021a, Xu et al 2022). Laser altimetry, on the other hand, possesses a dense spatial coverage and higher accuracy than radar-based observations, and has therefore enabled level monitoring even for small lakes (Zhang et al 2017a, 2019c, 2021b, Chen and Duan 2022). In this category, data from the ICESat/GLAS mission (Wang et al 2013), two generations of ICESat satellites (i.e. ICESat-1/2), a combination of ICESat and satellite imagery (Liu et al 2022, Luo et al 2022), have been successfully used to map the water level dynamics and lake volume changes over QTP with similar findings over the region from other global studies (Treichler et al 2019, Ma et al 2020, Chen et al 2022). Despite its outperformance over radar altimetry, laser altimetry satellites still suffer from a relatively long repeat cycle (from three months to over one year), and thus make it difficult to capture the seasonal variability for lake groups in the QTP (Ma et al 2016). In addition, satellite laser altimetry is affected by clouds during transmission through the atmosphere, which limits its accuracy and data availability (Ma et al 2019).
Considering this context, the surface water and ocean topography (SWOT) mission shows great potential for improving conventional satellite-based lake monitoring (Biancamaria et al
2016). SWOT, launched on 16 December 2022, uses the Ka-band (35.75 GHz) Radar Interferometer (KaRIn) instrument to provide accurate estimates of water surface elevation (WSE) and surface area extent in wide swaths with a coverage of more than 90% of inland waters larger than 62 500 m2. Different from previous satellite sensors (for example, radar altimetry), the KaRIn is a new class of altimeters that measures water elevation with two Ka-band synthetic aperture radar antennae at opposite ends of a 10m boom. In addition, SWOT has a repeat cycle of ∼21 d, and most locations can be observed more than once within one cycle due to the overlap of wide swaths (Fu et al
2012). Therefore, SWOT observations are expected to have high accuracy (<10 cm over lakes larger than 1 km2), high pixel resolution (10 m–60 m  6 m intrinsic pixel size), high temporal resolution (mostly 2–4 observations per ∼21 d depending on the location latitude), and high spatial coverage (77°S–77°N), accelerating the development of land hydrology (Biancamaria et al
2016). From the formation of the Scientific Committee in 2007 until today, many studies have conducted the evaluation of SWOT-like data over lakes and reservoirs by simulating fairly representative characteristics of SWOT observations (Ottle et al
2020, Du et al
2021, Nair et al
2021, 2022). Furthermore, obtaining synthetic SWOT-like data in the early phases of its launch played an important role in sea-level change, hydrological and hydrodynamic modeling, and lake and reservoir monitoring fields (Biancamaria et al
2016, Solander et al
2016). For example, (Bonnema and Hossain 2019) produced SWOT-like WSE data for 20 reservoirs in the Mekong River basin using the SWOT simulator developed by the NASA Jet Propulsion Laboratory (Jet Propulsion Laboratory 2018) and achieved a satisfactory modeling performance with 85% of the reservoirs possessing an average error lower than 8%. Additionally, based on the large-scale SWOT simulator from the National Centre for Space Studies (CNES), Elmer et al (2020) simulated pixel-cloud scale WSE data for the Chena River watershed by coupling it with the Weather Research and Forecasting hydrological extension package on an improved daily timescale. In a nutshell, SWOT is expected to become a robust tool to assess the surface water change (i.e. level, extent, and storage) over the world.
6 m intrinsic pixel size), high temporal resolution (mostly 2–4 observations per ∼21 d depending on the location latitude), and high spatial coverage (77°S–77°N), accelerating the development of land hydrology (Biancamaria et al
2016). From the formation of the Scientific Committee in 2007 until today, many studies have conducted the evaluation of SWOT-like data over lakes and reservoirs by simulating fairly representative characteristics of SWOT observations (Ottle et al
2020, Du et al
2021, Nair et al
2021, 2022). Furthermore, obtaining synthetic SWOT-like data in the early phases of its launch played an important role in sea-level change, hydrological and hydrodynamic modeling, and lake and reservoir monitoring fields (Biancamaria et al
2016, Solander et al
2016). For example, (Bonnema and Hossain 2019) produced SWOT-like WSE data for 20 reservoirs in the Mekong River basin using the SWOT simulator developed by the NASA Jet Propulsion Laboratory (Jet Propulsion Laboratory 2018) and achieved a satisfactory modeling performance with 85% of the reservoirs possessing an average error lower than 8%. Additionally, based on the large-scale SWOT simulator from the National Centre for Space Studies (CNES), Elmer et al (2020) simulated pixel-cloud scale WSE data for the Chena River watershed by coupling it with the Weather Research and Forecasting hydrological extension package on an improved daily timescale. In a nutshell, SWOT is expected to become a robust tool to assess the surface water change (i.e. level, extent, and storage) over the world.
Despite the great potential of SWOT to the environmental community, the monitoring ability of short-term dynamics and plausible long-term changes in lake levels by the recent SWOT satellite over the QTP is still unexplored at this early stage. Therefore, we comprehensively investigated and analyzed the performance of SWOT-like WSE data over the period 2000–2018 for 38 major lakes (>150 km2) (38 ml hereafter) using the CNES large-scale SWOT hydrology simulator and multiple satellite-based datasets, and subsequently extended our experiments to the 783 lakes (>1 km2) (783 l hereafter) around the QTP. To the best of our knowledge, this is the first SWOT simulation over such a large spatial (∼2500 000 km2 of the QTP) and temporal (∼20 years) scale, aiming to provide valuable nformation for the hydrological and climatic communities in the initial period of SWOT life.
2. Methods
The first part of this study was accomplished by comparing the satellite altimetry data with the corresponding SWOT-like WSE over the 38 ml, which is derived using the SWOT simulator based on the satellite-retrieved lake WSE and water mask data set (figure 1(a)). These lakes are selected because they play an essential role in the regional water and energy cycles of the region (Wang et al 2018). The contrast is performed on different scales, including the amplitude, phase, trend, and accuracy of the lake level series. Due to the data limitation, the synthetic water level series are created based on the characteristics of the satellite altimetry product of 38 ml in the previous experiment. The synthetic time series can reasonably represent the long-term trend and seasonality of the lake level. Subsequently, we designed the second SWOT simulation over 783 l to fully discern the potential SWOT capability, temporally and spatially, which are selected based on their area (>1 km2), slope (relatively lower to reduce layover), and position (within the SWOT swath). Similarly, the model inputs are from the optical water mask and lake water level. Comparisons are conducted between synthetic and SWOT-like water levels using various statistical metrics. A detailed description of the input, output, and other characteristic features of the SWOT simulator and the advantages of SWOT over existing satellite missions in the current context can be found in section 1 of the supplementary data. To evaluate the ability of the SWOT mission for lake monitoring, different harmonic parameters of temporal lake level variations (i.e. annual amplitude, annual phase, semi-annual amplitude, semi-annual phase, and long-term trends) are determined using temporal harmonic analysis (Jekeli 1996) from the reference height, and associated SWOT-like WSE in the 38 ml in the QTP are compared. Moreover, the accuracy of SWOT-like WSE data is quantified by several metrics, including the correlation coefficient (CC), Nash–Sutcliffe efficiency (NSE), and root mean square error (RMSE). The detailed equations are presented in section 2 of the supplementary data.
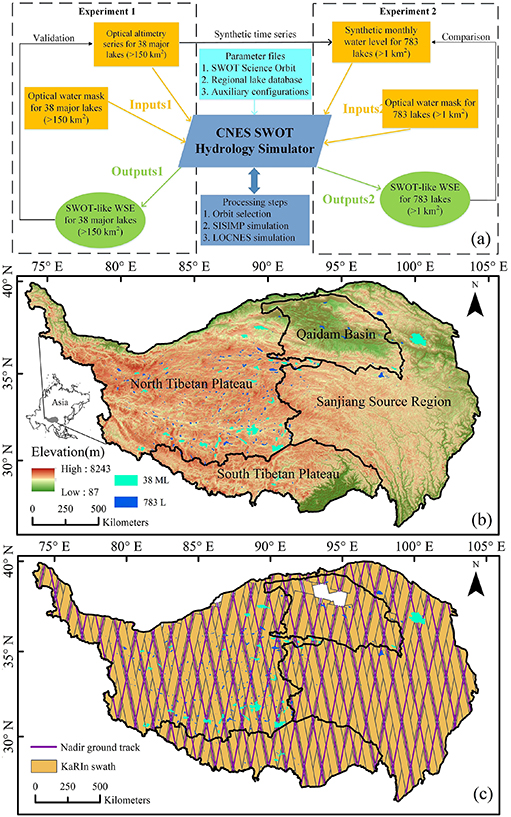
Figure 1. (a) The schematic workflow considered in this study. The objective of experiment 1 is to assess the SWOT monitoring capability for short-term dynamics and long-term trends of lake levels while the objective of experiment 2 is to evaluate the spatial distribution of SWOT performance on the QTP. Please find details of the experiments in section 2. (b) Elevation and sub-regions of the QTP and (c) spatial distribution of Nadir ground tracks and KaRIn swaths over the QTP. The QTP is divided into four different sub-regions considering divergent elevation, topography, climate, and hydrological conditions (Zhang et al 2011): the north Tibetan plateau (NTP), the south Tibetan plain (STP), the Qaidam basin (QB), and the Sanjiang Source Region (SSR). The 38 ml selected are marked in sky blue; the 783 l selected are marked in deep blue. The center of the Qaidam basin, where lakes and rivers are nearly absent, is not covered by the SWOT satellite considering its download capacity limitation of the continental system. The presented orbit is the SWOT Science Orbit beyond the calibration/validation phase (available at www.aviso.altimetry.fr (accessed: 10 March 2023)).
Download figure:
Standard image High-resolution imageFor the simulations of the 38 ml in the QTP (see figures 1(a) and (b)), the reference height data for the period 2000–2018 for the SWOT simulator is from the high-temporal-resolution (∼16 d) 'optical altimetry' product that combines several altimetric missions (for example, Envisat, Jason-1/2/3, and CryoSat-2 missions) and optical remote sensing images (Li et al 2019). High-spatial-resolution reference height inputs are required to fully detect the spatiotemporal patterns of SWOT performance (figures 1(a) and (c)). However, neither the in-situ measurements nor satellite observations can provide the lake level information on such a large spatial (∼2500 000 km2) and temporal (∼20 years) scale simultaneously. Therefore, the monthly water level series for the 783 l in the QTP between 2000 and 2018 were created using a multiplicative decomposition method. The example and description of the reconstruction process are shown in section 3 of the supplementary data. The satellite-derived water masks for the lakes over the QTP (in 2018) were prepared for the SWOT simulator to model the lake level dynamics (Zhang 2019a). The water mask dataset was generated using the popular Normalized Difference Water Index based on the long-term Landsat family imageries combined with the visual interpretation and manual editing of incorrect lake boundaries (Zhang et al 2014, Zhang 2019a).
3. Results
To validate the lake level monitoring ability of SWOT in the QTP, comprehensive comparisons between reference height and corresponding SWOT-like WSE (lakeSP product) among the 38 ml were carried out, which was estimated as the spatially averaged pixel clouds after geolocation improvements. Multiple metrics, including CC, NSE, and RMSE, were calculated (see figure 2 and table S2). CC and NSE demonstrate similar patterns, with all the lakes showing a CC higher than 0.94 and NSE higher than 0.88 (i.e. Mapam Yum Co). Relatively poor performances are found in Goren Co, Puma Yun Co, and Yelusu Lake, whereas other lakes generally present satisfactory values of CC and NSE ranging from 0.96 to 1. However, a contrasting pattern is revealed by RMSE, in which some lakes with relatively higher NSE and CC show comparably larger RMSE than other lakes. The Memar Co with a CC/NSE as high as 0.99/0.98, for example, illustrates the largest RMSE of 0.35 m among all the lakes. The difference is because of the relatively high seasonal and inter-annual variabilities, which favors the enhancement NSE (Jain and Sudheer 2008). In the case of Dagze Co, a high RMSE of 0.32 m is caused by some outliers, which are not reflected by both CC and NSE due to a good overall consistency between reference height and SWOT-like data during 2000–2018. Overall, most of the lakes illustrate RMSE < 0.16 m, indicating the effective lake level monitoring capability of SWOT.

Figure 2. (a)–(c) Performance of the SWOT-like WSE over 38 ml in the QTP. Note: detailed information on the lakes is provided in table S2. (d), (e) Time series of the reference height and associated SWOT-like WSE for the Aqqikkol and Zhuonai lakes. The black line indicates the reference height and the blue dots represent the associated SWOT-like WSE with the vertical bars denoting the model uncertainty.
Download figure:
Standard image High-resolution imageThe level time series of reference height and the SWOT-like WSE for the 38 ml in the QTP are shown in figures 2 and S3. Various patterns of water level changes are effectively captured by the SWOT-like WSE. Specifically, many lakes experiencing significantly increasing water levels due to increasing trends in precipitation and glacial ice melt induced by warming climate have been well monitored by SWOT (Zhang et al 2017b). Among such lakes, the Aqqikkol (0.71 ± 0.02 ma−1), Lexiewudan (0.50 ± 0.02 ma−1), and Dagze Co (0.43 ± 0.01 ma−1) lakes are the most obvious (figure 2(d)), together with the gradient increases of lake level during 2000–2005 in the Bam, Dung, and Pung Co induced by warming climate and increasing precipitation (Ge and Zong 2005). Conversely, a few lakes, such as the Langa Co (−0.19 ± 0.01 ma−1) and Yamzho Yum Co (−0.29 ± 0.01 ma−1), undergoing decreasing trends in lake levels over the last few decades, are also detected by SWOT, which was also reported in a previous study (Kleinherenbrink et al 2015). Moreover, the SWOT-like WSE shows reasonably good agreement with the reference height series in the lakes without clear patterns, such as the Goren Co, Gozha Co, and Xuru Co lakes. It is noteworthy that the abrupt expansion in the Kusai Lake in 2011 due to the dike break of the upstream Zhuonai Lake was assessed by SWOT (figure 2(e)) (Liu et al 2016). Subsequently, the water level of Kusai Lake dropped as water flowed into the Salt Lake, which was also well captured by SWOT (Hwang et al 2019). The simulation uncertainties of lakes that are averaged over pixel clouds are also presented for better justification (figure S3), with an average uncertainty of 0.43 and 1.72 m for the Aqqikkol and Zhuonai lakes, respectively (figures 2(d) and (e)). Therefore, we infer that the SWOT-like WSE can efficiently capture both the short-term dynamics and long-term trends of the lake level series, suggesting the great potential for lake monitoring of the SWOT mission.
We further carried out a temporal harmonic analysis to quantify the ability to track the lake level dynamics of SWOT (figure 3). SWOT-like WSE illustrates satisfactory accuracy in evaluating the long-term average lake level ranging from 3194 m (Qinghai Lake) to 5083 m (Gozha Co), in line with the reference height of 3194 m and 5083 m, respectively. The significant (p < 0.05, t-test) fitted linear slope of 1 validates the robustness of SWOT for all the lakes. A similar pattern is obtained by the examination of long-term trends (figure 3(f)). The SWOT-like WSE well correlates with the reference height in terms of the trends between −0.29 ± 0.01 ma−1 (Yamzho Yun Co) and 1.75 ± 0.11 m a−1 (Salt Lake), with the significant (p < 0.05) fitted line at a slope of 1.01. Effective monitoring of long-term trends in lake levels over the QTP purely based on the SWOT satellite enables us to observe regional climate change timely and accurately. In addition, SWOT-like WSE monitors the annual variability in terms of amplitude and phase reasonably well. Specifically, most lakes show annual amplitude between 0.04 ± 0.06 m (Lumajiangdong Co) and 0.34 ± 0.04 m (Puma Yun Co) except for Sale Lake (1 ± 1.16 m), which are observed by the SWOT-like WSE with a significant linear slope of 0.96 compared with the reference height results. Regarding the annual phase, the overall performance of the SWOT-like WSE (R2 = 0.85) is mainly negatively affected by individual lakes, including the Salt and Zhuonai lakes, due to the outburst event in 2011, as previously mentioned. In general, SWOT can efficiently observe the annual variability of lakes. However, its outperformance inevitably decreases at the semi-annual time scale. Although the consistency between reference height and SWOT-like data exists over many lakes, several outliers, such as Chibzhang Co, Pung Co, and Salt Lake, obviously impact the overall performance of the SWOT-like results on both amplitude and phase levels. Such discrepancies are mainly caused by the inadequate number of SWOT observations within a cycle, possibly missing some short-term variabilities/extremes (for example, flash droughts/floods, lake outbursts, and avalanches) that are difficult to predict using regional hydrological/weather models. Thus, we assert that given the sparse-distributed field stations over the QTP, the SWOT mission has a chance to serve as a preferential tool for early warning and protection of water-related disasters if the observations could be made multiple times per cycle and the latency between acquisitions can be minimized. The modeled SWOT-like lakeSP product, as the spatial aggregation of numerous pixels, can provide the most reliable information for local water resources managers and decision-makers on various scales, highlighting the significant role of SWOT satellites in water resources management.
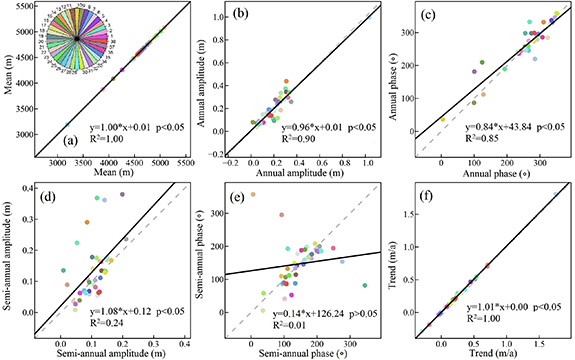
Figure 3. Scatter plots between different harmonic parameters of the reference height and SWOT-like WSE over 38 ml in the QTP. Note: The red number represents the lake ID referring to table S2. The grey dashed line and black solid line represent the 1:1 and linear-fitted line, respectively.
Download figure:
Standard image High-resolution imageBased on the monthly synthetic lake level series, SWOT-like WSE has been obtained for 783 l in the QTP and subsequently compared with the reference height for the whole of the QTP and four subregions. The spatial distributions of CC, NSE, and RMSE along the QTP are illustrated in figures 4(a), (d) and (g). CC and NSE share a similar spatial distribution in which higher values are in the STP and the center of the NTP, while lower values are mainly found in the boundary of NTP, QB, and SSR regions. However, the spatial distribution of RMSE is slightly different from that of CC and NSE, where the relatively higher extreme values ranging from 0.4–0.6 m are located in the center of NTP. The cumulative density functions of CC and NSE in the NTP and STP are generally consistent and clearly exceed the QB and SSR (figures 4(b), (e) and (g)). However, the RMSE results for the NTP, STP, and SSR show slightly higher accuracy than that in the QB. The differences in the three metrics indicate that regional performance is dependent on metrics. For the QTP as a whole, 95% of the lakes show a CC > 0.8, and the percentage is 75% for the NSE. Moreover, 85% of the lakes achieve satisfactory accuracy with an RMSE of less than 0.1 m. It is worth noting that the comparisons are conducted for the evaluation of SWOT-like lake products that have undergone large-scale spatial integration to eliminate pixel cloud errors. We tested changes in SWOT performances for lakes with different surface areas using three metrics, as illustrated in figures 4(c), (f) and (i). The SWOT accuracy generally decreases with the drop in lake surface area from 4839 km2 (i.e. the Qinghai Lake) to 1 km2. Indeed, the fitted exponential regression between CC/NSE and lake size reaches a 99% confidence level (p < 0.01), indicating the significant influence of water surface areas on SWOT accuracy. This behavior might be explained by the decrease in random error from the enhancement of SWOT pixel clouds over the lake surface.

Figure 4. (a), (d) and (g) Spatial distribution of CC (upper panel), NSE (middle panel), and RMSE (lower panel) between synthetic water level and SWOT-like WSE during 2000–2018 versus water surface area for lakes in the QTP and their changes over longitude and latitude. (b), (e) and (f) Cumulative density function curves of CC (upper panel), NSE (middle panel), and RMSE (lower panel) between synthetic water level and SWOT-like WSE during 2000–2018 for 783 l over the QTP and its four subregions. (c), (f) and (i) Scatter plots of CC (upper panel), NSE (middle panel), and RMSE (lower panel) between synthetic water level and SWOT-like WSE during 2000–2018 versus surface area of lakes over the QTP and its four subregions. The lake area is logarithmized for better presentation.
Download figure:
Standard image High-resolution image
4. Discussion
Despite the great anticipation for the potential of SWOT to monitor lake water level changes in the QTP, there are still some limitations associated with the simplification of the configuration setting and errors in the SWOT of the SWOT simulator. They jointly lead to discrepancies between the SWOT-like WSE and actual SWOT observations. The most significant uncertainty stems from the incomplete representation of real SWOT errors, including the topographic layover and the vegetation effects (Elmer et al 2020). The layover phenomenon generally occurs in steep surroundings such as cliffs and high mountains where the local slopes are greater than the incidence angles of SWOT, ranging from 0.6°–4° (Fjortoft et al 2014, Chevalier et al 2018). Another physical measurement issue of misclassification between the water body and surrounding land and processing issue of an idealized phase unwrapping can also lead to some disparate performances. Please see further details of such misclassifications and unwrapping and their probable influences on our results in text 1 of section 5 of the supplementary data). Apart from the simplified SWOT errors, the simplified model configurations of the SWOT simulator also contribute to the discrepancies between the modeling results and true satellite measurements, especially for those related to the dark water effect and systematic errors, such as tropospheric and cross-over errors. The geoidal model that is used to convert the SWOT measurements into geoidal heights can also contain uncertainty and lead to the accuracy degradation of the lake product over the QTP (Li et al 2018). Despite these inherent limitations and uncertainties, the current lake level monitoring assessment to investigate the capability of the future SWOT satellite in such a large spatial (∼2500 000 km2) and temporal (∼20 years) scale, especially for the QTP where densely-distributed lakes have experienced significant changes over decades due to climate change, provide a blueprint for both short-term hydrological extremes (for example, dike breaks and flash floods) and plausible long-term climatic changes (for example, increasing precipitation and ice melt). The beginning of the SWOT mission will encourage researchers to study hydrological issues based on high-quality surface water data from space for a multitude of applications in environmental science and allied disciplines as a reflection of the ecological and hydrological status of lake systems, as introduced in detail in text 2 of section 5 of the supplementary data. Different influential factors, such as repeat times and lake shape, will be detected in future work when actual SWOT data of sufficient length is available.
5. Conclusions
Timely assessment of the potential of lake level monitoring in the early stage of the SWOT mission is essential for the QTP where lakes with the highest altitude, greatest amounts, and areas are located and sensitive to climate change, which is especially true given the sparse ground observations and limited spatiotemporal coverage of current satellites. In this study, SWOT-like WSE is generated for 38 ml in the QTP during 2000–2018 using the CNES large-scale SWOT hydrology simulator in combination with the satellite-based water mask and reference height. The comparisons between the reference height and corresponding SWOT-like WSE are subsequently performed in various aspects (for example, CC, NSE, RMSE, and time series components). In addition, the synthetic monthly water level series for 783 l during 2000–2018 is constructed to derive the SWOT-like WSE series for full investigation of the spatial and temporal characteristics of the potential SWOT performance.
The optical altimetry products are generally consistent with SWOT-like WSE for the 38 ml according to various statistical metrics. Moreover, SWOT-like WSE illustrates the satisfactory ability to observe different components of lake level dynamics, including the mean, trend, annual amplitude, and annual phase,while a relatively poorer monitoring ability for semi-annual amplitude and semi-annual phase is discovered due to the abrupt changes in water level caused by the extreme events in the Salt Lake and Zhuonai Lake.
For the SWOT-like lake product that averaged from numerous pixels, a total of 95% of the 783 l show CC > 0.8, and the percentage is 75% for the NSE (>0.8) compared with the reference height. Moreover, 85% of the lakes achieve satisfactory accuracy with an RMSE less than 0.1 m. Spatially, relatively higher accuracy is shown over lakes in the STP and NTP, outperforming those in the SSR and QB. Furthermore, the metrics generally decrease along with the increase of lake area, meaning an apparent influence of lake size on SWOT performance.
The launch of the SWOT satellite is expected to provide a preferable tool for assessing both the long-term trends and short-term variations for the numerous lakes over the QTP and other regions globally, offering valuable information to water resource managers for monitoring extreme events, detection of regional and global climate change, and regional water security from a new perspective. The comprehensive evaluation of the lake level monitoring ability of the SWOT mission is essential for the application and understanding of real SWOT data soon, especially on such large temporal and spatial scales.
Acknowledgments
This study was financially supported by the National Key Research and Development Project of China (2021YFC3200303) and the National Natural Science Foundation of China (U20A20317). The numerical calculations in this paper have been done on the supercomputing system in the Supercomputing Center of Wuhan University. S W was supported by the French AMANECER-MOPGA project funded by ANR and IRD (ref. ANR-18-MPGA-0008).
Data availability statement
The CNES Large Scale Level 2 h Pixel Cloud Simulator can be freely assessed online (https://github.com/CNES/swot-hydrology-toolbox (accessed 10 March 2023)). The water mask data are available online (https://data.tpdc.accn/zh-hans/data/7fee8675-d4ab-4f97-8bbf-269e20b7ac16/). The optical altimetry data can be freely accessed online (https://doi.org/10.1594/PANGAEA.898411 (accessed 10 March 2023)).
The data cannot be made publicly available upon publication because no suitable repository exists for hosting data in this field of study. The data that support the findings of this study are available upon reasonable request from the authors.
Supplementary data (1.8 MB PDF)