 Omar Gutierrez-Cori1*
 Jhan Carlo Espinoza2
 Laurent Z. X. Li1
 Sly Wongchuig2
 Paola A. Arias3
 Josyane Ronchail4
 Hans Segura2
- 1Laboratoire de Météorologie Dynamique, LMD-IPSL, Sorbonne Université, CNRS, Paris, France
- 2Univ. Grenoble Alpes, IRD, CNRS, Grenoble INP, Institut des Géosciences de l'Environnement (IGE, UMR 5001), Grenoble, France
- 3Grupo de Ingeniería y Gestión Ambiental (GIGA), Escuela Ambiental, Facultad de Ingeniería, Universidad de Antioquia, Medellín, Colombia
- 4Laboratoire d'Océanographie et du Climat, LOCEAN-IPSL, Sorbonne Université, IRD, CNRS, MNHN, Paris, France
The southern Amazonia is undergoing a major biophysical transition, involving changes in land use and regional climate. This study provides new insights on the relationship between hydroclimatic variables and vegetation conditions in the upper Madeira Basin (~1 × 10⁶ km2). Vegetative dynamics are characterised using the normalized difference vegetation index (NDVI) while hydroclimatic variability is analysed using satellite-based precipitation, observed river discharge, satellite measurements of terrestrial water storage (TWS) and downward shortwave radiation (DSR). We show that the vegetation in this region varies from energy-limited to water-limited throughout the year. During the peak of the wet season (January-February), rainfall, discharge and TWS are negatively correlated with NDVI in February-April (r = −0.48 to −0.65; p < 0.05). In addition, DSR is positively correlated with NDVI (r = 0.47–0.54; p < 0.05), suggesting that the vegetation is mainly energy-limited during this period. Outside this period, these correlations are positive for rainfall, discharge and TWS (r = 0.55–0.88; p < 0.05), and negative for DSR (r = −0.47 to −0.54; p < 0.05), suggesting that vegetation depends mainly on water availability, particularly during the vegetation dry season (VDS; late June to late October). Accordantly, the total rainfall during the dry season explains around 80% of the VDS NDVI interannual variance. Considering the predominant land cover types, differences in the hydroclimate-NDVI relationship are observed. Evergreen forests (531,350 km2) remain energy-limited during the beginning of the dry season, but they become water-limited at the end of the VDS. In savannas and flooded savannas (162,850 km2), water dependence occurs months before the onset of the VDS. These differences are more evident during extreme drought years (2007, 2010, and 2011), where regional impacts on NDVI were stronger in savannas and flooded savannas (55% of the entire surface of savannas) than in evergreen forests (40%). A spatial analysis reveals that two specific areas do not show significant hydroclimatic-NDVI correlations during the dry season: (i) the eastern flank of the Andes, characterised by very wet conditions, therefore the vegetation is not water-limited, and (ii) recent deforested areas (~42,500 km2) that break the natural response in the hydroclimate-vegetation system. These findings are particularly relevant given the increasing rates of deforestation in this region.
Introduction
The southern Amazon Basin is currently under a process of biophysical transition, involving deforestation and changes in rainfall regime (Aragão et al., 2008; Costa and Pires, 2010; Nobre et al., 2016; Debortoli et al., 2017; Wright et al., 2017; Leite-Filho et al., 2019; Lovejoy and Nobre, 2019; Brando et al., 2020; Ruiz-Vásquez et al., 2020). Studies suggest that a large-scale transition from forest to savanna of almost the entire southern and eastern Amazon may take place in the upcoming decades (e.g., Nobre et al., 2016; Lovejoy and Nobre, 2019; Parsons, 2020). At the extreme southwestern Amazon, the upper Madeira Basin (Figure 1A; ~1 × 10⁶ km2), delimited up to the Porto Velho hydrological station, extends into Bolivia, Peru and Brazil in ~73, 11, and 16% of the basin, respectively (Molina-Carpio et al., 2017). This basin is characterised by wide and complex geomorphology, where the altitude range varies from 50 (in the Amazon plains) to more than 6,000 m.a.s.l (in the Andes). In addition, the Llanos de Mojos, one of the largest floodplains in South America, covers an area of 150,000 km2 (Figure 1A) (Hamilton et al., 2004; Ovando et al., 2016; Aires et al., 2017; Parrens et al., 2019).

Figure 1. (A) Hydrographic network of the upper Madeira Basin delimited up to the Porto Velho hydrological station (black triangle; 8.75°S, 63.92°W). The topography (100—4,000 m.a.s.l), floodplain region, main cities, and countries are indicated. The topography and the hydrographic network were computed using SRTM at 90 m of resolution. The floodplain region was delimited using the GIEMS-D3 product. (B) 1981–2019 annual average precipitation (in mm day−1) estimated from CHIRPS precipitation data (0.05° × 0.05° spatial resolution). (C) 2001–2019 annual average NDVI calculated from the MOD13C1 product (0.05° × 0.05° spatial resolution) of the MODIS sensor.
Precipitation in the upper Madeira Basin is characterised by great spatial variability with annual average values of 5 mm day−1 and low annual rainfall values (<2 mm day−1) over the Andes (Figure 1B). The transition region of the Andes and the Amazon is one of the rainiest areas in the world, due to interactions between large-scale atmospheric circulation and topography (Killeen et al., 2007; Bookhagen and Strecker, 2008; Espinoza et al., 2015), producing rains of more than 18 mm day−1 in the so-called “rainfall hotspots” during almost the whole year (Espinoza et al., 2009, 2015). Rainfall over the basin also shows a strong seasonality, with a dry period in austral winter (June to August) and a wet period during austral summer (December-March), mainly associated with the onset of the South America Monsoon System (SAMS; e.g., Vera et al., 2006; Marengo et al., 2010). The hydrological regime of the Madeira Basin is strongly associated with the rainfall regime, with a period of high water between March and May, and a marked period of low water between August and October (Molina-Carpio et al., 2017). The estimated mean annual discharge value at the Porto Velho station is 18,500 m3/s (Molina-Carpio et al., 2017; Espinoza et al., 2019b). In the southern Brazilian Amazon, previous studies have documented the seasonal cycle of vegetation dynamics by normalised difference vegetation index (NDVI). In this region, NDVI shows higher values between April-June and lower values in August-September (Maeda et al., 2016). The annual cycle of NDVI is also related to downward shortwave radiation (DSR) associated with the annual cycle of convection over this region (Horel et al., 1989). In recent years, several metrics based on the representation of the seasonal variations of the vegetation have been used to describe the seasonal cycle of greenness and to define the vegetation dry season (VDS; Buitenwerf et al., 2015; Wu et al., 2017; Piao et al., 2019, 2020). It seemed interesting to apply these indices to the Upper Madeira basin where they have not yet been used.
For most of the southern Amazon Basin, an increase of dry season length has been reported in several studies (Marengo et al., 2011; Fu et al., 2013; Arias et al., 2015; Debortoli et al., 2015; Correa et al., 2021), which is associated with enhanced atmospheric subsidence as part of the intensification of the regional Hadley cell (Arias et al., 2015; Agudelo et al., 2019; Espinoza et al., 2019a; Leite-Filho et al., 2019). Changes in the hydro-climatic regime are particular intense in the upper Madeira Basin that shows significant annual rainfall decrease (Supplementary Figure 1), runoff, and runoff coefficient (Wongchuig et al., 2017; Espinoza et al., 2019b), as well as in terrestrial water storage (TWS; Frappart et al., 2013). In addition, extreme droughts have also been reported to be more frequent and more severe in the southern Amazon (Marengo and Espinoza, 2016). Extreme droughts struck during 2005 and 2010 (Marengo et al., 2008, 2011; Zeng et al., 2008; Espinoza et al., 2011), and also in 2007 and 2011 in the southwest of the basin (Caioni et al., 2020). In the central Amazon and in the Arc of deforestation zone (mostly in the southern Brazilian Amazon), Arias et al. (2020) documented that warm conditions in the tropical north Atlantic Ocean and in the Caribbean Sea are related to low rainfall and NDVI values over these regions, in association with changes in the regional atmospheric circulation and atmospheric moisture transport. As a consequence, prolonged dry season and extreme drought events cause tree mortality in the central and southern Amazonia (Aragão et al., 2007, 2018; Phillips et al., 2009; Asner and Alencar, 2010; Lewis et al., 2011; Xu et al., 2011; Brando et al., 2014; Silva et al., 2018). For example, the 2010 drought has been recognised as the most severe and extensive in recent years, causing forest loss of up to 3.2 million km2 (Lewis et al., 2011).
These studies have been conducted mainly in the Brazilian Amazon, while the relationship between hydroclimate variability (including TWS) and vegetation conditions remains poorly documented in the western and southwestern Amazonia, such as the upper Madeira Basin. In the western Amazon, it has been identified that a fragile hydrological equilibrium can be broken by repeated drought events, producing persistent changes in the rainforest canopy structure (Maeda et al., 2015; Espinoza et al., 2016). Beyond droughts and climatic conditions, the combination of a few other factors such as deforestation and widespread use of fire could also lead to irreversible loss of the Amazon rainforest biodiversity (Aragão et al., 2008; Lovejoy and Nobre, 2019; Brando et al., 2020). Under such a context, in recent years, uncertainties and debates have persisted in the scientific community. A fundamental question is whether the Amazon forests are energy-limited or water-limited for their growing and maintenance, and if a greater greening in the Amazon vegetation is a response to dry episodes (Saleska et al., 2007; Asner and Alencar, 2010; Samanta et al., 2010; Morton et al., 2014; Bertani et al., 2017). This is expected since it is a complex region and under a process of biophysical transition (Davidson et al., 2012), where the response to hydroclimatic factors is modulated by the biotic component and depends on the land cover type, the phenology, and the biophysical properties of the vegetation (Maeda et al., 2015).
Motivated by the above-mentioned questions and challenges, the current study aims to analyse the relationship between multiple hydroclimatic variables and vegetation conditions in the upper Madeira Basin during the period 2000–2019. Hydroclimatic variability is represented by satellite-based precipitation, observed river discharge and satellite measurements of TWS and vegetation dynamics is depicted by NDVI. This goal is particularly relevant for the upper Madeira basin because this region is highly sensitive to current hydroclimatic changes, characterised by extreme droughts episodes during the last decades (Molina-Carpio et al., 2017; Espinoza et al., 2019a,b). This study has three main objectives: (i) Our first objective is to understand how hydroclimate-NDVI relationship varies throughout the year, considering the predominant land cover types in the basin. (ii) Our second objective is to analyse the hydroclimate-NDVI relationship during the dry season, when the vegetation is most vulnerable (water-deficit stress), and provide information about the impacts of extreme drought years. (iii) Finally, our third objective is dedicated to analyse the impacts of the land cover changes (e.g., deforestation) on the natural relationship between vegetation and hydroclimatic variability.
Materials and Methods
Land Cover Types, NDVI Dataset, and Deforestation Map
To characterise the vegetation conditions in the upper Madeira Basin, we use the NDVI (Figure 1C), an indicator of canopy structure and proxy of photosynthetic activity that effectively records the seasonal and interannual cycle of the vegetation (Huete et al., 2002; Didan et al., 2015; Zhao et al., 2018). In this study, we use NDVI values from the MOD13C1 product. This information is provided by the Moderate Resolution Imaging Spectroradiometer (MODIS, available at https://lpdaac.usgs.gov/). The MOD13C1 is a higher-level product available since 2000 and derived from the spatial average (cloud-free pixels) of the MOD13A2 product (1 km), composed of 16 days, and projected into the geographic Climate Modeling Grid. According to the level of processing, MODIS products are divided into 5 categories (0 to 4; Mas, 2011). The MOD13C1 product has reached a level-3 validation (Didan et al., 2015). Level-3 products are derived from geophysical variables and considered value-added products. To guarantee a high-quality product, in some cases they are resampled at 0.05° of spatial resolution and they are composed at a temporal resolution of up to 1, 8, 16, and 30 days (Mas, 2011).
In addition, the MOD13C1 product provides the Quality Assurance (QA) band containing the description of the data quality per pixel. For this research, given that the study region includes areas with large amounts of precipitation, the pixels with cloudiness were removed using the QA band. The Savitzky-Golay filter was also used to reduce noise and rebuild the NDVI time series. The utility of the NDVI has been largely evaluated in the Amazon Basin (Huete et al., 2002; Xu et al., 2011; Hilker et al., 2014, 2015; Maeda et al., 2016; Zhao et al., 2017; Arias et al., 2020), including the western Amazon (Espinoza et al., 2016; Gerard et al., 2020).
To characterise and differentiate the land cover types in the study area, we use the MCD12C1 (Terra and Aqua) product. The MCD12C1 product provides annual data on global land cover at 0.05° spatial resolution. The product offers different classification systems for land cover types. In this research, we select the classification scheme of the International Geosphere-Biosphere Program (IGBP; Sulla-Menashe and Friedl, 2018).
The products MOD13C1 and MCD12C1 correspond to the last data collection (C6). This collection incorporates several improvements in algorithms and calibration settings. In addition, sensor degradation is corrected, making C6 MODIS products more accurate than previous versions (Didan et al., 2015; Heck et al., 2019). The NDVI of the MOD13C1 product is analysed during the period 2000–2019 for the vegetation of the Amazon rainforest for regions below 1,000 m.a.s.l, values of NDVI up in the Andes were not analysed. For land cover from the MCD12C1 product, all available information is analysed (2001–2018).
Additionally, we use land use maps to identify deforested areas and analyse spatio-temporal changes in land cover due to anthropic activities. The yearly land use maps are developed and provided by the Climate Change Initiative (CCI) of the European Space Agency (ESA) for the 1992–2018 period (available at http://maps.elie.ucl.ac.be/CCI/viewer/download.php). Deforestation estimates are based on the methodology proposed by Hansen et al. (2013), where the forest loss is defined as the stand-replacement disturbance of tree cover canopy (complete removal of tree cover canopy at each pixel). Therefore, the forest loss value is assigned for each pixel relative to the 1st year (1992) of the land cover map. We use the already provided dataset classification of each pixel to determine whether it corresponds to forest or non-forest cover.
Precipitation Datasets
We use daily satellite precipitation estimates from two data sources: the Climate Hazard group Infrared Precipitation with Stations (CHIRPS; Funk et al., 2015) data, and the Integrated Multi-satellitE Retrievals for the Global Precipitation Measurement (GPM-IMERG; Huffman et al., 2019a,b; Huffman et al., 2020). CHIRPS uses global cold cloud duration (as a primary source) to calculate global precipitation. It is calibrated with the Tropical Rainfall Measuring Mission (TRMM) 3B42 product and information from the global rain gauge network, resulting in a rainfall dataset with high spatial resolution and temporal coverage (from 1981 at 0.05° horizontal resolution). This has allowed studies related to precipitation variability in the complex topography of the southwestern Amazon Basin as well as the characterisation of extreme events through the use of hydrological models (e.g., Wongchuig et al., 2017; Espinoza et al., 2019a,b; Cavalcante et al., 2020).
The GPM-IMERG is a multi-satellite product that combines observations from multiple space sensors to provide the best precipitation estimates (Tan et al., 2017; Huffman et al., 2019a). The GPM-IMERG is part of the Global Precipitation Measurement (GPM), which is an international satellite mission designed to set a new standard for measuring rainfall from space and provide a new generation of global observations (Hou et al., 2014; Tan et al., 2019). The algorithm of GPM-IMERG aims to produce rainfall estimates every 30 min with a spatial resolution of 0.1° between latitudes 60° (version 5) and global (version 6), using all estimates of passive microwave precipitation (PMW), together with the infrared (IR) estimates available in the TRMM and GPM era (Huffman et al., 2019a,b; Huffman et al., 2020). The GPM-IMERG has been successfully used in the Amazon Basin (Oliveira et al., 2018; Althoff et al., 2020; da S. Freitas et al., 2020).
Considering the versions of the algorithms used by GPM-IMERG, the IMERG version 6 performs modifications to the satellite intercalibrations, in addition to the inclusion of additional sensors (TRMM), and unlike version 5 (information from March 2014), provides information from June 2000 to the present (soon to be from January 1998) through retrospective processing (Huffman et al., 2019a, 2020; Tan et al., 2019). Three types of products are currently available: early, late, and final, with a latency of 4 h, 12–14 h, and 3.5 months, respectively. The early product is useful for real-time monitoring applications while the final execution (late product) is an investigation-level product (Huffman et al., 2019a,b).
In this research, we use the latest version of CHIRPS (CHIRPS V2.0; available at http://chg.geog.ucsb.edu/data/chirps/) from 1981 to 2018 for the analysis of climatologies, and from 2000 to 2019 for the interannual variability. We also use the latest daily precipitation product GPM-IMERG V06 (L3) for the period 2000–2019 (available at https://daac.gsfc.nasa.gov/).
Downward Shortwave Radiation
We use the Downward Shortwave Radiation (DSR) from the CRU-JRA dataset, as an indicator of energy that reaches the land surface. It is derived from the Climatic Research Unit (CRU) TS3.1 monthly data (Harris et al., 2014) and from the Japanese 55-year Reanalysis data (JRA-55) from the Japan Meteorological Agency (Kobayashi et al., 2015), covering the 1901–2019 period. CRU-JRA comprises 6-h global climate data at 0.5° spatial resolution, providing observation-based temperature, precipitation, and incoming surface radiation (Harris, 2020). In this study, we used the CRU-JRA V2.1 dataset, for the 2000–2019 period (pre-processed and adapted by V. Bastrikov, LSCE, July 2020). This dataset is available at http://data.ceda.ac.uk/.
River Discharge and Terrestrial Water Storage
Discharge data for the Madeira River are available at the Porto Velho hydrological station (Figure 1A). The Bolivian National Meteorology and Hydrology Service (Servicio Nacional de Meteorología e Hidrología - SENAMHI) and the Brazilian Water National Office (Agencia Nacional de Águas - ANA) provide time series of daily river discharge. The quality control of the information and the calculation of discharge is carried out by the SO-HYBAM observatory (for more details, see Molina-Carpio et al., 2017). The historical series have missing data in June and July 2011; thus, missing values were completed with historical hydrological mean values (1967–2018). Because of the period of availability of NDVI data, the analysis of river discharge is made for the period 2000–2018.
The equivalent water thickness estimated by the data from the Gravity Recovery and Climate Experimental (GRACE) gravimetry from space mission (Tapley et al., 2004), is used as a proxy to the terrestrial water storage (TWS) in the upper Madeira Basin. The GRACE mission was launched in March 2002 to provide estimates of total terrestrial water storage using two low-altitude coplanar satellites through measurements of the space-time variations of the Earth's gravitational field (Tapley et al., 2004; Swenson et al., 2008; Becker et al., 2011). In this study, we use the average GRACE estimates post-processed by different research centers: the Jet Propulsion Laboratory (JPL), the University of Texas Center for Space Research (CSR), and the GeoForschungsZentrum (GFZ) Potsdam. Due to the lack of continuity of the data at the monthly time-scale, TWS is analysed for the period 2003–2015. GRACE data has been extensively analysed and validated in the Amazon Basin (Becker et al., 2011; Frappart et al., 2012, 2013; de Paiva et al., 2013; Chaudhari et al., 2019; Espinoza et al., 2019b; Moreira et al., 2019; Arias et al., 2020).
The Vegetation Dry Season From NDVI Dataset
In recent years, several metrics of land-surface phenology have been developed to depict the seasonal cycle of greenness in vegetation using indices derived from satellite observations (Buitenwerf et al., 2015). These are based on the representation of the seasonal variations of the vegetation to identify the start (SOS) and the end (EOS) of the growing season (Piao et al., 2019, 2020). To characterise the seasonality and identify the Vegetation Dry Season (VDS) in the study region, we define SOS and EOS from the NDVI time series. A threshold or inflection point approach is applied (Piao et al., 2006, 2019; Wu et al., 2017), defined as:
where NDVI(t) is the NDVI at time t, with time steps of 16 days. NDVImax and NDVImin are the maximum and minimum seasonal values, respectively.
The SOS is defined as the date when NDVI ratio reaches a threshold of 0.5 and the previous (next) time step exhibits a value above (below) this threshold. The EOS is calculated as the date when NDVI ratio is equal to 0.5 and the previous (next) time step exhibit values below (above) this threshold. The period defined between EOS and SOS represents the VDS (Figure 2A). Equation 1 is used to determine SOS and EOS in the predominant land cover types described below.
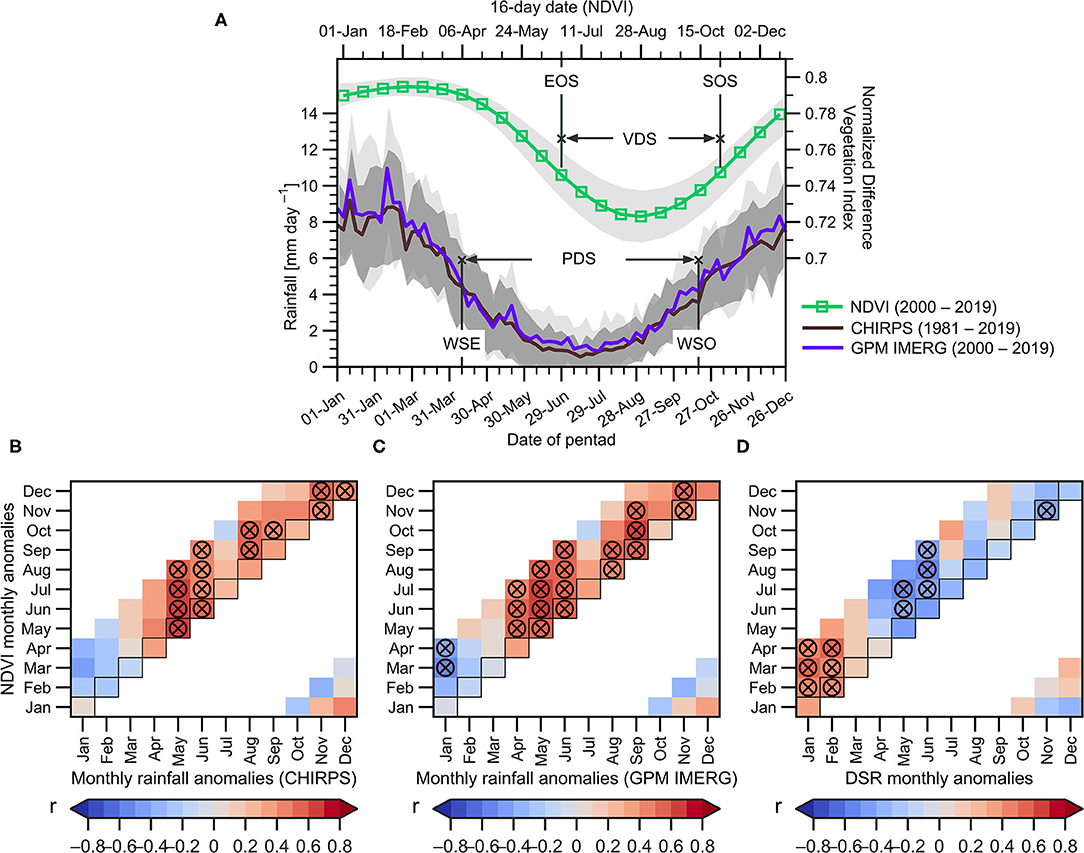
Figure 2. (A) Mean annual cycle of NDVI (in 16-day time steps) averaged over the upper Madeira Basin (below 1,000 m.a.s.l, green line) for the 2000–2019 period, and the mean rainfall annual cycle (in pentads) averaged over the upper Madeira Basin estimated from CHIRPS (1981–2019, brown line) and GPM-IMERG (2000–2019, blue line) datasets. The mean dates of the wet season end (WSE) and onset (WSO), and the dry season period (PDS) are indicated. For the vegetation, the mean dates of the growing season end (EOS) and start (SOS), and the dry season period (VDS) are also indicated. For all cases, the standard deviation is indicated in shades. 2000–2019 monthly lagged correlations between NDVI anomalies averaged over the upper Madeira Basin (below 1,000 m.a.s.l) and: precipitation anomalies from (B) CHIRPS and (C) GPM-IMERG datasets, and (D) Downward Shortwave Radiation (DSR) anomalies. In (B–D), the horizontal axis indicates the month correspondent to the average precipitation and DSR anomalies, while the vertical axis indicates the lag of response of the NDVI. Circles marked with the X symbol indicate significant correlations (p < 0.05). Not computed correlation coefficients are shown in white colour.
To characterise the NDVI seasonality and identify the VDS in the most predominant vegetation types, we use the MCD12C1 product and calculate the mode of the 18-years record period (2001–2018) to define the extent of land cover types in the study region (section Rainfall, DSR and NDVI Relationship by Land Cover Type). It has been determined that evergreen forests are the most predominant land cover type (62% of the upper Madeira Basin below of the 1,000 m.a.s.l) and savannas as the second (19% of the upper Madeira Basin below of the 1,000 m.a.s.l). The product Global Inundation Extent from Multi-Satellites (GIEMS-D3) is used to determine the surface of the Llanos de Mojos floodplain. The GIEMS-D3 dataset is a high spatial resolution product to 3 arc-seconds (90 m) that provides information on flooded pixels from 1993 to 2007 on a monthly basis (Aires et al., 2017). The flooded water extent is estimated based on the occurrence of 5-year floodplain, which describes an event or area subject to 20% probability of a certain size flood occurring in any given year (Figure 1A). Accordingly, the flooded area map is used to estimate the areas that intersect the savanna biome (42%). Therefore, this region is defined as the flooded savannas.
The Precipitation Dry Season
The daily precipitation from the CHIRPS and GPM- IMERG datasets averaged in the upper Madeira Basin are used to determine the Precipitation Dry Season (PDS). To do this, it is necessary to identify the onset (WSO) and the end (WSE) of the wet season. The onset and end of the wet season are defined as that threshold of the rain rate with persistence over time (Li and Fu, 2004; Arias et al., 2015). However, the use of daily rainfall estimates to determine WSO and WSE is limited due to the high-frequency variability of the daily time series, which is mainly associated with synoptic factors (Li and Fu, 2004; Fu et al., 2013), making it difficult to define a threshold and ensure persistence over time. To reduce the high variability of the precipitation series, daily values are temporarily averaged over five-day periods (pentads). Therefore, the WSO is defined as the pentad (of the 73 pentads in each year) where the rainfall rate is above the climate average for 7 consecutive pentads. Similarly, the WSE is defined as the pentad where the rainfall rate is below the climate average for 7 consecutive pentads. The average period between WSE and the WSO is defined as the PDS (Figure 2A). This methodology has been widely used in previous studies in the Amazon region (Marengo et al., 2001; Li and Fu, 2004; Fu et al., 2013; Arias et al., 2015; Correa et al., 2021).
Statistical Analysis of Time Series in Hydroclimate-Vegetation Relationships
To evaluate the response of vegetation conditions to hydroclimatic variables a linear correlation analysis is computed. In addition, a lagged correlation analysis is performed to evaluate the possible memory effect of vegetation response to hydroclimatic variability in previous months. A temporal lag from zero (rainfall at t + 0 and NDVI at t + 0) to 3 months (rainfall at t + 0 and NDVI at t + 3) is considered to evaluate the response of the NDVI to precipitation. Furthermore, the interannual variations of monthly rainfall anomalies and the basin-average NDVI are analysed. This analysis is also conducted differentiating the predominant land cover types in the region of study.
To evaluate the sensitivity of vegetation to dry conditions, the rainfall-vegetation relationship during the VDS is analysed. Two rainfall metrics have been used for this purpose: the total amount of precipitation and the minimum rainfall concentrations based on the Dry Day Frequency (DDF). DDF is defined as the number of days with rainfall <1mm (Espinoza et al., 2019a), and the rainfall amount is defined as the accumulated rainfall during the PDS. In addition, a spatial correlation analysis is performed between the amounts of rainfall averaged in the basin (i.e., a time series) during the PDS and the NDVI (spatially distributed) during the VDS, in order to identify areas of higher or lower sensitivity to rainfall.
Similarly, the relationship between the NDVI and the anomalies of river discharge and TWS are analysed using a lagged correlation analysis to evaluate the possible memory effect. To evaluate the sensitivity of vegetation to water in the soil, a spatial correlation analysis is also performed between the TWS averaged over the basin (i.e., a time series) and the NDVI (spatially distributed) during the VDS. Finally, a map of deforestation areas in recent years is used to evaluate the possible spatial-temporal impacts of anthropogenic activity on hydroclimate-vegetation systems.
Results and Discussions
Seasonal and Interannual Relationships Between Rainfall and NDVI
The onset and the demise of the SAMS in the upper Madeira Basin, and averaged over the 2000–2019 period, are estimated at October 17th and April 10th, respectively. Consequently, the climatological dry season (or precipitation dry season - PDS) in this region covers a time span of 6 months and 7 days (from April 10th to October 17th). Both rainfall datasets (CHIRPS and GPM-IMERG) show similar dates defining the WSE and WSO in the upper Madeira Basin (Figure 2A).
The basin average NDVI (<1,000 m.a.s.l) also shows a clear seasonality, with a lag of around 2 months with respect to the rainfall regime (green line in Figure 2A). The maximum NDVI values are observed in March, when the wet (and cloudy) season begins to decline, which can be attributed to the wet soil conditions and an increase in solar radiation related to the retreat of the SAMS during March (Horel et al., 1989). The lowest NDVI values are observed during the August-to-September season, around 2 months after the lowest rainfall (Figure 2A). Following the methodology described in section The Vegetation Dry Season From NDVI Dataset, we define the 2000–2019 averaged EOS (SOS) on June 25th (October 31st). Consequently, the mean vegetation dry season (VDS) corresponds to the period between EOS and SOS (4 months and 16 days).
In the same way, lagged correlation between monthly DSR anomalies and monthly NDVI anomalies shows that during the peak of the wet season (January and February), rainfall is negatively correlated with NDVI in the March-April season. During this same period (characterised by a strong convective activity and the frequent presence of clouds), the correlations with DSR are positive, which means that high values of DSR (days with clear sky conditions) are associated with positive NDVI anomalies. This suggests that, during the wet season, vegetation growing depends mainly on the availability of energy rather than water (Figures 2B–D). However, during the PDS (particularly during April to September), rainfall (DSR) is positively (negatively) correlated with NDVI with a lag ranging from zero to 3 months. These results mean that, in contrast to the wet period, the vegetation of the upper Madeira Basin during the VDS mostly depends on water rather than energy. This is a remarkable issue due to a shift from energy- to water-limited conditions could eventually promote persistent changes in forests canopy structure in this region (Maeda et al., 2015).
Considering that the rainfall-NDVI relationship is stronger during the dry season (Figures 2B,C), the next analyses are focussed on the interannual variability of the NDVI during the VDS and rainfall during the PDS. Because the CHIRPS and GPM-IMERG datasets show similar results, the following results are based on the GPM-IMERG data while results using CHIRPS are shown in the Supplementary Material.
The relationship between NDVI anomalies during the VDS and the total rainfall amount (Figure 3A) and DDF (Figure 3B) during the PDS shows significant positive and negative correlations, respectively. The lowest NDVI values are observed during extreme drought years already documented in the Madeira Basin, such as 2007, 2010, and 2011 (Molina-Carpio et al., 2017; Espinoza et al., 2019b; Caioni et al., 2020). However, the year 2005 (also reported as an extreme hydrological drought in Amazonia) is not characterised by negative rainfall anomalies during the PDS nor by low NDVI values (anomalies are near to zero in Figures 3A,B). These results suggest that drought conditions in the upper Madeira basin were related to rainfall deficit during the 2005 austral summer and autumn. In addition, the drier conditions during the PDS in 2010 are also notable, which strongly impacted the NDVI anomalies, as reported in previous studies (Arias et al., 2020). These results show that the total rainfall amount during the PDS is an adequate indicator of the NDVI conditions of the VDS, explaining more than 80% of the NDVI interannual variance of the mean NDVI in the upper Madeira Basin (r = 0.9; Figure 3A), while the DDF explains around 65% of the NDVI variance (r = −0.8; Figure 3B). Both results suggest that water availability during the PDS is a major limitation to vegetation activity during the VDS. This is also observed when considering CHIRPS precipitation dataset (Supplementary Figure 2).
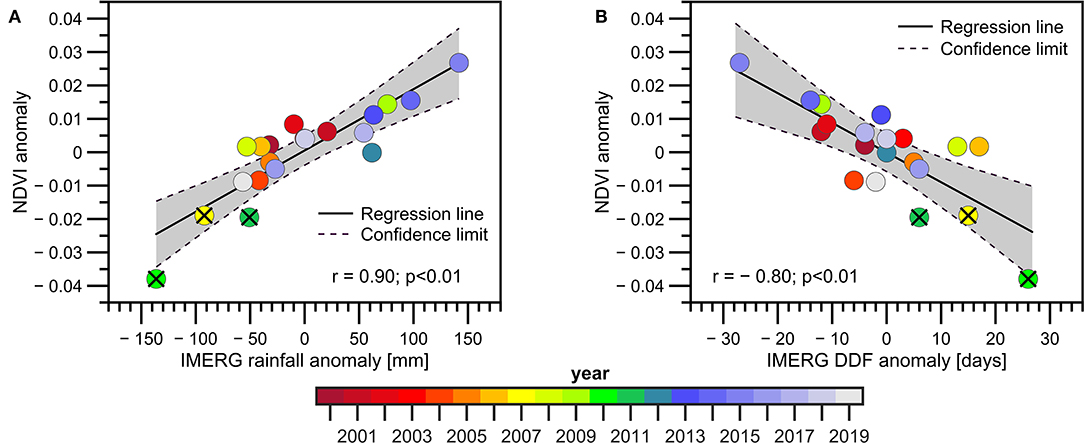
Figure 3. Scatter plots between NDVI anomalies during the Vegetation Dry Season (VDS) for the 2000–2019 period and: (A) precipitation anomalies and (B) the Dry Day Frequency (DDF) during the Precipitation Dry Season (PDS) in the upper Madeira Basin. Precipitation and DDF anomalies are estimated using GPM-IMERG data. NDVI anomalies are calculated below the 1,000 m.a.s.l. The corresponding years, the regression line, the confidence interval (95%), the correlation coefficients and the p-value are indicated in (A,B). The extreme drought years (2007, 2010, and 2011) are indicated with the X symbol.
Rainfall, DSR and NDVI Relationship by Land Cover Type
The land cover types in the upper Madeira Basin are shown in Figure 4A for the period 2001–2018. Considering the basin below 1,000 m.a.s.l, Figure 4B shows that 62% of the basin surface corresponds to evergreen forests (531,350 km2) while 19% of the basin corresponds to savannas (162,850 km2). The basin also includes a vast floodplain, the Llanos de Mojos (Guyot et al., 1996; Ovando et al., 2016; Parrens et al., 2019), which extends mainly over evergreen forests and savannas (Figures 4A,B). The evergreen forests represent the most predominant land cover type followed by savannas, both covering more than 80% of the basin. In addition, the alluvial plain extends over a large part of the savannas, covering around 50% of the surface. This makes it possible to differentiate a third predominant land cover type in the study region, denominated here as flooded savannas (Figures 4A,B). In the next section, we will discuss the seasonal cycle of NDVI in these three dominant land cover types.
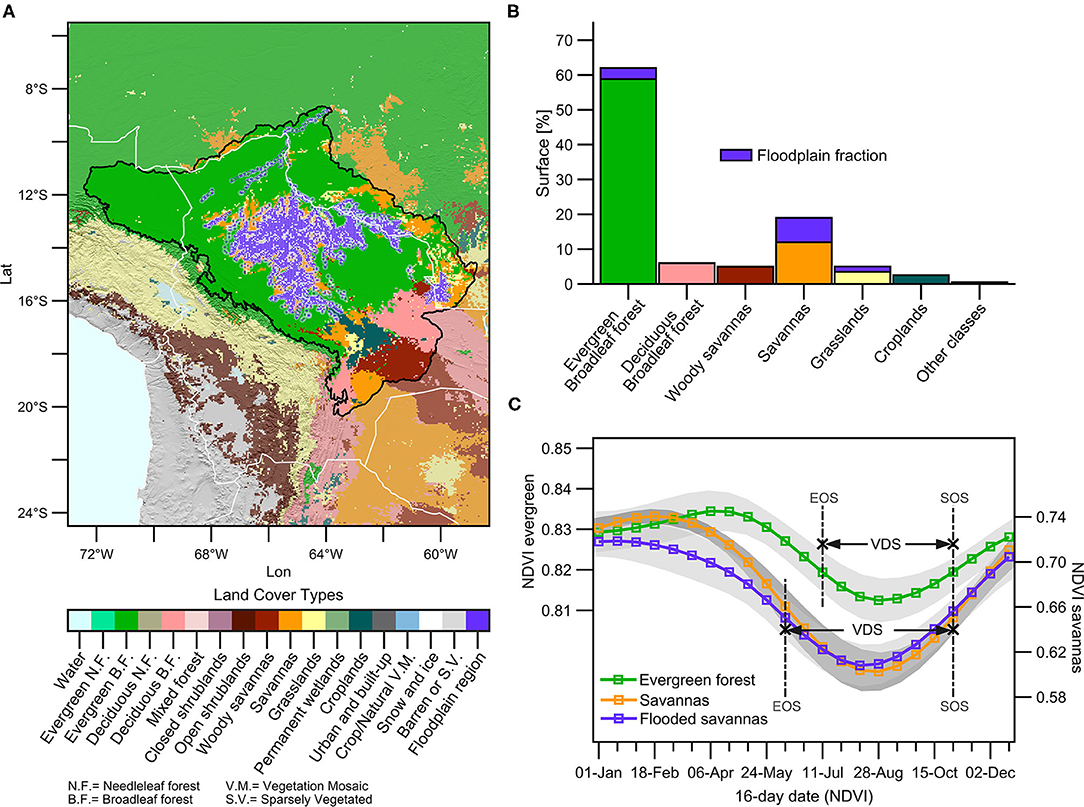
Figure 4. (A) Spatial distribution of land cover types (IGBP classification), estimated from the MCD12C1 product over the upper Madeira Basin. The purple shades indicate the flooded areas, and the black line indicates the limit of the basin below 1,000 m.a.s.l, respectively. (B) Percentage of the surface of the upper Madeira Basin below 1,000 m.a.s.l that is covered by the land cover types considered. The percentage of the flooded area in each cover type is indicated in purple. (C) Mean NDVI annual cycle (lines) and its standard deviation (shades) of the predominant land cover types over the upper Madeira Basin below 1,000 m.a.s.l. The mean dates of the growing season end (EOS) and start (SOS), and the dry season period (VDS) for each predominant cover type is indicated.
Figure 4C shows the seasonal cycle of NDVI for the three predominant land cover types: evergreen forests, savannas and flooded savannas. According to the VDS definition, the land cover types show the same SOS date, corresponding to October 31st. However, the EOS occurs later in the year over the evergreen forests (July 11th) than over savannas and flooded savannas (June 9th). In savannas and flooded savannas, the lowest NDVI values are observed in August, while the lowest NDVI values in evergreen forests are delayed by around 1 month and they are observed in September. These results can be attributed to larger access of forest to soil moisture from a deeper soil layer (Kim et al., 2012) and also a greater capacity of the evergreen forests to maintain evapotranspiration during the VDS (e.g., Nepstad et al., 1994). The highest values of NDVI in savannas are observed during the core of the wet season (January to March), with lower values in the flooded savanna (probably related to the different physiological and morphological characteristics in the vegetation of this region). However, the NDVI peak in evergreen forests is observed after the rainy season, particularly during April and May (Figure 4C). This is probably due to the fact that the evergreen forests are mostly energy-limited, and the NDVI peaks in the wet-to-dry transition season, when the rainy/cloudy season declines (Supplementary Figure 3).
The lagged correlation between monthly NDVI anomalies vs. monthly rainfall and monthly DSR in the predominant land cover types is evaluated (Figure 5). The results are similar to those shown in Figures 2C,D, where negative (positive) correlations between rainfall (DSR) anomalies appear from January to April, confirming that evergreen forests are mainly energy-limited during this period (Figures 5A,D). However, positive correlations between rainfall and NDVI anomalies in evergreen forests appear later, at the end of the VDS (mainly from August to November; Figure 5A). These results indicate that evergreen forests are less sensitive to dry conditions, particularly during the onset of the VDS, probably due to the fact that, in general, they have deeper root systems, which allows them to capture water and remain green during the dry season (e.g., Markewitz et al., 2010). By contrast, in savannas and flooded savannas, the positive correlation between rainfall and NDVI is higher before the onset of the VDS (April to July) and these correlations are still significant until the wet season onset (Figures 5B,C).
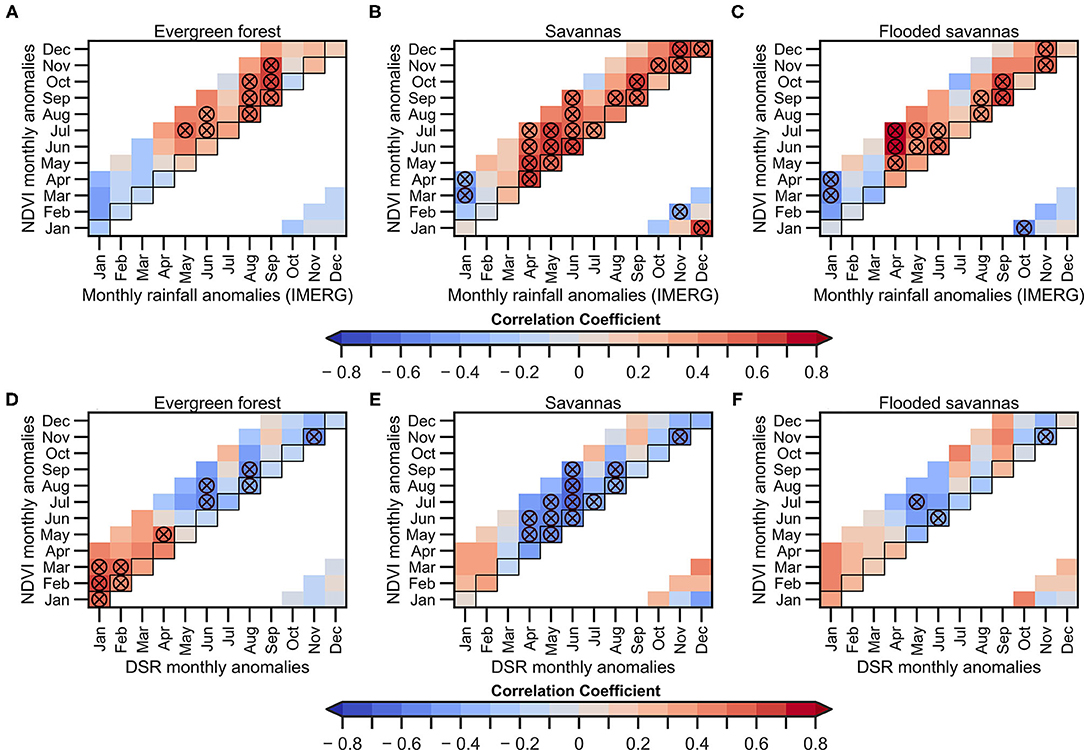
Figure 5. 2000–2019 monthly lagged correlations between NDVI anomalies for the three predominant land cover types over the upper Madeira Basin and: precipitation anomalies (A–C) and DSR (D–F). For evergreen forests (A,D), savannas (B,E), and flooded savannas (C,F). Precipitation anomalies are estimated using GPM-IMERG data. NDVI anomalies of the predominant land cover types are calculated below the 1,000 m.a.s.l. The horizontal axis indicates the month correspondent to the average precipitation and DSR anomalies, while the vertical axis indicates the lag of response of the NDVI. Circles marked with the X symbol indicate significant correlations (p < 0.05). Not computed correlation coefficients are shown in white colour.
Negative (positive) correlations are observed during the core of the wet season between rainfall (DSR) and NDVI. Correlations are particularly high in January (for both rainfall and DSR) and from February to April in the NDVI (Figures 5E,F). During this season higher correlations are observed between DSR and NDVI in the evergreen forests (r > 0.7, p < 0.05; Figure 5D). These results can be explained because the high DSR values are related to cloud-free conditions and lack of precipitation.
The interannual relationship between the NDVI anomalies for each land cover type during the VDS, and the rainfall amount and the DDF during the PDS are computed in Figures 6A–F, respectively. Rainfall variability explains better the variability of the NDVI during the VDS in savannas (r = 0.88) and flooded savannas (r = 0.81) than in evergreen forests (r = 0.74). As shown in Figure 3, the total rainfall amount better explains the NDVI variability in the whole area of study than does the DDF in savannas and flooded savannas. However, in evergreen forests, DDF is slightly better correlated with NDVI than rainfall (Figures 6A,D). This result suggests that evergreen forest is mostly impacted by rainfall distribution during the PDS than rainfall amount, as observed in the Peruvian Amazon (Espinoza et al., 2016). It is also remarkable that extreme dry years (particularly 2010) show stronger impacts on NDVI in savannas and flooded savannas (NDVI anomaly reaches −0.05 and −0.06, respectively), while this is less significant in evergreen forests (NDVI anomaly around −0.02; Figure 6). These results are coherent with a lower sensitivity of evergreen forests to dry conditions than savannas and flooded savannas. In terms of impacted surface during extreme dry years, up to 40% (55%) of the surface in evergreen forests (savannas) shows negative NDVI anomalies higher than one standard deviation (Supplementary Figure 4). Analysing the resilience of each land cover type to drought conditions remains a key topic as future climate projections show an increase in the dry season length in southern Amazonia (Fu et al., 2013; Boisier et al., 2015; Parsons, 2020; Sena and Magnusdottir, 2020). Field-based observations of the interactions between forest and savanna root depth and hydroclimate conditions are necessary in order to a further comprehension of the resilience of land cover types to droughts in the upper Madeira Basin. Even within each forest cover type, there is a variety of species that may eventually behave differently (Esquivel-Muelbert et al., 2019); however, this is beyond the scope of this research.
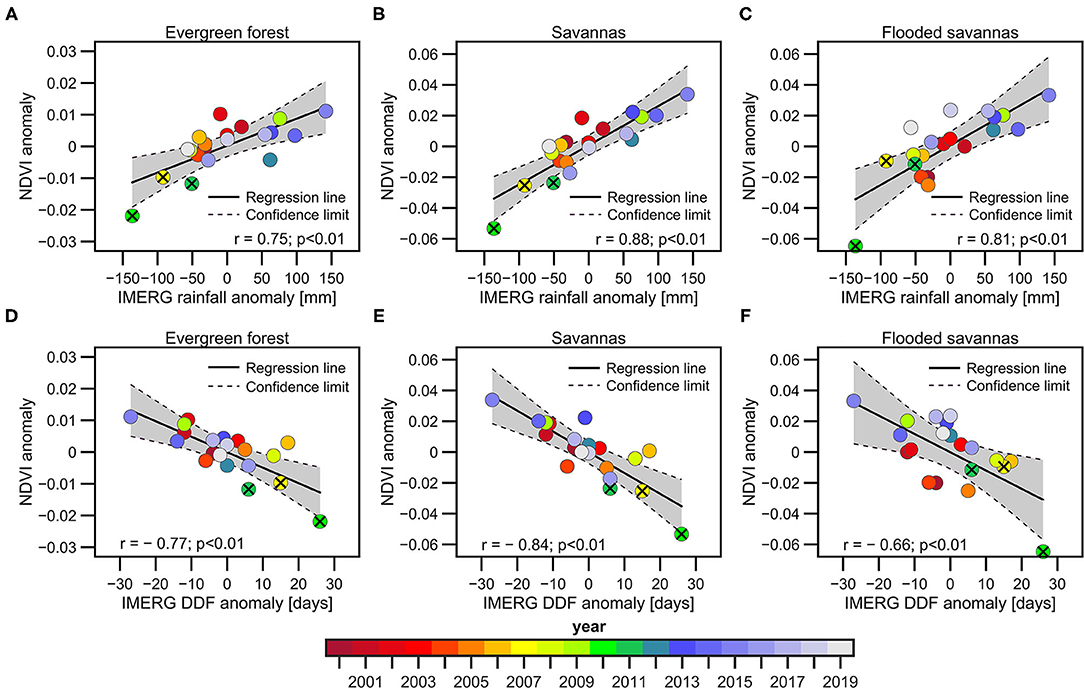
Figure 6. Scatter plots between NDVI anomalies for the three predominant land cover types during the VDS in the 2000–2019 period and: precipitation anomalies (A–C) and the DDF (D–F) during the PDS in the upper Madeira Basin. Precipitation and DDF anomalies are estimated using GPM-IMERG data. NDVI anomalies for each predominant cover type [evergreen forests in (A,D), savannas in (B,E), flooded savannas in (C,F) panels] are calculated below the 1,000 m.a.s.l. The corresponding years, the regression line, the confidence interval (95%), the correlation coefficients and the p-value are indicated in panels (A–F). The extreme drought years (2007, 2010, and 2011) are indicated with the X symbol.
Spatial Patterns of Rainfall-NDVI Relationships and the Role of Land-Use/Land-Cover Change
According to Figure 6, the rainfall-NDVI relationship shows differences depending on the land cover type. In this section, we provide a more detailed analysis on the spatial patterns of rainfall-NDVI relationships in the upper Madeira Basin. Figure 7A shows the linear correlation coefficient between average rainfall in the upper Madeira Basin during the PDS (a single timeseries) and NDVI anomalies in each grid point during the VDS. 58% of the evergreen forest area shows significant correlations (p < 0.05) between rainfall and NDVI. This percentage is higher in savannas and flooded savannas, where significant correlations are observed in 71% and 74% of the respective areas (Figure 7B). In all three land cover types, significant correlations vary from 0.48 to 0.90.
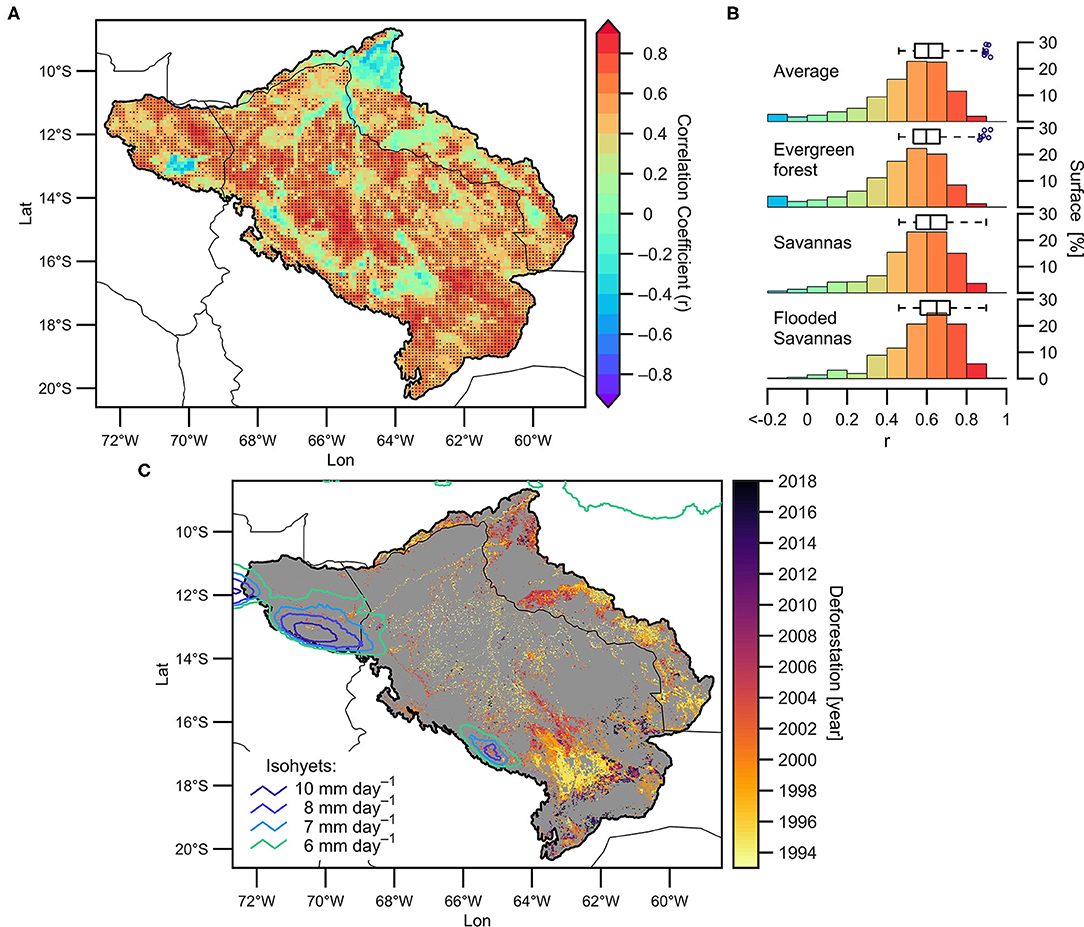
Figure 7. (A) 2000–2019 spatial correlation (0.05° spatial resolution) between precipitation averaged over the upper Madeira Basin during the PDS and NDVI anomalies in each grid point during the VDS (p < 0.05 are displayed with a dark dot). (B) Bars represent the surface (in percentage) in different correlation ranges for the basin average and for each predominant cover type. Boxplots indicate significant correlation ranges (p < 0.05) computed in (A). (C) Map of deforestation (at 300 m spatial resolution; colors indicate the year of deforestation between 1993 and 2018 period) and annual average precipitation (lines, in mm day−1 for the 1981–2019 period). Only isohyets above 6 mm day−1 are shown. Grey shades indicate regions that have not been deforested during the 1993–2018 period.
The low correlation values are remarkable in two main regions: (i) along a northwest-southeast band on the eastern flank of the Andes from the upper Madre de Dios Basin to the upper Mamoré basins, and ii) the lowest part of the basin (near the Porto Velho hydrological station and around the confluence of the Mamoré and Beni rivers) and along the Brazilian-Bolivian border of the Guaporé and Beni basins (Figure 7A). The eastern flank of the Andes is a region characterised by very wet conditions throughout the year (also called a “rainfall hotspot” region; Figure 1B), where the Andean orography modulates the local atmospheric circulation, producing forced convection and abundant rainfall throughout the year (e.g., Espinoza et al., 2015; Junquas et al., 2018). Figure 7C shows the isohyets for 6 to 10 mm day−1 in order to identify the “rainfall hotspots.” Due to the extreme wet conditions, vegetation is not in water-limited conditions in this region and, consequently, low correlations between rainfall and NDVI are expected. Figure 7C also shows the temporal evolution of the deforestation rate in the upper Madeira Basin for the period 1992–2018 (see section Materials and Methods for methods). It is remarkable that the period 1993–2001 accumulates the largest deforested area. Zones of recent deforestation (after 2000) predominate in the downstream part of the basin (near the hydrological station of Porto Velho and around the confluence of the Mamoré and Beni rivers) and along the border between Brazil and Bolivia in the Guaporé and Beni basins (Figure 7C). These regions clearly coincide with the regions where no significant correlation coefficients between rainfall and NDVI are detected in Figure 7A. These results show that the lack of correlation between rainfall and the NDVI could be mainly related with two factors: (i) the occurrence of extreme rainfall amounts in the “rainfall hotspot” regions (where vegetation is not water-limited) and (ii) the recent anthropogenic intervention, derived in deforestation, observed in the region, which breaks the natural response of the NDVI to rainfall during the period 2000–2019. It is also interesting to note that in the southern Bolivian Amazon, a large deforested region is observed throughout the period 1993–2018 (yellow to black shades in Figure 7C). Over the recently deforested area (mainly after 2008, dark red in Figure 7C), low rainfall-NDVI correlations appear, while over the regions deforested before 2000, the correlation is significant (note that the deforested area observed before 2000 coincide with savannas and croplands in Figure 4A).
Hydrological Variables and NDVI Relationship
Figure 8 shows the lagged correlation between the monthly river discharge at Porto Velho and the monthly NDVI anomalies averaged in the upper Madeira Basin (<1,000 m.a.s.l; Figure 8A) and the NDVI anomalies computed on the predominant land cover types (Figures 8B–D). In this case, river discharge, which is directly measured at Porto Velho station, is used as an indicator of the wet condition over the basin that provide additional information than only remote sensed rainfall values, due to integration of hydrological processes. Figure 9 shows a similar analysis, but considering the average TWS in the upper Madeira Basin instead of the river discharge. The NDVI anomalies are positively correlated with both hydrological variables during the VDS, as shown using rainfall, but in this case, the significant positive correlations appear 1–2 months later than rainfall (starting in May-June instead of April), and higher correlations are observed during the peak of the dry season (July-September for hydrological variables and July-August for NDVI). As observed using the average rainfall in the basin, the NDVI-discharge/TWS correlations are lower and delayed by around 1 month in the evergreen forests, and higher positive values are observed at the end of the VDS (Figures 8B, 9B). On evergreen forests, the TWS seems to be a better indicator of the NDVI variability compared to the discharge variability at Porto Velho station. As mentioned above, this is probably due to the fact that evergreen forests maintain evapotranspiration during the dry season by absorbing water from deeper soil (more than 8 m; Nepstad et al., 1994), which is better represented by the TWS than by river discharge. Over the savannas and flooded savannas (Figures 8C,D), the discharge variability from June to December is significantly associated with the NDVI variability, considering a time lag of around t-2 to t+2 months. The negative lag is explained by the characteristic rainfall-runoff time of response in the upper Madeira Basin, estimated to be about 60 days at the Porto Velho station (Espinoza et al., 2019b; Armijos et al., 2020).
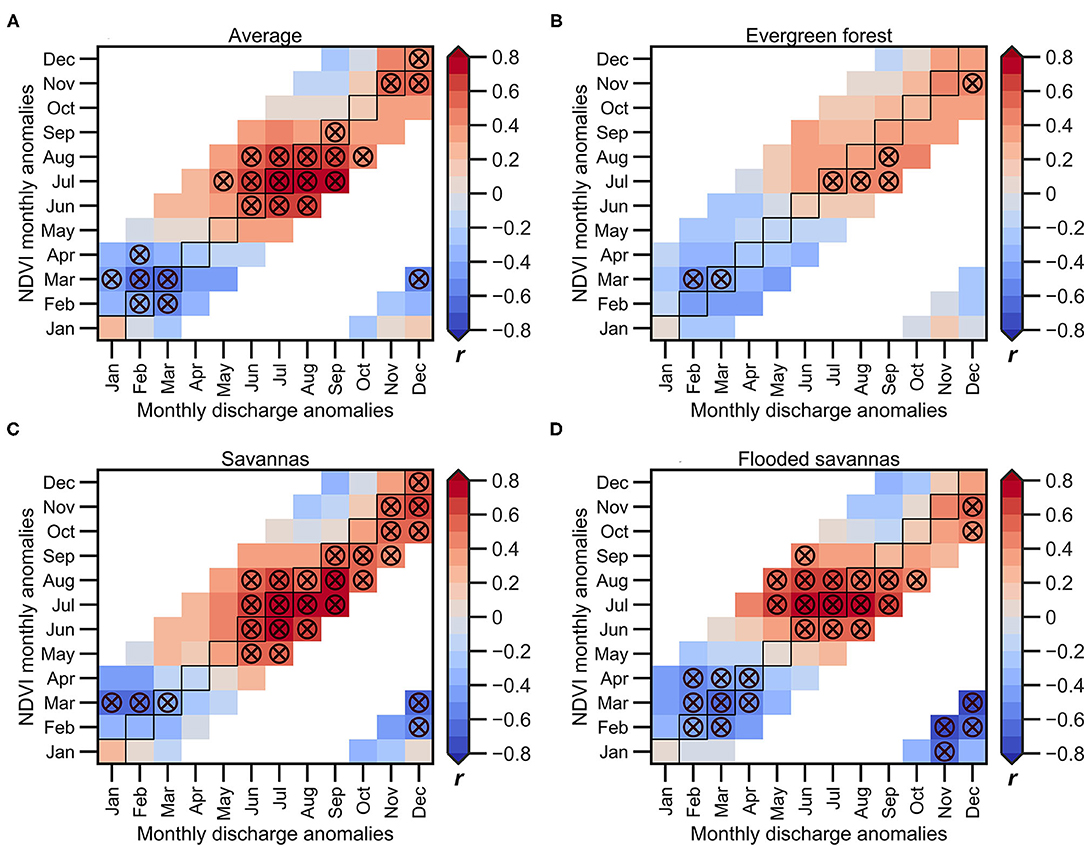
Figure 8. 2000–2018 monthly lagged correlations between river discharge measured at the Porto Velho hydrological station, and NDVI anomalies averaged over the upper Madeira Basin for each predominant land cover types: (A) entire basin, (B) evergreen forests, (C) savannas, and (D) flooded savannas. The NDVI anomalies of the predominant land cover types are calculated below the 1,000 m.a.s.l. The horizontal axis indicates the month corresponding to the river discharge anomaly, while the vertical axis indicates the lag of response of the NDVI. Circles marked with the X symbol indicate significant correlations (p < 0.05). Not computed correlation coefficients are shown in white colour.
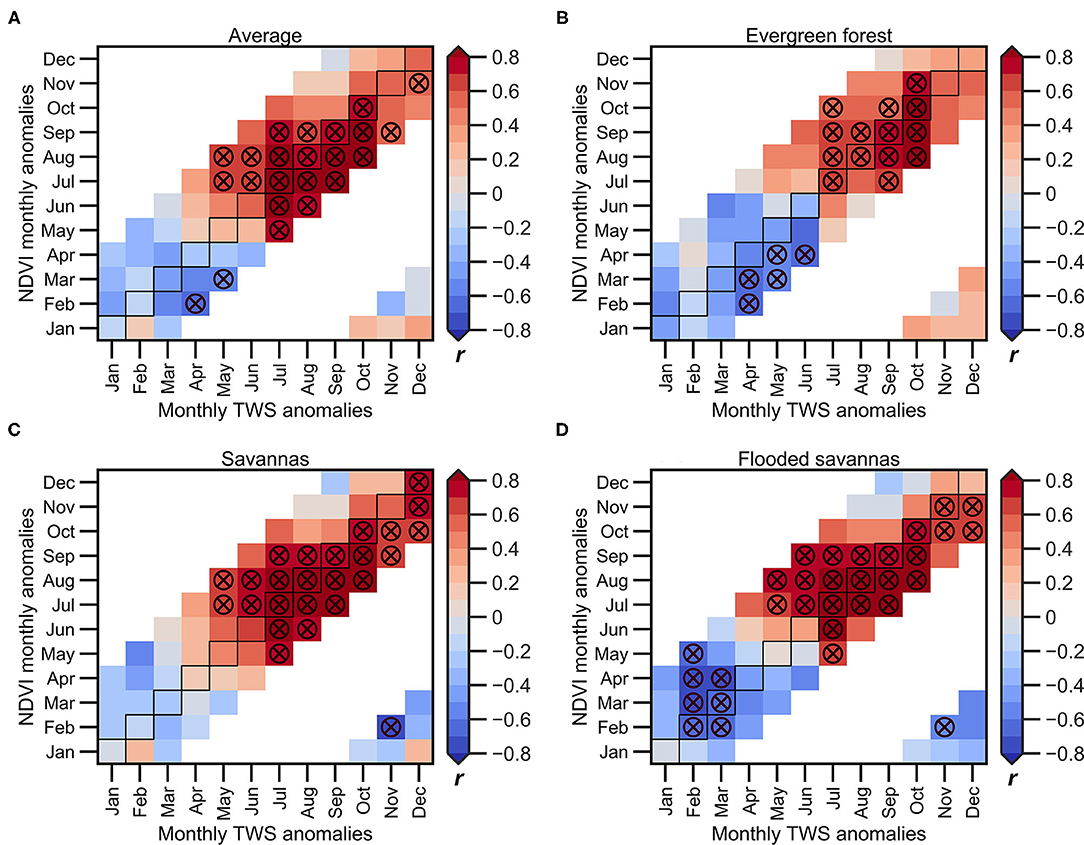
Figure 9. 2003–2015 monthly lagged correlations between TWS and NDVI anomalies averaged over the upper Madeira Basin for each predominant land cover types: (A) entire basin, (B) evergreen forests, (C) savannas, and (D) flooded savannas. The NDVI anomalies of the predominant land cover types are calculated below the 1,000 m.a.s.l. The horizontal axis indicates the month corresponding to the TWS anomalies, while the vertical axis indicates the month of response of the NDVI. Circles marked with the X symbol indicate significant correlations (p < 0.05). Not computed correlation coefficients are shown in white colour.
The negative correlations are predominant during the November-March season for the hydrological variables and February-April for the NDVI anomalies (Figures 8, 9). These correlations are higher in flooded savannas (Figures 8D, 9D), which is to be expected due to the nature of this land cover type that experiences floods during the high-water period (January-March).
These results are in accordance with Figures 3, 6 and suggest that the vegetation in the basin is mainly energy-limited during the core of the wet season and primarily water-limited during the May to December period, which corresponds to the dry and the beginning of the wet season. However, the evergreen forests become water-limited near the end of the VDS. In addition, the NDVI on evergreen forests shows higher correlations with the TWS than other hydroclimatic variables such as rainfall or river discharge, which can be explained because this land cover type can capture water in deeper soil during the dry season. Here again, these results are explained by the deeper root system that characterises the evergreen forests (Fan et al., 2017) and its ability to absorb water from the soil at depths of more than 8 m during the dry season (Nepstad et al., 1994; Markewitz et al., 2010).
The average TWS in the basin during the July-October (JASO) season satisfactorily explains the NDVI variability during the VDS in the three predominant land cover types. On the interannual time scale and for the period 2003–2015, the JASO TWS explains 58% (r = 0.76) of the variability of the NDVI during the VDS in evergreen forests, 83% (r = 0.91) in savannas, and 74% (r = 0.86) in flooded savannas (Figures 10A,C). The lowest TWS anomalies correspond to years of extreme drought, including 2005 (orange circle in Figures 10A–C). These results suggest that the impacts of the 2005 drought in the upper Madeira Basin are perceptible in the TWS but not in the rainfall (Figure 6) or the NDVI (except in the flooded savannas, where negative NDVI anomalies are observed during 2005; Figure 10C).
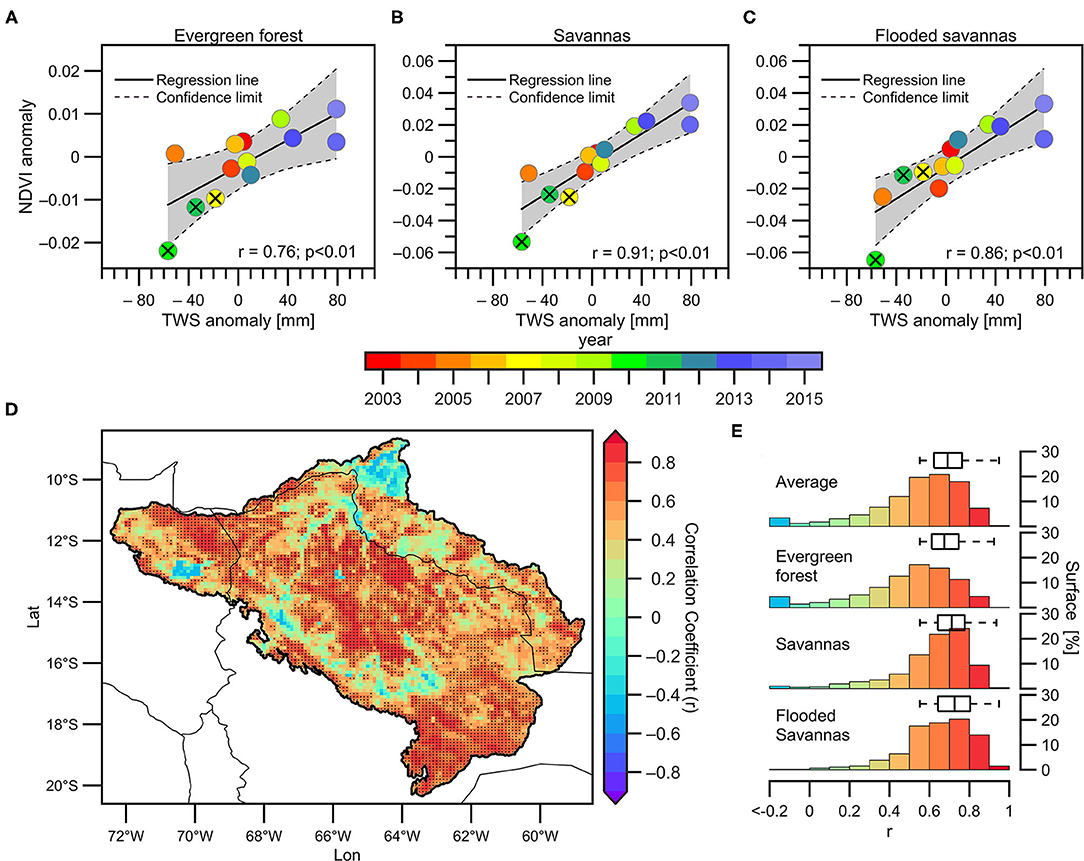
Figure 10. (A–C) Scatterplots between TWS anomalies averaged over the basin (during the JASO season) and average NDVI (during the VDS) in (A) evergreen forests, (B) savannas, and (C) flooded savannas. The corresponding years, the regression line, the confidence interval (95%), the correlation coefficients and the p-value are indicated. (D) 2003–2015 spatial correlation (0.05° spatial resolution) between TWS anomalies averaged over the upper Madeira Basin (during the JASO season) and NDVI anomalies in each grid point (during the VDS). The dark dots indicate significant correlations (p < 0.05). (E) Bars represent the surface (in percentage) in different correlation ranges for the basin average and for each predominant cover type. Boxplots indicate significant correlation ranges (p < 0.05) computed in (D).
A detailed analysis of the spatial patterns of the relationships between the JASO TWS and the VDS NDVI in the upper Madeira Basin is presented in Figure 10D. The spatial pattern is very close to that observed in Figure 7A, but higher correlations are found using the TWS. As can be seen in Figure 7, non-significant correlations predominate in recently deforested areas and along the eastern flank of the Andes (over the “rainfall hotspot” regions). In addition, Figure 10D shows low correlations on the river bank along the lower Mamoré, Beni and Madre de Dios rivers. Around 55% of the total basin surface is characterised by significant correlations (p < 0.05) between JASO TWS and VDS NDVI, and this surface is smaller (larger) in evergreen forests (savannas and flooded savannas), covering 48% (±70%) of the total surface characterised by this land cover type.
While the influence of hydro-climatic variables on NDVI conditions is analysed in this section, it is important to note that changes in land cover type can also modify rainfall patterns, regional hydrological cycle and atmospheric circulation (Marengo et al., 2018; Ruiz-Vásquez et al., 2020). Therefore, the complex factors that control the interactions between land surface changes and atmospheric circulation is a major issue that need to be addressed in order to evaluate the future evolution of the hydrological cycle in this region. Coupled atmosphere-biosphere models are particularly attractive to achieve this issue (Krinner et al., 2005; Quillet et al., 2010; Murray et al., 2013). However, data availability and computational requirements may remain major limitations. Finally, the use of remote sensed hydroclimatic variables (precipitation, DSR, TWS) appears as a useful tool for the monitoring of vegetation conditions, including potential impacts of extreme droughts, in the upper Madeira basin. In addition, the use of field data (such as observed river discharge) can allow us to evaluate uncertainties of remote sensed hydroclimatic variables (e.g., rainfall) through the use of hydrological models (e.g., Beck et al., 2017; Wongchuig et al., 2017). In this sense, incorporate observed data from vegetation dynamics and soil moisture is acutely necessary in order to evaluate uncertainties in vegetation indices such as NDVI and land-use changes. Incorporate the use of new generation geostationary satellites could help reduce these uncertainties and improve understanding of seasonality and vegetation dynamics in the tropical forests, which remains a challenge (Hashimoto et al., 2021).
Conclusions and Final Remarks
The southern Amazonia is undergoing a process of biophysical transition, mainly related to climate change and deforestation. Recent studies suggest that a large-scale “savannization” of almost the entire southern and eastern Amazonia, including the Madeira Basin, may take place in the upcoming decades (e.g., Nobre et al., 2016). In such a context, this study provides a comprehensive analysis of the relationship between hydroclimatic variables and vegetation conditions in the upper Madeira Basin, located in the southwestern Amazon Basin, over the last 20 years (2000–2019). These relationships are analysed considering: (i) seasonal and interannual hydroclimate variations, including extreme drought years, (ii) the predominant land cover types, and (iii) the observed land use changes over the basin.
The relationship between hydroclimatic variables (rainfall, river discharge and terrestrial water storage -TWS), downward shortwave radiation (DSR) and NDVI, show that, throughout the year, the vegetation in the upper Madeira Basin varies from being energy- to water-limited. During the peak of the wet season, the vegetation growth depends mainly on the availability of energy rather than water. Outside this season, and during most of the year, NDVI is positively correlated with the rainfall with a delay that varies from 0–3 months, suggesting that the vegetation of the upper Madeira Basin depends mainly on water instead of energy. During the dry season, and particularly during the extreme drought years (2007, 2010, and 2011), evergreen forests are less sensitive than savannas and flooded savannas. For instance, the impact of the 2010 drought in the vegetation of the upper Madeira Basin was stronger in savannas (76% of the total area of savannas characterised by negative NDVI anomalies) and in flooded savannas (80% of the area) than in evergreen forests (66% of the area). This difference may be explained by the relationship between TWS and NDVI in evergreen forests. Indeed, in this land cover type, the TWS seems to be a better indicator of the NDVI variability compared to the river discharge or rainfall variability. This is probably due to the fact that evergreen forests have a deeper root system that can extract water from deep soil, which is better represented by the TWS than other hydroclimatic variables.
These results encourage the use of remote sensed hydroclimate variables (precipitation, DSR, TWS) for the monitoring of vegetation conditions in the upper Madeira Basin, which is particularly important considering the increase in extreme droughts and the lengthening of the dry season observed in this region during the last decades. However, the use of field-based data (such as river discharge) is necessary in order to discuss possible uncertainties from remote sensed data (e.g., Beck et al., 2017; Wongchuig et al., 2017; Espinoza et al., 2019b). While the usefulness of remote sensed hydroclimatic variables has been widely assessed in previous studies in the Brazilian Amazon basin, few attentions have been provided to the western and southwestern Amazon, such as the upper Madeira basin (mainly over the Bolivian Amazon).
A spatial analysis of the hydroclimatic variables averaged over the basin and the NDVI at each grid point (0.1° horizontal resolution) distributed over the basin, highlights the predominance of positive correlations in most of the basin during the dry season, which is consistent with the water limitation that characterises vegetation during this season. However, no significant correlations are found in two main regions: (i) Hyper humid regions in the also called “rainfall hotspot” zone in the eastern flank of the Andes, and (ii) regions characterised by high rates of recent deforestation (mainly after 2000). These results suggest that recent deforestation breaks the natural response of the NDVI to hydroclimatic conditions during the period 2000–2019, which can be explained due to anthropogenic activity. These analyses provide new insights on the impacts of land cover changes on the natural relationship between vegetation and hydroclimatic variability, which is particularly relevant considering the increasing rates of deforestation over this region throughout recent years. Finally, in this study we analyse the potential impacts of hydroclimate variability on vegetation dynamics; however, local changes in vegetation can also modify rainfall patterns, atmospheric circulation and other components of the hydrological cycle (e.g., Debortoli et al., 2017; Leite-Filho et al., 2019; Ruiz-Vásquez et al., 2020). Therefore, a more detailed analysis of the land surface processes and their interaction with the regional hydrological cycle will be necessary in further researches, through the use of tools such as coupled climate and land surface models.
Data Availability Statement
The datasets generated for this study are available on request to the corresponding author.
Author Contributions
OGC and JCE contributed to the conceptualization, research design, and writing of the manuscript. LL, SW, PA, JR, and HS contributed to the analysis, discussion of the results, and in improving the manuscript. All authors contributed to this work and approved the submitted version.
Funding
This research has been supported by the French MOPGA program funded by Sorbonne Université, ANR and IRD (ref. MOPGA scholarship and ref. ANR-18-MPGA-0008, AMANECER Project). PA was supported by Universidad de Antioquia through the grant CODI PRG2017-16264 and Minciencias Program 1115-852-70719 (contract # 490-220).
Conflict of Interest
The authors declare that the research was conducted in the absence of any commercial or financial relationships that could be construed as a potential conflict of interest.
Acknowledgments
We wish to thank the following agencies/organisations for providing access to data: The developers of GPM-IMERG product, the Climate Hazards Group Infrared Precipitation for providing CHIRPS data (information available at http://chg.geog.ucsb.edu/data/chirps/), the GRACE mission (available at http://grace.jpl.nasa.gov), MODIS (available at https://lpdaac.usgs.gov/), The CRU-JRA (https://catalogue.ceda.ac.uk/), the SNO-HYBAM observatory for providing river discharge data (available at: http://www.ore-hybam.org), and the European Space Agency (ESA) Climate Change Initiative (CCI) and the Copernicus Climate Change Service (C3S) for providing the Global Land Cover maps (https://maps.elie.ucl.ac.be/CCI/viewer/).
Supplementary Material
The Supplementary Material for this article can be found online at: https://www.frontiersin.org/articles/10.3389/frwa.2021.648499/full#supplementary-material
Supplementary Figure 1. Spatial distribution of the 1981–2018 Kendall coefficient (τ) from CHIRPS annual rainfall in the Amazon basin. Significant annual rainfall decreases and increases are indicated in red and blue, respectively. Only significant trend values at p < 0.05 are displayed.
Supplementary Figure 2. Scatter plots between NDVI anomalies during the Vegetation Dry Season (VDS) for the 2000–2019 period and: (A) precipitation anomalies and (B) the Dry Day Frequency (DDF) during the Precipitation Dry Season (PDS) in the upper Madeira Basin. Precipitation and DDF anomalies are estimated using CHIRPS dataset. NDVI anomalies are calculated below the 1,000 m.a.s.l. The corresponding years, the regression line, the confidence interval (95%), the correlation coefficients, and the p-value are indicated in panels (A,B). The extreme drought years (2007, 2010, and 2011) are indicated with the X symbol.
Supplementary Figure 3. Annual cycle of precipitation, DSR and NDVI in the upper Madeira Basin. The NDVI is calculated below the 1,000 m.a.s.l, and for the predominant land cover types. The precipitation and DSR are displayed in monthly time-scale, and in 16-day time steps for NDVI.
Supplementary Figure 4. NDVI anomalies during the drought years of (A) 2007, (B) 2010, and (C) 2011. The anomalies are calculated for the VDS. The percentage of the area with negative anomalies below one standard deviation in the predominant land cover types is indicated.
References
Agudelo, J., Arias, P. A., Vieira, S. C., and Martínez, J. A. (2019). Influence of longer dry seasons in the Southern Amazon on patterns of water vapor transport over northern South America and the Caribbean. Clim. Dyn. 52, 2647–2665. doi: 10.1007/s00382-018-4285-1
Aires, F., Miolane, L., Prigent, C., Pham, B., Fluet-Chouinard, E., Lehner, B., et al. (2017). A global dynamic long-term inundation extent dataset at high spatial resolution derived through downscaling of satellite observations. J. Hydrometeorol. 18, 1305–1325. doi: 10.1175/JHM-D-16-0155.1
Althoff, D., Dias, S. H. B., Filgueiras, R., and Rodrigues, L. N. (2020). ETo-Brazil: a daily gridded reference evapotranspiration data set for Brazil (2000–2018). Water Resour. Res. 56, 1–16. doi: 10.1029/2020WR027562
Aragão, L. E. O. C., Anderson, L. O., Fonseca, M. G., Rosan, T. M., Vedovato, L. B., Wagner, F. H., et al. (2018). 21st Century drought-related fires counteract the decline of Amazon deforestation carbon emissions. Nat. Commun. 9, 1–12. doi: 10.1038/s41467-017-02771-y
Aragão, L. E. O. C., Malhi, Y., Barbier, N., Lima, A., Shimabukuro, Y., Anderson, L., et al. (2008). Interactions between rainfall, deforestation and fires during recent years in the Brazilian Amazonia. Philos. Trans. R. Soc. B Biol. Sci. 363, 1779–1785. doi: 10.1098/rstb.2007.0026
Aragão, L. E. O. C., Malhi, Y., Roman-Cuesta, R. M., Saatchi, S., Anderson, L. O., and Shimabukuro, Y. E. (2007). Spatial patterns and fire response of recent Amazonian droughts. Geophys. Res. Lett. 34, 1–5. doi: 10.1029/2006GL028946
Arias, P. A., Fu, R., Vera, C., and Rojas, M. (2015). A correlated shortening of the North and South American monsoon seasons in the past few decades. Clim. Dyn. 45, 3183–3203. doi: 10.1007/s00382-015-2533-1
Arias, P. A., Martínez, J. A., Mejía, J. D., Pazos, M. J., Espinoza, J. C., and Wongchuig-Correa, S. (2020). Changes in normalized difference vegetation index in the Orinoco and Amazon River Basins: Links to tropical atlantic surface temperatures. J. Clim. 33, 8537–8559. doi: 10.1175/JCLI-D-19-0696.1
Armijos, E., Crave, A., Espinoza, J. C., Filizola, N., Espinoza, R., Ayes, I., et al. (2020). Rainfall control on Amazon sediment flux: synthesis from 20 years of monitoring. Environ. Res. Commun. 2:51008. doi: 10.1088/2515-7620/ab9003
Asner, G. P., and Alencar, A. (2010). Drought impacts on the Amazon forest: the remote sensing perspective. New Phytol. 187, 569–578. doi: 10.1111/j.1469-8137.2010.03310.x
Beck, H. E., Vergopolan, N., Pan, M., Levizzani, V., van Dijk, A. I. J. M., Weedon, G. P., et al. (2017). Global-scale evaluation of 22 precipitation datasets using gauge observations and hydrological modeling. Hydrol. Earth Syst. Sci. 21, 6201–6217. doi: 10.5194/hess-21-6201-2017
Becker, M., Meyssignac, B., Xavier, L., Cazenave, A., Alkama, R., and Decharme, B. (2011). Past terrestrial water storage (1980-2008) in the Amazon Basin reconstructed from GRACE and in situ river gauging data. Hydrol. Earth Syst. Sci. 15, 533–546. doi: 10.5194/hess-15-533-2011
Bertani, G., Wagner, F. H., Anderson, L. O., and Aragão, L. E. O. C. (2017). Chlorophyll fluorescence data reveals climate-related photosynthesis seasonality in Amazonian forests. Remote Sens. 9:1275. doi: 10.3390/rs9121275
Boisier, J. P., Ciais, P., Ducharne, A., and Guimberteau, M. (2015). Projected strengthening of Amazonian dry season by constrained climate model simulations. Nat. Clim. Chang. 5, 656-660. doi: 10.1038/nclimate2658
Bookhagen, B., and Strecker, M. R. (2008). Orographic barriers, high-resolution TRMM rainfall, and relief variations along the eastern Andes. Geophys. Res. Lett. 35:L06403. doi: 10.1029/2007GL032011
Brando, P. M., Balch, J. K., Nepstad, D. C., Morton, D. C., Putz, F. E., Coe, M. T., et al. (2014). Abrupt increases in Amazonian tree mortality due to drought-fire interactions. Proc. Natl. Acad. Sci. U.S.A. 111, 6347–6352. doi: 10.1073/pnas.1305499111
Brando, P. M., Soares-Filho, B., Rodrigues, L., Assunção, A., Morton, D., Tuchschneider, D., et al. (2020). The gathering firestorm in southern Amazonia. Sci. Adv. 6, 1–10. doi: 10.1126/sciadv.aay1632
Buitenwerf, R., Rose, L., and Higgins, S. I. (2015). Three decades of multi-dimensional change in global leaf phenology. Nat. Clim. Chang. 5, 364–368. doi: 10.1038/nclimate2533
Caioni, C., Silvério, D. V., Macedo, M. N., Coe, M. T., and Brando, P. M. (2020). Droughts amplify differences between the energy balance components of Amazon forests and croplands. Remote Sens. 12:525. doi: 10.3390/rs12030525
Cavalcante, R. B. L., Ferreira, D. B., da, S., Pontes, P. R. M., Tedeschi, R. G., da Costa, C. P. W., et al. (2020). Evaluation of extreme rainfall indices from CHIRPS precipitation estimates over the Brazilian Amazonia. Atmos. Res. 238:104879. doi: 10.1016/j.atmosres.2020.104879
Chaudhari, S., Pokhrel, Y., Moran, E., and Miguez-Macho, G. (2019). Multi-decadal hydrologic change and variability in the Amazon River basin: understanding terrestrial water storage variations and drought characteristics. Hydrol. Earth Syst. Sci. 23, 2841–2862. doi: 10.5194/hess-23-2841-2019
Correa, I. C., Arias, P. A., and Rojas, M. (2021). Evaluation of multiple indices of the South American monsoon. Int. J. Climatol. 41, E2801–E2819. doi: 10.1002/joc.6880
Costa, M. H., and Pires, G. F. (2010). Effects of Amazon and Central Brazil deforestation scenarios on the duration of the dry season in the arc of deforestation. Int. J. Climatol. 30, 1970–1979. doi: 10.1002/joc.2048
da S. Freitas, E., Coelho, V. H. R., Xuan, Y., Melo, D. C. D., Gadelha, A. N., Santos, E. A., et al. (2020). The performance of the IMERG satellite-based product in identifying sub-daily rainfall events and their properties. J. Hydrol. 589:125128. doi: 10.1016/j.jhydrol.2020.125128
Davidson, E. A., De Araüjo, A. C., Artaxo, P., Balch, J. K., Brown, I. F., Mercedes, M. M., et al. (2012). The Amazon basin in transition. Nature 481, 321–328. doi: 10.1038/nature10717
de Paiva, R. C. D., Buarque, D. C., Collischonn, W., Bonnet, M.-P., Frappart, F., Calmant, S., et al. (2013). Large-scale hydrologic and hydrodynamic modeling of the Amazon River basin. Water Resour. Res. 49, 1226–1243. doi: 10.1002/wrcr.20067
Debortoli, N. S., Dubreuil, V., Funatsu, B., Delahaye, F., de Oliveira, C. H., Rodrigues-Filho, S., et al. (2015). Rainfall patterns in the Southern Amazon: a chronological perspective (1971–2010). Clim. Change 132, 251–264. doi: 10.1007/s10584-015-1415-1
Debortoli, N. S., Dubreuil, V., Hirota, M., Filho, S. R., Lindoso, D. P., and Nabucet, J. (2017). Detecting deforestation impacts in Southern Amazonia rainfall using rain gauges. Int. J. Climatol. 37, 2889–2900. doi: 10.1002/joc.4886
Didan, K., Munoz, A. B., Solano, R., and Huete, A. (2015). MODIS Vegetation Index User's Guide (MOD13 Series) version 3.00 (Collection 6). Tucson, AZ: University of Arizona,Vegetation Index and Phenology Lab. Available online at: https://lpdaac.usgs.gov/documents/103/MOD13_User_Guide_V6.pdf (accessed December 27, 2020).
Espinoza, J. C., Chavez, S., Ronchail, J., Junquas, C., Takahashi, K., and Lavado, W. (2015). Rainfall hotspots over the southern tropical Andes: spatial distribution, rainfall intensity, and relations with large-scale atmospheric circulation. Water Resour. Res. 51, 3459–3475. doi: 10.1002/2014WR016273
Espinoza, J. C., Ronchail, J., Guyot, J. L., Cochonneau, G., Naziano, F., Lavado, W., et al. (2009). Spatio-temporal rainfall variability in the Amazon basin countries (Brazil, Peru, Bolivia, Colombia, and Ecuador). Int. J. Climatol. 29, 1574–1594. doi: 10.1002/joc.1791
Espinoza, J. C., Ronchail, J., Guyot, J. L., Junquas, C., Vauchel, P., Lavado, W., et al. (2011). Climate variability and extreme drought in the upper Solimões River (western Amazon Basin): understanding the exceptional 2010 drought. Geophys. Res. Lett. 38:L13406. doi: 10.1029/2011GL047862
Espinoza, J. C., Ronchail, J., Marengo, J. A., and Segura, H. (2019a). Contrasting North–South changes in Amazon wet-day and dry-day frequency and related atmospheric features (1981–2017). Clim. Dyn. 52, 5413–5430. doi: 10.1007/s00382-018-4462-2
Espinoza, J. C., Segura, H., Ronchail, J., Drapeau, G., and Gutierrez-Cori, O. (2016). Evolution of wet-day and dry-day frequency in the western Amazon basin: relationship with atmospheric circulation and impacts on vegetation. Water Resour. Res. 52, 8546–8560. doi: 10.1002/2016WR019305
Espinoza, J. C., Sörensson, A. A., Ronchail, J., Molina-Carpio, J., Segura, H., Gutierrez-Cori, O., et al. (2019b). Regional hydro-climatic changes in the Southern Amazon Basin (Upper Madeira Basin) during the 1982–2017 period. J. Hydrol. Reg. Stud. 26:100637. doi: 10.1016/j.ejrh.2019.100637
Esquivel-Muelbert, A., Baker, T. R., Dexter, K. G., Lewis, S. L., Brienen, R. J. W., Feldpausch, T. R., et al. (2019). Compositional response of Amazon forests to climate change. Glob. Chang. Biol. 25, 39–56. doi: 10.1111/gcb.14413
Fan, Y., Miguez-Macho, G., Jobbágy, E. G., Jackson, R. B., and Otero-Casal, C. (2017). Hydrologic regulation of plant rooting depth. Proc. Natl. Acad. Sci. U.S.A. 114, 10572–10577. doi: 10.1073/pnas.1712381114
Frappart, F., Papa, F., Santos Da Silva, J., Ramillien, G., Prigent, C., Seyler, F., et al. (2012). Surface freshwater storage and dynamics in the Amazon basin during the 2005 exceptional drought. Environ. Res. Lett. 7:044010. doi: 10.1088/1748-9326/7/4/044010
Frappart, F., Ramillien, G., and Ronchail, J. (2013). Changes in terrestrial water storage versus rainfall and discharges in the Amazon basin. Int. J. Climatol. 33, 3029–3046. doi: 10.1002/joc.3647
Fu, R., Yin, L., Li, W., Arias, P. A., Dickinson, R. E., Huang, L., et al. (2013). Increased dry-season length over southern Amazonia in recent decades and its implication for future climate projection. Proc. Natl. Acad. Sci. U.S.A. 110, 18110–18115. doi: 10.1073/pnas.1302584110
Funk, C., Peterson, P., Landsfeld, M., Pedreros, D., Verdin, J., Shukla, S., et al. (2015). The climate hazards infrared precipitation with stations - a new environmental record for monitoring extremes. Sci. Data 2, 1–21. doi: 10.1038/sdata.2015.66
Gerard, F. F., George, C. T., Hayman, G., Chavana-Bryant, C., and Weedon, G. P. (2020). Leaf phenology amplitude derived from MODIS NDVI and EVI: Maps of leaf phenology synchrony for Meso- and South America. Geosci. Data J. 7, 13–26. doi: 10.1002/gdj3.87
Guyot, J. L., Filizola, N., Quintanilla, J., and Cortez, J. (1996). Dissolved solids and suspended sediment yields in the Rio Madeira basin, from the Bolivian Andes to the Amazon. IAHS-AISH Publ. 236, 55–63.
Hamilton, S. K., Sippel, S. J., and Melack, J. M. (2004). Seasonal inundation patterns in two large savanna floodplains of South America: the Llanos de Moxos (Bolivia) and the Llanos del Orinoco (Venezuela and Colombia). Hydrol. Process. 18, 2103–2116. doi: 10.1002/hyp.5559
Hansen, M. C., Potapov, P. V., Moore, R., Hancher, M., Turubanova, S. A., Tyukavina, A., et al. (2013). High-Resolution global maps of 21st-century forest cover change. Science 342, 850–853. doi: 10.1126/science.1244693
Harris, I. (2020). CRU JRA v2.1: A Forcings Dataset of Gridded Land Surface Blend of Climatic Research Unit (CRU) and Japanese Reanalysis (JRA) Data; Jan. 1901-Dec. 2019. Centre for Environmental Data Analysis. Available online at: https://catalogue.ceda.ac.uk/uuid/10d2c73e5a7d46f4ada08b0a26302ef7 (accessed February 15, 2021).
Harris, I., Jones, P. D., Osborn, T. J., and Lister, D. H. (2014). Updated high-resolution grids of monthly climatic observations - the CRU TS3.10 Dataset. Int. J. Climatol. 34, 623–642. doi: 10.1002/joc.3711
Hashimoto, H., Wang, W., Dungan, J. L., Li, S., Michaelis, A. R., Takenaka, H., et al. (2021). New generation geostationary satellite observations support seasonality in greenness of the Amazon evergreen forests. Nat. Commun. 12:684. doi: 10.1038/s41467-021-20994-y
Heck, E., de Beurs, K. M., Owsley, B. C., and Henebry, G. M. (2019). Evaluation of the MODIS collections 5 and 6 for change analysis of vegetation and land surface temperature dynamics in North and South America. ISPRS J. Photogramm. Remote Sens. 156, 121–134. doi: 10.1016/j.isprsjprs.2019.07.011
Hilker, T., Lyapustin, A. I., Hall, F. G., Myneni, R., Knyazikhin, Y., Wang, Y., et al. (2015). On the measurability of change in Amazon vegetation from MODIS. Remote Sens. Environ. 166, 233–242. doi: 10.1016/j.rse.2015.05.020
Hilker, T., Lyapustin, A. I., Tucker, C. J., Hall, F. G., Myneni, R. B., Wang, Y., et al. (2014). Vegetation dynamics and rainfall sensitivity of the Amazon. Proc. Natl. Acad. Sci. U.S.A. 111, 16041–16046. doi: 10.1073/pnas.1404870111
Horel, J. D., Hahmann, A. N., and Geisler, J. E. (1989). An investigation of the annual cycle of convective activity over the Tropical Americas. J. Clim. 2, 1388–1403. doi: 10.1175/1520-0442(1989)002<1388:AIOTAC>2.0.CO;2
Hou, A. Y., Kakar, R. K., Neeck, S., Azarbarzin, A. A., Kummerow, C. D., Kojima, M., et al. (2014). The global precipitation measurement mission. Bull. Am. Meteorol. Soc. 95, 701–722. doi: 10.1175/BAMS-D-13-00164.1
Huete, A., Didan, K., Miura, T., Rodriguez, E. P., Gao, X., and Ferreira, L. G. (2002). Overview of the radiometric and biophysical performance of the MODIS vegetation indices. Remote Sens. Environ. 83, 195–213. doi: 10.1016/S0034-4257(02)00096-2
Huffman, G. J., Bolvin, D. T., Braithwaite, D., Hsu, K.-L., Joyce, R., Kidd, C., et al. (2019a). NASA Global Precipitation Measurement (GPM) Integrated Multi-satellitE Retrievals for GPM (IMERG). Algorithm Theoretical Basis Document (ATBD) Version 06. National Aeronautics and Space Administration, 1–34. Available online at: https://gpm.nasa.gov/sites/default/files/document_files/IMERG_ATBD_V06.pdf (accessed February 15, 2021).
Huffman, G. J., Bolvin, D. T., Braithwaite, D., Hsu, K.-L., Joyce, R. J., Kidd, C., et al. (2020). “Integrated Multi-satellite Retrievals for the Global Precipitation Measurement (GPM) Mission (IMERG),” in Advances in Global Change Research, 343–353. doi: 10.1007/978-3-030-24568-9_19
Huffman, G. J., Bolvin, D. T., Nelkin, E. J., and Tan, J. (2019b). Integrated Multi-satellitE Retrievals for GPM (IMERG) Technical Documentation. NASA Technical Document, 1–77. Available online at: https://gpm.nasa.gov/sites/default/files/document_files/IMERG_doc_190909.pdf (accessed February 15, 2021).
Junquas, C., Takahashi, K., Condom, T., Espinoza, J. C., Chavez, S., Sicart, J. E., et al. (2018). Understanding the influence of orography on the precipitation diurnal cycle and the associated atmospheric processes in the central Andes. Clim. Dyn. 50, 3995–4017. doi: 10.1007/s00382-017-3858-8
Killeen, T. J., Douglas, M., Consiglio, T., Jørgensen, P. M., and Mejia, J. (2007). Dry spots and wet spots in the Andean hotspot. J. Biogeogr. 34, 1357–1373. doi: 10.1111/j.1365-2699.2006.01682.x
Kim, Y., Knox, R. G., Longo, M., Medvigy, D., Hutyra, L. R., Pyle, E. H., et al. (2012). Seasonal carbon dynamics and water fluxes in an Amazon rainforest. Glob. Chang. Biol. 18, 1322–1334. doi: 10.1111/j.1365-2486.2011.02629.x
Kobayashi, S., Ota, Y., Harada, Y., Ebita, A., Moriya, M., Onoda, H., et al. (2015). The JRA-55 reanalysis: General specifications and basic characteristics. J. Meteorol. Soc. Japan 93, 5–48. doi: 10.2151/jmsj.2015-001
Krinner, G., Viovy, N., de Noblet-Ducoudré, N., Ogée, J., Polcher, J., Friedlingstein, P., et al. (2005). A dynamic global vegetation model for studies of the coupled atmosphere-biosphere system. Global Biogeochem. Cycles 19, 1–33. doi: 10.1029/2003GB002199
Leite-Filho, A. T., de Sousa Pontes, V. Y., and Costa, M. H. (2019). Effects of deforestation on the onset of the rainy season and the duration of dry spells in Southern Amazonia. J. Geophys. Res. Atmos. 124, 5268–5281. doi: 10.1029/2018JD029537
Lewis, S. L., Brando, P. M., Phillips, O. L., Van Der Heijden, G. M. F., and Nepstad, D. (2011). The 2010 Amazon drought. Science 331, 554–554. doi: 10.1126/science.1200807
Li, W., and Fu, R. (2004). Transition of the large-scale atmospheric and land surface conditions from the dry to the wet season over Amazonia as diagnosed by the ECMWF re-analysis. J. Clim. 17, 2637–2651. doi: 10.1175/1520-0442(2004)017<2637:TOTLAA>2.0.CO;2
Lovejoy, T. E., and Nobre, C. (2019). Amazon tipping point: last chance for action. Sci. Adv. 5, 4–6. doi: 10.1126/sciadv.aba2949
Maeda, E. E., Kim, H., Aragão, L. E. O. C., Famiglietti, J. S., and Oki, T. (2015). Disruption of hydroecological equilibrium in southwest Amazon mediated by drought. Geophys. Res. Lett. 42, 7546–7553. doi: 10.1002/2015GL065252
Maeda, E. E., Moura, Y. M., Wagner, F., Hilker, T., Lyapustin, A. I., Wang, Y., et al. (2016). Consistency of vegetation index seasonality across the Amazon rainforest. Int. J. Appl. Earth Obs. Geoinf. 52, 42–53. doi: 10.1016/j.jag.2016.05.005
Marengo, J. A., and Espinoza, J. C. (2016). Extreme seasonal droughts and floods in Amazonia: Causes, trends and impacts. Int. J. Climatol. 36, 1033–1050. doi: 10.1002/joc.4420
Marengo, J. A., Liebmann, B., Grimm, A. M., Misra, V., Silva Dias, P. L., Cavalcanti, I. F. A., et al. (2010). Recent developments on the South American monsoon system. Int. J. Climatol. 32, 1–21. doi: 10.1002/joc.2254
Marengo, J. A., Liebmann, B., Kousky, V. E., Filizola, N. P., and Wainer, I. C. (2001). Onset and end of the rainy season in the Brazilian Amazon Basin. J. Clim. 14, 833–852. doi: 10.1175/1520-0442(2001)014<0833:OAEOTR>2.0.CO;2
Marengo, J. A., Nobre, C. A., Tomasella, J., Oyama, M. D., de Oliveira, G. S., de Oliveira, R., et al. (2008). The drought of Amazonia in 2005. J. Clim. 21, 495–516. doi: 10.1175/2007JCLI1600.1
Marengo, J. A., Souza, C. M., Thonicke, K., Burton, C., Halladay, K., Betts, R. A., et al. (2018). Changes in climate and land use over the Amazon region: current and future variability and trends. Front. Earth Sci. 6:228. doi: 10.3389/feart.2018.00228
Marengo, J. A., Tomasella, J., Alves, L. M., Soares, W. R., and Rodriguez, D. A. (2011). The drought of 2010 in the context of historical droughts in the Amazon region. Geophys. Res. Lett. 38, 1–5. doi: 10.1029/2011GL047436
Markewitz, D., Devine, S., Davidson, E. A., Brando, P., and Nepstad, D. C. (2010). Soil moisture depletion under simulated drought in the Amazon: impacts on deep root uptake. New Phytol. 187, 592–607. doi: 10.1111/j.1469-8137.2010.03391.x
Mas, J. F. (2011). Aplicaciones del Sensor MODIS Para el Monitoreo del Territorio. Secretaría de Medio Ambiente y Recursos Naturales. Mexico City: Instituto Nacional de Ecología.
Molina-Carpio, J., Espinoza, J. C., Vauchel, P., Ronchail, J., Gutierrez Caloir, B., Guyot, J. L., et al. (2017). Hydroclimatology of the Upper Madeira River basin: spatio-temporal variability and trends. Hydrol. Sci. J. 62, 911–927. doi: 10.1080/02626667.2016.1267861
Moreira, A. A., Ruhoff, A. L., Roberti, D. R., Souza, V., de, A., da Rocha, H. R., et al. (2019). Assessment of terrestrial water balance using remote sensing data in South America. J. Hydrol. 575, 131–147. doi: 10.1016/j.jhydrol.2019.05.021
Morton, D. C., Nagol, J., Carabajal, C. C., Rosette, J., Palace, M., Cook, B. D., et al. (2014). Amazon forests maintain consistent canopy structure and greenness during the dry season. Nature 506, 221–224. doi: 10.1038/nature13006
Murray, S. J., Watson, I. M., and Prentice, I. C. (2013). The use of dynamic global vegetation models for simulating hydrology and the potential integration of satellite observations. Prog. Phys. Geogr. 37, 63–97. doi: 10.1177/0309133312460072
Nepstad, D. C., De Carvalho, C. R., Davidson, E. A., Jipp, P. H., Lefebvre, P. A., Negreiros, G. H., et al. (1994). The role of deep roots in the hydrological and carbon cycles of Amazonian forests and pastures. Nature 372, 666–669. doi: 10.1038/372666a0
Nobre, C. A., Sampaio, G., Borma, L. S., Castilla-Rubio, J. C., Silva, J. S., and Cardoso, M. (2016). Land-use and climate change risks in the amazon and the need of a novel sustainable development paradigm. Proc. Natl. Acad. Sci. U.S.A. 113, 10759–10768. doi: 10.1073/pnas.1605516113
Oliveira, R., Maggioni, V., Vila, D., and Porcacchia, L. (2018). Using satellite error modeling to improve GPM-Level 3 rainfall estimates over the central Amazon region. Remote Sens. 10:336. doi: 10.3390/rs10020336
Ovando, A., Tomasella, J., Rodriguez, D. A., Martinez, J. M., Siqueira-Junior, J. L., Pinto, G. L. N., et al. (2016). Extreme flood events in the Bolivian Amazon wetlands. J. Hydrol. Reg. Stud. 5, 293–308. doi: 10.1016/j.ejrh.2015.11.004
Parrens, M., Bitar, A. A, Frappart, F., Paiva, R., Wongchuig, S., et al. (2019). High resolution mapping of inundation area in the Amazon basin from a combination of L-band passive microwave, optical and radar datasets. Int. J. Appl. Earth Obs. Geoinf. 81, 58–71. doi: 10.1016/j.jag.2019.04.011
Parsons, L. A. (2020). Implications of CMIP6 projected drying trends for 21st century Amazonian drought risk. Earth Futur. 8:e2020EF001608. doi: 10.1029/2020EF001608
Phillips, O. L., Aragao, L. E. O. C., Lewis, S. L., Fisher, J. B., Lloyd, J., Lopez-Gonzalez, G., et al. (2009). Drought sensitivity of the Amazon rainforest. Science 323, 1344–1347. doi: 10.1126/science.1164033
Piao, S., Fang, J., Zhou, L., Ciais, P., and Zhu, B. (2006). Variations in satellite-derived phenology in China's temperate vegetation. Glob. Chang. Biol. 12, 672–685. doi: 10.1111/j.1365-2486.2006.01123.x
Piao, S., Liu, Q., Chen, A., Janssens, I. A., Fu, Y., Dai, J., et al. (2019). Plant phenology and global climate change: Current progresses and challenges. Glob. Chang. Biol. 25, 1922–1940. doi: 10.1111/gcb.14619
Piao, S., Wang, X., Park, T., Chen, C., Lian, X., He, Y., et al. (2020). Characteristics, drivers and feedbacks of global greening. Nat. Rev. Earth Environ. 1, 14–27. doi: 10.1038/s43017-019-0001-x
Quillet, A., Peng, C., and Garneau, M. (2010). Toward dynamic global vegetation models for simulating vegetation-climate interactions and feedbacks: recent developments, limitations, and future challenges. Environ. Rev. 18, 333–353. doi: 10.1139/A10-016
Ruiz-Vásquez, M., Arias, P. A., Martinez, A., and Espinoza, J. C. (2020). Effects of Amazon basin deforestation on regional atmospheric circulation and water vapor transport towards tropical South America. Clim. Dyn. 54, 4169–4189. doi: 10.1007/s00382-020-05223-4
Saleska, S. R., Didan, K., Huete, A. R., and Da Rocha, H. R. (2007). Amazon forests green-up during 2005 drought. Science 318, 612–612. doi: 10.1126/science.1146663
Samanta, A., Ganguly, S., Hashimoto, H., Devadiga, S., Vermote, E., Knyazikhin, Y., et al. (2010). Amazon forests did not green-up during the 2005 drought. Geophys. Res. Lett. 37, 1–5. doi: 10.1029/2009GL042154
Sena, A. C. T., and Magnusdottir, G. (2020). Projected end-of-century changes in the South American Monsoon in the CESM large ensemble. J. Clim. 33, 7859–7874. doi: 10.1175/JCLI-D-19-0645.1
Silva, C. V. J., Aragão, L. E. O. C., Barlow, J., Espirito-Santo, F., Young, P. J., Anderson, L. O., et al. (2018). Drought-induced Amazonian wildfires instigate a decadal-scale disruption of forest carbon dynamics. Philos. Trans. R. Soc. B Biol. Sci. 373:20180043. doi: 10.1098/rstb.2018.0043
Sulla-Menashe, D., and Friedl, M. A. (2018). User Guide to Collection 6 MODIS Land Cover (MCD12Q1 and MCD12C1) Product. Usgs, 1–18. Available online at: https://lpdaac.usgs.gov/documents/101/MCD12_User_Guide_V6.pdf (accessed December 27, 2020).
Swenson, S., Famiglietti, J., Basara, J., and Wahr, J. (2008). Estimating profile soil moisture and groundwater variations using GRACE and Oklahoma Mesonet soil moisture data. Water Resour. Res. 44:W01413. doi: 10.1029/2007WR006057
Tan, J., Huffman, G. J., Bolvin, D. T., and Nelkin, E. J. (2019). IMERG V06: changes to the morphing algorithm. J. Atmos. Ocean. Technol. 36, 2471–2482. doi: 10.1175/JTECH-D-19-0114.1
Tan, J., Petersen, W. A., Kirstetter, P. E., and Tian, Y. (2017). Performance of IMERG as a function of spatiotemporal scale. J. Hydrometeorol. 18, 307–319. doi: 10.1175/JHM-D-16-0174.1
Tapley, B. D., Bettadpur, S., Ries, J. C., Thompson, P. F., and Watkins, M. M. (2004). GRACE measurements of mass variability in the earth system. Science 305, 503–505. doi: 10.1126/science.1099192
Vera, C., Higgins, W., Amador, J., Ambrizzi, T., Garreaud, R., Gochis, D., et al. (2006). Toward a unified view of the American monsoon systems. J. Clim. 19, 4977–5000. doi: 10.1175/JCLI3896.1
Wongchuig, S., de Paiva, R. C. D., Espinoza, J. C., and Collischonn, W. (2017). Multi-decadal hydrological retrospective: case study of Amazon floods and droughts. J. Hydrol. 549, 667–684. doi: 10.1016/j.jhydrol.2017.04.019
Wright, J. S., Fu, R., Worden, J. R., Chakraborty, S., Clinton, N. E., Risi, C., et al. (2017). Rainforest-initiated wet season onset over the Southern Amazon. Proc. Natl. Acad. Sci. U.S.A. 114, 8481–8486. doi: 10.1073/pnas.1621516114
Wu, C., Peng, D., Soudani, K., Siebicke, L., Gough, C. M., Arain, M. A., et al. (2017). Land surface phenology derived from normalized difference vegetation index (NDVI) at global FLUXNET sites. Agric. For. Meteorol. 233, 171–182. doi: 10.1016/j.agrformet.2016.11.193
Xu, L., Samanta, A., Costa, M. H., Ganguly, S., Nemani, R. R., and Myneni, R. B. (2011). Widespread decline in greenness of Amazonian vegetation due to the 2010 drought. Geophys. Res. Lett. 38, 2–5. doi: 10.1029/2011GL046824
Zeng, N., Yoon, J. H., Marengo, J. A., Subramaniam, A., Nobre, C. A., Mariotti, A., et al. (2008). Causes and impacts of the 2005 Amazon drought. Environ. Res. Lett. 3, 1–9. doi: 10.1088/1748-9326/3/1/014002
Zhao, A., Zhang, A., Liu, X., and Cao, S. (2018). Spatiotemporal changes of normalized difference vegetation index (NDVI) and response to climate extremes and ecological restoration in the Loess Plateau, China. Theor. Appl. Climatol. 132, 555–567. doi: 10.1007/s00704-017-2107-8
Keywords: Amazon Basin, hydroclimate-vegetation system, dry and wet season, water-limited, deforested areas
Citation: Gutierrez-Cori O, Espinoza JC, Li LZX, Wongchuig S, Arias PA, Ronchail J and Segura H (2021) On the Hydroclimate-Vegetation Relationship in the Southwestern Amazon During the 2000–2019 Period. Front. Water 3:648499. doi: 10.3389/frwa.2021.648499
Received: 31 December 2020; Accepted: 11 February 2021;
Published: 24 March 2021.
Edited by:
Juan Antonio Rivera, CONICET Argentine Institute of Nivology, ArgentinaReviewed by:
Marcelo Sacardi Biudes, Federal University of Mato Grosso, BrazilRana Muhammad Adnan Ikram, Hohai University, China
Copyright © 2021 Gutierrez-Cori, Espinoza, Li, Wongchuig, Arias, Ronchail and Segura. This is an open-access article distributed under the terms of the Creative Commons Attribution License (CC BY). The use, distribution or reproduction in other forums is permitted, provided the original author(s) and the copyright owner(s) are credited and that the original publication in this journal is cited, in accordance with accepted academic practice. No use, distribution or reproduction is permitted which does not comply with these terms.
*Correspondence: Omar Gutierrez-Cori, ogutierrez@lmd.ipsl.fr; omar.gutierrez.cori@gmail.com