Brief Report

Retrieval of Snow Albedo and Total Ozone Column from Single-View MSI/S-2 Spectral Reflectance Measurements over Antarctica

1
Telespazio Belgium SPRL, Bratustrasse 7, D-64293 Darmstadt, Germany
2
CNRS/CNES/IRD/INRAE/UPS, CESBIO, Université de Toulouse, 31400 Toulouse, France
3
Institut des Géosciences de l’Environnement (IGE), University Grenoble Alpes, CNRS, UMR 5001, 38041 Grenoble, France
*
Author to whom correspondence should be addressed.
Remote Sens. 2021, 13(21), 4404; https://doi.org/10.3390/rs13214404
Submission received: 22 September 2021 / Revised: 27 October 2021 / Accepted: 29 October 2021 / Published: 1 November 2021

Abstract

:
We proposed a simple algorithm to retrieve the total ozone column and snow properties (spectral albedo and effective light absorption path) using the high spatial resolution single–view MSI/S-2 measurements over Antarctica. In addition, the algorithm allows the retrieval of the snow grain size on a scale of 10–20 m. This algorithm should be useful for the understanding of intra-pixel total ozone and snow albedo variability in complement to satellite observations performed on a much coarser spatial resolution scale (0.3–1 km and even larger spatial scales).

Graphical Abstract

1. Introduction

Sentinel-2 (S-2) is an Earth observation mission from the Copernicus Programme that systematically acquires optical imagery at high spatial resolution (10 m to 60 m) over land and coastal waters. The mission is a constellation with two twin satellites, S-2A and S-2B. The satellites were launched on 23 June 2015 and 7 March 2017, respectively. It is planned that S-2C and S-2D will be launched during the next 10 years. The S-2 mission is equipped with the Multi-Spectral Instrument (MSI), which uses a push-broom concept and its design has been driven by the large (290 km) swath and high (10–60 m) spatial resolution requirements. Revisiting is 5 days per month on average under the same viewing angles close to the nadir direction. MSI operates in the spectral range 0.44–2.2 μm. The instrument has already been used for numerous applications including studies of lake ecological quality [1], winter wheat [2] and seasonal agriculture land use [3] mapping, etc. (see, e.g., https://www.mdpi.com/journal/remotesensing/special_issues/sentinel2_sa, last time accessed: 1 November 2021).
The climatic effects of snow cover depend not only on its extent [4] but also on its spectral albedo, which plays an important role in the modification of the backscattered solar energy on local and global scales [5,6]. Snow albedo products are currently available at moderate resolution (i.e., 300 m from Ocean and Land Colour Imager (OLCI) [7,8], 500 m from MODerate Imaging Spectrometer (MODIS) [9,10] and Sea and Land Surface Temperature Radiometer (SLSTR) [11,12], and 1 km from Second Generation Global Imager (SGLI) [13]. However, they do not allow capturing the fine details of spatial variability of the snow surface properties [14]. The technique presented here provides snow albedo products on the scale of 10–20 m and makes it possible to derive and validate subpixel snow cover products as obtained, e.g., from MODIS measurements [15,16].
The task of this paper is to derive the spectral snow albedo using MSI/S-2A (B) 10–60 m spatial resolution reflectance data. The spatial resolution of the product depends on the spectral channels used. In addition, the algorithm to determine the total ozone column (TOC) over snow fields using MSI/S-2 is proposed. The retrieval algorithm is described in the next section. We also present the validation of the algorithm using ground-based snow spectral albedo and TOC measurements performed at Dome C (75°05′59″S, 123°19′56″E, 3233 m above sea level) in Antarctica.

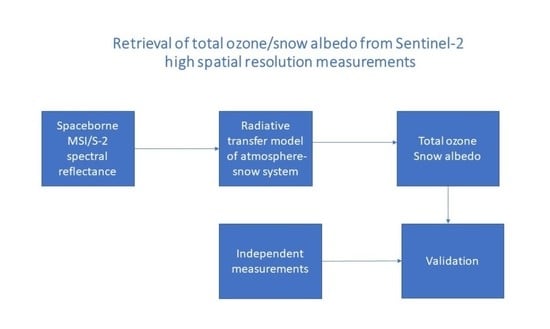
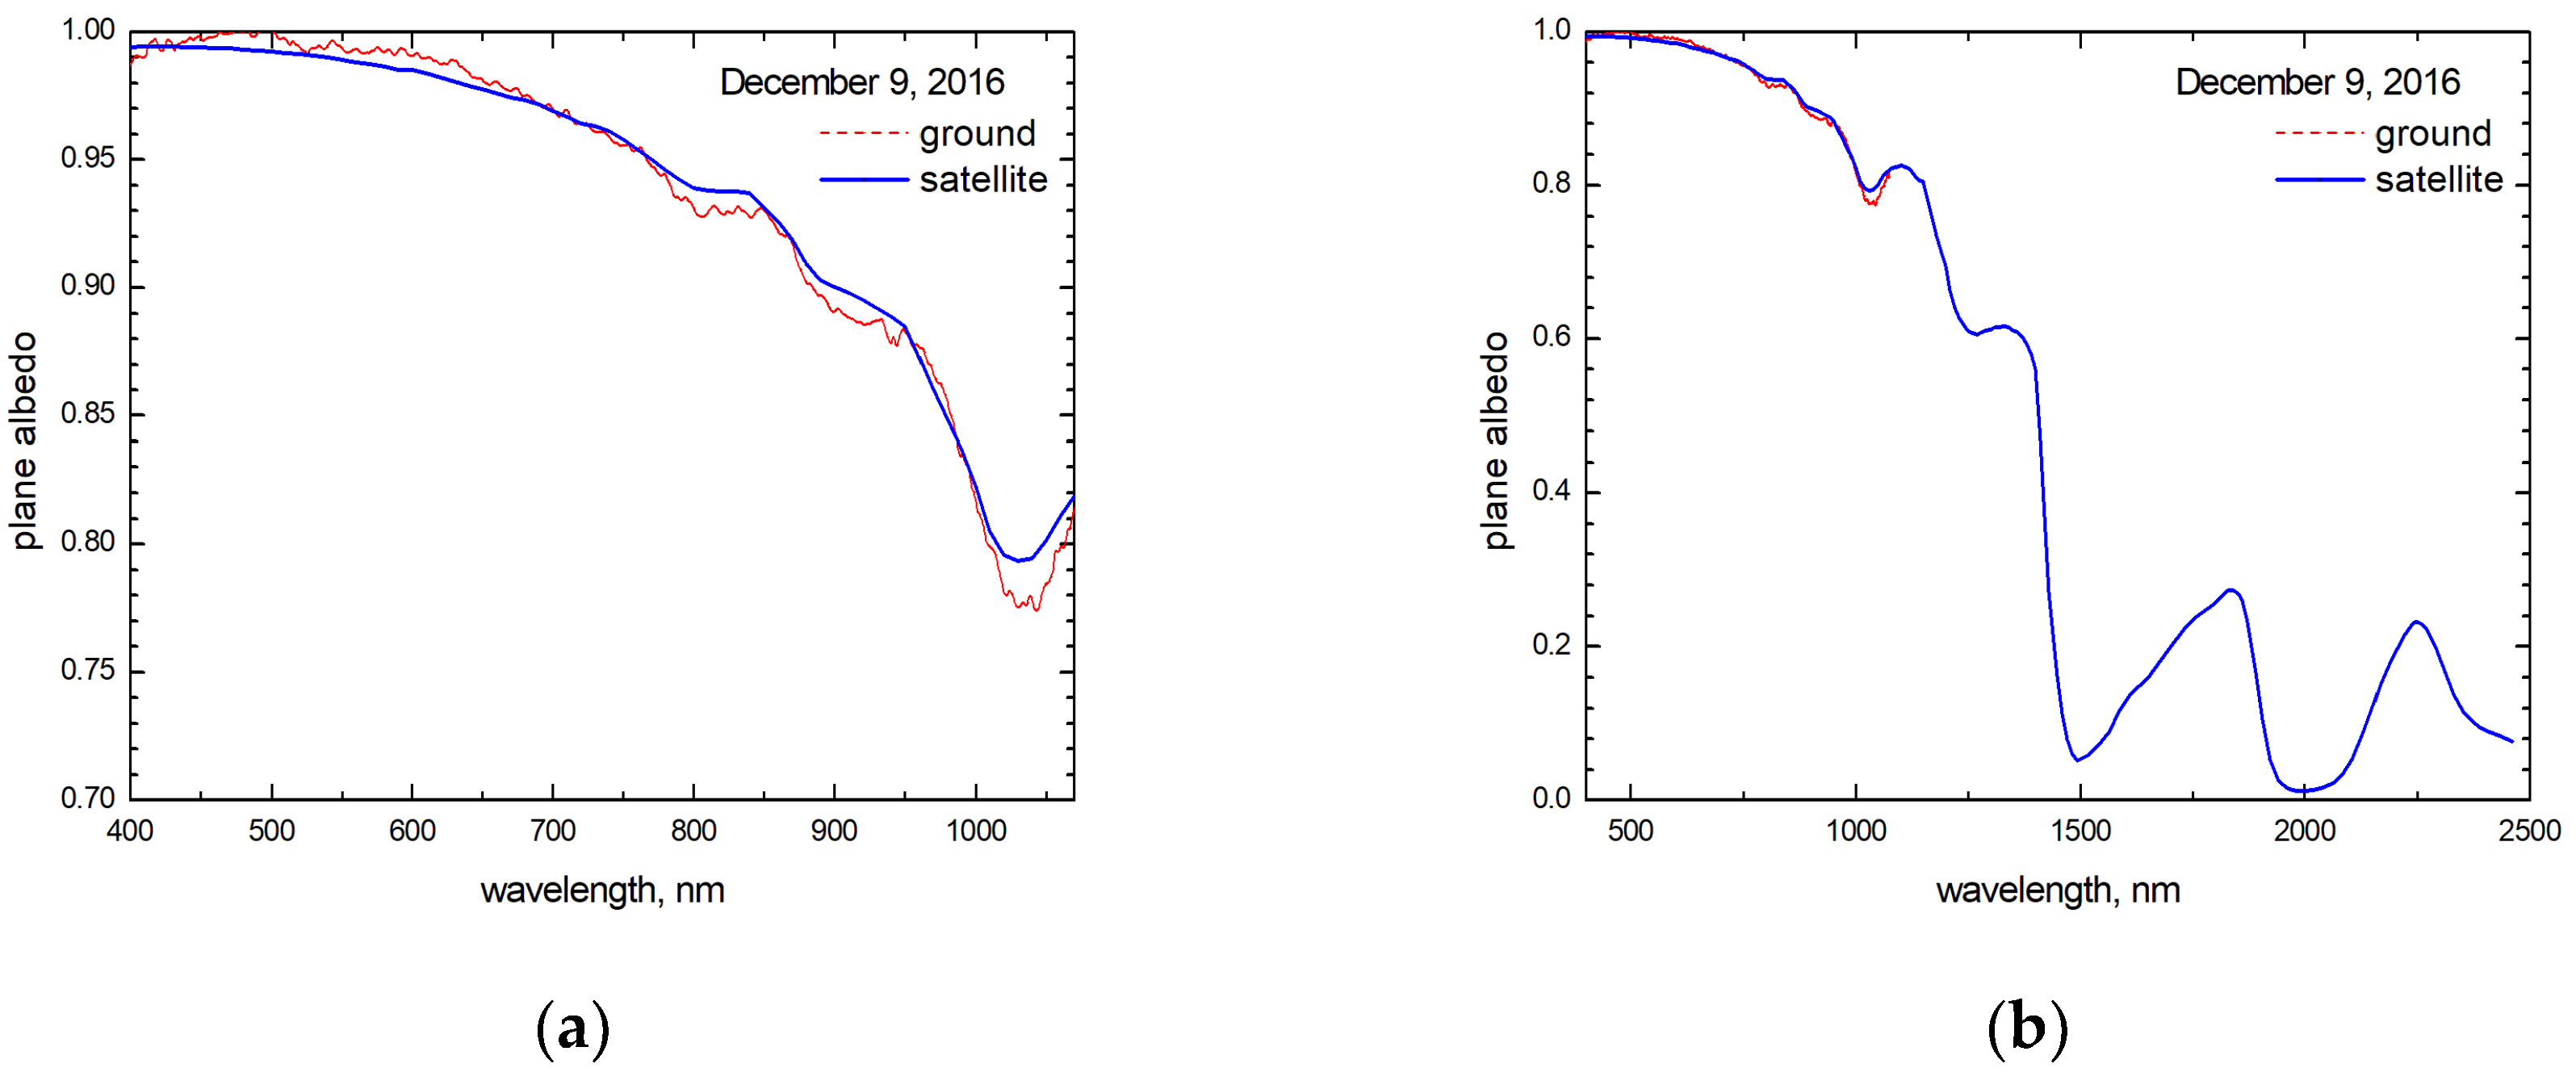
2. The Determination of the Total Ozone and Spectral Snow Albedo Using MSI Measurements

This work is aimed at the retrievals of total ozone column and snow properties from MSI measurements over Antarctica. The atmospheric light scattering effects are rather weak [17,18] in Antarctica for the MSI channels (see Table 1). Additionally, the concentration of light-absorbing impurities in most Antarctic snow is very low [19,20] and can be neglected in the first iteration. We shall use the following approximation for the spectral top-of-atmosphere reflectance:
= T g R
where T g is the atmospheric gaseous transmittance, R is the underlying surface-atmosphere reflectance under the assumption that there are no absorbing gases in the atmosphere. Ignoring weak atmospheric light scattering effects at the MSI channels, we can write for highly reflective clean Antarctic surfaces [7,8,21]:
R = R 0 exp { α L }
where α = 4 π χ λ is the bulk absorption coefficient of ice, χ is the imaginary part of ice refractive index and λ is the wavelength. Here, R 0 is the snow reflectance in the absence of absorption and L is the effective light absorption path (ELAP). In the case of dirty snow, Equation (2) must be modified to account for the snow pollutants as discussed in [7].
The task of this work is to retrieve the spectral snow albedo and total ozone concentration using MSI measurements in the spectral range 443–865 nm, where the accuracy of Equation (2) is higher as compared to the case of short-wave infrared wavelengths [7]. Additionally, the influence of all atmospheric gases on the value of transmittance T g (except ozone) can be neglected in this spectral interval [8,21]. This is especially valid in central Antarctica, where the atmosphere is thin and the air is dry.
We shall use the following approximation for the atmospheric ozone transmittance [8]:
T g ( λ ) = exp { K C a b s ( λ ) }
where K = mN, m is the air mass factor (AMF) depending on several parameters including the cosine of the solar zenith angle (SZA) ξ and the cosine of the viewing zenith angle η, N is the total ozone column and C a b s ( λ ) is the ozone absorption cross-section. The dependence of C a b s ( λ ) on temperature and pressure is weak in the spectral range under study [22]. Therefore, it is not accounted for.
Summing up, the spectral MSI reflectance over pure snow fields under a clear sky is modelled as
( λ ) = R a exp { K C a b s ( λ ) L α ( λ ) }
where we assumed that light reflectance by snow in the absence of absorbers R 0 can be substituted by the MSI measurements at band 1 ( R a ). The weak influences of atmospheric scattering effects on the value of MSI spectral reflectance at 442.7 nm can be accounted for, if needed, using either exact radiative transfer calculations for a given atmospheric model or various approximations [21]. These effects are ignored in this work.
Our simplified model of the MSI spectral reflectance in the visible and near-infrared given by Equation (4) makes it possible to determine two unknown constants (K, L) from Equation (4) analytically. Namely, it follows under the assumption that ozone absorption can be neglected at the wavelength λ c :
K = ln ( R a / R b ) α b L C a b s , b ,   L = ln 2 ( R c / R a ) α c
where indices signify the spectral channels ( λ a , λ b , λ c ). The wavelength λ b corresponds to the maximal ozone absorption in the MSI spectra (559.8 nm). It has a spatial resolution of 10 m. The channels ( λ a , λ c ) are used for the determination of the effective light absorption path in the snowpack. We shall use the following wavelengths for MSI/S-2A (and similar channels for S-2B) in this work: λ a = 442.7 nm and λ c = 864.7 nm. They have the same bandwidths (21 nm) but different spatial resolutions (60 m for the channel located at λ a and 20 m for the channel located at λ c ). The channel located at λ c = 864.7 nm corresponds to the maximal ice absorption in the MSI spectra in the range 443–865 nm (with negligible ozone absorption effects). The channel located at λ a = 442.7 nm corresponds to the minimal effects of the ice and ozone absorption in the MSI visible range. The use of channels with different spatial resolutions is justified if snow reflectance in channel 1 (8A) weakly change on the scale of 10–60(20) m, which is true for Antarctic surfaces on average.
The fit of the MSI spectral reflectance measured in the vicinity of the Dome C in Antarctica using Equations (4) and (5) is given in Figure 1. We extracted reflectance from MSI/Sentinel-2 level 1C products at the nearest pixel of the measurement site using Google Earth Engine [23]. The solar and sensor geometry parameters for each spectral band were obtained from the product metadata. The spectral range 400–1050 nm is shown in Figure 1. The calculations using Equation (4) were performed with the spectral resolution of 1 nm. The spectral imaginary part of the ice refractive index as suggested in [24] was used at wavelengths below 600 nm. For the larger wavelengths, data presented in [25] were used. The spectral absorption cross-section of ozone C a b s ( λ ) measured in [22] at 203K was used. The corresponding parameters appearing in Equation (5) are given in Table 2. The linear interpolation of tabular spectra C a b s ( λ ) and χ ( λ ) on the 1 nm grid in the spectral interval 400–1050 nm was applied.
The retrieved values of the parameters given in Equation (4) for the case shown in Figure 1 are: K = 1.66 × 10 19 cm 2 / m o l e c u l e and L = 2.13 mm. They were derived using Equation (5) and data are given in Table 2.
The total ozone column can be derived from the value of K as follows: N = K/m. Assuming that m is given by the geometrical approximation ( m = 1 ξ + 1 η ), one derives for the value of TOC for the case shown in Figure 1: N = 4.8458 × 10 18 m o l e c u l e / cm 2 or N = 180.4 DU, where we used the conversion factor κ = 3.722 × 10 17 DU ×   cm 2 / m o l e c u l e to derive the value of N in Dobson Units (DU). The ground SAOZ (Système d’Analyse par Observations Zénithales) TOC measurements [27,28] at the Dome C site give the value of TOC equal to 158 and 180 DU in morning and evening, respectively, which is close to the TOC derived using MSI/S-2 measurements.
The value of L can be used to derive the effective absorption length , which determines the snow spherical albedo [7]:
r = exp { α }
Namely, it follows [7]:
= R a 2 u 2 ( ξ ) u 2 ( η ) L ,
where [29]:
u ( μ ) = 3 5 ξ + 1 + ξ 3
The function u ( ξ ) describes the angular distribution of light escaping from semi-infinite nonabsorbing turbid media with light sources placed at infinity. Taking into account that R a = 0.92, ξ = 0.41, η = 1, and L = 2.13 mm for the case shown in Figure 1, it follows that = 1.79 mm . This makes it possible to derive both spectral spherical r (see Equation (6)) and plane ( r p = r u ( μ ) ) albedo [7]. Moreover, the ice grain effective diameter can be derived using the relationship proposed in [7]: d e f = / σ , where σ is the shape factor, which depends on the assumed shape of snow grains. We shall use the value of σ = 16 close to that suggested in [7]. Therefore, it follows for the case shown in Figure 1: d e f = 0.11 mm, which is a reasonable estimation for the snow surface at Dome C [6,19]. In particular, it has been found the values of d e f = 0.1 mm in the first 5 mm of snow at the South Pole (23 January 1986) [19]. The value of d e f was two times smaller at the same location immediately after the snowfall [19].
The total ozone column over Dome C retrieved using the technique described above for November–December 2020 is shown in Figure 2 (MSI). The cloudy scenes were removed using MSI measurements at 2.2 μm with the assumption that clouds have higher reflectance as compared to snow at this channel due to the smaller size of crystals in clouds as compared to snow on the surface. The threshold value of R(2.2 μm) = 0.2 was used. The air mass factor was calculated as [30,31].
m = 1 + s 2 s + ξ 2 + 1 + s 2 s + η 2
where s = h R ,   h = 0.26 0.1 L , L is the latitude in degrees (the negative number in the southern hemisphere), R is the radius of the Earth, h is the height of the ozone layer in k m . Equation (9) coincides with the geometrical AMF at s = 0. We also show the TOC derived from other satellite/ground observations (see Table 3 and [26] for details on various satellite measurements) and European Centre for Medium-Range Weather Forecasts (ECMWF) re-analysis in Figure 2. The temporal (daily product) and spatial 1deg averaging around the site was performed (except for MSI, where data for a given pixel or the average of two pixels (S-2A, S-2B), if available, is given). It follows that all instruments show the existence of the ozone hole in early November and its disappearance in the last week of December 2020. Data from all instruments closely follow all temporal oscillations of the TOC (see, e.g., the TOC wave centered at day 45 (15 December) in Figure 2). There is a temporal/spatial mismatch between MSI/S-2 and other satellite measurements. In particular, the MSI/S-2 measurements provide the total ozone column on the spatial scale of 10 m, which is not possible for other instruments (see Table 1). This could explain some differences seen in TOC derived from MSI as compared to other instruments.
The intercomparison of ground-based and satellite—retrieved albedo is given in Figure 3 and Figure 4 for 9 December 2016 and 4–6 February 2018. The ground measurements of the plane albedo were performed in the spectral range 400–1050 nm. Further details on the ground measurements using the Autosolexs instrument are given in [7,32,33], where the same spectral albedo measurements were used to validate the OLCI/S-3 snow albedo retrievals. The time of ground (satellite) measurements on 9 December was 22:00(23:57)UTC at SZA = 65 degrees. Therefore, there was a 2 h temporal mismatch. The times of measurements for 4–6 February 2018 are specified in Table 4. The effective ice grain diameter retrieved from satellite measurements as specified above is shown in Table 4 as well. One can see that the temporal mismatch between ground (5 February, 22:50) and satellite (6 February, 00:07UTC) measurement is just 1 h 17 min. It is assumed that the temporal change of albedo can be neglected at DOME C at the time interval 1–2 h.
It follows that ground and satellite measurements of spectral albedo give very similar results, which indirectly confirm the validity of our assumptions used in the retrieval procedure. We also note that although we used the spectral MSI/S-2 reflectance measurements at just two wavelengths (443 and 865 nm), the spectral albedo is estimated in a much larger spectral range useful also for the shortwave broadband albedo determination. This is due to the fact that the spectral pure plane snow albedo depends largely on two parameters—the effective absorption length and solar zenith angle. The difference between satellite and ground measurements depends on the wavelength being smaller than 2% in the spectral range 400–1100 nm. This difference is below the error of respective optical measurements. The largest differences (2%) occur around 1050 nm, where MSI/S-2 does not perform any measurements. The ELAP estimated from the 864.7 nm MSI-S2 channel may differ from that derived from 1020 nm due to vertical snow inhomogeneity effects and spectrally variable light penetration in snow layers. The difference observed in Figure 3 and Figure 4 may be reduced if a new channel (say, 1020 nm) is added to the MSI in the future.
One can conclude from Figure 4 that spectral albedo does not change considerably during 2 days, if measurements are performed at almost the same time of day (say, 4 February (00:17UTC) and 6 February (00:07UTC)). They are close to the ground measurements performed on 5 February (22:50UTC), 1 h 17 min ahead of satellite measurements performed on 6 February (00:07UTC).

3. Conclusions

The climatic effects of snow surfaces depend both on snow fraction and snow albedo. The retrieval of snow fraction using MSI/S-2 measurements are performed in [34,35] at 20 m resolution in open terrain. In this paper a simple algorithm to retrieve the snow albedo and total ozone column using the high spatial resolution single–view MSI/S-2 measurements over Antarctica is proposed. Therefore, multiple observations of the same ground pixel from different directions as used, e.g., in the MODIS snow albedo retrieval algorithm [9] were not needed.
In addition, the algorithm allows the retrieval of the snow grain size on the scale of 10–20 m although this was not explicitly evaluated here. This algorithm should be useful for the understanding of intra-pixel total ozone and snow albedo variability in complement to satellite observations performed on a much coarser spatial resolution scale (0.3–1 km and even larger spatial scales). The algorithm can be extended for the case of polluted snow as discussed in [36].
It was shown that the MSI reflectance in the spectral range 443–865 nm over snow in Antarctica can be modelled using just two parameters (K and L). These parameters are proportional to the total ozone column and the effective diameter of ice grains, respectively. Therefore, we conclude that the main parameters influencing the MSI spectra in the range 443–865 nm are TOC and the effective diameter of snow grains with other effects of secondary importance for a clean Antarctic atmosphere. In particular, the influence of the molecular and aerosol light scattering on the MSI/S-2 reflectance spectra in Antarctica can be neglected in the first approximation. This is especially true for the channel located at 865 nm used for the effective grain diameter (see Equations (5)–(7)) and spectral albedo determination. We also assumed that the MSI reflectance at channel 1 (8A) is the same on the scale of 10 and 60 (20) m, which is true for most of the Antarctic surfaces. Otherwise, the channels (2, 3, 8, see Table 1) with the same spatial resolution (10 m) must be used to derive the pair (K, L) from Equation (4). It follows from Figure 1 that the reflectances at channels 1 and 2 and also 8 and 8A have close values. Therefore, two different sets of channels used in the retrieval process produce almost the same retrieval results. Alternatively, the parameters (K, L) can be retrieved using all MSI channels in the framework of the optimal estimation approach.
The determination of the effective light absorption path makes it possible to estimate also snow broadband albedo [29,37] both from ground and satellite measurements. An important point is that the information on the effective absorption length makes it possible to retrieve both spectral and broadband snow albedo under the assumption of vertically and horizontally homogeneous snow surfaces.
The technique is applicable for pure snow cases common in Antarctica, where the atmospheric aerosol load is low [17,38]. The retrieval is performed outside absorption bands of water vapor, oxygen and carbon dioxide. The Rayleigh optical thickness is smaller than 0.15 at the MSI channels at Arctic and Antarctic sites [18] and, therefore, the molecular scattering over the highly reflective surface can be neglected as well. The accuracy of the retrievals is expected to decrease for the cases of polluted snow and atmosphere.

Author Contributions

Conceptualization, A.K. and S.G.; methodology, A.K.; software, A.K., S.G.; validation, A.K., S.G., G.P. and L.A.; formal analysis, A.K.; investigation, A.K.; resources, A.K.; data curation, S.G., G.P., L.A.; writing—original draft preparation, A.K.; writing—review and editing, S.G., G.P., L.A.; visualization, A.K.; supervision, A.K.; project administration, A.K. All authors have read and agreed to the published version of the manuscript.

Funding

Agency (ESA) studies; ESRIN contract 4000118926/16/I-NB and the ESRIN contract 4000125043-ESA/AO/1-9101/17/I-NB EO SCIENCE FOR SOCIETY; Agence Nationale de la Recherche (France) studies; grant 1-JS56-005-01 (MONISNNOW).

Data Availability Statement

The data are available upon request from the first author.

Acknowledgments

The authors acknowledge the use of total ozone measurements performed by the SAOZ team (saoz.obs.uvsq.fr, last time accessed: 1 November 2021) and also derived using multiple ESA and NASA instruments (see Table 3) with many thanks. The authors thank ECMWF for providing forecasted TOC data.

Conflicts of Interest

The authors declare no conflict of interest.

References

  1. Free, G.; Bresciani, M.; Trodd, W.; Tierney, D.; O’Boyle, S.; Plant, C.; Deakin, J. Estimation of lake ecological quality from Sentinel-2 remote sensing imagery. Hydrobiologia 2020, 847, 1423–1438. [Google Scholar] [CrossRef]
  2. Zhang, D.; Fang, S.; She, B.; Zhang, H.; Jin, N.; Xia, H.; Yang, Y.; Ding, Y. Winter wheat mapping based on Sentinel-2 Data in heterogeneous planting conditions. Remote Sens. 2019, 11, 2647. [Google Scholar] [CrossRef] [Green Version]
  3. Debella-Gilo, M.; Gjertsen, A.K. Mapping seasonal agricultural land use types using deep learning on Sentinel-2 image time series. Remote Sens. 2021, 13, 289. [Google Scholar] [CrossRef]
  4. Peng, X.; Zhang, T.; Frauenfeld, O.W.; Du, R.; Jin, H.; Mu, C. A holistic assessment of 1979–2016 global cryospheric extent. Earth’s Future 2021, 9, e2020EF001969. [Google Scholar] [CrossRef]
  5. Flanner, M.G.; Zender, C.S.; Randerson, J.T.; Rasch, P.J. Present-day climate forcing and response from black carbon in snow. J. Geophys. Res. 2007, 112, D11202. [Google Scholar] [CrossRef] [Green Version]
  6. Flanner, M.G.; Arnheim, J.; Cook, J.M.; Dang, C.; He, C.; Huang, X.; Singh, D.; Skiles, S.M.; Whicker, C.A.; Zender, C.S. SNICAR-AD v3: A community tool for modeling spectral snow albedo. Geosci. Model Dev. Discuss. 2021. preprint, in review. [Google Scholar] [CrossRef]
  7. Kokhanovsky, A.A.; Lamare, M.; Danne, O.; Brockmann, C.; Dumont, M.; Picard, G.; Arnaud, L.; Favier, V.; Jourdain, B.; Le Meur, E.; et al. Retrieval of snow properties from the Sentinel-3 Ocean and Land Colour Instrument. Remote Sens. 2019, 11, 2280. [Google Scholar] [CrossRef] [Green Version]
  8. Kokhanovsky, A.A.; Lamare, M.; Rozanov, V.V. Retrieval of the total ozone over Antarctica using Sentinel-3 Ocean and Land Colour Instrument. J. Quant. Spectrosc. Radiat. Transf. 2020, 251, 107045. [Google Scholar] [CrossRef]
  9. Schaaf, C.B.; Gao, F.; Strahler, A.H.; Lucht, W.; Li, X.; Tsang, T.; Strugnell, N.C.; Zhang, X.; Jin, Y.; Muller, J.-P.; et al. First operational BRDF, albedo nadir reflectance products from MODIS. Remote Sens. Environ. 2002, 83, 135–148. [Google Scholar] [CrossRef] [Green Version]
  10. Hall, D.K.; Riggs, G.A.; Salomonson, V.V.; Di Girolamo, N.E.; Bayr, K.J. MODIS snow-cover products. Remote Sens. Environ. 2002, 83, 181–194. [Google Scholar] [CrossRef] [Green Version]
  11. Mei, L.; Rozanov, V.; Pohl, C.; Vountas, M.; Burrows, J.P. The retrieval of snow properties from SLSTR Sentinel-3—Part 1: Method description and sensitivity study. Cryosphere 2021, 15, 2757–2780. [Google Scholar] [CrossRef]
  12. Mei, L.; Rozanov, V.; Jäkel, E.; Cheng, X.; Vountas, M.; Burrows, J.P. The retrieval of snow properties from SLSTR Sentinel-3—Part 2: Results and validation. Cryosphere 2021, 15, 2781–2802. [Google Scholar] [CrossRef]
  13. Chen, N.; Li, W.; Fan, Y.; Zhou, Y.; Aoki, T.; Tanikawa, T.; Niwano, M.; Hori, M.; Shimada, R.; Matoba, S.; et al. Snow parameter retrieval (SPR) algorithm for GCOM-C/SGLI. Remote Sens. Environ. 2021, in press. [Google Scholar]
  14. Schweizer, J.; Kronholm, K.; Jamieson, J.B.; Birkeland, K.W. Review of spatial variability of snowpack properties and its importance for avalanche formation. Cold Reg. Sci. Technol. 2008, 51, 253–272. [Google Scholar] [CrossRef]
  15. Kaufman, Y.J.; Kleidman, R.G.; Hall, D.K.; Martins, J.V.; Barton, J. Remote sensing of subpixel snow cover using 0.66 and 2.1 μm channels. Geophys. Res. Lett. 2002, 29, 1781. [Google Scholar] [CrossRef]
  16. Painter, T.H.; Rittger, K.; McKenzie, C.; Slaughter, P.; Davis, R.E.; Dozier, J. Retrieval of subpixel snow covered area, grain size, and albedo from MODIS. Remote Sens. Environ. 2009, 113, 868–879. [Google Scholar] [CrossRef] [Green Version]
  17. Six, D.; Fily, M.; Blarel, L.; Goloub, P. First aerosol optical thickness measurements at Dome C (east Antarctica), summer season 2003–2004. Atmos. Environ. 2005, 39, 5041–5050. [Google Scholar] [CrossRef]
  18. Tomasi, C.; Petkov, B.H. Spectral calculations of Rayleigh—Scattering optical depth at Arctic and Antarctic sites using a two—term algorithm. J. Geophys. Res. 2015, 120, 9514–9538. [Google Scholar] [CrossRef] [Green Version]
  19. Grenfell, T.C.; Warren, S.G.; Mullen, P.C. Reflection of solar radiation by the Antarctic snow surface at ultraviolet, visible, and near-infrared wavelengths. J. Geophys. Res. 1994, 99, 18669–18684. [Google Scholar] [CrossRef]
  20. Kang, S.; Zhang, Y.; Qian, Y.; Wang, H. A review of black carbon in snow and ice and its impact on the cryosphere. Earth-Sci. Rev. 2020, 210, 103346. [Google Scholar] [CrossRef]
  21. Kokhanovsky, A.; Box, J.E.; Vandecrux, B.; Mankoff, K.D.; Lamare, M.; Smirnov, A.; Kern, M. The determination of snow albedo from satellite measurements using fast atmospheric correction technique. Remote Sens. 2020, 12, 234. [Google Scholar] [CrossRef] [Green Version]
  22. Gorshelev, V.; Serdyuchenko, A.; Weber, M.; Chehade, W.; Burrows, J.P. High spectral resolution ozone absorption cross-sections—Part 1: Measurements, data analysis and comparison with previous measurements around 293 K. Atmos. Meas. Tech. 2014, 7, 609–624. [Google Scholar] [CrossRef] [Green Version]
  23. Gorelick, N.; Hancher, M.; Dixon, M.; Ilyushchenko, S.; Thau, D.; Moore, R. Google Earth Engine: Planetary-scale geospatial analysis for everyone. Remote Sens. Environ. 2017, 202, 18–27. [Google Scholar] [CrossRef]
  24. Picard, G.; Libois, Q.; Arnaud, L. Refinement of the ice absorption spectrum in the visible using radiance profile measurements in Antarctic snow. Cryosphere 2016, 10, 2655–2672. [Google Scholar] [CrossRef] [Green Version]
  25. Warren, S.; Brand, R.E. Optical constants of ice from the ultraviolet to the microwave: A revised compilation. J. Geophys. Res. 2008, 113, D14. [Google Scholar] [CrossRef]
  26. Kokhanovsky, A.; Iodice, F.; Lelli, L.; Zschaege, A.; De Quattro, N.; Gasbarra, D.; Retscher, C. Retrieval of total ozone column using high spatial resolution top-of-atmosphere measurements by OLCI/S-3 in the ozone Chappuis absorption bands over bright underlying surfaces. J. Quant. Spectr. Rad. Transf. 2021, 276, 107903. [Google Scholar] [CrossRef]
  27. Pommereau, J.-P.; Goutail, F. O3 and NO2 ground-based measurements by visible spectrometry during arctic winter and spring 1988. Geophys. Res. Lett. 1988, 15, 891–894. [Google Scholar] [CrossRef]
  28. Sarkissian, A.; Vaughan, G.; Roscoe, H.K.; Bartlett, L.M.; O’Connor, F.; Drew, D.G.; Hughes, P.A.; Moore, D.M. Accuracy of measurements of total ozone by a SAOZ ground-based zenith sky visible spectrometer. J. Geophys. Res. 1997, 102, 1379–1390. [Google Scholar] [CrossRef]
  29. Kokhanovsky, A. Snow broadband albedo. Front. Environ. Sci. 2021, 9, 443. [Google Scholar] [CrossRef]
  30. Iqbal, M. An Introduction to Solar Radiation; Academic Press: New York, NY, USA, 1983; p. 101. [Google Scholar]
  31. Savastiouk, V.; McErloy, C.T. Calculating air mass factors for ozone and Rayleigh air mass factor calculations for ground—based spectrometers. In Proceedings of the Quadrennial Ozone Symposium, Kos, Greece, 1–8 June 2004. [Google Scholar] [CrossRef]
  32. Picard, G.; Libois, Q.; Arnaudt, L.; Vérin, G.; Dumont, M. Development and calibration of an automatic spectral albedometer to estimate near-surface snow SSA time series. Cryosphere 2016, 10, 1297–1316. [Google Scholar] [CrossRef] [Green Version]
  33. Picard, G.; Libois, Q.; Arnaudt, L.; Vérin, G.; Dumont, M. Time-Series of Snow Spectral Albedo and Superficial Snow Specific Surface Area at Dome C in Antarctica, 2012–2015. PANGAEA. 2016. Available online: https://tc.copernicus.org/articles/10/1297/2016/tc-10-1297-2016-assets.html (accessed on 1 November 2021). [CrossRef]
  34. Gascoin, S.; Grizonnet, M.; Bouchet, M.; Salgues, G.; Hagolle, O. Theia snow collection: High-resolution operational snow cover maps from Sentinel-2 and Landsat-8 data. Earth Syst. Sci. Data 2019, 11, 493–514. [Google Scholar] [CrossRef] [Green Version]
  35. Gascoin, S.; Barrou Dumont, Z.; Deschamps-Berger, C.; Marti, F.; Salgues, G.; López-Moreno, J.I.; Revuelto, J.; Michon, T.; Schattan, P.; Hagolle, O. Estimating fractional snow cover in open terrain from Sentinel-2 using the Normalized Difference Snow Index. Remote Sens. 2020, 12, 2904. [Google Scholar] [CrossRef]
  36. Kokhanovsky, A.; Di Mauro, B.; Garzonio, R.; Colombo, R. Retrieval of dust properties from spectral snow reflectance measurements. Front. Environ. Sci. 2021, 9, 42. [Google Scholar] [CrossRef]
  37. Kokhanovsky, A. Snow Optics; Springer Nature: Cham, Switzerland, 2021. [Google Scholar]
  38. Kokhanovsky, A.; Tomasi, C.; Smirnov, A.; Herber, A.; Neuber, R.; Ehrlich, A.; Lupi, A.; Petkov, B.H.; Mazzola, M.; Ritter, C.; et al. Remote sensing of Arctic atmospheric aerosols. In Physics and Chemistry of the Arctic Atmosphere; Kokhanovsky, A., Tomasi, C., Eds.; (Springer Polar Sciences); Springer: Cham, Switzerland, 2020; pp. 505–590. [Google Scholar]
Figure 1. The fit of MSI spectral reflectance over Dome C (Antarctica) (see Equation (4)). The MSI/ S-2 TOA reflectance observations were performed on 3 November 2020 during the ozone hole occurrence [26].
Remotesensing 13 04404 g001
Figure 2. The total ozone column retrieved using MSI/S-2 observations and also other ground and satellite observations (see Table 3) at DOME C (Antarctica) on November–December 2020. The data derived from the ECMWF re-analysis is given as well.
Remotesensing 13 04404 g002
Figure 3. (a,b) The snow spectral plane albedo derived from dual—channel (443 and 865 nm) satellite (blue line) and ground (red) measurements. The measurements were performed on 9 December 2016 at Dome C in Antarctica. The satellite-derived snow albedo is provided on the spectral grid 10 nm. The right panel gives the plane albedo in a broader spectral range not covered by ground measurements.
Remotesensing 13 04404 g003
Figure 4. The intercomparison of plane albedo derived from ground measurements on 5 February 2018 and satellite measurements on 4 and 6 February 2018.
Remotesensing 13 04404 g004
Table 1. The specification of the MSI spectral channels. Band 9 is useful for the total water vapor column estimation and band 10 is used for the detection of Cirrus clouds. Bands 1–8 are used in atmospheric correction procedures. Bands 11 and 12 can be used to distinguish cloud and clear sky snow fields.
Sentinel-2 BandsSentinel-2ASentinel-2B
Central Wavelength (nm)Bandwidth (nm)Central Wavelength (nm)Bandwidth (nm)Spatial Resolution (m)
Band 1442.721442.22160
Band 2492.466492.16610
Band 3559.8365593610
Band 4664.631664.93110
Band 5704.115703.81620
Band 6740.515739.11520
Band 7782.820779.72020
Band 8832.8106832.910610
Band 8A864.7218642220
Band 9945.120943.22160
Band 101373.5311376.93060
Band 111613.7911610.49420
Band 122202.41752185.718520
Table 2. The parameters used in Equation (5).
α b , c m 1 α c , c m 1 C a b s , b ,   c m 2 / m o l e c u l e
7.48 × 10 4 3.49 × 10 2 3.87 × 10 21
Table 3. The instrumentation used in the determination of the total ozone column temporal changes over Dome C (Antarctica) shown in Figure 2. Further details on the satellite instrumentation used are given in [26] .
InstrumentAbbreviationSpatial Resolution
Global Ozone Monitoring ExperimentGOME-2 80 × 40 km
Ozone Mapping and Profiling SuiteOMPS 50 × 50 km
Ozone Monitoring InstrumentOMI 13 × 24 km
TROPOsphere Monitoring InstrumentTROPOMI 7 × 3.5   km
Ocean and Land Colour InstrumentOLCI 0.3 × 0.3 km
Multi Spectral ImagerMSI from   0.01 × 0.01 km
till   0.06   × 0.06 km (dependent on the channel, see Table 1)
Système d’Analyse par Observations Zénithales (morning ground observations)SAOZ-1ground zenith sky transmittance measurements (morning)
Système d’Analyse par Observations Zénithales (evening ground observations)SAOZ-2ground zenith sky transmittance measurements (evening)
Table 4. The time of satellite/ground albedo retrievals/measurements over Dome C (Antarctica) shown in Figure 3 and Figure 4. Further details on the ground measurements are given in [7]. The satellite SZA was in the range 65–67 degrees and ground measurements were performed at SZA = 71.6 degrees. The vale of d e f for the case of ground Autosolex measurements have been retrieved using the same approach as dicussed above for spacebrone observations.
Date Time   ( UTC )   d e f ( mm ) Instrument
4 February 201800:17     0.21MSI
4 February 201823:38     0.32MSI
5 February 201822:50     0.21Autosolexs
6 February 201800:07     0.21MSI
6 February 201823:47     0.36MSI
Publisher’s Note: MDPI stays neutral with regard to jurisdictional claims in published maps and institutional affiliations.

