the Creative Commons Attribution 4.0 License.
the Creative Commons Attribution 4.0 License.
 | 15 Nov 2023
Southern Hemisphere atmospheric history of carbon monoxide over the late Holocene reconstructed from multiple Antarctic ice archives
Xavier Faïn
David M. Etheridge
Kévin Fourteau
Patricia Martinerie
Cathy M. Trudinger
Rachael H. Rhodes
Nathan J. Chellman
Ray L. Langenfelds
Joseph R. McConnell
Mark A. J. Curran
Edward J. Brook
Thomas Blunier
Grégory Teste
Roberto Grilli
Anthony Lemoine
William T. Sturges
Boris Vannière
Johannes Freitag
Jérôme Chappellaz
Carbon monoxide (CO) is a naturally occurring atmospheric trace gas, a regulated pollutant, and one of the main components determining the oxidative capacity of the atmosphere. Evaluating climate–chemistry models under different conditions than today and constraining past CO sources requires a reliable record of atmospheric CO mixing ratios ([CO]) that includes data since preindustrial times. Here, we report the first continuous record of atmospheric [CO] for Southern Hemisphere (SH) high latitudes over the past 3 millennia. Our continuous record is a composite of three high-resolution Antarctic ice core gas records and firn air measurements from seven Antarctic locations. The ice core gas [CO] records were measured by continuous flow analysis (CFA), using an optical feedback cavity-enhanced absorption spectrometer (OF-CEAS), achieving excellent external precision (2.8–8.8 ppb; 2σ) and consistently low blanks (ranging from 4.1±1.2 to 7.4±1.4 ppb), thus enabling paleo-atmospheric interpretations. Six new firn air [CO] Antarctic datasets collected between 1993 and 2016 CE at the DE08-2, DSSW19K, DSSW20K, South Pole, Aurora Basin North (ABN), and Lock-In sites (and one previously published firn CO dataset at Berkner) were used to reconstruct the atmospheric history of CO from ∼1897 CE, using inverse modeling that incorporates the influence of gas transport in firn. Excellent consistency was observed between the youngest ice core gas [CO] and the [CO] from the base of the firn and between the recent firn [CO] and atmospheric [CO] measurements at Mawson station (eastern Antarctica), yielding a consistent and contiguous record of CO across these different archives. Our Antarctic [CO] record is relatively stable from −835 to 1500 CE, with mixing ratios within a 30–45 ppb range (2σ). There is a ∼5 ppb decrease in [CO] to a minimum at around 1700 CE during the Little Ice Age. CO mixing ratios then increase over time to reach a maximum of ∼54 ppb by ∼1985 CE. Most of the industrial period [CO] growth occurred between about 1940 to 1985 CE, after which there was an overall [CO] decrease, as observed in Greenland firn air and later at atmospheric monitoring sites and attributed partly to reduced CO emissions from combustion sources. Our Antarctic ice core gas CO observations differ from previously published records in two key aspects. First, our mixing ratios are significantly lower than reported previously, suggesting that previous studies underestimated blank contributions. Second, our new CO record does not show a maximum in the late 1800s. The absence of a [CO] peak around the turn of the century argues against there being a peak in Southern Hemisphere biomass burning at this time, which is in agreement with (i) other paleofire proxies such as ethane or acetylene and (ii) conclusions reached by paleofire modeling. The combined ice core and firn air [CO] history, spanning −835 to 1992 CE, extended to the present by the Mawson atmospheric record, provides a useful benchmark for future atmospheric chemistry modeling studies.
- Article
(2535 KB) - Full-text XML
-
Supplement
(1773 KB) - BibTeX
- EndNote


CO is a reactive trace gas that plays a crucial role in the interactions between climate and atmospheric chemistry. CO acts on the budgets of both hydroxyl radical (OH) and ozone (O3) and thus has a strong impact on the global oxidative capacity of the atmosphere. With up to 40 % of the OH radicals reacting with CO in the modern troposphere (Lelieveld et al., 2016), CO is the principal sink for tropospheric OH. Consequently, CO indirectly affects the lifetime of many atmospheric constituents such as methane (CH4), volatile organic compounds (VOCs), and hydrofluorocarbons (HCFCs). Oxidation of CO by OH in the presence of high levels of nitrogen oxides (NOx) can result in significant production of tropospheric ozone and ultimately leads to CO2 production (Crutzen, 1973).
CO is produced by atmospheric oxidation of different gaseous precursors and emitted by various surface processes. Atmospheric oxidation of CH4 and VOCs represents about half of the modern sources (Duncan et al., 2007). Modern terrestrial sources mainly include biomass burning (van der Werf et al., 2017) and incomplete combustion of anthropogenic fossil fuels and biofuels (Hoesly et al., 2018). Minor contributions come from the ocean (Conte et al., 2019) and plant leaves (Tarr et al., 1995; Bruhn et al., 2013). Oxidation by OH is the dominant sink of CO, which results in a modern mean global CO tropospheric lifetime of about 2 months (Khalil et al., 1999). However, CO lifetime strongly varies with latitude and season, ranging from 20–40 d in the tropics to up to 3 months in polar areas (Duncan et al., 2007). In the preindustrial (PI) period, CO emissions from fossil fuel combustion and oxidation of anthropogenic VOCs were negligible, and limited variations in the methane oxidation CO source were likely as a consequence of relatively stable atmospheric CH4 mixing ratios. Thus, the variation in the PI CO budget is expected to be driven principally by biomass burning and oxidation of biogenic VOCs (BVOCs), thereby providing an opportunity to use PI atmospheric CO to reconstruct past biomass burning.
Vegetation fires are an important component of the climate system. Fire emissions affect atmospheric chemistry and composition, biogeochemical cycling, radiative balance, or surface albedo (Archibald et al., 2018; Bowman et al., 2009). Biomass burning is also a major driver of vegetation changes and of ecosystem dynamics (Bond et al., 2005). In return, changes in climate (e.g., variations in temperature or precipitation) drive changes in fire and changes in vegetation that provide the fuels for fire. Understanding past fire dynamics is required to improve understanding of the climate–fire relationship on centennial and millennial timescales, which will be essential to project future biomass burning and climate change. There is still a debate about how biomass burning emissions varied in the past and the extent to which humans have impacted the natural fire system (Vannière et al., 2016).
Numerous proxies, exhibiting varying atmospheric lifetimes and consequently different footprints, have been investigated to reconstruct past biomass burning. These proxies, which include Southern Hemisphere (SH) reconstructions of Antarctic [CO] (Wang et al., 2010; Haan and Raynaud, 1998; Haan et al., 1996), generally suggest that SH biomass burning was high during the medieval period (MP) spanning 1000–1500 CE, with a decrease in burning during the 1400–1500 CE period and reaching a minimum some time during the 1600–1800 CE cool period (Little Ice Age or LIA). However, there are inconsistencies between different records regarding the timing and magnitude of changes during the last 3 centuries (i.e., the transition from the LIA to industrial times). The Wang et al. (2010) dataset suggests that, following the LIA minimum, biomass burning emissions increased rapidly during the 1700s and 1800s and peaked during the late 19th century at a level roughly 3 to 4 times the modern ones. By contrast, other fire proxies such as ethane (Nicewonger et al., 2018), acetylene (Nicewonger et al., 2020a) or black carbon (Liu et al., 2021; McConnell et al., 2021) indicate that the SH biomass burning remained low throughout the 1800s. Improving our understanding of past burning variability requires more fire paleorecords. Specifically, new [CO] records from Antarctic ice archives are needed to document biomass burning history in the SH.
Ground-based and satellite-derived CO data are only available for the last 3–4 decades. Ancient air preserved in glacial ice and firn is thus a unique archive for reconstructing the past atmospheric [CO] record prior to the 1990s. Firn is the upper layer of an ice sheet where snow is slowly transformed into ice. A large amount of air can be sampled from the interconnected open pores of the firn. Mean ages of atmospheric gases increase with firn depth. An analysis of air trapped in bubbles in solid ice below the firn layer is required to extend reconstructions further back in time. Over the last decade, continuous flow analysis (CFA) of ice core CO mixing ratios utilizing laser spectroscopy have become a new tool in paleoclimatology (Faïn et al., 2014, 2022). The CFA-based [CO] measurements exhibit excellent external precision and achieve consistently low blank levels, with absolute calibration enabling paleo-atmospheric interpretations. Faïn et al. (2022) applied CFA to multiple Greenland ice cores, allowing for the reconstruction of an atmospheric trend for the Northern Hemisphere CO over the past 300 years.
In this study, we report [CO] firn air depth profiles from seven Antarctic sites and continuous CO data measured on a set of five Antarctic ice cores. By combining the analysis conducted on these archives, we build a new composite record of atmospheric [CO] in the SH for the last 3 millennia. This new dataset is compared with [CO] data previously published (Wang et al., 2010; Haan et al., 1996; Haan and Raynaud, 1998), where the latter study suggested an increase of about 100 % in biomass burning by the late 1800s and with other biomass burning proxies. We focus on interpreting the preindustrial trends in atmospheric [CO] largely related to biomass burning and BVOC oxidation sources. Climate–chemistry models and/or Earth system models can produce simulated atmospheric [CO] at ground level in Antarctica from the PI era to present day. Such models are evaluated presently within the Aerosol Chemistry Model Intercomparison Project (AerChemMIP; Collins et al., 2017). Comparing the past evolution of Antarctic atmospheric [CO] extracted from ice archives for the specific period covering 1850 to the present day with AerChemMIP model simulations is out of the scope of this paper. Such a comparison, which should also provide improved constraints on inventories of CO emissions, will be addressed in a future study.
2.1 Firn air samples
Firn air samples used in this study were recovered between 1993 and 2016 from seven different Antarctic sites, namely Lock-In (LI), Berkner Island (BKN), DE08-2, DSSW20K, DSSW19K, Aurora Basin North (ABN), and South Pole (SP) (Fig. S1). Site descriptions are reported in Table 1. The LI site is located 136 km away from Concordia Station (Dome C) along the traverse road joining the Concordia and Dumont d'Urville stations (Fourteau et al., 2019). BKN is an island surrounded by the Filchner–Ronne Ice Shelf (Assonov et al., 2007). ABN is located in inland eastern Antarctica, approximately mid-distance between the coast and Dome C, in the Indian Ocean sector. DE08-2, DSSW20K, and DSSW19K are located within 20 km of the Law Dome summit, about 120 km southeast of Casey Station (Etheridge et al., 1996; Trudinger et al., 2002).
Table 1Locations, site characteristics, and other relevant information for firn air sampling sites featured in this study. The deepest levels may have experienced contamination during sampling and may not be suitable for paleo-atmospheric interpretations.
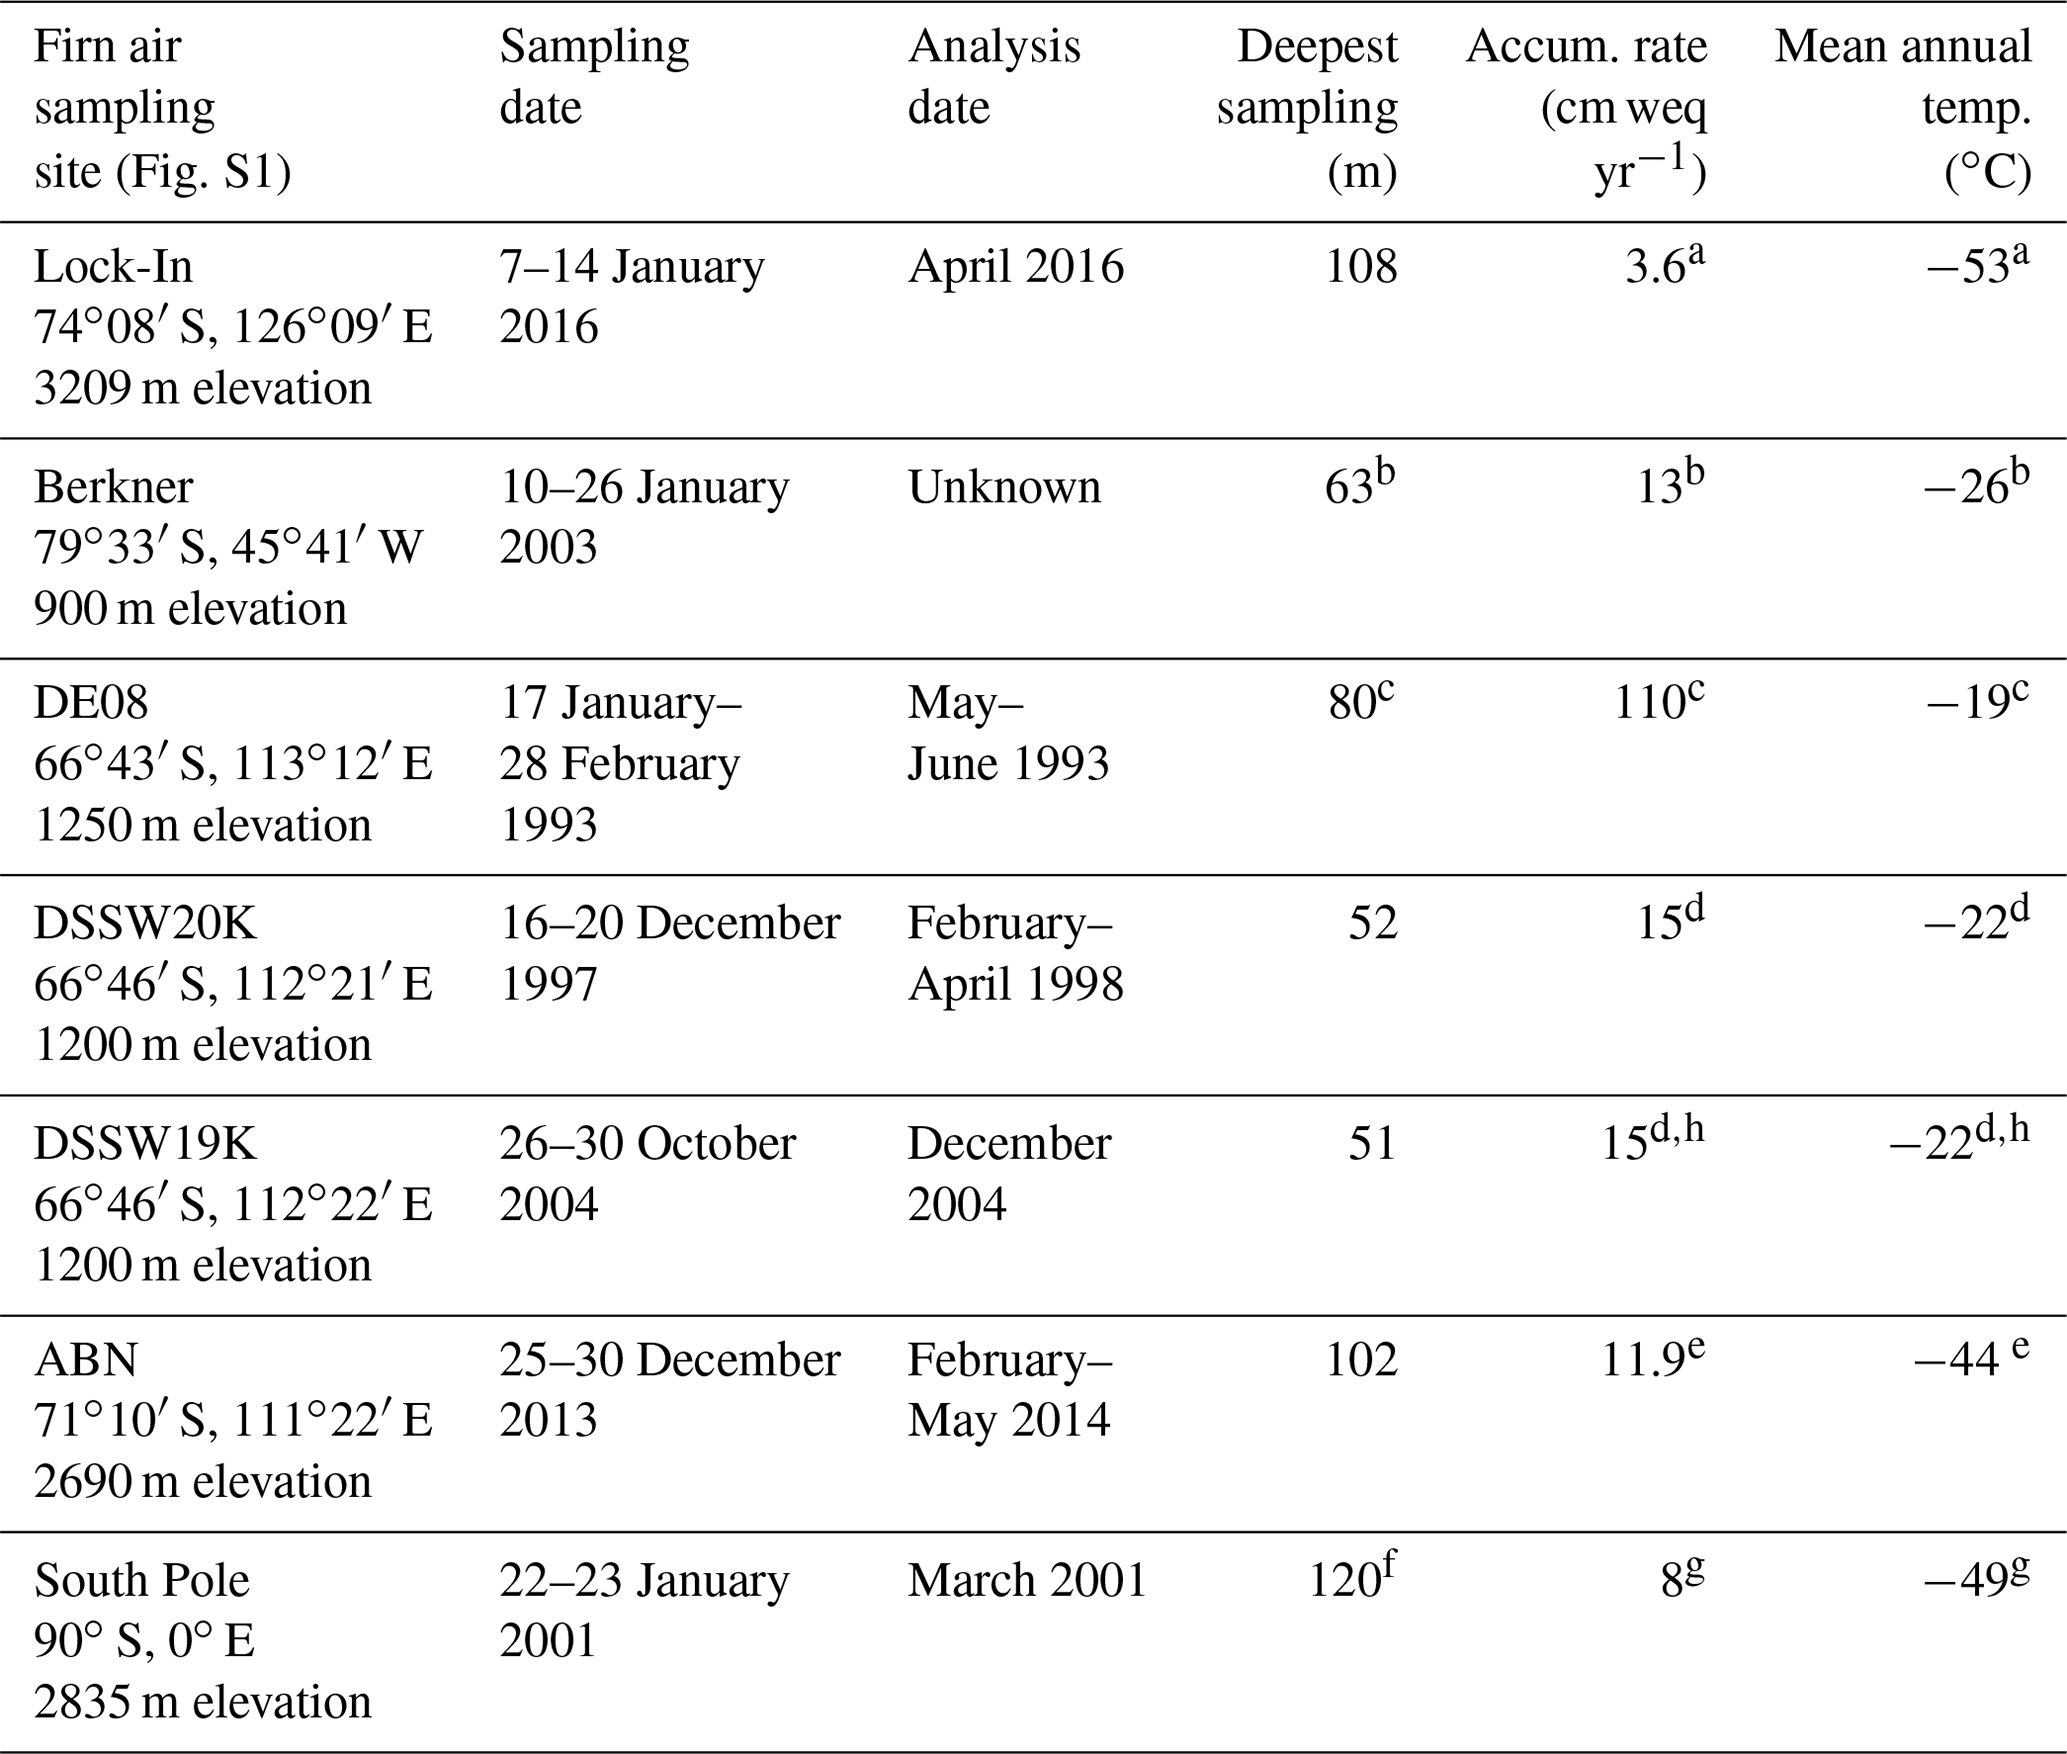
a Fourteau et al. (2019); b Mulvaney et al. (2002); c Etheridge et al. (1996); d Trudinger et al. (2002); e Servettaz et al. (2020); f Butler et al. (2001); g Battle et al. (1996); h Trudinger et al. (2016).
2.2 Firn air sampling
The firn air extraction technique was originally described by Schwander et al. (1993). Briefly, at each site, a shallow ice core drill progressively penetrates the firn column, stopping every few meters to allow the recovery of the firn air, using a firn air sampling device (FASD). Firn air is sampled at intervals of about 10 m from the surface down to the beginning of the lock-in zone, where the age of the gases increases more rapidly. Within the lock-in zone, firn air sampling is typically conducted at intervals of 1–3 m. At each sampled depth, the borehole is sealed by the FASD's inflatable rubber bladder. Two continuous tubes (commonly made of Dekabon, with 0.25 in. (6.35 mm) internal diameter) pass through the bladder and its end caps. At BKN, LI, ABN, and SP, a “Bender baffle” (e.g., Assonov et al., 2007) was attached below the lower-end caps of the bladder for venting firn air in direct contact with the bladder, while the sample line below the baffle is directed towards gas analyzers and canisters (Schwander et al., 1993).
CO sampling from the BKN firn is described by Assonov et al. (2007). The samples collected at the deepest levels of the BKN site were likely contaminated by a leak in the pumping system (Worton et al., 2007) and thus are not included in this study.
Firn air sampling techniques at DE08-2, DSSW19K, DSSW20K, and SP are reported by Etheridge et al. (1996), Sturrock et al. (2002), and Rubino et al. (2019). Only two depths (surface and 119 m) at the SP station were available for our analysis due to a sample pump failure (previous studies have reported full depth profiles for other gases; e.g., Battle et al., 1996).
At LI and ABN, the CO2, CO, and CH4 mixing ratios of the extracted firn air were continuously monitored. Specifically, [CO2] was monitored using an infrared analyzer (LI-COR, LI-7000), and [CO] and [CH4] were monitored with an optical analyzer (SARA; optical feedback cavity-enhanced absorption spectrometer (OF-CEAS); Morville et al., 2005). These real-time measurements were used to indicate when uncontaminated air was extracted from the borehole, and thus samples were only collected when CO2, CO, and CH4 were stable and below modern ambient levels.
Measurements of ambient air at the DE08-2, DSSW19K, DSSW20K, SP, ABN, and LI sites sampled through the FASD were in agreement with concomitant measurements of atmospheric air samples collected at Mawson Station and collected at the site (typically 1 ppb or smaller discrepancy), suggesting minimal air contamination or loss of CO during firn air sampling. The measurement uncertainty is further discussed in Sect. S1 in the Supplement.
2.3 Firn air CO analysis
The DE08-2, DSSW20K, DSSW19K, SP, and ABN firn air samples were analyzed at CSIRO by gas chromatography using a Trace Analytical reduction gas analyzer (Langenfelds et al., 2023). Only containers that demonstrated reliable storage for CO were used (glass flasks and electropolished stainless steel tanks), and small time-dependent corrections (e.g., −0.0058 ppb d−1 in CSIRO (Commonwealth Scientific and Industrial Research Organisation) 0.5 L glass flasks fitted with PFA O-rings and −0.0030 ppb d−1 or smaller for electropolished stainless-steel tanks) were applied to allow for the remaining drift in [CO] between sample collection and analysis. Uncertainty in the CSIRO flask data, including experimental precision and correction for storage, was generally within ±1 ppb. LI firn air was collected in 3 L stainless-steel canisters (SilcoCan) pressurized to 3 bar. However, such pressure could not always be reached at the deepest levels sampled, where most of the firn porosity was fully closed. LI samples were measured at IGE (Institute of Environmental Geosciences, France) in April 2016 (i.e., 4 months after field collection), using a SARA analyzer (Morville et al., 2005). A subset of LI canisters was reanalyzed 6 months later, demonstrating no [CO] drift related to storage. The BKN firn air was analyzed for [CO] at MPI (Max Planck Institute for Chemistry, Mainz, Germany), using accurate volumetric determination (Brenninkmeijer et al., 2001), along with CO isotopic ratios (Assonov et al., 2007).
Firn air [CO] analyses conducted at CSIRO are reported on the CSIRO2020 CO calibration scale (see the Supplement for more details). LI firn air [CO] measurements conducted at IGE are reported on the World Meteorological Organization (WMO)-X2014 scale. A comparison of CSIRO2020 and WMO-X2014 scales, based on NOAA analysis in 2015–2016 of CSIRO's primary standard samples, indicates their consistency within about ±1 ppb over the 28–487 ppb range (Langenfelds et al., 2023). The BKN CO dataset is reported on the MPI scale, which was 8 % higher than the WMO CO_X2004A scale when BKN firn air was analyzed (Assonov et al., 2007). The WMO-X2004 scale gives ∼1 ppb lower values for [CO] below 200 ppb compared to the WMO-X2014 scale, with [CO] values reported by Assonov et al. (2007) as all being below 200 ppb. Uncertainties reported in this study for BKN firn air [CO] account for calibration-scale differences.
2.4 Modeling trace gas transport in firn
Due to diffusive mixing, the composition of firn air at any depth does not correspond exactly to the atmospheric composition at a specific time in the past; rather, it is a mix of air over a range of past times, so it corresponds to a distribution of ages (Schwander et al., 1993). Molecular diffusion through the open porosity of firn, followed by porosity closure, results in increasing gas ages and gas age distribution widths with depth in the firn. Trace-gas records in ice cores are further smoothed by progressive gas enclosure into individual bubbles. Models of gas transport in firn (e.g., Buizert et al., 2012; Witrant et al., 2012; Trudinger et al., 2013) take these effects, and more generally the firn physics, into account and thereby allow the reconstruction of past atmospheric variations.
In this study, we use the IGE-GIPSA and the CSIRO firn air transport models and inverse models to reconstruct the temporal evolution of CO mixing ratio from our firn depth profiles (Sect. 2.1). The physical bases of the IGE-GIPSA and the CSIRO firn models are described in Witrant et al. (2012) and Trudinger et al. (1997, 2013), respectively. Briefly, these models include molecular diffusion, gravitational settling, and advection of air due to firn sinking. Firn models use a site-specific diffusivity–depth profile, which is tuned using reference gases that have well-constrained past atmospheric trends (major greenhouse gases and anthropogenic halocarbons). Diffusivity tuning for our seven firn sites has been described in previous studies (Witrant et al., 2012; Trudinger et al., 2013; Yeung et al., 2019). The diffusivity–depth profile for DSSW19K was assumed to be the same as for DSSW20K, due to their close proximity.
Two different inverse approaches are used to reconstruct atmospheric trends of CO from the firn observations. The IGE-GIPSA inverse model is based on the transfer function approach by Rommelaere et al. (1997) and uses a new definition of the optimal solution (Witrant and Martinerie, 2013) intended to favor robustness (Lukas, 2008). It has already been used to reconstruct several atmospheric trends of trace gas mixing ratios and isotopic ratios (e.g., Helmig et al., 2014; Laube et al., 2016; Trudinger et al., 2016; Yeung et al., 2019, and references therein). The seasonal CO cycle is damped in the firn due to diffusive mixing. The summer minimum is reflected by low near-surface values, and the seasonality variation quickly damps with depth so that below about 30 m depth, the CO firn signal mostly reflects annual mean variations (Wang et al., 2012; Petrenko et al., 2013). The IGE-GIPSA inverse firn model cannot reconstruct the CO seasonality (Wang et al., 2012); therefore, CO measurements above a depth of 30 to 40 m, depending on the site investigated, were excluded from the model input. Modeling several firn sites simultaneously to reconstruct a single atmospheric trend provides a much stronger constraint than a single firn site and allows the evaluation of the consistency of the firn datasets. Best constraints are obtained when simultaneously modeling firn sites with very different physical characteristics (temperature, snow accumulation rate, etc.) and drilling dates, which is the case for our sites. The model can use data from firn air pumping and ice core analysis simultaneously, and here we link our reconstruction, based on the firn measurements to the shallowest measurements of the ice core record. Trace gas records in ice are affected by an additional smoothing process compared to firn air because bubbles in an ice sample close at a range of times. This process is less well constrained than trace gas transport in firn (e.g., Fourteau et al., 2020) but is driven primarily by the snow accumulation rate, which controls the firn sinking speed. Similar to the approach in Yeung et al. (2019), we use synthetic data points in BKN ice (at 70, 71, 72, 73, and 74 m depth) to simulate the constraint from ice core data. BKN is used as a substitute for the ABN site, which has almost the same accumulation rate. The Green's function approach was used to calculate mean gas ages at the selected depth levels in BKN ice, then CO mixing ratios at the same gas age in the multi-site spline fit, ranging between 1862 and 1889 CE, were used to build the five synthetic data points (Fig. S8).
The CSIRO inverse model used here is based on the Bayesian synthesis inversion described in Trudinger et al. (2002, 2016) but formulated to infer annual mixing ratios rather than annual sources. As with the IGE-GIPSA inverse model, the CSIRO inverse model infers a single atmospheric trend from multiple firn datasets modeled simultaneously. Both inverse models use Green's functions, which represent gas age distributions, to relate the mixing ratio of a trace gas at the measurement depths to the atmospheric mixing ratio of that gas over a range of times (Rommelaere et al., 1997; Trudinger et al., 2002). The modeled CO at a depth in firn can be calculated by convolving the atmospheric CO history with the relevant Green's function (assuming diffusivity versus depth is constant in time). The CSIRO inverse model takes a different approach than the IGE-GIPSA model due to the strong influence of seasonality in atmospheric CO on the upper-firn mixing ratio profile. Instead of excluding observations in the upper firn, the effect of seasonality in atmospheric CO on the firn mixing ratio profile is calculated with a forward run of the CSIRO firn model forced with the Thoning et al. (1989) fit at daily resolution to the Mawson atmospheric CO record from mid-1992 and mean seasonality calculated from the Mawson record before that. The resulting modeled mixing ratios at the observation depths are subtracted from the firn observations before they are used in the inversion, so that the inversion infers the annual values of the atmospheric CO trend up to 1992.0 (with CO from 1993.0 taken from the Mawson atmospheric record). This allows the complete profiles for firn measurements to be used. A melt layer at the DE08-2 site was observed to have been a partial barrier to firn air mixing (Trudinger et al., 1997). The melt layer is advected with the ice downwards and away from the snow surface, but this cannot be incorporated into the inversion using the Green's function representation that assumes that diffusivity versus depth is constant with time. The influence of the melt layer at DE08-2 is therefore calculated with a forward simulation of the firn model, and the result subtracted from the firn data before the inversion. The CSIRO inversion calculation is regularized by including a term in the cost function to be minimized that is the sum over all years of the change in mixing ratio from 1 year to the next, as described in Trudinger et al. (2016). At the end of the firn reconstruction, the regularization term compares the final firn reconstruction value with the 1993 to 1997 mean for Mawson. The deep SP firn sample has a small contribution from the atmospheric [CO] history before 1900 (i.e., part of the Green's function from the firn model for this SP sample extends before 1900). The CSIRO inversion can either reconstruct atmospheric [CO] from 1900, assuming constant CO before 1900 (the [CO] value inferred at 1900 is extended back in time and convolved with the part of the Green's function before 1900), or it can reconstruct atmospheric [CO] from 1898 assuming the atmospheric CO history from the ice reconstruction up to 1897 (the ice reconstruction is convolved with the part of the Green's function extending before 1898), with the regularization described above applied to the change in [CO] between the last annual ice reconstruction CO value in 1897 and the first annual firn reconstruction value in 1898 (to ensure a smooth and continuous reconstruction from ice and firn). Uncertainties in the CSIRO firn reconstruction are calculated by a bootstrap method (Trudinger et al., 2016), whereby the inversion is repeated many times with firn measurements, the Mawson atmospheric record, and the ice reconstruction (all randomly perturbed according to their uncertainties) and used with firn Green's functions drawn randomly from an ensemble of Green's functions for each site (chosen during firn model calibration to represent uncertainty in the firn model parameters). The uncertainty calculation is discussed in more detail in Sect. S2.4. The best-fit atmospheric history is calculated without any perturbations.
In this study, we apply a multi-site reconstruction inverse method to using both the IGE-GIPSA and the CSIRO models to determine the atmospheric reconstruction that fits the investigated sites for each model. Five sites (DE08-2, DSSW20K, SP, LI, and BKN) were investigated with the IGE-GIPSA model and five sites (DE08-2, DSSW20K, SP, DSSW19K, and ABN) with the CSIRO model. As different models, methodologies, and site combinations were used, the comparison of IGE-GIPSA and CSIRO model results provides insights about the robustness of our results.
2.5 Ice core samples
Five ice cores extracted from Antarctica were investigated in this study (Fig. S1). The DC12, ABN, and TALDICE (TD) ice cores (Table 2) were used to investigate the past atmospheric history of carbon monoxide over the late Holocene. Two additional Antarctic ice cores, EPICA Dronning Maud Land (EDML)-B40 and SolarIce (Fig. S1), which provided complementary, short datasets supporting paleo-atmospheric interpretations, are described in the Supplement (Table S3 and Sect. S2.6 and S2.7). High-resolution CO mixing ratios (see Sect. 2.6) were measured continuously, along with those of methane.
Table 2Locations, site characteristics, and other relevant information for ice cores featured in this study.
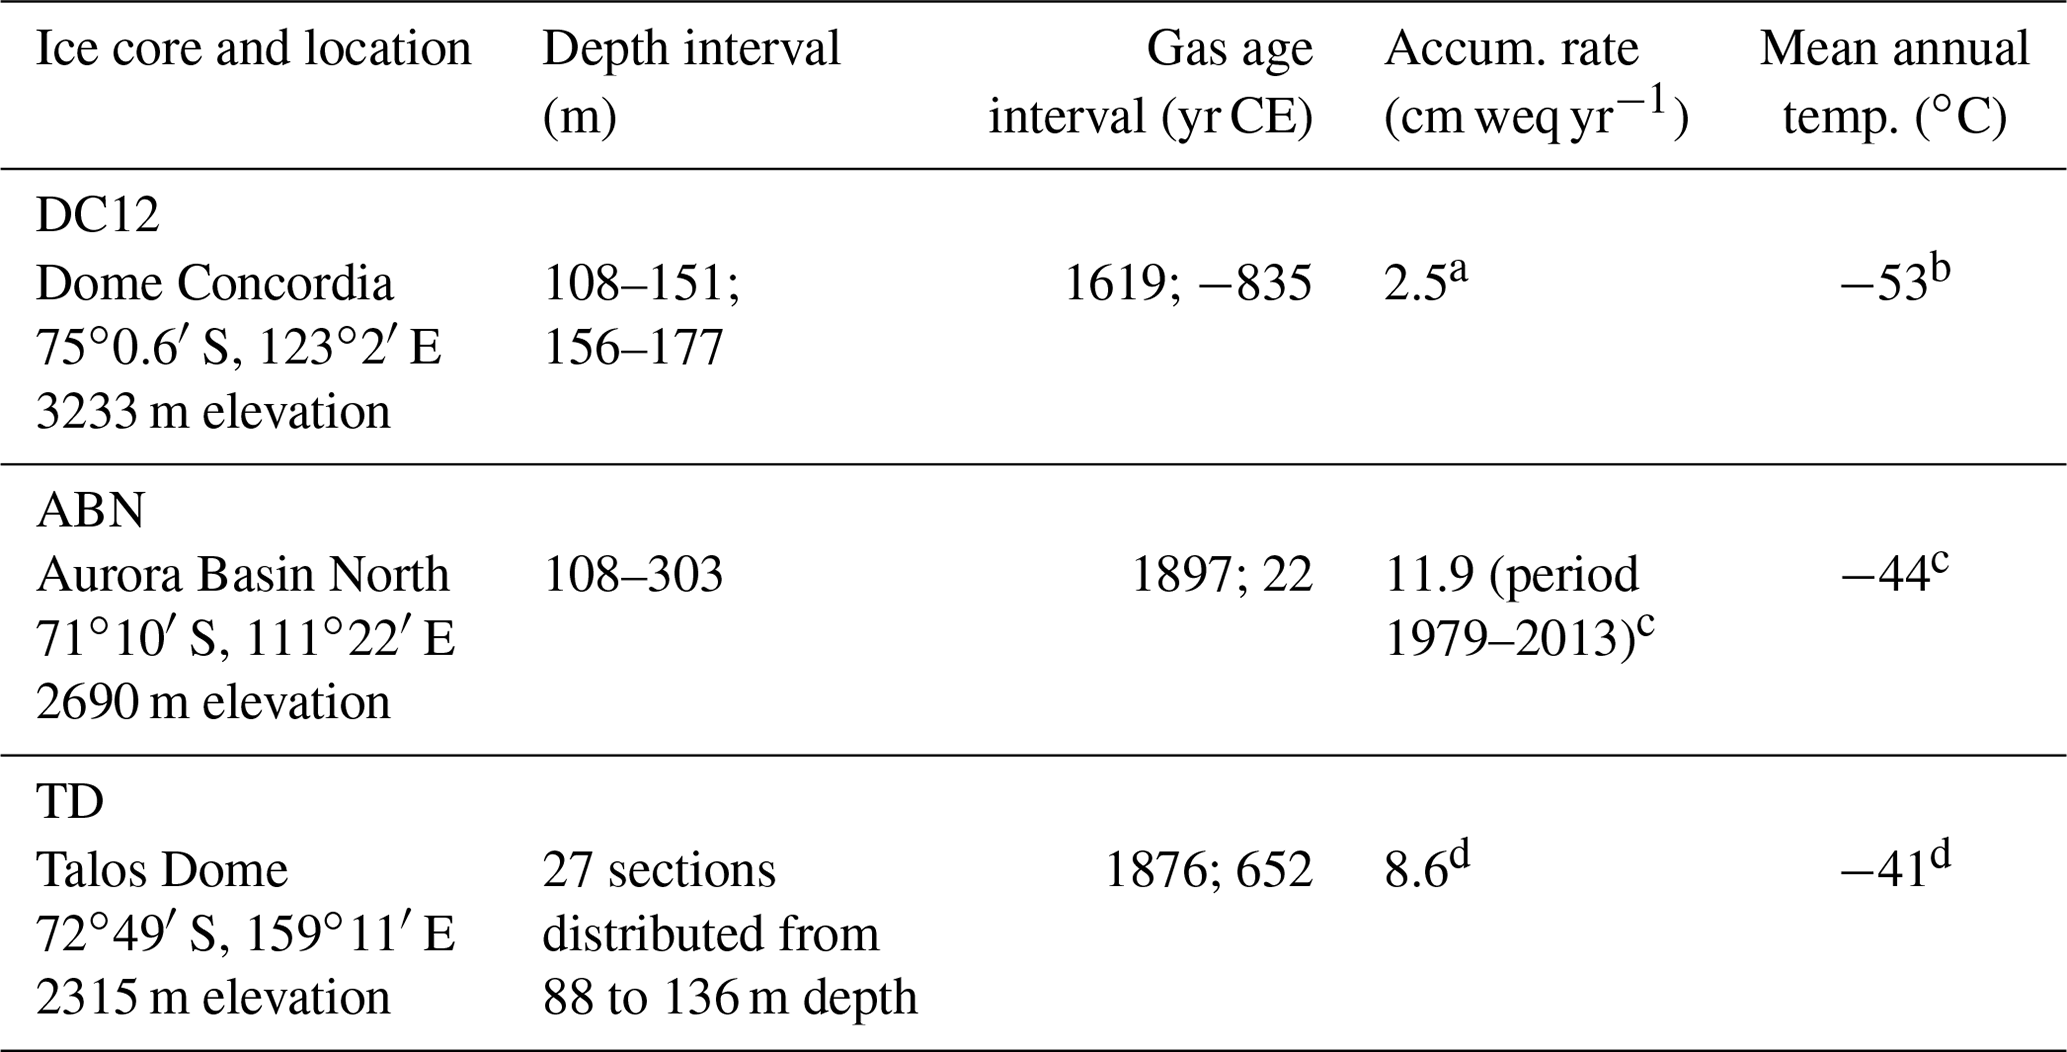
a Gautier et al. (2016); b Fabre et al. (2000); c Servettaz et al. (2020); d Stenni et al. (2002).
-
DC12 ice core. This shallow ice core was drilled in 2012 at Concordia Station (Dome C) and fully analyzed for CO mixing ratio. The continuous methane record for this shallow Dome C ice core has been reported previously (Fourteau et al., 2020).
-
ABN ice core. A single summer drilling campaign was conducted in the 2013–2014 season at the ABN site. This drilling site (Servettaz et al., 2023) is located on the lower-elevation edge of the east Antarctic Plateau, ∼500 km inland of the coastal Casey Station, which is approximately halfway to Concordia Station on Dome C (Fig. S1). The entire ABN ice core below the close off was analyzed for CO mixing ratio.
-
TALDICE ice core. The TALDICE drilling was conducted from 2004 to 2008 at Talos Dome, an ice dome on the edge of the east Antarctic Plateau and adjacent to the Victoria Land mountain (Stenni et al., 2002; Frezzotti et al., 2007). Talos Dome is located about 290 km from the Southern Ocean and 250 km from the Ross Sea. In the framework of this study, discontinuous sections spanning 19 m were analyzed.
These three sites experience accumulation rates ranging from 2.5 to 11.9 cm weq yr−1 and mean annual surface temperature between −41 and −53 ∘C (Table 2). Ice and gas chronologies for the three ice cores are described in Table S1.
2.6 CO continuous flow analyses
Over the past decade, continuous and high-resolution CFA-based CO analyses have greatly improved, including lowering the CO blank and characterizing how CO is preferentially dissolved during the CFA process so as to establish an absolute calibration (Faïn et al., 2022). The excellent precision of CO analyses has been confirmed, and the designs of CFA setups themselves have been optimized to limit the instrumental smoothing and improve signal resolution. These improvements have been reported in detail by Faïn et al. (2022), which describe CO continuous analyses of five ice cores from Greenland. Here we report the first application of this method to Antarctic ice cores.
2.6.1 System operation
The ice cores listed in Table 1 were analyzed using a continuous ice core melter system coupled with online gas measurements (Stowasser et al., 2012; Fourteau et al., 2017; Faïn et al., 2022). Ice core sticks are cut at a 34 mm × 34 mm cross section and processed on a melter head located in a cold room. The melter head is composed of inner and outer collection areas, with the inner area dedicated to sample collection. To prevent contamination, a water overflow from the inner to the outer melter head areas of >10 % is created by lowering the sample pumping speed. The water and gas bubble mixture is continuously pumped via a debubbler into a temperature-controlled gas extraction unit maintained at 30 ∘C. The gas : water volume ratio of the sample is about 10 % before the debubbler and 50 % after the debubbler. A water sample without gas bubbles is thus also available at the debubbler for complementary chemical analyses in the liquid phase. The gas is extracted along the sample line after the debubbler by applying a pressure gradient across a gas-permeable membrane (Transfer-Line degasser, IDEX Health & Science LLC.). Then, the gas is dried by a custom-made Nafion (Perma Pure) dryer. Finally, CO (and/or CH4) mixing ratios are continuously measured by a laser spectrometer.
The IDEX degassing membrane operated in this study does not recover dissolved gases from the water phase efficiently. Carbon monoxide (or methane) has higher solubility than N2 or O2. Consequently, mixing ratios of CO in the gas phase of the sample flow exhibit lower values than what exist initially in the ice bubbles. As melting ice contains ∼10 % air, a 10:90 mixture of synthetic air with known mixing ratios of CO (and/or CH4) and degassed deionized (DI) water can be introduced into the system via a four-port valve located directly after the melter head. The water is sourced from a 2 L reservoir degassed by constantly bubbling ultra-pure helium through it. The air–water mixture follows the same path through the system as the ice core sample before being analyzed by the laser spectrometer. However, it is not fully identical, as it includes more components such as an additional peristaltic pump and tubing. This pathway for synthetic standard analysis will be designated as the “calibration loop”.
The DC12 and TD ice cores were analyzed at the IGE (Grenoble, France) in 2014 during two different analytical campaigns (in June and November, respectively). The ABN core was analyzed at the Desert Research Institute (DRI, Reno, NV, USA) in October 2015, immediately after the PLACE (Greenland) core (Faïn et al., 2022) without modification of the CFA setup. Descriptions of the IGE and DRI setups are reported by Faïn et al. (2022).
A unique spectrometer (SARA; developed at Laboratoire Interdisciplinaire de Physique, Université Grenoble Alpes, France) operating optical feedback cavity-enhanced absorption spectrometry (OF-CEAS; Morville et al., 2005) was used to analyze carbon monoxide (and, simultaneously, methane) at both IGE and DRI. A detailed description of this instrument, which was used for CO measurements along Greenland ice cores is reported by Faïn et al. (2022). The OF-CEAS instrument was always carefully calibrated before melting ice cores (Sect. S1.3 in the Supplement).
2.6.2 Precision of continuous CO analyses
We apply the Allan–Werle statistical method (Allan, 1966; Werle, 1993) to the calibration loop datasets to evaluate internal precision and stability of gas–CFA measurements. Observed optimal integration time (i.e., time of lowest Allan–Werle deviation) was determined for each analytical campaign and is larger than 500 s for DRI and 1000 s for IGE CFA setups (Fig. S2). Gas data were all averaged over a 10 s integration time, allowing full resolution of the variability in the Antarctic CO records. Internal precision, defined as twice the Allan–Werle deviation at the chosen integration time, was 0.7 and 1.0 ppb for the IGE (i.e., DC12 and TD) and DRI (i.e., ABN) analytical campaigns (Table S2).
External precision of the continuous CO measurements (i.e., including all sources of errors or bias) was investigated by melting replicate Greenland ice sticks on different days on a gas CFA setup, yielding 2.8 and 8.8 ppb (2σ) for the IGE and DRI CFA setups, respectively (Sect. S1.5 in the Supplement).
2.6.3 Absolute calibration and accuracy
CFA-based gas records must be corrected for (i) analytical blanks and (ii) the under-recovery of gases dissolved in the water stream to obtain absolute values on the WMO-X2014 calibration scale. An evaluation of analytical blanks indicated 4.1 and 7.4 ppb for the IGE and DRI CFA setups, respectively (Sect. S1.6; Table S3).
The calibration loop is an appropriate approach to evaluate the magnitude of CO preferential dissolution (Faïn et al., 2022). We hypothesize that CO and methane dissolution follow the same physical laws. Consequently, if a calibration loop is able to reproduce methane preferential dissolution, then it should also reproduce CO losses related to dissolution. In the case of methane, discrete datasets allow for an external validation of this CFA for internal calibration. In this study, we extracted calibration factors for CO from calibration loop experiments for each CFA setup (see the Supplement).
Overall, CO losses driven by preferential dissolution ranged from 6.0 % to 7.4 %. Replicate measurements show that the fraction of CO not recovered at the outlet of the CFA system was very stable during analytical campaigns at both IGE and DRI. Based on repeated calibration loop measurements throughout the campaigns, we conservatively estimate the uncertainty in the solubility correction factor to be ±1 % (2σ).
2.6.4 Signal smoothing
Mixing of gases and meltwater during sample transfer from the melter head to the laser spectrometer induces a CFA experimental smoothing of the signal. The extent of the CFA-based damping was determined for each CFA setup by performing switches between synthetic mixtures of synthetic air standards of different CO mixing ratios and degassed deionized water. Cutoff wavelengths, defined as the wavelength of a sine signal experiencing a 50 % attenuation in amplitude, of 1.6 and 9.3 cm were observed for the IGE and DRI CFA setups, respectively (Table S2; see in Sect. 1.3 in the Supplement of Faïn et al., 2022, for a description of differences and similarities between DRI and IGE CFA setups).
2.6.5 Data processing
The occasional entry of ambient air into the analytical system when core breaks are encountered could cause contamination. The SARA spectrometer simultaneously measures carbon monoxide and methane mixing ratios, and such contamination events were characterized by a sharp increase in methane (ca. 1900 ppb), followed by an exponential decrease. Data were manually screened for ambient air contamination.
In this study, we report new CO records from firn air and ice cores, spatially distributed across the Antarctic Ice Sheet. In Sect. 3.1, we investigate the spatial variability in the CO mixing ratios in the modern Antarctic atmosphere. In Sect. 3.2, we describe our CO firn air and ice core records. In Sect. 3.3, we combine all records to reconstruct the evolution of the past [CO] in the Antarctic atmosphere for the last 3000 years. In Sect. 3.4, we compare this new reconstruction with other paleofire proxies, and Sect. 3.5 discusses new insights of the SH past fire history.
3.1 Spatial variability in the [CO] in the modern Antarctic atmosphere
Before combining multiple [CO] records from firn air and ice archives collected at sites spatially distributed across eastern Antarctica (Fig. S1), it is important to assess if atmospheric [CO] exhibits similar levels and trends at these sites. Monitoring of [CO] in the Antarctic atmosphere has been conducted routinely by CSIRO and NOAA (National Oceanic and Atmospheric Administration). Over recent decades, CSIRO has collected atmospheric [CO] at the Casey (Loh et al., 2021a), South Pole (Loh et al., 2021b), and Mawson stations (Loh et al., 2021c). These three stations are distributed across eastern Antarctica, with the South Pole Station located on the plateau, and Casey and Mawson stations both located on the coast (Fig. S1). Over the period spanning 1997–2020 CE, CO mixing ratio at the three CSIRO monitoring sites exhibit almost identical and highly correlated patterns (Figs. S5 and S6), as might be expected, given the absence of CO sources across Antarctica. We conclude that [CO] records extracted from firn air and ice core archives at the sites investigated in this study (Fig. S1) can be combined to produce a robust history of atmospheric [CO] in the Antarctic atmosphere. Note that the high [CO] annual mean in 2020 is observed at the three Antarctic stations and Kennaook / Cape Grim (40.7∘ S in Tasmania; Langenfelds et al., 2023) and is likely from the emissions from the 2019–2020 Australian bushfires. [CO] has since returned to the longer-term trend at these stations.
To further investigate the spatial representativity of an Antarctic record based on firn air and ice cores, we compared the [CO] outputs simulated for the year 2000 in the framework of the Atmospheric Chemistry and Climate Model Intercomparison Project (ACCMIP) exercise (Lamarque et al., 2013) and averaged over three latitudinal bands, namely 30–90, 45–90, and 70–90∘ S. The 70–90∘ S latitudinal band encompasses the Antarctic Ice Sheet. Average [CO] over the 45–90, and 70–90∘ S areas are similar, with levels of 51.9 and 51.0 ppb, respectively. An atmospheric [CO] of 54.1 ppb is simulated for the 30–90∘ S latitudinal band (i.e., about 5 % higher than [CO] simulated over Antarctica). These modeling results are in agreement with observations that the annual mean [CO] difference in CSIRO measurements between Kennaook / Cape Grim and Mawson and Casey stations since 2000 CE is only 2.2 ppb, with the coastal Antarctic stations being lower. These results suggest that the absolute CO mixing ratios derived from our datasets are not only representative of Antarctica but also more widely of the mid–high latitude Southern Hemisphere (45–90∘ S) atmosphere. Also, the temporal changes depicted by our composite record probably have a larger spatial significance, including at least the 30–90∘ S latitudinal band.
3.2 [CO] datasets
3.2.1 Firn air datasets
CO mixing ratios measured in the firn air at LI, BKN, DE08-2, DSSW19K, DSSW20K, ABN, and SP are presented as a function of depth below snow surface in Fig. 1a and b. The number of depths sampled varies among sites, with firn air collected at 15 depths at LI, and only 1 deep level measured for [CO] at SP by CSIRO.
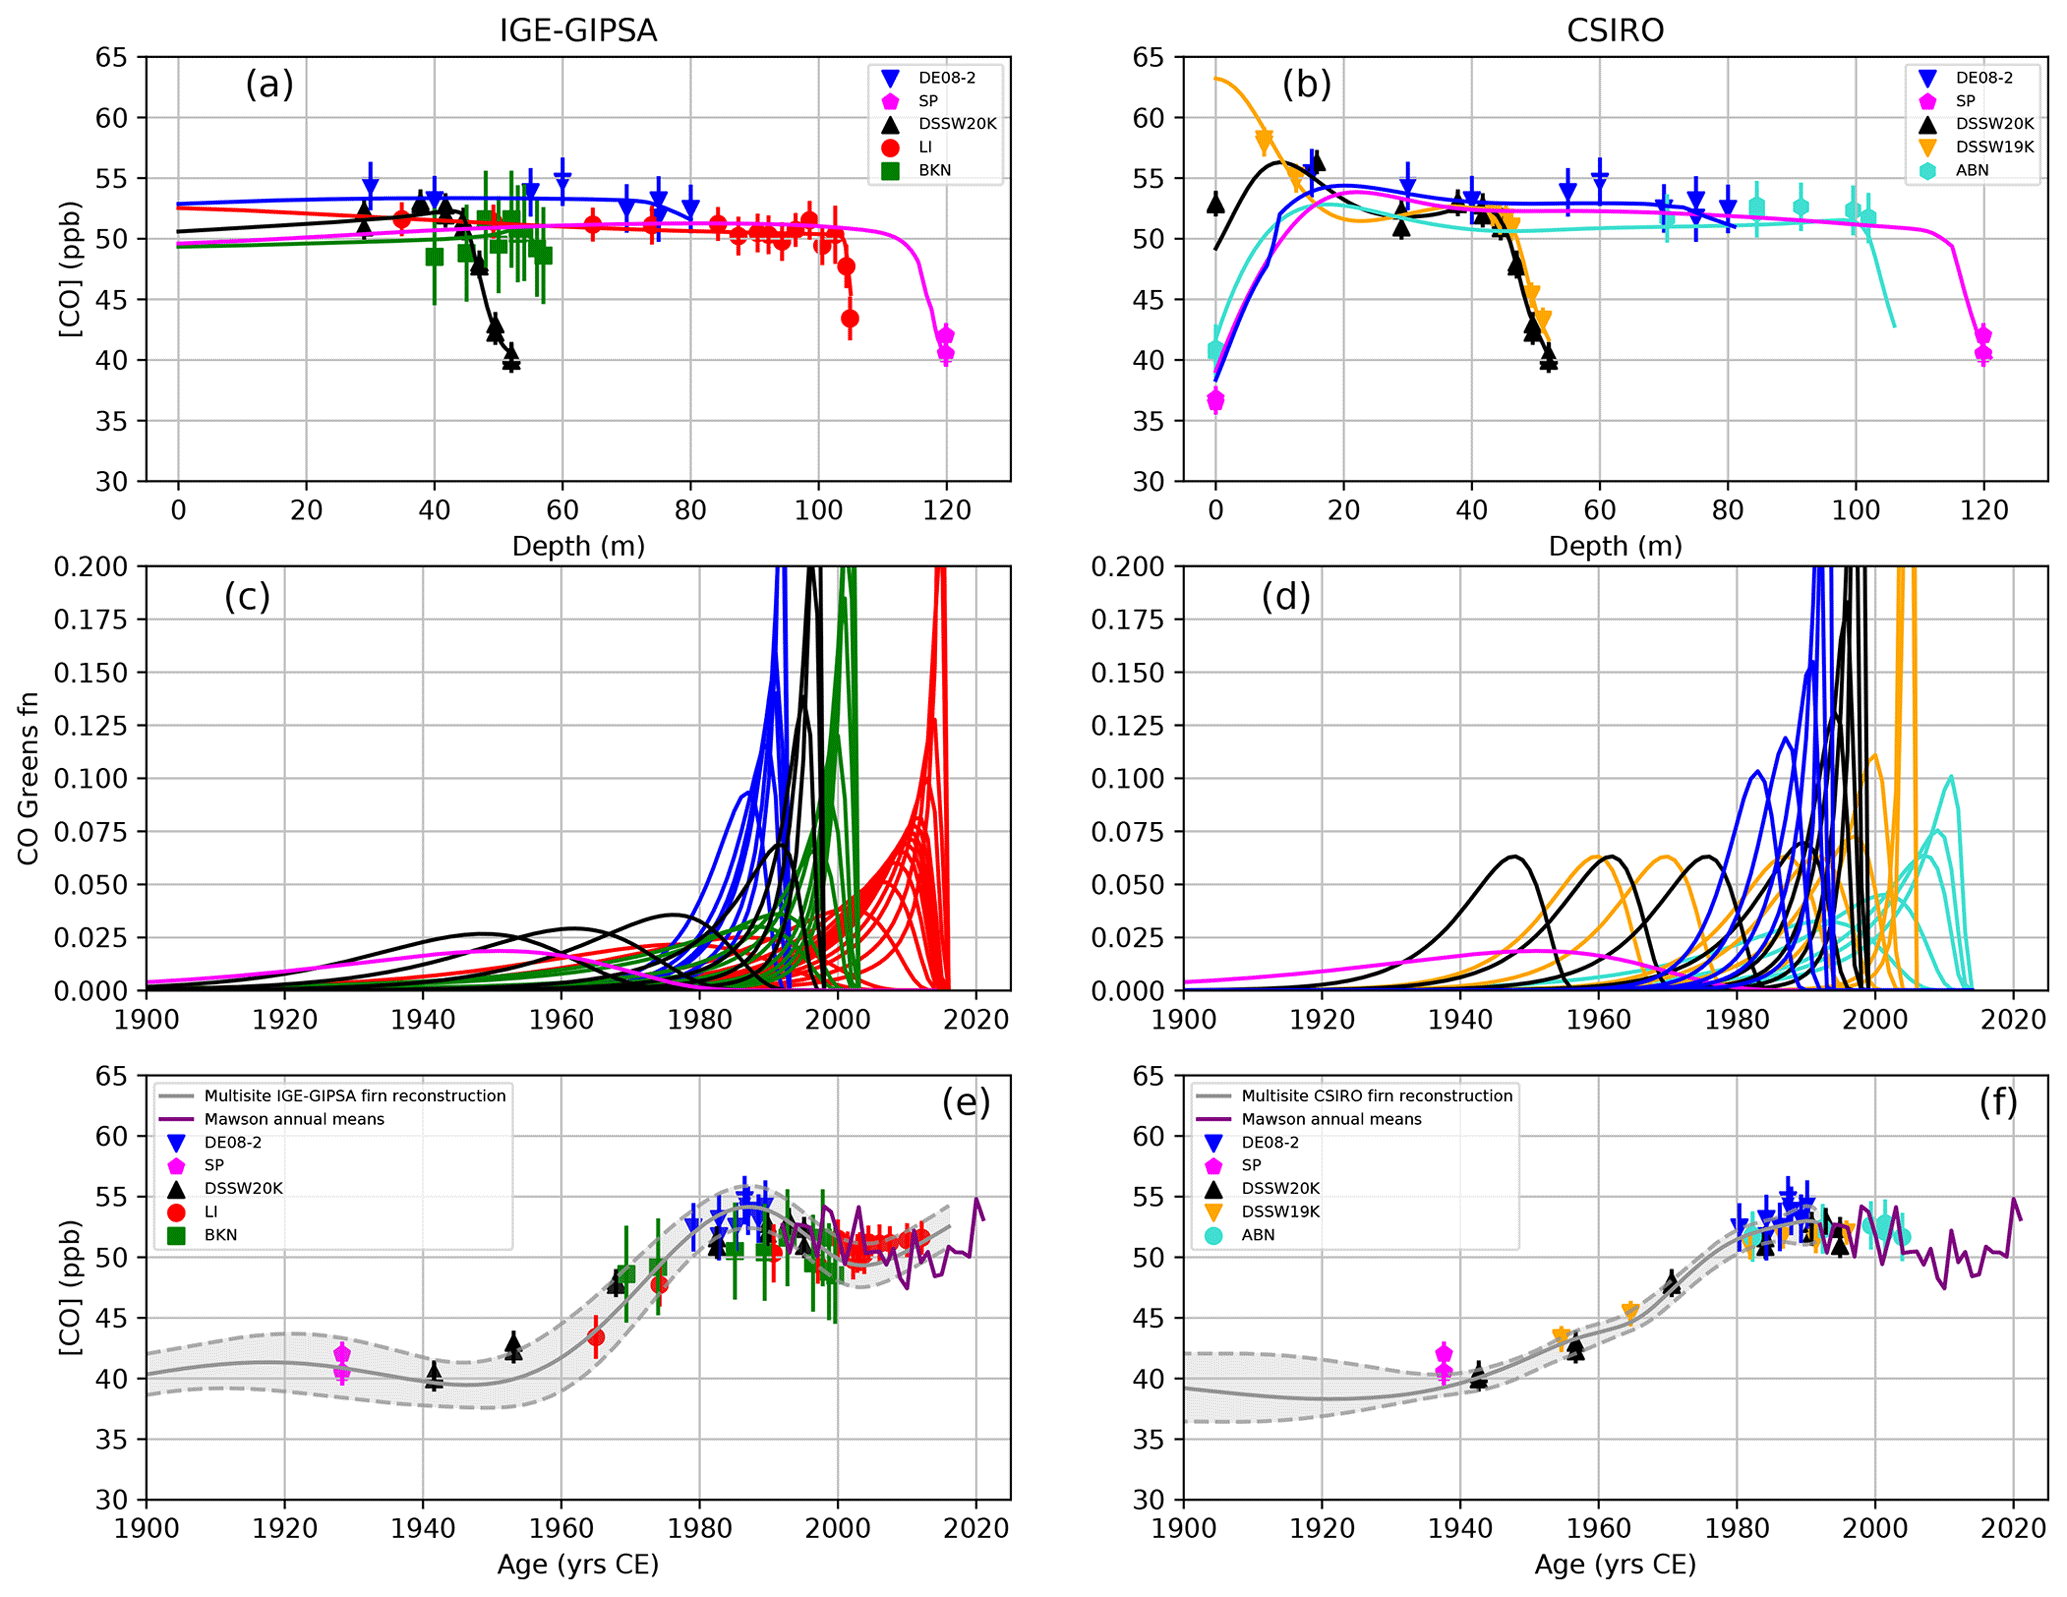
Figure 1(a, b) Depth profiles of carbon monoxide mixing ratio in the firn air at seven Antarctic sites (Lock-In, DE08-2, DSSW20K, DSSW19K, Berkner, South Pole, and ABN). Lines show forward model results that use the optimum atmospheric [CO] history (Sect. 3.3) as input; symbols are measurements with 2σ uncertainties. Panel (a) reports IGE-GIPSA modeling results; the IGE-GIPSA model does not reconstruct the CO seasonality, and CO measurements above a depth ranging 30–40 m were excluded from the model inputs. Panel (b) shows CSIRO modeling results. Panels (c) and (d) show Green's functions from the IGE-GIPSA (c) and CSIRO (d) firn models (there is one line for each firn sampling depth, with the colors corresponding to those for different sites in panels a and b). (e, f) Best-fit atmospheric history of Antarctic [CO] obtained with the inverse modeling IGE-GIPSA (e) and CSIRO (f) technique (gray line, with the envelope representing 2σ uncertainty). Firn air measurements (symbols) are plotted as a function of mean ages extracted from the modeled age distributions (excluding the upper-firn measurements strongly affected by seasonality). We note that firn air data plotted versus mean age are not strictly comparable with the modeled time trends which account for the age distribution widths in the samples. Annual mean [CO] at Mawson Station is shown in purple. The annual means are calculated from a smooth fit at daily resolution to measurements conducted by CSIRO since 1992 on flask samples of background air collected fortnightly (Sect. S2.1).
[CO] exhibits a strong seasonal cycle in the Antarctic troposphere, with mixing ratios lower (higher) in summer (in winter) when OH levels are elevated (respectively, low; Fig. S5). The seasonal signal diffuses down in the upper-firn layers and affects the top 30–40 m of the firn, depending on the site, with the attenuation of the seasonality mostly complete below this. Variations in CO mixing ratios observed in the shallowest firn air (Fig.1a and b) are thus driven mainly by the atmospheric [CO] seasonal cycle. All firn air sampling described in this study, except DSSW19K, was conducted during summer, and thus surface sampling (denoted as 0 m in Fig. 1a and b) exhibited low [CO]. On the contrary, maxima in [CO] are observed at ∼10 m depth at these sites, reflecting the diffusion of elevated wintertime atmospheric [CO] into the firn. Sampling at DSSW19K was conducted in spring (Table 1) and thus exhibits higher [CO] surface levels.
[CO] profiles with depth (Fig. 1a and b) differ, depending on the sampling site. The oldest and most interesting parts of the firn [CO] records for inferring long-term changes are in deep firn (i.e., located below the lock-in depths; Table 1). All sites show a decrease with depth, indicating lower atmospheric [CO] levels in the past in the Antarctic atmosphere. The low open porosity of the firn at the bottom of the lock-in zone makes firn air contamination possible during sampling, which results in the partial rejection of measurements at the deepest levels. In this study, we were careful to report only uncontaminated [CO] values. Contamination was identified by deploying specific analyzers in the field ([CO2], [CH4], or [CO]; Sect. 2.2) and/or by the detection of anomalous values for species which are expected at very low levels in old air (e.g., halocarbons such as [SF6] or [CFC-11] because they have been emitted to the atmosphere only recently by human activities; Witrant et al., 2012). The [CO] decreases observed in the lock-in zones reveal different shapes. The thickness of the lock-in zone, and the possibility for older gas to be preserved in the firn, depends on climatic conditions such as temperature and snow accumulation (Witrant et al., 2012), which differ between sites. Differences in [CO] depth profiles (Fig. 1a and b) are also related to the age distributions in the firn air samples, which depend on firn physics and on the date of the firn air sampling campaigns (between 1993 and 2016; see Table 1). Interestingly, the DE08-2 firn depth profile which was sampled in 1993 (Table 1) exhibits higher [CO] (Fig. 1a). Although some residual contamination or effects of the firn air sampling device cannot be ruled out completely in 1993 when firn air sampling was a new methodology, the mean Antarctic atmospheric [CO] also was higher 3 decades ago.
Concerns about the potential of CO production on snow surfaces (e.g., Assonov et al., 2007) led us to investigate whether [CO] in firn air and therefore in deeper ice core air could be elevated above background atmospheric levels. Measurements were made of [CO] in air sampled via pump inlets at the snow surface or inserted 5–10 cm into the snow at three regions of Law Dome (a cold, high-accumulation region near the summit; a lower-accumulation region at DSSW19K; and a warmer, snow ablation site near the ice sheet margin). A similar experiment was conducted at Concordia Station (a very low-accumulation site, where the DC12 ice core was drilled; Table 2), with pump inlets at the snow surface or inserted 10–70 cm into the snow. At all sites, the CO mixing ratios in air sampled during daylight hours at or just below the snow surface were not systematically different, and within measurement uncertainty, from those sampled at night or during the day but from about 3 m above the snow surface. Firn [CO] measurements in the upper 30 m also agree well with the CSIRO model simulations (Fig. 1b), which at this depth range are driven by atmospheric observations at Mawson. From this, we conclude that the firn and ice samples are not significantly affected by photochemical [CO] production, presumably due to low CO production in Antarctic snow and/or ventilation of produced CO away from the surface snow layer.
Finally, annual mean values of the CSIRO atmospheric [CO] record from Mawson Station since 1992 CE are also displayed in Fig. 1e and f. These direct measurements of atmospheric [CO] in the Antarctic atmosphere, which use the CSIRO2020 calibration scale, exhibit good agreement with firn air datasets.
3.2.2 Continuous [CO] records along Antarctic ice cores
The new [CO] records available from the DC12, ABN, and TD ice cores are reported in Fig. 2 and plotted for a period spanning −835 to 1897 CE (gas age; see Table S1). The high-resolution datasets represent the CFA output that is calibrated (WMO-X2014 scale; Sect. 2.6.3 and the Supplement), filtered to eliminate lab air infiltrations (Sect. 2.6.5), and integrated over 10 s intervals. Splines based on the high-resolution signals can be used to produce an average CO history for each site. The envelopes report 2σ uncertainties and combine uncertainties evaluated specifically (Tarantola, 2005) for each analytical setup on CO blanks, solubility calibration factors, and external precision of CO CFA measurements (see the Supplement and previous sections). The high-resolution DC12 CO record exhibits a 6 m gap for gas ages spanning −114 to −209 CE because samples were damaged during transport. To infer the [CO] trend in this missing data interval, we analyzed a section of the SolarIce core, which was drilled at Concordia Station in January 2016, 2 km away from the DC12 borehole. SolarIce measurements reveal a smooth evolution of CO mixing ratio for the missing period in the DC12 records, and we consequently extract a continuous spline from the DC12 dataset (Sect. S2.7; Fig. S15). None of the Antarctic records revealed high and variable mixing ratios that were previously observed in Greenland ice cores and interpreted as in situ CO production (Faïn et al., 2014, 2022). The DC12, ABN, and TD records exhibit stable and low MAD (median absolute deviation) values, with mean MAD values over the entire datasets ranging from 1.1 to 2.4 ppb, depending on the records. These values are much lower than the MAD values reported for Greenland [CO] records impacted by in situ production, which ranged from 10 to 80 ppb (Faïn et al., 2022).
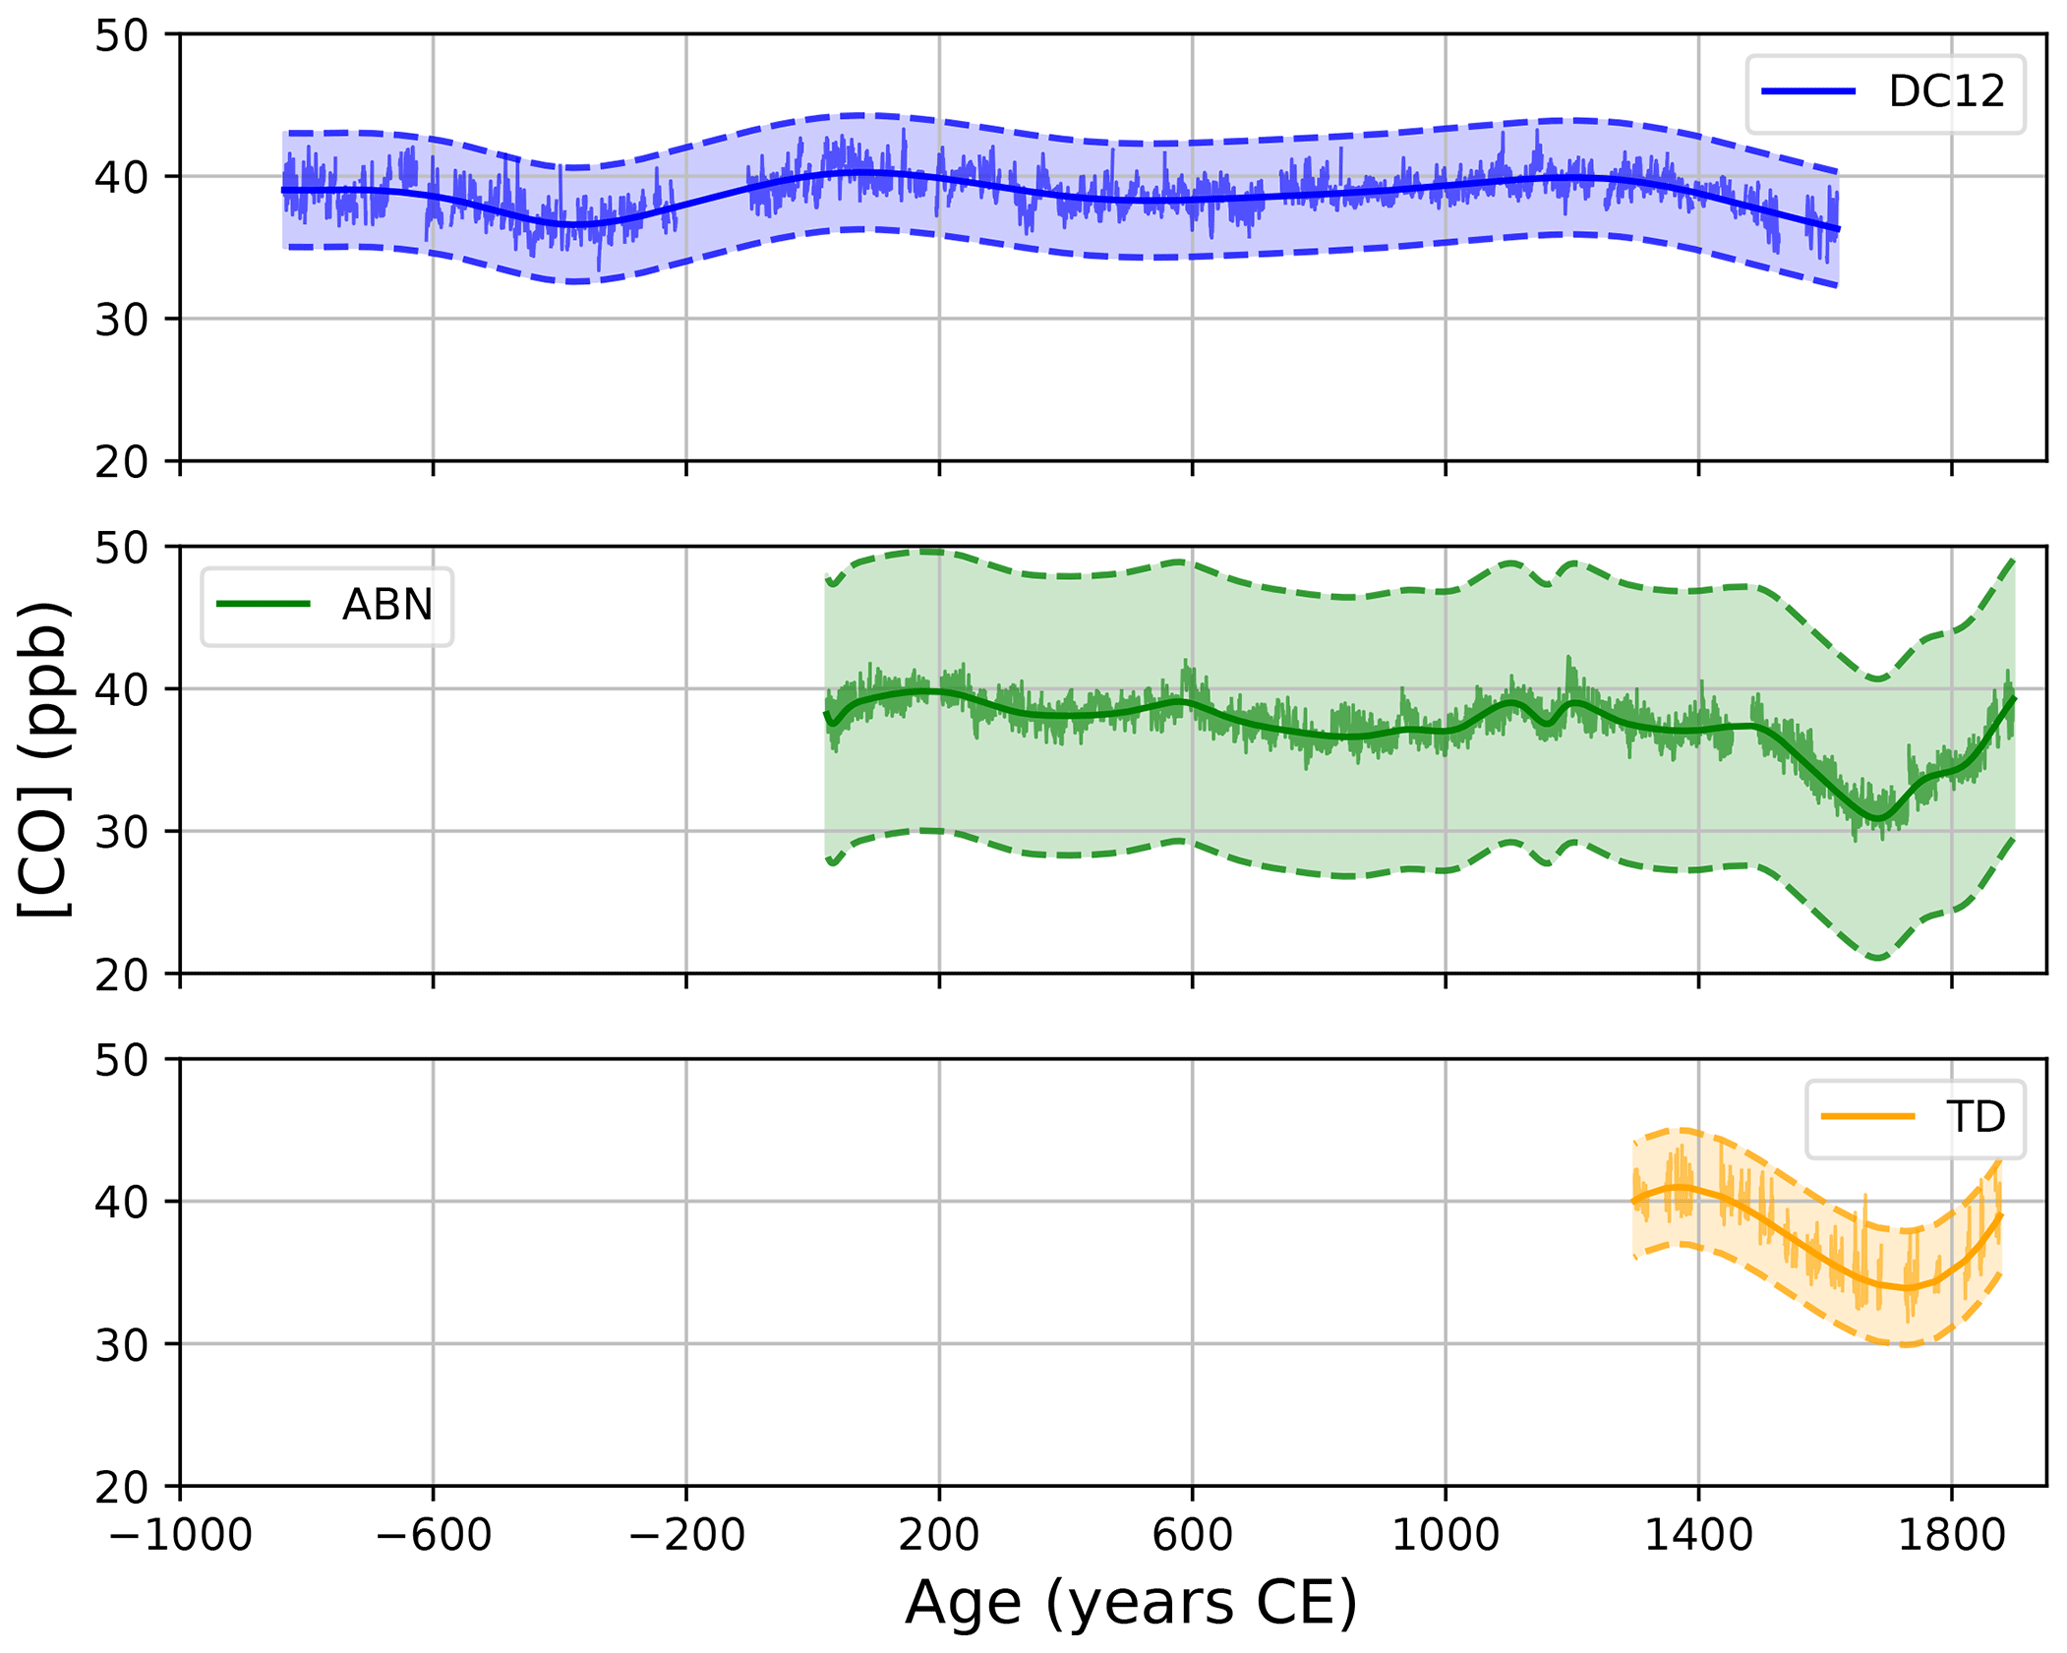
Figure 2Continuous [CO] records collected along the DC12 (blue), ABN (green), and TD (orange) Antarctic ice cores. The integration time of high-resolution datasets is 10 s. A spline is applied to each high-resolution dataset. The noise displayed by high-resolution solid lines only represents the internal precision, while the envelopes report 2σ uncertainties combining uncertainties in the CO blanks, solubility calibration factors, and external precision of CO CFA measurements derived from the reproducibility measurements.
The ABN and TD CO records both show a minimum in CO mixing ratio in ∼1700 CE. The DC12 record does not extend to 1700 CE but still shows a decreasing trend in [CO] from 1400 to 1620 CE. All records exhibit rather stable CO levels for periods prior to ∼1400 CE. Although some fluctuations in [CO] can be seen prior to 1400 CE, they are not significant compared to the width of the uncertainty envelopes.
The occurrence of a minimum in atmospheric Antarctic [CO] centered in 1700 CE is supported by CFA analyses of the EDML-B40 ice core (Sect. S2.6). Although absolute calibration of the EDML-B40 CFA CO dataset was not possible, this record also reveals a minimum in [CO] in the 1700s.
3.3 Atmospheric [CO] history over the last 3000 years
3.3.1 A reconstruction spanning 1897 to 1992 CE from firn air data
We applied the inverse IGE-GIPSA and CSIRO firn and inverse models (Sect. 2.4) to the [CO] firn depth profiles (Fig. 1a and b) to reconstruct the temporal evolutions of [CO] in the Antarctic atmosphere. The IGE-GIPSA reconstruction extends to 2016 CE and is constrained in 1862–1889 CE by five synthetic data points in BKN ice, with mean ages and CO mixing ratios consistent with the ice core composite presented in Sect. 3.3.2. Simulations performed with and without this ice constraint provide consistent results (within uncertainty limits of one another; for more details, see Sects. 2.4 and S2.3.2).
The CSIRO firn reconstruction extends to 1992 CE, after which the atmospheric history follows the atmospheric measurements from Mawson Station, as described in Sect. 2.4. By using the Mawson record with daily resolution to calculate the influence of seasonality in the upper firn, it is possible to use all of the firn measurements. Figure S9 shows how the atmospheric history before and after 1992 affects the modeled depth profiles. The CSIRO firn air reconstruction begins in 1898 and uses the ice reconstruction (see Sect. 3.3.2) to give the atmospheric history up to 1897 (with regularization in the inversion preventing the difference between the last ice record value in 1897 and the first firn record value in 1898 being too large). A firn reconstruction run without the ice core record before 1897, instead assuming constant CO before 1900, differs in 1897 from the ice core reconstruction by only 1 ppb and is therefore within the uncertainty envelopes (Sect. S2.4, Fig. S10).
The Green's functions used in the inversions are shown in Fig. 1c and d. Optimal atmospheric [CO] histories obtained by both models are reported in Fig. 1e and f, with the envelope reporting 2σ uncertainty. [CO] firn air data are plotted as a function of mean ages in Fig. 1e and f (however, note that the Green's functions are a more accurate representation than the mean age for the age of firn air, and it is more appropriate to assess the agreement between models and measurements by comparing the [CO] depth profiles in Fig. 1a and b than the reconstructed [CO] time histories and measurements versus mean ages in Fig. 1e and f). Both IGE-GIPSA and CSIRO firn models were then operated in forward mode to simulate a [CO] depth profile at each firn site from the inferred optimal history (lines in Fig. 1a and b). Due to mixing by diffusion, CO mixing ratio profiles in firn are smoothed, and the model interprets the CO variability between adjacent depth levels as noise, which is reflected in the uncertainty envelope. The detailed site-by-site comparisons of model results with firn data (Figs. S7 and S11) do not show site-specific systematic shifts that would be indicative of inconsistencies between the datasets.
The IGE-GIPSA atmospheric [CO] history based on firn air samples (Fig. 1e) reveals the following patterns: (i) from 1897 to 1945 CE, the record is stable overall, with [CO] values remaining in the 37–44 ppb range; (ii) from 1945 to 1985 CE, the record indicates an increase in [CO] from 37–41 to 52–56 ppb, with a mean rate of 0.4 ppb yr−1; (iii) Antarctic [CO] declines from 1985 to 2000 CE; and (iv) over the 2000–2016 CE time period, [CO] slightly increases (+3 ppb) to reach present-day levels, in agreement with direct [CO] monitoring at Mawson Station. The CSIRO atmospheric [CO] record (Fig. 1f) exhibits a similar pattern but with the fast increase in [CO] starting ∼5 years earlier. Overall, IGE-GIPSA and CSIRO reconstructions are in good agreement and always have overlapping uncertainty envelopes.
Both inversions need some degree of regularization to prevent unrealistic solutions with wildly oscillating atmospheric CO levels, as demonstrated by Rommelaere et al. (1997). The two inversions use different approaches to regularization, and this leads to different degrees of smoothing of the reconstructed atmospheric history. However, it is an advantage in this study to be able to present two independent inversion methods, and their differences reflect part of the overall uncertainty. Over the period spanning 1920 to 1992, we average the annual values in the IGE-GIPSA and CSIRO records to produce a multimodel firn air [CO] reconstruction. For the 1897–1920 CE period, a polynomial weight was introduced in the annual averaging of the two firn records. Such an approach (Fig. S12) allowed us (i) to weight the multimodel record toward the CSIRO reconstruction in 1897 CE, and (ii) to match the [CO] growth rates (i.e., in ppb yr−1) of the firn and ice core reconstructions in 1897 and 1920 CE. The multimodel firn air reconstruction is shown in Fig. 3, with the envelope representing the 2σ uncertainty interval.
3.3.2 A reconstruction spanning −835 to 1897 CE from ice core data
Figure 3 reports a history of atmospheric [CO] spanning the last 3000 years in 45–90∘ S latitudinal band (Sect. 3.1). Prior to 1897 CE, it is an average multi-site record based on ice core continuous datasets. The DC12, ABN, and TD high-resolution [CO] records reported along the age scale are merged, and a spline fit of the data from the three sites is used to define the multi-site record. Site-specific uncertainties are combined, and the gray envelope reported in Fig. 3 depicts a 2σ uncertainty. The recent atmospheric [CO] history retrieved from firn air (Sect. 3.3.1) covers the period from 1897 to 1992 (Fig. 3).
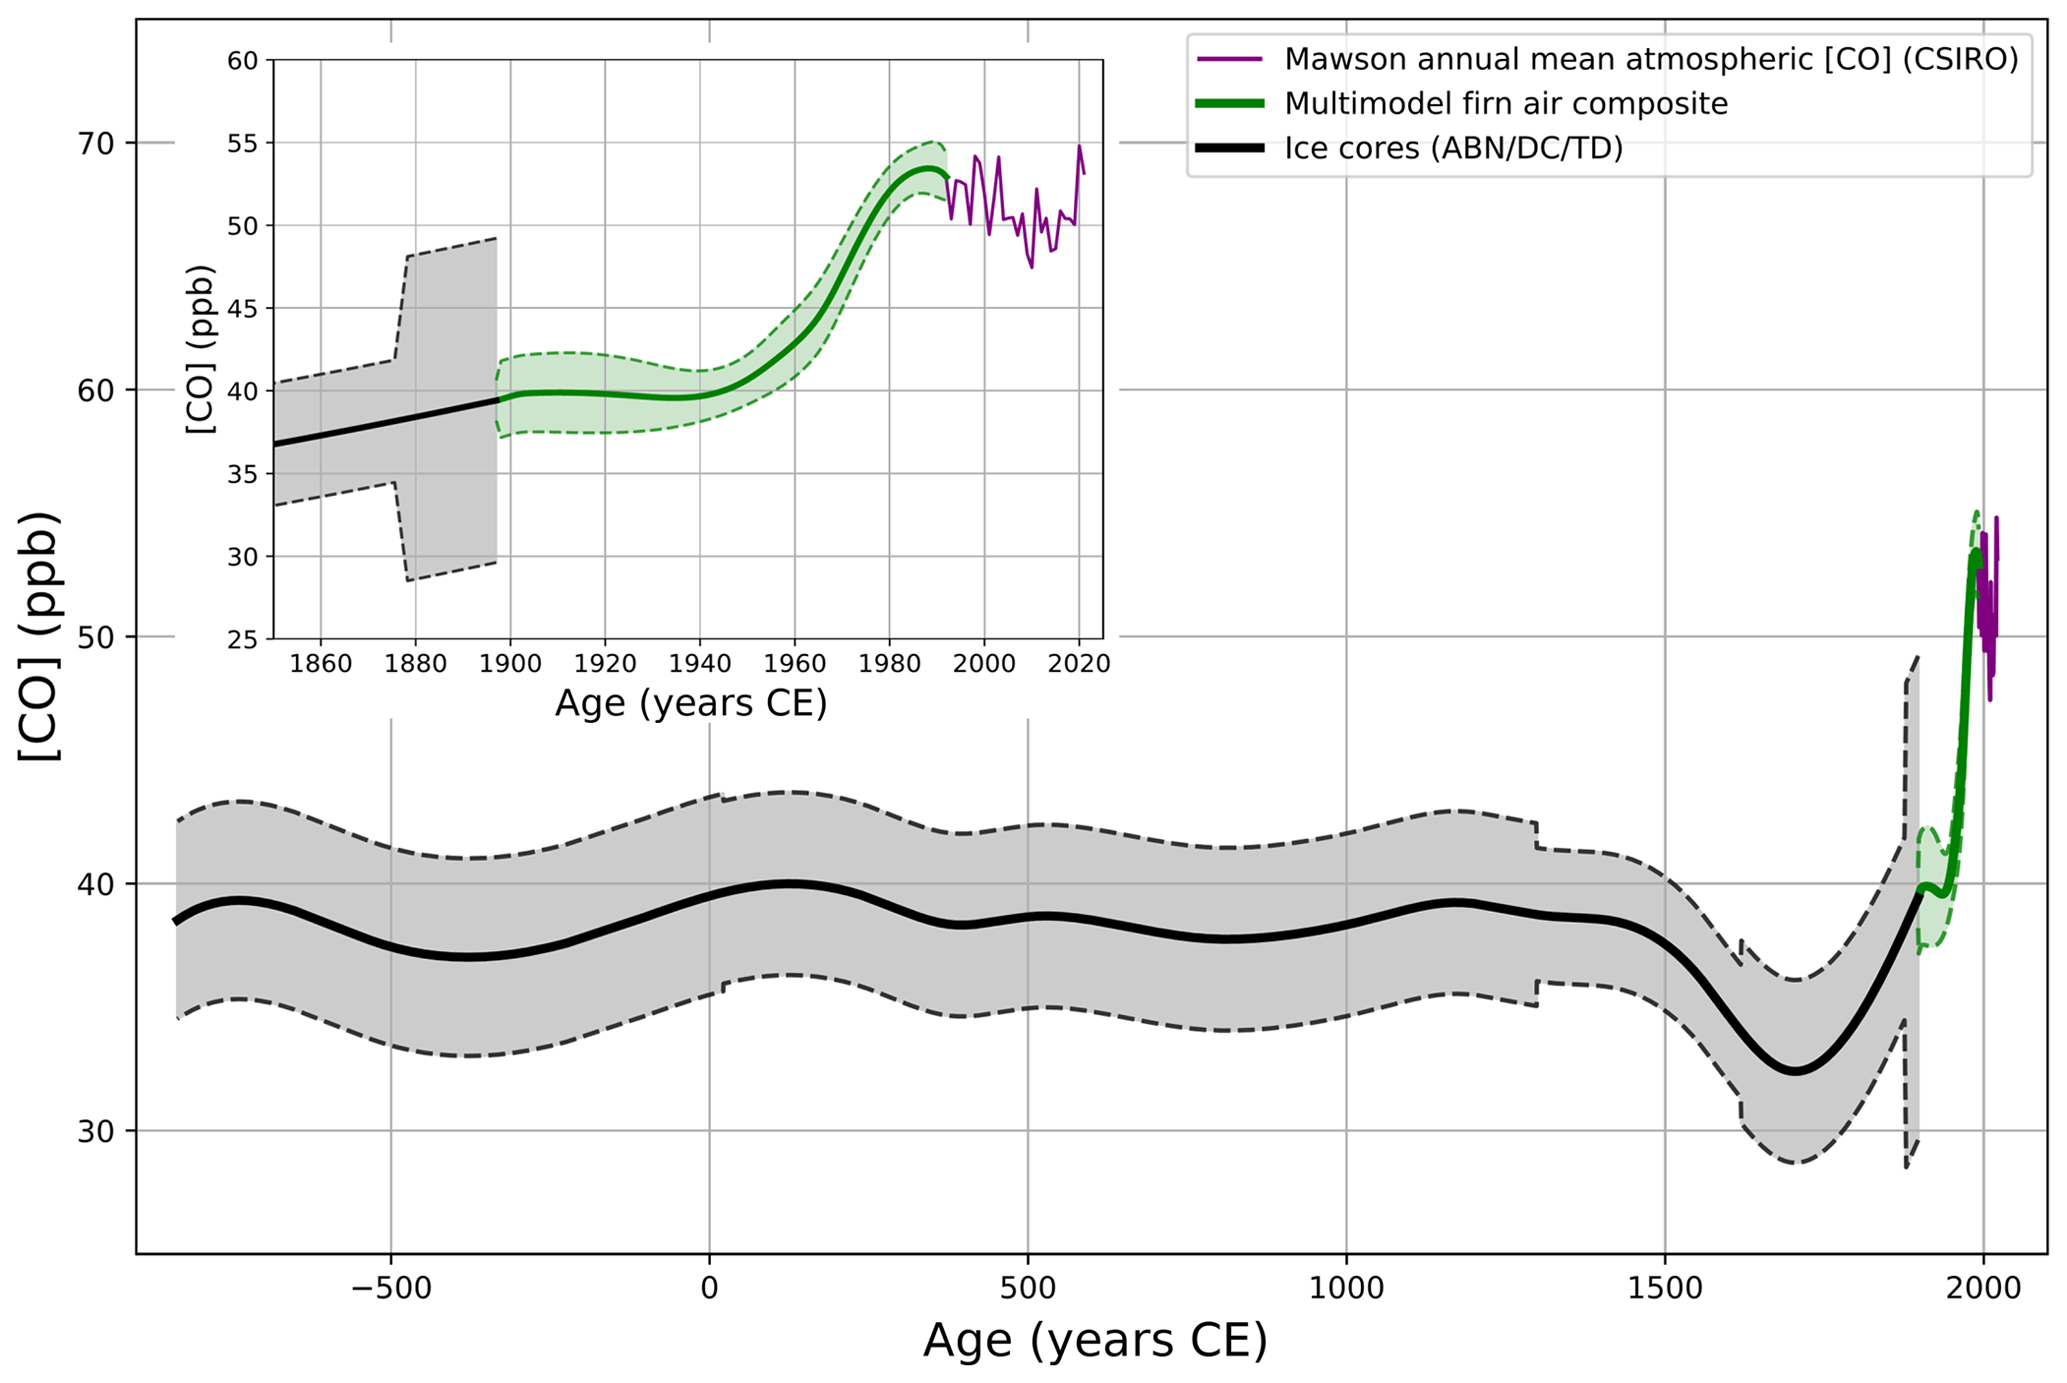
Figure 3Reconstructed CO mixing ratio in the Antarctic atmosphere for the last 3000 years showing a multi-site ice core composite (black line), spanning −835 to 1897 CE, and the multi-site firn air reconstruction from Fig. 1 (green line), spanning 1897 to 1992 CE. The envelopes represent 2σ uncertainties. Annual mean [CO] at Mawson Station is shown in purple and calculated from a smooth fit at a daily resolution with flask sample measurements since 1992 (see the text and Sect. S2.1 in the Supplement). The inset shows identical data but focuses on the last 170 years. The three data sources forming the reconstruction each have different intrinsic smoothing.
Atmospheric [CO] was rather stable from −835 to 1500 CE, with mixing ratios remaining in a 30–45 ppb range (2σ). Then, [CO] showed a decreasing trend from 38.5±2.7 ppb in ∼1500 CE to a minimum of 32.5±3.7 ppb in ∼1700 CE. After 1700 CE, [CO] increased until reaching a maximum of 53.6±1.6 ppb in ∼1985 CE. Over the 1700–1900 CE time period, [CO] increased at a moderate rate of 0.035 ppb yr−1. The subsequent growth rate in SH atmospheric [CO] during the latter half of the 20th century is 10-fold higher (Sect. 3.3.1) than prior to the industrial times (i.e., prior to 1850 CE).
3.4 Comparison with previous ice core CO records
Figure 4 reports a comparison of our new record with [CO] datasets collected earlier from Antarctic ice cores from Vostok Station (VST; Haan and Raynaud, 1998), D47 (Haan et al., 1996; Wang et al., 2010), and SP (Wang et al., 2010). Error bars on the VST, D47, and SP data represent 2σ uncertainties. The VST [CO] (Haan and Raynaud, 1998), which shows stable ∼50 ppb [CO] from −230 to 1370 CE, is only partially shown in Fig. 4. The D47, VST, and SP records suggest stable CO levels prior to 1400 CE, with a minimum in [CO] in ∼1600 CE and an increase in [CO] to the onset of the 20th century, which reaches higher values than today.
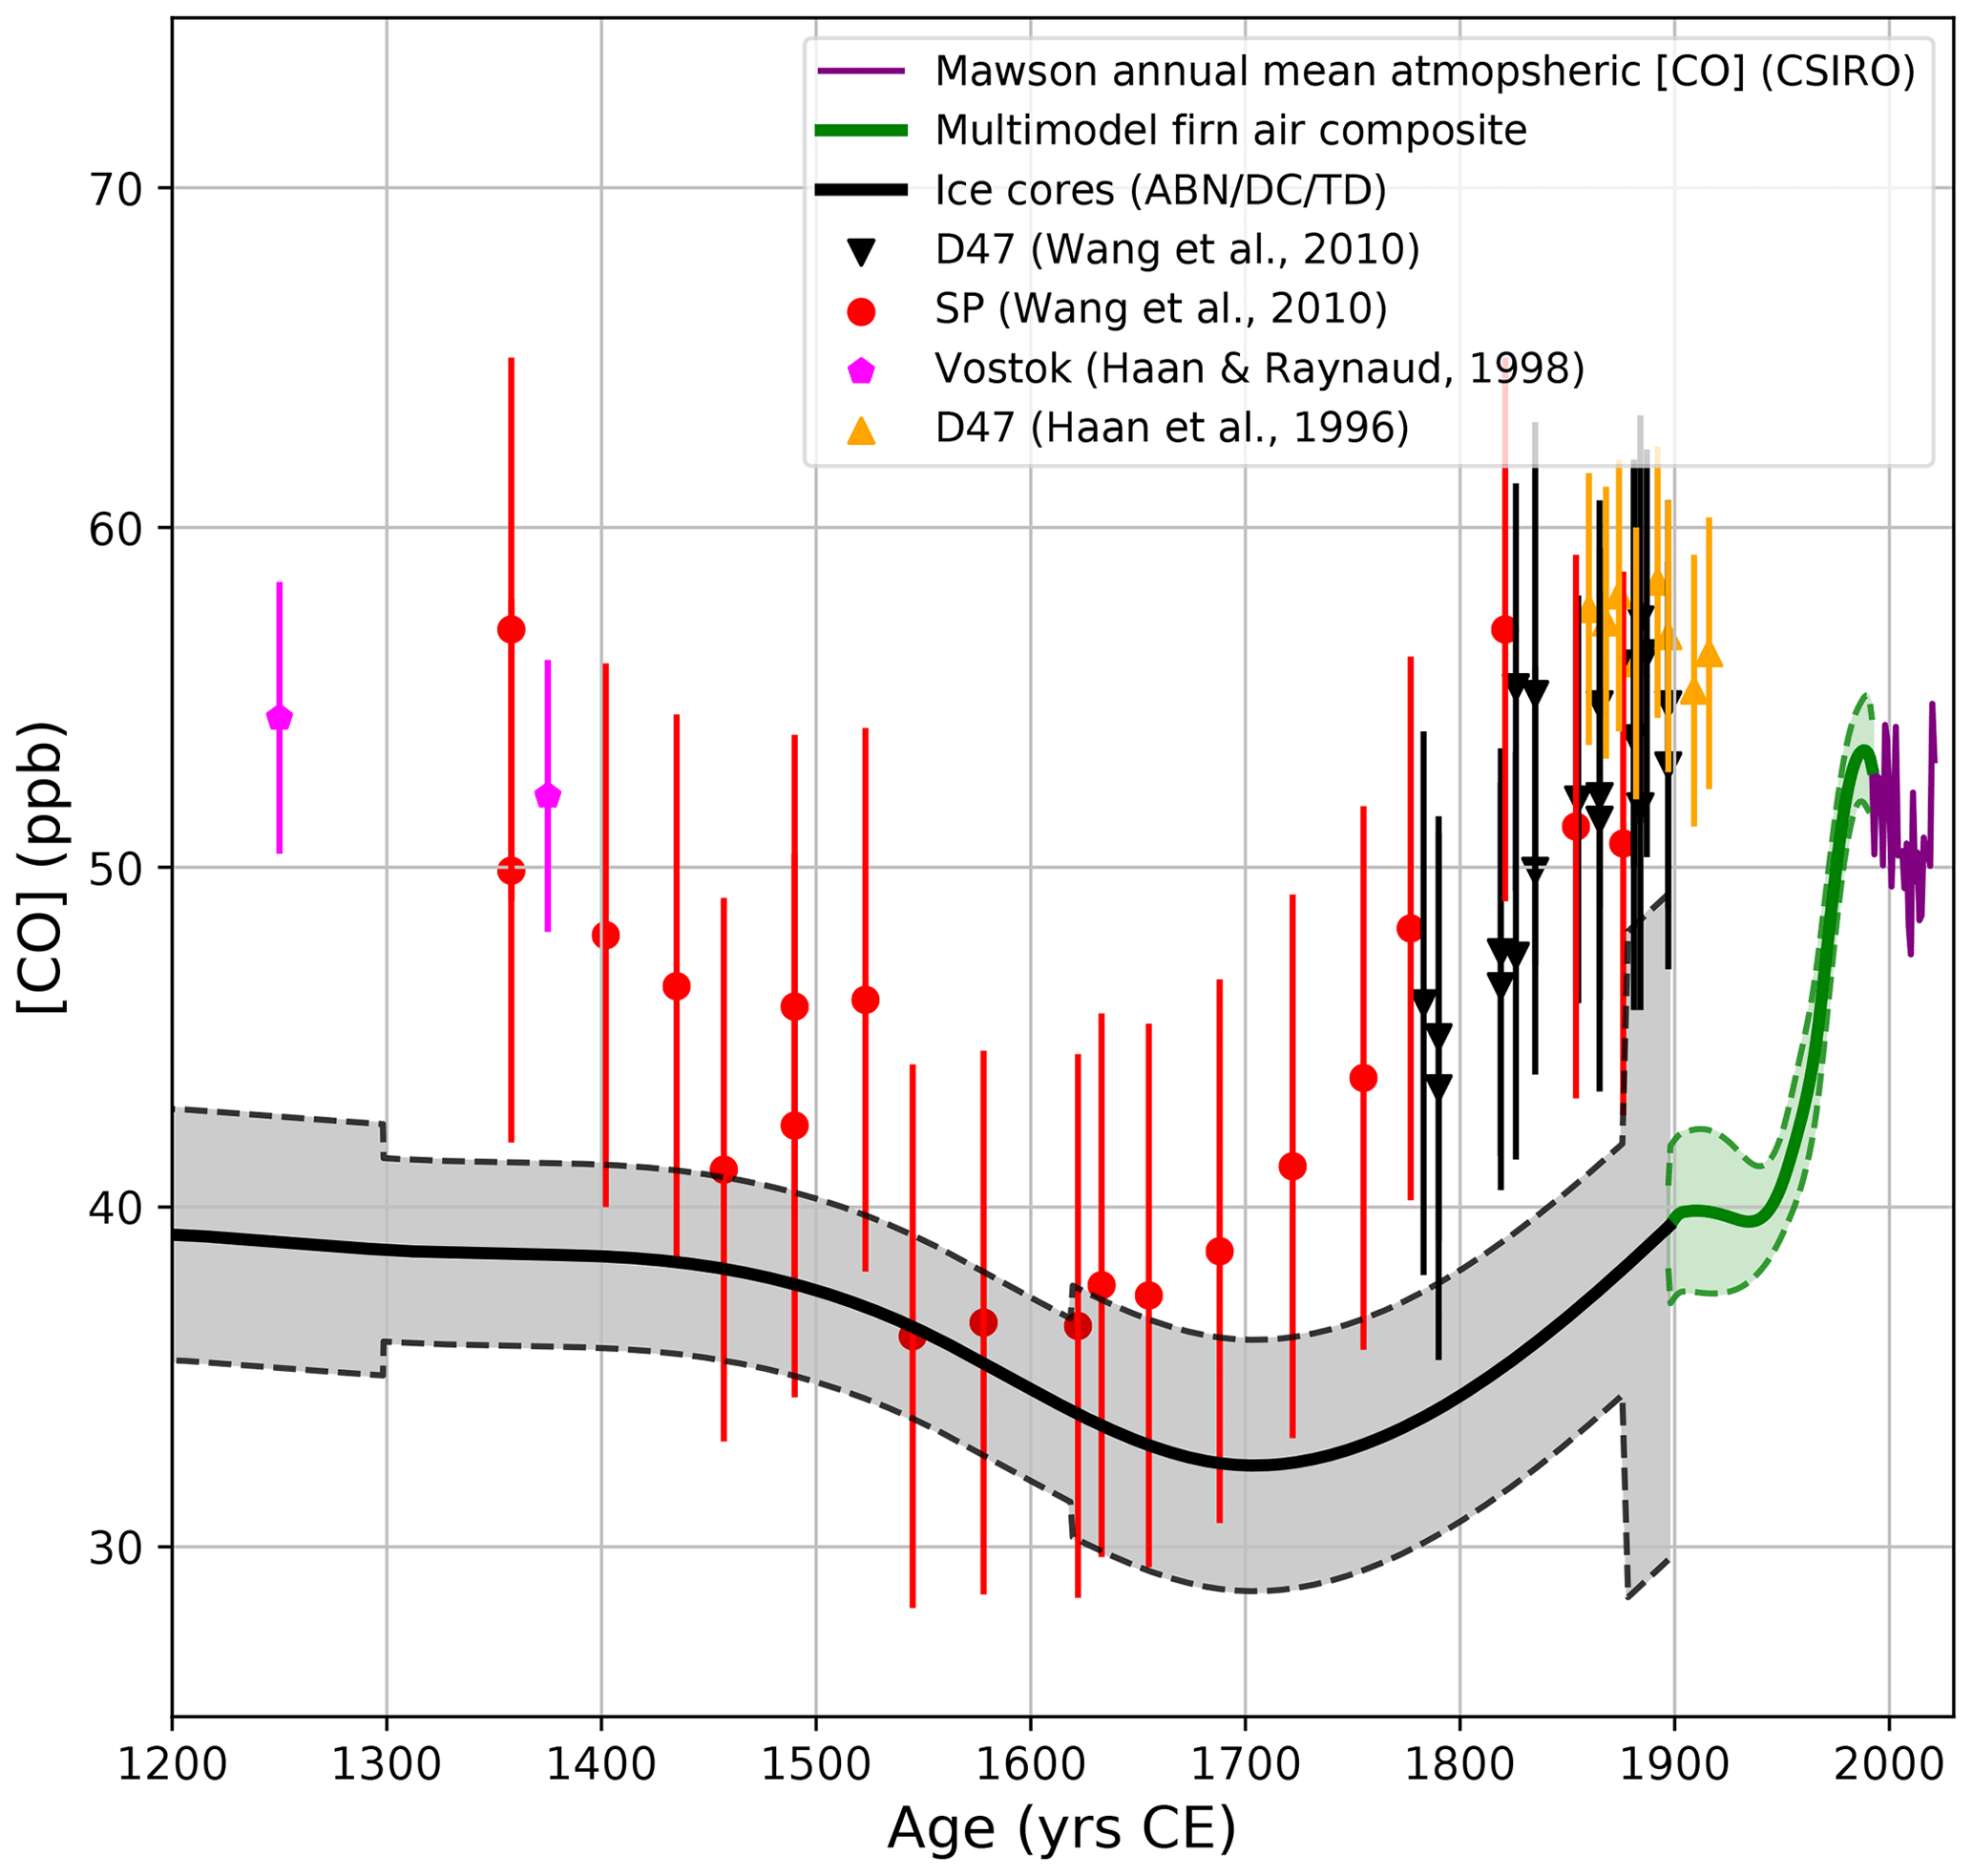
Figure 4Comparison of the [CO] atmospheric reconstruction based on the ABN, DC12, and TD ice core with previously published CO ice core datasets reported with 2σ uncertainties in SP (Wang et al., 2010), VST (Haan and Raynaud, 1998), and D47 (Haan et al., 1996; Wang et al., 2010) archives. Seven more VST data points are available in the time period spanning −236 to 1093 years CE, with [CO] ranging from 48 to 53 ppb (Haan and Raynaud, 1998).
There are substantial differences between our new record and the published D47, VST, and SP dataset. First, the D47, VST, and SP dataset exhibits about 10 ppb higher [CO] than our record prior to 1500 CE and in the early 1900s (Fig. 4). This difference is larger than our 2σ uncertainty envelope and therefore significant. Such disagreement is puzzling; the published datasets of D47, VST, and SP agree with each other, although they were measured 15 years apart in different laboratories with different analytical methods. On the other hand, our new ice record is internally consistent between the four Antarctic sites (including the SolarIce core; Sect. S2.7). Our new record also includes firn air datasets measured in three different laboratories (IGE, CSIRO, and MPI) with different methods and, unlike the earlier records, links with modern [CO] atmospheric monitoring (Fig. 4). We showed in Sect. 3.1 that atmospheric CO is relatively uniform over Antarctica, so these differences cannot be explained by spatial gradients between the different ice core sites.
Haan's studies (Haan et al., 1996; Haan and Raynaud, 1998) report [CO] on the CSIRO94 calibration scale, which is 3 % lower than the CSIRO2020 scale. Wang et al. (2010) calibrated their dataset using a single 141 ppb gas cylinder certified on the WMO-X2004 scale. The WMO-X2014 scale gives higher values by around 1 ppb for mixing ratios lower than 200 ppb compared to WMO-X2004 scale, including for the [CO] range reported by Wang et al. (2010). In this study, consistent calibrations (WMO-X2014 and CSIRO2020) have been applied to all new firn air and ice core datasets. Consequently, a direct comparison of our new record with previously published CO datasets reported in Fig. 4 is possible.
Second, our [CO] record and the SP dataset (Wang et al., 2010) both exhibit a minimum during the LIA, but the exact timing of this minimum is different, with our record showing a minimum 100 years later than at SP (i.e., ∼1700 CE, instead of ∼1600 CE). The three ice core records in this study all exhibit a minimum in ∼1700 CE, i.e., ABN, TD, and EDML-B40 (Figs. 2 and S13). However, Wang et al. (2010) used SP and D47 chronologies, based on the pioneering studies of Schwander and Stauffer (1984) and Barnola et al. (1995), and report uncertainties of ±100 years (respectively, ±20 years) for SP (respectively, D47) gas dating. Such large uncertainties may explain the mismatch observed for the timing of the minimum in [CO] during the LIA between the Wang et al. (2010) dataset and our record.
Third, the amplitude of the decrease in [CO] during the LIA is only 5 ppb for the new record reported in this study, compared to a 20 ppb amplitude observed on the SP ice core by Wang et al. (2010). We investigated if the ABN and TD records, which in this study constrain a 5 ppb amplitude for the minimum in [CO] during the LIA, could smooth long-term (i.e., multi-centennial variability) atmospheric signals by either analytical or gas-trapping processes. The response times of the IGE and DRI CFA setup have been documented earlier (Faïn et al., 2022, and their supplementary information) and are fully able to resolve the whole amplitude of variation in [CO] observed during the LIA which spans meters (e.g., 40 m along the ABN core). During the LIA, the ABN accumulation rate is lower than modern values (such as reported in Table 1), but it is similar to the SP accumulation rate (Servettaz et al., 2023). Thus, the ABN record is not expected to be more affected by smoothing than the SP record during the LIA.
Overall, the lack of consistency between our new record and the published D47, VST, and SP dataset is reminiscent of a previous study where we were not able to reconcile the Greenland [CO] Eurocore dataset of Haan and Raynaud (1998) and Haan et al. (1996) with multiple new Greenland ice core CO measurements made using both discrete and continuous analytical methods, including the PLACE ice core drilled 1 km away from the Eurocore site (Faïn et al., 2022). Similarly, our Antarctic CO results call into question the accuracy of the CO values reported for the D47, VST, and SP ice core. As the D47 and SP CO record from Wang et al. (2010) is apparently affected by additional, extraneous CO, it is expected that also its isotopic signature is affected by this process and thus should be interpreted with caution.
An early Law Dome record of [CO] spanning 200–1600 CE was reported by Ferretti et al. (2005). The general pattern of the Law Dome CO record differs from both our study and the D47, VST, and SP (Haan et al., 1996; Wang et al., 2010) dataset. Notably, Law Dome [CO] exhibits higher mixing ratios in the 50–90 ppb range, with no significant decrease in [CO] during the 1400s. The Law Dome [CO] data were a byproduct of the methane isotopic measurements by Ferretti et al. (2005) and had significantly higher measurement uncertainty and blank corrections than the dedicated [CO] measurements reported here.
3.5 Implications for preindustrial SH fire history
In this study, we report an atmospheric history for [CO] in the SH for the last 3 millennia (Fig. 3). Temporal variations in atmospheric [CO] could, in theory, result from changing emissions of CO and/or changing oxidation of CO during its transport from source areas to Antarctica. Oxidation by OH is the dominant sink of CO, but past levels and variations in the OH are notoriously difficult to quantify. Earth system models including atmospheric chemistry schemes suggest a stable global average OH budget from preindustrial times to 1980 CE (Stevenson et al., 2020). Given the absence of data-based constraints on the OH budget over the last 3 millennia, we adopt these findings and assume that the PI [CO] variability is primarily driven by changes in emissions rather than changes in the OH sink.
This section therefore discusses the evolution of CO sources and implications for fire history for preindustrial times. It includes discussion of other proxies for the PI biomass burning in the Southern Hemisphere (Rubino et al., 2016a). Such proxies include ethane (Nicewonger et al., 2018), acetylene (Nicewonger et al., 2020a), and black carbon (Liu et al., 2021; McConnell et al., 2021) retrieved from ice cores and charcoal in sediments (Marlon et al., 2016; Power et al., 2008). Acetylene is released from incomplete combustion processes, and it is lost in the atmosphere via reaction with the OH radical, resulting in a global mean lifetime of roughly 2–3 weeks (Burkholder et al., 2015; Xiao et al., 2007). Biomass burning has been reported as the only major source of acetylene to the preindustrial atmosphere (Nicewonger et al., 2020a). Ethane is emitted in the modern atmosphere by the production and use of oil and natural gas, burning of biofuels and biomass, and natural geologic seeps (Etiope and Ciccioli, 2009; Helmig et al., 2016; Tzompa-Sosa et al., 2017), where recent results for very low geological emissions of methane in preindustrial times (Hmiel et al., 2020) also suggest a rather small geological ethane source. The major sink of atmospheric ethane is via oxidation with the OH radical, resulting in a global mean lifetime of roughly 2 months (i.e., comparable to the lifetime of CO; Burkholder et al., 2015; Xiao et al., 2008). Charcoal accumulation in lake or peat bog sediments has been shown to reflect biomass burning within tens of kilometers of the sampling site. Composite stratigraphies based on multiple charcoal records from lake sediments and peats have been built to infer biomass burning history (Vannière et al., 2016; Marlon et al., 2016; Power et al., 2008). Far smaller than charcoal fragments, light-absorbing black carbon (BC) aerosols are primarily emitted from fires during the preindustrial era and can be transported from the SH middle–high latitudes to Antarctica, where they are deposited on snow surfaces (Bisiaux et al., 2012; Liu et al., 2021; McConnell et al., 2021). Overall, these proxies exhibit varying atmospheric lifetimes and consequently different footprints. The stable isotopic composition of methane (δ13CH4) also has been used to reconstruct the preindustrial methane budget, including the variation in its biomass burning source (Beck et al., 2018; Bock et al., 2017; Ferretti et al., 2005; Mischler et al., 2009; Sapart et al., 2012). However, the atmospheric lifetime of methane is almost 10 years, making δ13CH4 a proxy for the global PI biomass burning.
3.5.1 Evolution of non-fire CO sources during preindustrial times
The main sources of CO in the preindustrial atmosphere are biomass burning and atmospheric production through the oxidation of methane and VOCs. The PI methane oxidation source is almost constant, as a consequence of the relatively small changes in CH4 atmospheric mixing ratio prior to 1850 (Rubino et al., 2019). Using a chemical transport model, Wang et al. (2010) evaluated a nearly constant contribution of the methane oxidation source to [CO] at South Pole in the 10–12 ppb range for the period spanning 1350–1900 CE. Consequently, SH atmospheric oxidation of VOCs, along with biomass burning, likely drive the preindustrial evolution in the CO mixing ratio observed in the Antarctic record.
VOCs relevant during the PI are mainly biogenic VOCs. Little is known about the past evolution of BVOC emissions in the atmosphere. Isoprene and monoterpenes constitute ∼65 % of the BVOCs emitted by the terrestrial biosphere (e.g., Guenther et al., 2012), and the processes driving isoprene and monoterpene emissions are complex and still not fully understood (Hantson et al., 2017, and references therein). BVOC emissions are sensitive to climate, CO2 mixing ratios, vegetation type, and foliage density. BVOC emissions from forests account for more than 70 % of the total VOC emissions in the 1990s (Guenther et al., 1995). Early estimates of changes in anthropogenically induced land cover and forest area reveal major differences (e.g., Pongratz et al., 2008; Kaplan et al., 2011). More recently, Klein Goldewijk et al. (2017) suggested that the fraction of land impacted by anthropogenic activities increased from 2.6 % to 7.3 % between 0 and 1700 CE, reflecting a limited pressure of humans on natural ecosystems and forests prior to industrial times. Using two independent modeling approaches, Acosta et al. (2014) simulate the evolution and driving factors of isoprene and monoterpene emissions during the past millennium. These authors simulate limited decreases in isoprene and monoterpene emissions for the period spanning 1000 CE to 1850, with (i) global isoprene emissions decreasing from 779 TgC yr−1 during the years 1000–1200 CE to 725 TgC yr−1 in 1800 CE, and (ii) a slight decrease in monoterpene emissions between the beginning of the millennium and the preindustrial time (from 83 to 80 TgC yr−1 and from 25 to 24 TgC yr−1, according to the MEGAN and LPJ-GUESS models, respectively). They find that climate change can have short-term global effects on isoprene emissions, with, e.g., a decrease in BVOC emissions during the LIA. A decrease in gross primary production and a larger decrease in ecosystem respiration was also reconstructed during the LIA using a global numerical simulation of atmospheric carbonyl sulfide (COS) mixing ratios (Rubino et al., 2016b). Considering the limited variation in atmospheric CO2, forest coverage, and natural landscape prior to 1000 CE, it is unlikely that BVOC emissions have experienced significant changes over the last 3000 years.
Evaluating the contribution of BVOC oxidation to the Antarctic [CO] in PI times requires CO isotope datasets (e.g., Wang et al., 2010) or a 3D chemistry transport model constrained with BVOC emission inventories (e.g., Rowlinson et al., 2020; Sect. 3.5.3). Unfortunately, the apparent CO contamination of the Wang et al. (2010) record also questions the results on its isotopic composition and does not render a reliable estimate of the BVOC oxidation CO source. Decrease in BVOC emissions over the last millennia (Acosta et al., 2014) should in principle be reflected by a decrease in the fraction of atmospheric [CO] produced by the BVOC oxidation source, which is a decrease possibly enhanced during the LIA (Acosta et al., 2014). However, because such a decrease in BVOC emissions is likely limited, we conclude that atmospheric CO in the SH has not experienced large fluctuation driven by the BVOC oxidation source in PI times.
3.5.2 Evolution of the CO fire source during preindustrial times
Our atmospheric history for [CO] in the SH for the last 3 millennia (Fig. 3) exhibits stable mixing ratios prior to 1500 CE (i.e., the onset of the LIA). Although some variations in [CO] exist prior to 1500 CE, they are not significant within the 2σ uncertainty envelope. Combined continuous CO measurements conducted along the ABN and TD ice cores (supported by the EDML-B40 CO dataset; Sect. S2.4) also reveal a decrease in [CO] in the Antarctic atmosphere from the MP to the LIA in the 1500s, with a minimum around ∼1700 CE during the LIA. Such a decrease is unique over the last 3 millennia. These patterns are very similar to the ethane and acetylene records retrieved from Antarctica ice (Nicewonger et al., 2018, 2020a). The ethane record (Nicewonger et al., 2018; Fig. 5b) is of particular interest, as both CO and ethane have similar atmospheric lifetime (∼2 months in the Antarctic atmosphere).
Using a 3D chemical transport model (UCI-CTM), Nicewonger et al. (2020b) demonstrated that Antarctic ice core records of ethane and acetylene are sensitive to biomass burning emissions from non-boreal regions and primarily reflect tropical burning. Ethane and acetylene records thus suggest stable biomass burning emissions in the period spanning 1000 to 1500 CE and a gradual decline in fire emissions from the MP to the LIA in the 1500s, with the LIA as a minimum in burning. This decline is estimated to be 30 %–45 % (respectively, 50 %) by the ethane (respectively, acetylene) datasets (Nicewonger et al., 2018, 2020a). Our atmospheric history of Antarctic [CO] supports this finding; considering the small changes in the methane and BVOC oxidation CO sources (Sect. 3.5.1), stable fire CO emissions are required to explain the stable atmospheric [CO] retrieved from the DC12 and ABN ice cores (Fig. 3). A slight decrease in BVOC emissions during the LIA (Acosta et al., 2014) may partially explain a decrease in [CO] during that period, but a reduction in biomass burning during the LIA is also likely to be dominant contributor. Similarly to ethane, CO in the Antarctic atmosphere is likely primarily caused by fire emissions occurring at tropical latitudes.
To further investigate the tropical fire emission footprint of our SH atmospheric [CO] record, we extracted two unpublished regional charcoal indexes for the intertropical latitudinal band (25∘ N–25∘ S) and the extratropical SH (25–60∘ S) from the Global Paleofire Database (https://database.paleofire.org, last access: 11 July 2023; Fig. S16). However, the charcoal indexes are based on z scores for each charcoal record, and an average z score is calculated for the entire zonal area. The z scores imply that the variance of each individual record is standardized to 1, irrespective of the true amount of biomass burned or the true CO emissions from it. Today, the largest amount of biomass burned comes from the African savannah every year, and those regions are also expected to have strongly contributed to CO emissions in the past. In essence, charcoal records are better suited to an assessment of the frequency of fires than the resulting emissions. They therefore provide a good overall estimate of fire dynamics over time, which cannot be directly interpreted as the volume of fire products. With those limitations in mind, we can note that our atmospheric [CO] record exhibits similarities with the tropical charcoal index (Fig. 5c), with stable burning during the MP, and a minimum in burning during the LIA followed by a sharp increase. While both the tropical charcoal index and [CO] increase simultaneously in ∼1750 CE, the tropical charcoal index start declining in 1150 CE (i.e., 250 years earlier than CO, ethane, and acetylene). We hypothesize that CO variability over Antarctica is driven by integrated fire variability occurring over a wider area, with a significant contribution from the extratropical Southern Hemisphere (Fig. 5d). The charcoal index integrated at the extratropical SH scale does not exhibit a decline during the LIA, which is in agreement with an Antarctic black carbon record from the east Antarctic Plateau which integrates fire emissions south of 40∘ S (McConnell et al., 2021). This stable trend, however, also masks the regional variability in fire emissions driven by both climatic factors (e.g., shift in the location of the Intertropical Convergence Zone impacting precipitation patterns) and anthropogenic factors (e.g., new human settlements in Oceania or the catastrophic collapse that occurred in the Americas following the European arrival after 1492; McConnell et al., 2021; Koch et al., 2019).
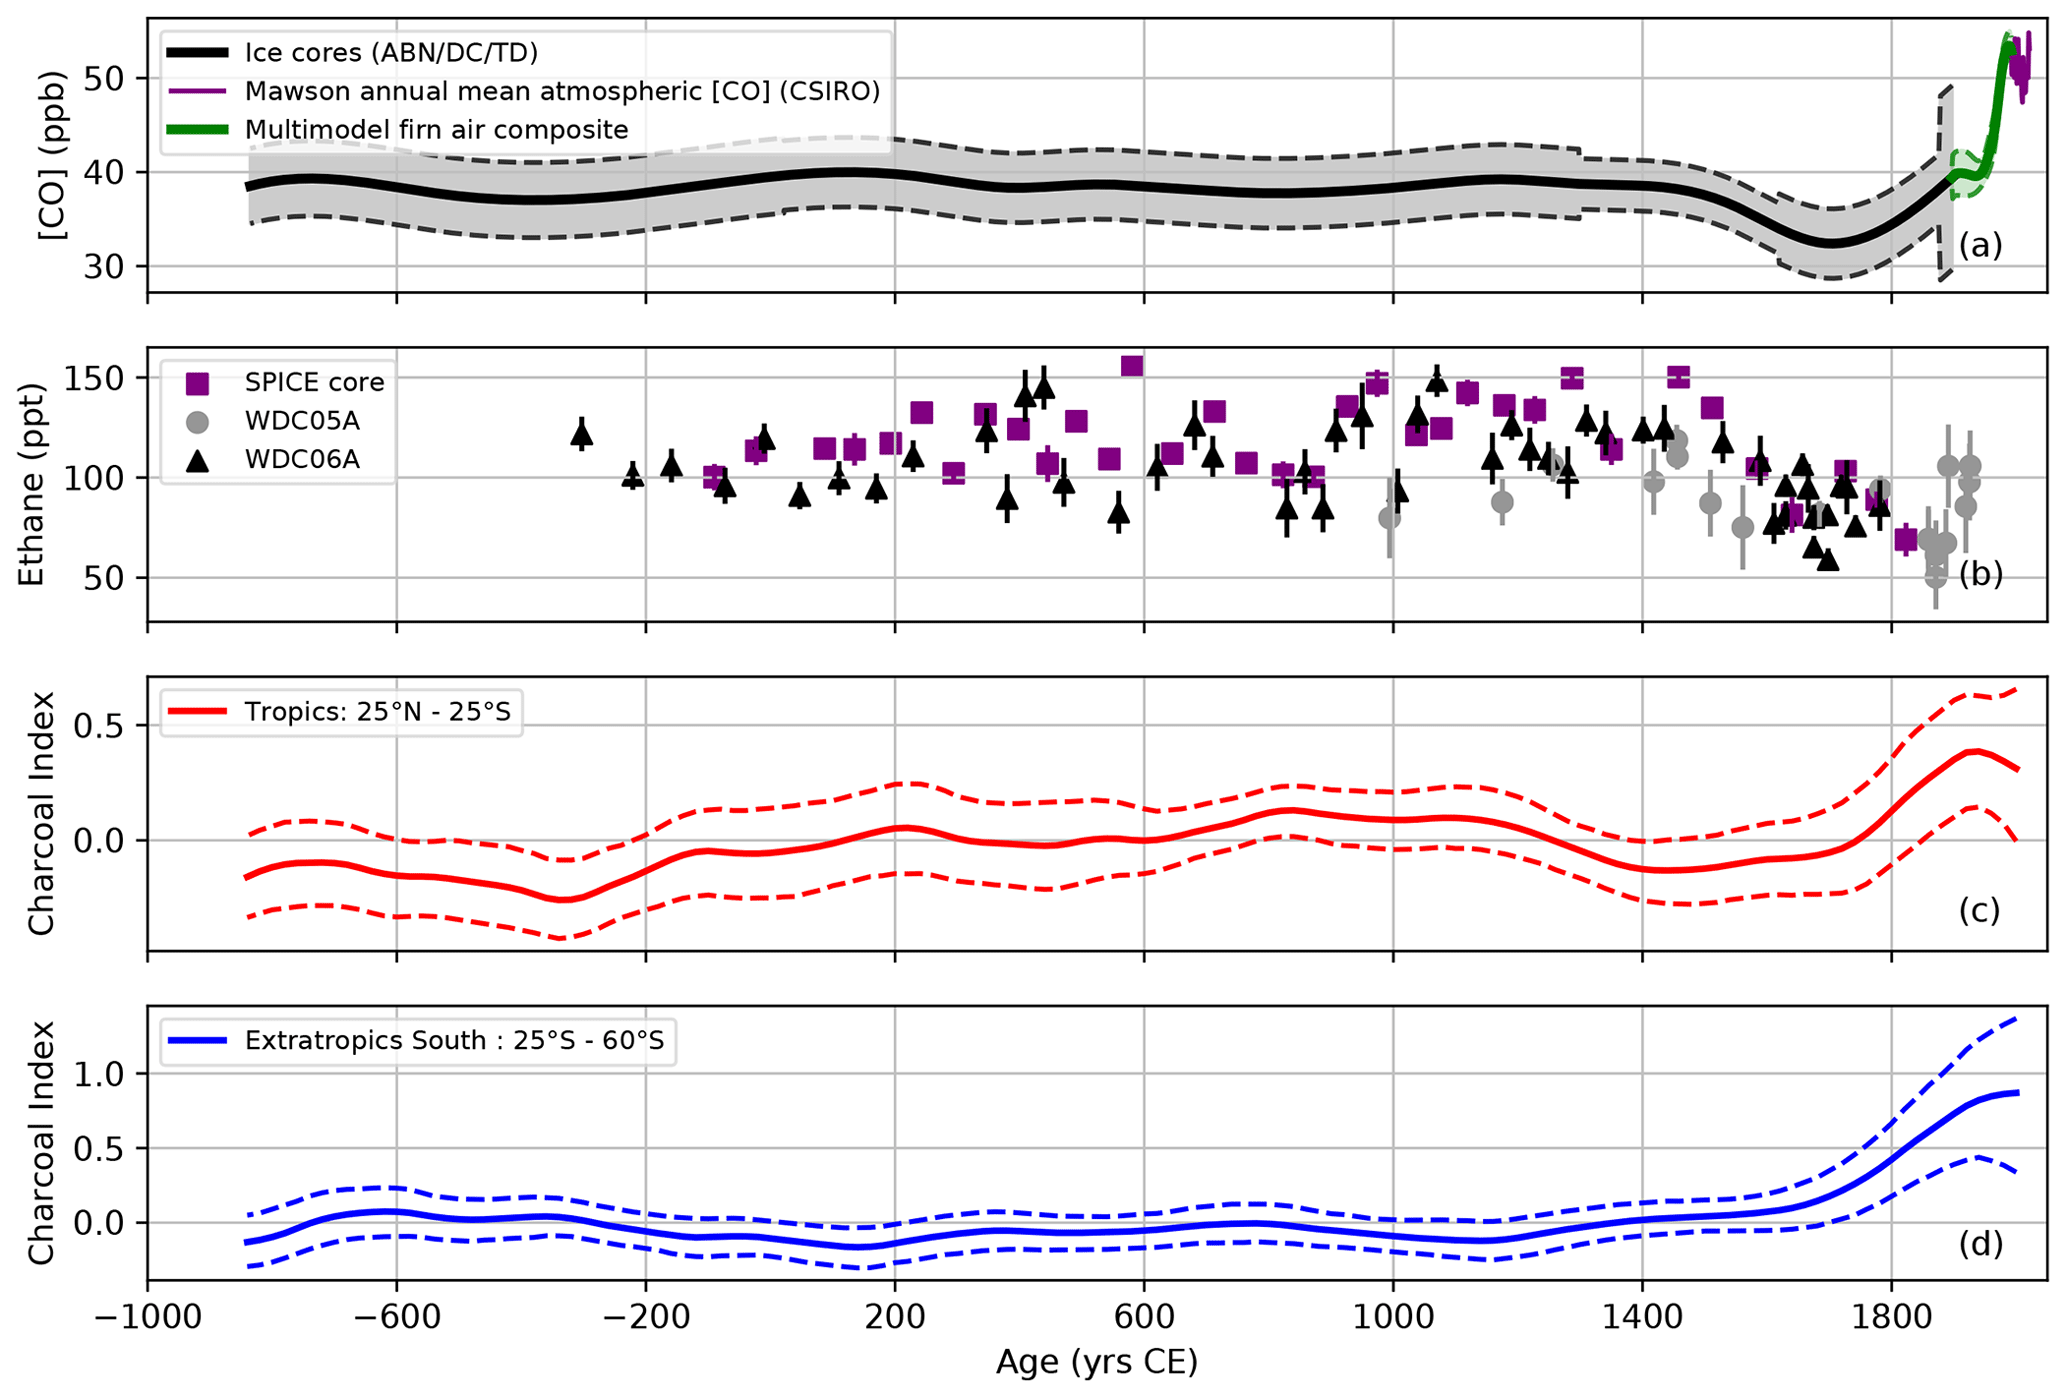
Figure 5Antarctic ice core and firn air CO (a; this study), and ethane (b; Nicewonger et al., 2018) records. Charcoal indexes for the intertropical 25∘ N–25∘ S latitudinal band (c) and the extratropical SH 25–60∘ S (d) for the last 3000 years are extracted from the Global Paleofire Database (https://database.paleofire.org, last access: 11 July 2023). Charcoal indexes are average z scores of transformed charcoal influx per region (100 year smoothing window 1000 year bootstrap). Dotted-line envelopes on the charcoal indexes represent the upper and lower 95 % confidence intervals from the bootstrap analysis.
Finally, PI fire modeling conducted by van der Werf et al. (2013) suggests that the contribution of fire to the Antarctic [CO] in 1400 CE was ∼35 % below present-day level, with the largest drop due to lower deforestation in South America in 1400 CE. This finding is in disagreement with Wang et al. (2010), who estimated that fire emissions contributed ∼30 ppb to [CO] in the Antarctic atmosphere in 1350 CE (i.e., a contribution larger than modern fire emissions estimated at 7 ppb; van der Werf et al., 2013). The lower [CO] levels revealed by our new CO record are thus in better agreement with the paleofire modeling of van der Werf et al. (2013) for the period prior to 1400 CE.
3.5.3 Did biomass burning peak at the onset of the industrial period?
The CO records (mixing ratios and isotopic ratios) from Wang et al. (2010) suggest that biomass burning emissions increased rapidly during the 1700s and 1800s and peaked during the late 19th century at rates roughly 3 times modern levels (defined as the 1997–2016 CE period of global satellite records of biomass burning). On the other hand, there is no evidence in the three ice core hydrocarbon records (Mischler et al., 2009; Sapart et al., 2012; Nicewonger et al., 2018, 2020a), or in the BC Antarctic dataset (Liu et al., 2021), for such a large peak in fire emissions or activity in the late 1800s. Marlon et al. (2008) suggest that the sharp increase in the charcoal index from ∼1750 CE onwards, on a global scale, may be related to the increase in human activities worldwide as a result of population growth. The decline after ∼1850 CE would be associated with changes in land use on a global scale, due to more intensive practices and coupled with fire suppression.
SH biomass burning proxies are used to evaluate biogeochemical and atmospheric chemical transport models that investigate PI biomass burning rates. The output of such models is closely related to PI biomass burning emission inventories. Such inventories are still subject to debate, with contradictory hypotheses discussed. On the one hand, biomass burning emission inventories (such as the CMIP6 inventories) commonly scale up the fire emission with population (e.g., van der Werf, 2013; van Marle et al., 2017), suggesting that there are lower biomass burning emission in PI compared to present day. On the other hand, hypothesizing a decline in burned areas with increasing population density due to land use changes (Knorr et al., 2014; Andela et al., 2017) leads to biomass burning reaching higher levels in the PI compared to the present day (e.g., Hamilton et al., 2018; Liu et al., 2021; Rowlinson et al., 2020).
While hypothesizing a positive relationship between fire and population density, van der Werf et al. (2013) inferred how PI fire emissions could have contributed to [CO] in the Antarctic atmosphere. These authors find that all of the SH non-forest land would have to burn annually or biannually to explain the Wang et al. (2010) CO levels (i.e., a 30 ppb contribution from fires to Antarctic [CO] in 1900 CE). They conclude that such a scenario is unlikely, notably because, in arid regions, not all savannas build up enough fuel each year to be able to burn annually. Murray et al. (2014) used a chemical transport model (GEOS-Chem) coupled with land cover and fire emissions from dynamic global vegetation models (BIOME4 and LPJ-LMfire) to simulate the PI atmospheric composition. They established a “low-PI-fire” scenario by scaling the LPJ-LMfire total dry matter consumed to match emissions implied by the charcoal accumulation rates from the Global Charcoal Database (Power et al., 2008; van der Werf et al., 2010). Such a low-fire scenario yields 35 ppb surface total [CO] at SP in 1770 CE. This value is significantly lower than the SP [CO] of 47±4 ppb (Wang et al., 2010) but compares well with the 33.5±5.0 ppb reconstructed in this study (Fig. 3). More recently, Rowlinson et al. (2020) simulated PI [CO] levels using the TOMCAT chemical transport model (which include BVOC chemistry) with CMIP6 fire emission inventory (van Marle et al., 2017). Simulated Antarctic CO mixing ratios using PI CMIP6 emissions in 1750 CE are 37 ppb, which is also substantially lower than the Wang et al. (2010) value of 45±5 ppb but similar to our CO reconstruction, which exhibits 33.0±5.0 ppb for the CO mixing ratio in the Antarctic atmosphere.
The PI LMfire and PI SIMFIRE-BLAZE model fire emissions inventories consider that land use changes imply a decline in burned areas with increasing population density (Hamilton et al., 2018). Similarly, Murray et al. (2014) reported a “high-fire” PI fire inventory using the LMfire model and assuming decreases in passive fire suppression (due to less fragmentation in the landscape and reduced livestock grazing) and the absence of active fire suppression. These three inventories lead to biomass burning reaching higher levels in the PI compared to the present day (Hamilton et al., 2018; Liu et al., 2021; Murray et al., 2014) and emissions substantially larger than those used in the PI framework of CMIP6. Notably, Liu et al. (2021) concluded that fire emissions remained relatively stable in the SH between 1750 and ∼1920 CE, followed by a 30 % decrease until about 1990 CE. This conclusion is supported by a comparison of simulated BC deposition fluxes, with BC measurement conducted on an array of ice cores (14 Antarctica records and 1 record from the Andes). When using SIMFIRE-BLAZE and LMfire emissions, Antarctic [CO] in 1750 CE are estimated at 48 and 61 ppb, respectively (Rowlinson et al., 2020). The high-fire inventory reported by Murray et al. (2014) also yields elevated [CO] in the Antarctic atmosphere, with PI mixing ratios reaching 63 ppb in 1770 CE. Such values are significantly larger than our continuous [CO] ice core record (Fig. 3).
Large uncertainty remains about PI SH biomass burning, with implications for our understanding of the magnitude of the historical radiative forcing due to anthropogenic aerosol emissions (e.g., Hamilton et al., 2018). All fire inventories discussed previously fall within the current uncertainty range for fire emissions (Pan et al., 2020). Although simulating larger PI fire emissions, Hamilton et al. (2018) could not reproduce the enhancement in the PI CO emissions from fires reported by Wang et al. (2010), and Liu et al. (2021) do not report a maximum in fire emission in the SH at the onset of the 20th century. The trend and levels of the SP and D47 CO SH record (Fig. 3; Wang et al., 2010) are often difficult to reconcile with fire modeling. Our new SH [CO] atmospheric reconstruction, which does not exhibit a maximum in the late 19th century, is in agreement with paleofire proxies such as acetylene, ethane, methane isotopes, or BC retrieved from Antarctic ice cores (Nicewonger 2018, 2020a; Sapart, 2012; Mischler et al., 2009; Liu et al., 2021), and can bring new constraints on paleofire simulations.
3.6 Increase in SH atmospheric [CO] during the industrial era
Our multimodel atmospheric record based on firn air samples reveals rather stable [CO] from 1900 to 1945 CE, followed by an increase in [CO] from 40.0±1.5 to 53.5±1.5 during the period spanning 1945 to 1987 CE (Fig. 3). This period exhibits the highest atmospheric [CO] growth rate in the SH atmospheric [CO] record over the last 3 millennia, with a mean rate of 0.32 ppb yr−1. Antarctic [CO] declined slightly over the period 1988–1992 CE (firn air reconstruction). From 1993 to 2021 CE, the Mawson [CO] record shows interannual variability reaching 5 ppb but remains below 53.5 ppb when such interannual variability is smoothed out with a 5-year running window. Our record thus suggests that the late 1980s represent a maximum in atmospheric [CO] over the last 3 millennia.
During the industrial era, the atmospheric Antarctic [CO] can be interestingly compared with the [CO] record extracted from the Greenland archives. By analyzing [CO] depth profiles collected from firn air at three different Greenland sites (NGRIP, Summit, and NEEM), Petrenko et al. (2013) obtained a reconstruction of atmospheric [CO] spanning 1950–2010 CE. This reconstruction has been recently extended back to 1700 CE with the CFA analysis of four different Greenland ice cores (NGRIP, PLACE, NEEM, and D4) (Faïn et al., 2022). Faïn et al. (2022) could not fully exclude the possibility that the Greenland ice archive CO reconstruction could be slightly positively biased by chemical processes (in situ production) occurring within the Greenland ice. Therefore, the atmospheric [CO] history extracted from Greenland should be considered to be an upper bound of the past [CO] abundance in the Arctic (Faïn et al., 2022). The Greenland firn-air-reconstructed history suggests that Arctic [CO] in 1950 CE was 140–150 ppb, rose by 10–15 ppb from 1950 CE to the 1970s, and peaked in the early 1980s before a ∼30 ppb decline to today's levels. Consequently, atmospheric [CO] exhibits a maximum in the 1980s at the global scale, with [CO] levels about 3 fold higher in the Northern Hemisphere (NH). However, the increasing trend in atmospheric [CO] prior to the maximum in the 1980s differs among hemispheres, with [CO] starting to increase in the late 1800s in the NH and only in 1945 CE in the SH.
Changes in CO over the past century would be the net result of several possible factors, including direct emissions from natural and anthropogenic sources, biomass burning, and chemical loss of CO by OH oxidation partly offset by CO production from the oxidation of CH4 and other hydrocarbons by OH.
The peak in CO in our SH record and subsequent decrease from the 1980s has similar timing to that found in the NH firn and ice core measurements (Petrenko et al., 2013; Faïn et al., 2022). The NH decrease was attributed to reduced anthropogenic emissions, resulting from improved fossil fuel combustion efficiency and pollution controls in the transport sector through the use of catalytic converters (Wang et al., 2012). Reduced CO emissions from transport are also found for this time in inventory emissions estimates (Hoesly et al., 2018) and, together with biomass burning reductions, are attributed to the continued decrease in global [CO] since 2000, which has been inferred from inverse modeling (Zheng et al., 2019). The [CO] peak and the subsequent decrease in the SH is less pronounced than in the NH, despite the age resolution of our Antarctic firn air record that would record rapid atmospheric changes with minimal smoothing. This may be interpreted as emissions from sources that are more concentrated in the NH, likely anthropogenic and fossil fuel emissions, and also contributed to the peak and subsequent decrease in the CO in the SH.
Atmospheric surface [CO] simulated by state-of-the-art global chemistry–climate models (e.g., Collins et al., 2017) is required to better understand the roles of CO source variations and coupled CO–OH–CH4 chemistry for the period spanning 1850 to the present. Because emissions from anthropogenic, biomass burning, and chemical sources and CO loss by oxidation have different relative contributions in the high-latitude SH and NH, we would expect the Antarctic and Arctic CO reconstructions to provide valuable modeling constraints. A new modeling study for the industrial period is beyond the scope of the present work but is underway for a future paper.
We have produced a firn air record of past atmospheric CO mixing ratio for the high SH latitudes based on seven different Antarctic firn air sites (Berkner, DE08-2, DSSW20K, DSSW19K, Lock-In, South Pole, and ABN) for the period covering 1897–2016 CE. The quality of this firn air record is supported by the good agreement with direct atmospheric measurements of [CO] at Mawson Station from 1992 CE, which extends the record to 2021 CE. New continuous profiles of [CO] have been measured, covering the past 3 millennia, by coupling ice core melter systems with online measurements (SARA spectrometer) along three Antarctic ice cores (DC12, ABN, and TALDICE archives) with supplementary data from the EDML-B40 and SolarIce cores. None of the Antarctic records revealed high and variable concentrations that were previously observed in Greenland ice cores and interpreted as in situ CO production (Faïn et al., 2014, 2022). We calculated a multi-site average ice core record, extending the firn air history of [CO] in the Antarctic atmosphere to −835 CE.
Our reconstruction of past atmospheric [CO] at the southern latitudes reveals (i) stable levels prior to 1500 CE at levels of about 40 ppb, (ii) a ∼5 ppb decrease between the medieval period and the LIA, and (iii) a progressive increase from a minimum of 32.5±3.7 ppb in ∼1700 CE to near-present-day levels of 53.6±1.6 ppb by 1985 CE. This trend relies on an excellent agreement between 10 firn air and ice core [CO] records and link with modern [CO] atmospheric monitoring. Our new CO record exhibits substantial differences with the CO data from the D47, SP, and VST ice cores (Haan et al., 1996; Haan and Raynaud, 1998; Wang et al., 2010). The CO record reported in this study exhibits overall lower levels (e.g., ∼10 ppb lower prior to 1400 CE), a minimum during the LIA occurring about 100 years later, and no maximum in [CO] in the late 1800s. Our new [CO] record is in agreement with other ice core SH biomass burning proxies such as ethane or acetylene (e.g., Nicewonger et al., 2018, 2020a) and fire modeling (e.g., van der Werf, 2013; Hamilton et al., 2018) that do not reproduce a large biomass burning in the SH at the onset of the 20th century.
Overall, large uncertainties remain on preindustrial fire history (Nicewonger et al., 2020b), with implications for the PI to modern evolution in aerosol radiative forcing (Hamilton et al., 2018). Nicewonger et al. (2020b) used chemical transport models to investigate if a single global burning history could be extracted from the three hydrocarbon ice core records. They could not find a consistent fire history, even when assuming unrealistic changes in the spatial distribution of fire and biomes.
These ice core, firn, and atmospheric [CO] measurements, spanning −835–2021 CE, provide a benchmark record of past variations in the high southern latitude [CO] for future atmospheric chemistry model studies. Since the early 20th century, industrial activities have impacted biogeochemistry, thus resulting in large CO changes (Szopa et al., 2021). Rapid growth in [CO] from the mid-1900s was likely due to combustion sources and the indirect CO production from atmospheric CH4 oxidation. Disentangling the roles of these sources and possible changes in the OH sink in this [CO] growth and the subsequent [CO] decrease over the past 3 decades involves understanding the coupled CO–OH–CH4 system. A natural extension of this work will be the comparison of our ice- and firn-based atmospheric [CO] reconstruction for the period covering 1850 to the present, with model outputs from the AerChemMIP exercise (Collins et al., 2017).
The following datasets are accessible on PANGAEA (https://doi.org/10.1594/PANGAEA.960615; Faïn et al., 2023): (i) ice core high-resolution [CO] and multi-site ice core [CO] composite, and (ii) firn air [CO] and atmospheric [CO] inversions from firn air and atmospheric [CO] from Mawson Station (Antarctica).
The supplement related to this article is available online at: https://doi.org/10.5194/cp-19-2287-2023-supplement.
This scientific project was designed by XF, JC, DME, EJB, TB, and MAJC. The high-resolution ice core carbon monoxide measurements were carried out by XF, KF, and RHR, with support from RG, NJC, and JRM. The firn air [CO] analyses were carried out by RLL, XF, AL, and WTS. XF, GT, DME, JC, and JF participated in ice core drilling or firn air sampling. The firn air models were developed and implemented by PM and CMT. The codes for data processing were developed by KF, JRM, RLL, PM, and XF. Charcoal datasets were processed by BV. All authors contributed to the interpretation of the data. The paper was written by XF, with help from all co-authors. Specific methodological sections were written by CMT, PM, and RLL.
The contact author has declared that none of the authors has any competing interests.
Publisher’s note: Copernicus Publications remains neutral with regard to jurisdictional claims made in the text, published maps, institutional affiliations, or any other geographical representation in this paper. While Copernicus Publications makes every effort to include appropriate place names, the final responsibility lies with the authors.
This article is part of the special issue “Ice core science at the three poles (CP/TC inter-journal SI)”. It is not associated with a conference.
The authors are grateful to the late Jean-Marc Barnola (LGGE) at Law Dome in 1993; Andrew Smith (ANSTO) and the late Alan Elcheick (Australian Antarctic Division) at Law Dome in 1998; Dominic Ferretti (NIWA; New Zealand) at Law Dome in 2004; Mark Battle (Bowdoin University), Jesse Bastide (Bowdoin University), James Butler (NOAA), and Andrew Clarke (NOAA) at the South Pole in 2001; and Darren Spencer and Paul Krummel for measurements at CSIRO GASLAB. The authors are grateful to Olivia Maselli, Larry Layman, Daniel Pasteris, Michael Sigl, and other members of the DRI team, who assisted with the measurement campaigns. We thank Sophie Szopa and Frederic Parrenin for useful discussions. The French–Italian project SolarIce (IPEV1145; grant no. PNRA16_00008) benefited from logistical support from the French and Italian Polar Agencies, IPEV and PNRA, and the F2G for drilling activities at Concordia Station. The French Polar Institute (IPEV) also provided logistical support for the ABN, DC12, and Lock-In ice core drillings. We are grateful to the drillers and field teams. We thank the Australian Antarctic Science Program and the Australian Antarctic Division for their support of the drilling programs and atmospheric measurements (AAS project no. 4621) and the Australian Bureau of Meteorology for air sampling at Mawson. We thank Michel Ramonet, Olivier Laurent, Luc Lienhardt, and the entire team of the Integrated Carbon Observation System (ICOS) at the Laboratoire des Sciences du Climat et de l'Environnement (LSCE) for the time spent during the calibration of the OF-CEAS SARA spectrometer in September 2020. The TALos Dome Ice CorE (TALDICE) project, a joint European program, has been funded by national contributions from Italy, France, Germany, Switzerland, and the United Kingdom. Primary logistical support was provided by Programma Nazionale di Ricerche in Antartide (PNRA) at Talos Dome. This work is TALDICE publication no. 62. This paper was greatly improved by constructive comments from Murat Aydin, Vasilii Petrenko, and Hubertus Fisher.
This work has been supported by the French ANR projects RPD-COCLICO (grant no. 10-RPDOC-002-01; Xavier Faïn); by the EU FP7-IP (grant no. ENV-2010/265148; project Pegasos; Xavier Faïn) and FP7 ERC (grant no. 291062; project Ice and Lasers; Jérôme Chappellaz); by the U.S. NSF (grant nos. 0221515, 0909541, 1204176, and 1406219; all Joseph R. McConnell; grant no. 0968391; Edward J. Brook). Rachael H. Rhodes has received funding from the Isaac Newton Trust (grant no. LBZG/080). The Australian Antarctic Science Program and the Australian Antarctic Division supported the drilling programs and atmospheric measurements (AAS; project no. 4621). The Australian Bureau of Meteorology supported the air sampling at Mawson. The Lock-In field and scientific program has been funded by the French Polar Institute IPEV (project no. 1153), and the CNRS INSU/LEFE (project no. NEVE-CLIMAT).
This paper was edited by Hubertus Fischer and reviewed by Murat Aydin and Vasilii Petrenko.
Acosta Navarro, J. C., Smolander, S., Struthers, H., Zorita, E., Ekman, A. M. L., Kaplan, J. O., Guenther, A., Arneth, A., and Riipinen, I.: Global emissions of terpenoid VOCs from terrestrial vegetation in the last millennium, J. Geophys. Res.-Atmos., 119, 6867–6885, https://doi.org/10.1002/2013JD021238, 2014.
Allan, D. W.: Statistics of atomic frequency standards, Proc. IEEE, 54, 221–230, https://doi.org/10.1109/PROC.1966.4634, 1966.
Andela, N., Morton, D. C., Giglio, L., Chen, Y., van der Werf, G. R., Kasibhatla, P. S., DeFries, R. S., Collatz, G. J., Hantson, S., Kloster, S., Bachelet, D., Forrest, M., Lasslop, G., Li, F., Mangeon, S., Melton, J. R., Yue, C., and Randerson, J. T.: A human-driven decline in global burned area, Science, 356, 1356–1362, https://doi.org/10.1126/science.aal4108, 2017.
Archibald, S., Lehmann, C. E. R., Belcher, C. M., Bond, W. J., Bradstock, R. A., Daniau, A. L., Dexter, K. G., Forrestel, E. J., Greve, M., He, T., Higgins, S. I., Hoffmann, W. A., Lamont, B. B., McGlinn, D. J., Moncrieff, G. R., Osborne, C. P., Pausas, J. G., Price, O., Ripley, B. S., Rogers, B. M., Schwilk, D. W., Simon, M. F., Turetsky, M. R., Van Der Werf, G. R., and Zanne, A.: Biological and geophysical feedbacks with fire in the Earth system, Environ. Res. Lett., 13, 033003, https://doi.org/10.1088/1748-9326/aa9ead, 2018.
Assonov, S. S., Brenninkmeijer, C. A. M., Jöckel, P., Mulvaney, R., Bernard, S., and Chappellaz, J.: Evidence for a CO increase in the SH during the 20th century based on firn air samples from Berkner Island, Antarctica, Atmos. Chem. Phys., 7, 295–308, https://doi.org/10.5194/acp-7-295-2007, 2007.
Barnola, J. M., Anklin, M., Porcheron, J., Raynaud, D., Schwander, J., and Stauffer, B.: CO2 evolution during the last millennium as recorded by Antarctic and Greenland ice, Tellus, 47, 264–272, 1995.
Battle, M. O., Bender, M., Sowers, T., Tans, P. P., Butler, J. H., Elkins, J. W., Ellis, J. T., Conway, T., Zhang, N., Lang, P., and Clarke, A. D.: Atmospheric gas concentrations over the past century measured in air from firn at the South Pole, Nature, 383, 231–235, 1996.
Bisiaux, M. M., Edwards, R., McConnell, J. R., Curran, M. A. J., Van Ommen, T. D., Smith, A. M., Neumann, T. A., Pasteris, D. R., Penner, J. E., and Taylor, K.: Changes in black carbon deposition to Antarctica from two high-resolution ice core records, 1850–2000 AD, Atmos. Chem. Phys., 12, 4107–4115, https://doi.org/10.5194/acp-12-4107-2012, 2012.
Beck, J., Bock, M., Schmitt, J., Seth, B., Blunier, T., and Fischer, H.: Bipolar carbon and hydrogen isotope constraints on the Holocene methane budget, Biogeosciences, 15, 7155–7175, https://doi.org/10.5194/bg-15-7155-2018, 2018.
Bock, M., Schmitt, J., Beck, J., Seth, B., Chappellaz, J., and Fischer, H.: Glacial/interglacial wetland, biomass burning, and geologic methane emissions constrained by dual stable isotopic CH4 ice core records, P. Natl. Acad. Sci. USA, 114, E5778–E5786, https://doi.org/10.1073/pnas.161388311, 2017.
Bond, W. J. and Keeley, J. E.: Fire as a global “herbivore”: the ecology and evolution of flammable ecosystems, Trends Ecol. Evol., 20, 387–94, https://doi.org/10.1016/j.tree.2005.04.025, 2005.
Bowman, D. M. J. S., Balch, J. K., Artaxo, P., Bond, W. J., Carlson, J. M., Cochrane, M. A., D'Antonio, C. M., DeFries, R. S., Doyle, J. C., Harrison, S. P., Johnston, F. H., Keeley, J. E., Krawchuk, M. A., Kull, C. A., Marston, J. B., Moritz, M. A., Prentice, I. C., Roos, C. I., Scott, A. C., Swetnam, T. W., van der Werf, G. R., and Pyne, S. J.: Fire in the Earth System, Science, 324, 481–484, https://doi.org/10.1126/science.1163886, 2009.
Brenninkmeijer, C. A. M., Koeppel, C., Rockmann, T., Scharffe, D. S., Braunlich, M., and Gros, V.: Absolute measurement of the abundance of atmospheric carbon monoxide, J. Geophys. Res., 106, 3–10, 2001.
Bruhn, D., Albert, K. R., Mikkelsen, T. N., and Ambus, P.: UV-induced carbon monoxide emission from living vegetation, Biogeosciences, 10, 7877–7882, https://doi.org/10.5194/bg-10-7877-2013, 2013.
Buizert, C., Martinerie, P., Petrenko, V. V., Severinghaus, J. P., Trudinger, C. M., Witrant, E., Rosen, J. L., Orsi, A. J., Rubino, M., Etheridge, D. M., Steele, L. P., Hogan, C., Laube, J. C., Sturges, W. T., Levchenko, V. A., Smith, A. M., Levin, I., Conway, T. J., Dlugokencky, E. J., Lang, P. M., Kawamura, K., Jenk, T. M., White, J. W. C., Sowers, T., Schwander, J., and Blunier, T.: Gas transport in firn: multiple-tracer characterisation and model intercomparison for NEEM, Northern Greenland, Atmos. Chem. Phys., 12, 4259–4277, https://doi.org/10.5194/acp-12-4259-2012, 2012.
Burkholder, J. B., Sander, S. P., Abbatt, J. P. D., Barker, J. R., Huie, R. E., Kolb, C. E., Kurylo, M. J., Orkin, V. L., Wilmouth, D. M., and Wine, P. H.: Chemical kinetics and photochemical data for use in atmospheric studies evaluation no. 18, JPL publication, Pasadena, 15–10, jet Propulsion Laboratory, https://jpldataeval.jpl.nasa.gov (last access: 10 January 2023), 2015.
Butler, J. H., Montzka, S. A., Battle, M., Clarke, A. D., Mondeel, D. J., Lind J. A., Hall B. D., and Elkins J. W.: Collection and analysis of firn air from the South Pole, Abstract A51F-0145 presented at 2001 Fall Meeting, December 2021, San Francisco, CA, USA, AGU, https://ui.adsabs.harvard.edu/abs/2001AGUFM.A51F0145B/abstract (last access: 6 November 2023), 2001.
Collins, W. J., Lamarque, J.-F., Schulz, M., Boucher, O., Eyring, V., Hegglin, M. I., Maycock, A., Myhre, G., Prather, M., Shindell, D., and Smith, S. J.: AerChemMIP: quantifying the effects of chemistry and aerosols in CMIP6, Geosci. Model Dev., 10, 585–607, https://doi.org/10.5194/gmd-10-585-2017, 2017.
Conte, L., Szopa, S., Séférian, R., and Bopp, L.: The oceanic cycle of carbon monoxide and its emissions to the atmosphere, Biogeosciences, 16, 881–902, https://doi.org/10.5194/bg-16-881-2019, 2019.
Crutzen, P. J.: A discussion of the chemistry of some minor constituents in the stratosphere and troposphere, Pure Appl. Geophys., 106–108, 1385–1399, https://doi.org/10.1007/BF00881092, 1973.
Duncan, B., Logan, J. A., Bey, I., Megretskaia, I. A., Yantosca, R. M., Novelli, P. C., Jones, N. B., and Rinsland, C. P.: Global budget of CO, 1988–1997: Source estimates and validation with a global model, J. Geophys. Res., 112, D22301, https://doi.org/10.1029/2007jd008459, 2007.
Etiope, G. and Ciccioli, P.: Earth's Degassing: A Missing Ethane and Propane Source, Science, 323, 478–478, https://doi.org/10.1126/science.1165904, 2009.
Etheridge, D. M., Steele, L. P., Langenfelds, R. L., Francey, R. J., Barnola, J. M., and Morgan, V. I.: Natural and anthropogenic changes in atmospheric CO2 over the last 1000 years from air in Antarctic ice and firn, J. Geophys. Res., 101, 4115–4128, 1996.
Fabre, A., Barnola, J. M., Arnaud, L., and Chappellaz, J.: Determination of gas diffusivity in polar firn: comparison between experimental measurements and inverse modeling, Geophys. Res. Lett., 27, 557–560, 2000.
Faïn, X., Chappellaz, J., Rhodes, R. H., Stowasser, C., Blunier, T., McConnell, J. R., Brook, E. J., Preunkert, S., Legrand, M., Debois, T., and Romanini, D.: High resolution measurements of carbon monoxide along a late Holocene Greenland ice core: evidence for in situ production, Clim. Past, 10, 987–1000, https://doi.org/10.5194/cp-10-987-2014, 2014.
Faïn, X., Rhodes, R. H., Place, P., Petrenko, V. V., Fourteau, K., Chellman, N., Crosier, E., McConnell, J. R., Brook, E. J., Blunier, T., Legrand, M., and Chappellaz, J.: Northern Hemisphere atmospheric history of carbon monoxide since preindustrial times reconstructed from multiple Greenland ice cores, Clim. Past, 18, 631–647, https://doi.org/10.5194/cp-18-631-2022, 2022.
Faïn, X., Etheridge, D. M., Fourteau, K., Martinerie, P., Trudinger, C. M., Rhodes, R. H., Chellman, N. J., Langenfelds, R. L., McConnell, J. R., Curran, M., Brook, E. J., Blunier, T., Teste, G., Grilli, R., Lemoine, A., Sturges, W. T., Vannière, B., Freitag, J., and Chappellaz, J.: Carbon monoxide (CO) Antarctic records from ice cores (DC12, ABN, Taldice), firn air (DE08-2, DSSW19K, DSSW20K, South Pole, ABN, Lock-In), and Mawson Station atmospheric history from −835 to 2021 CE, PANGAEA [data set], https://doi.org/10.1594/PANGAEA.960615, 2023.
Ferretti, D. F., Miller, J. B., White, J. W. C., Etheridge, D. M., Lassey, K. R., Lowe, D. C., Meure, C. M. M., Dreier, M. F., Trudinger, C. M., van Ommen, T. D., and Langenfelds, R. L.: Unexpected changes to the global methane budget over the past 2000 years, Science, 309, 1714–1717, https://doi.org/10.1126/science.1115193, 2005.
Fourteau, K., Faïn, X., Martinerie, P., Landais, A., Ekaykin, A. A., Lipenkov, V. Y., and Chappellaz, J.: Analytical constraints on layered gas trapping and smoothing of atmospheric variability in ice under low-accumulation conditions, Clim. Past, 13, 1815–1830, https://doi.org/10.5194/cp-13-1815-2017, 2017.
Fourteau, K., Martinerie, P., Faïn, X., Schaller, C. F., Tuckwell, R. J., Löwe, H., Arnaud, L., Magand, O., Thomas, E. R., Freitag, J., Mulvaney, R., Schneebeli, M., and Lipenkov, V. Ya.: Multi-tracer study of gas trapping in an East Antarctic ice core, The Cryosphere, 13, 3383–3403, https://doi.org/10.5194/tc-13-3383-2019, 2019.
Fourteau, K., Martinerie, P., Faïn, X., Ekaykin, A. A., Chappellaz, J., and Lipenkov, V.: Estimation of gas record alteration in very low-accumulation ice cores, Clim. Past, 16, 503–522, https://doi.org/10.5194/cp-16-503-2020, 2020.
Frezzotti, M., Urbini, S., Proposito, M., Scarchilli, C., and Gandolfi, S.: Spatial and temporal variability of surface mass balance near Talos Dome, East Antarctica, J. Geophys. Res.-Earth, 112, F02032, https://doi.org/10.1029/2006JF000638, 2007.
Gautier, E., Savarino, J., Erbland, J., Lanciki, A., and Possenti, P.: Variability of sulfate signal in ice core records based on five replicate cores, Clim. Past, 12, 103–113, https://doi.org/10.5194/cp-12-103-2016, 2016.
Guenther, A., Hewitt, C. N., Erickson, D., Fall, R., Geron, C., Graedel, T., Harley, P., Klinger, L., Lerdau, M., Mckay, W. A., Pierce, T., Scholes, B., Steinbrecher, R., Tallamraju, R., Taylor, J., and Zimmerman, P.: A global model of natural volatile organic compound emissions, J. Geophys. Res., 100, 8873, https://doi.org/10.1029/94JD02950, 1995.
Guenther, A. B., Jiang, X., Heald, C. L., Sakulyanontvittaya, T., Duhl, T., Emmons, L. K., and Wang, X.: The Model of Emissions of Gases and Aerosols from Nature version 2.1 (MEGAN2.1): an extended and updated framework for modeling biogenic emissions, Geosci. Model Dev., 5, 1471–1492, https://doi.org/10.5194/gmd-5-1471-2012, 2012.
Haan, D. and Raynaud, D.: Ice core record of CO variations during the last two millennia: atmospheric implications and chemical interactions within the Greenland ice, Tellus B, 50, 253–262, 1998.
Haan, D., Martinerie, P., and Raynaud, D.: Ice core data of atmospheric carbon monoxide over Antarctica and Greenland during the last 200 years, Geophys. Res. Lett., 23, 2235–2238, 1996.
Hamilton, D. S., Hantson, S., Scott, C. E., Kaplan, J. O., Pringle, K. J., Nieradzik, L. P., Rap, A., Folberth, G. A., Spracklen, D. V., and Carslaw, K. S.: Reassessment of pre-industrial fire emissions strongly affects anthropogenic aerosol forcing, Nat. Commun., 9, 3182, https://doi.org/10.1038/s41467-018-05592-9, 2018.
Hantson, S., Knorr, W., Schurgers, G., Pugh, T. A. M., and Arneth, A.: Global isoprene and monoterpene emissions under changing climate, vegetation, CO2 and land use, Atmos. Environ., 155, 35–45, https://doi.org/10.1016/j.atmosenv.2017.02.010, 2017.
Helmig, D., Petrenko, V., Martinerie, P., Witrant, E., Röckmann, T., Zuiderweg, A., Holzinger, R., Hueber, J., Thompson, C., White, J. W. C., Sturges, W., Baker, A., Blunier, T., Etheridge, D., Rubino, M., and Tans, P.: Reconstruction of Northern Hemisphere 1950–2010 atmospheric non-methane hydrocarbons, Atmos. Chem. Phys., 14, 1463–1483, https://doi.org/10.5194/acp-14-1463-2014, 2014.
Helmig, D., Rossabi, S., Hueber, J., Tans, P., Montzka, S. A., Masarie, K., Thoning, K., Plass-Duelmer, C., Claude, A., Carpenter, L. J., Lewis, A. C., Punjabi, S., Reimann, S., Vollmer, M. K., Steinbrecher, R., Hannigan, J. W., Emmons, L. K., Mahieu, E., Franco, B., Smale, D., and Pozzer, A.: Reversal of global atmospheric ethane and propane trends largely due to US oil and natural gas production, Nat. Geosci., 9, 490–495, https://doi.org/10.1038/ngeo2721, 2016.
Hmiel, B., Petrenko, V. V., Dyonisius, M. N., Buizert, C., Smith, A. M., Place, P. F., Harth, C., Beaudette, R., Hua, Q., Yang, B., Vimont, I., Michel, S. E., Severinghaus, J. P., Etheridge, D. M., Bromley, T., Schmitt, J., Faïn, X., Weiss, R. F., and Dlugokencky, E. J.: Preindustrial 14CH4 indicates greater anthropogenic fossil CH4 emissions, Nature, 578, 409–412, https://doi.org/10.1038/s41586-020-1991-8, 2020.
Hoesly, R. M., Smith, S. J., Feng, L., Klimont, Z., Janssens-Maenhout, G., Pitkanen, T., Seibert, J. J., Vu, L., Andres, R. J., Bolt, R. M., Bond, T. C., Dawidowski, L., Kholod, N., Kurokawa, J.-I., Li, M., Liu, L., Lu, Z., Moura, M. C. P., O'Rourke, P. R., and Zhang, Q.: Historical (1750–2014) anthropogenic emissions of reactive gases and aerosols from the Community Emissions Data System (CEDS), Geosci. Model Dev., 11, 369–408, https://doi.org/10.5194/gmd-11-369-2018, 2018.
Kaplan, J. O., Krumhardt, K. M., Ellis, E. C., Ruddiman, W. F., Lemmen, C., and Klein Goldewijk, K.: Holocene carbon emissions as a result of anthropogenic land cover change, The Holocene, 21, 775–791, https://doi.org/10.1177/0959683610386983, 2011.
Khalil, M. A., Pinto, J., and Shearer, M.: Atmospheric carbon monoxide, Chemosph. – Glob. Chang. Sci., 1, ix–xi, https://doi.org/10.1016/S1465-9972(99)00053-7, 1999.
Klein Goldewijk, K., Beusen, A., Doelman, J., and Stehfest, E.: Anthropogenic land use estimates for the Holocene – HYDE 3.2, Earth Syst. Sci. Data, 9, 927–953, https://doi.org/10.5194/essd-9-927-2017, 2017.
Knorr, W., Kaminski, T., Arneth, A., and Weber, U.: Impact of human population density on fire frequency at the global scale, Biogeosciences, 11, 1085–1102, https://doi.org/10.5194/bg-11-1085-2014, 2014.
Koch, A., Brierley, C., Maslin, M. M., and Lewis, S. L.: Earth system impacts of the European arrival and Great Dying in the Americas after 1492, Quaternary Sci. Rev., 207, 13–36, https://doi.org/10.1016/J.QUASCIREV.2018.12.004, 2019.
Lamarque, J.-F., Shindell, D. T., Josse, B., Young, P. J., Cionni, I., Eyring, V., Bergmann, D., Cameron-Smith, P., Collins, W. J., Doherty, R., Dalsoren, S., Faluvegi, G., Folberth, G., Ghan, S. J., Horowitz, L. W., Lee, Y. H., MacKenzie, I. A., Nagashima, T., Naik, V., Plummer, D., Righi, M., Rumbold, S. T., Schulz, M., Skeie, R. B., Stevenson, D. S., Strode, S., Sudo, K., Szopa, S., Voulgarakis, A., and Zeng, G.: The Atmospheric Chemistry and Climate Model Intercomparison Project (ACCMIP): overview and description of models, simulations and climate diagnostics, Geosci. Model Dev., 6, 179–206, https://doi.org/10.5194/gmd-6-179-2013, 2013.
Langenfelds, R. L., Guerette E-A., Steele L. P., Krummel P. B., Spencer D. A., Loh Z. M., Gregory R. L., Thornton D. P., Howden R. T., and Fraser P. J.: Atmospheric methane, carbon dioxide, carbon monoxide, hydrogen and nitrous oxide from Cape Grim flask samples analysed by gas chromatography, in: Baseline Atmospheric Program (Australia), 2014–16, edited by: Langenfelds, R., Derek, N., and Cleland, S. L., Bureau of Meteorology and CSIRO Environment, Melbourne, Australia, in press, 2023.
Laube, J. C., Mohd Hanif, N., Martinerie, P., Gallacher, E., Fraser, P. J., Langenfelds, R., Brenninkmeijer, C. A. M., Schwander, J., Witrant, E., Wang, J.-L., Ou-Yang, C.-F., Gooch, L. J., Reeves, C. E., Sturges, W. T., and Oram, D. E.: Tropospheric observations of CFC-114 and CFC-114a with a focus on long-term trends and emissions, Atmos. Chem. Phys., 16, 15347–15358, https://doi.org/10.5194/acp-16-15347-2016, 2016.
Liu, P., Kaplan, J. O., Mickley, L. J., Li, Y., Chellman, N. J., Arienzo, M. M., Kodros, J. K., Pierce, J. R., Sigl, M., Freitag, J., Mulvaney, R., Curran, M. A. J., and McConnell, J. R.: Improved estimates of preindustrial biomass burning reduce the magnitude of aerosol climate forcing in the Southern Hemisphere, Sci. Adv., 7, eabc1379, https://doi.org/10.1126/sciadv.abc1379, 2021.
Loh, Z., Langenfelds, R., and Krummel, P.: Atmospheric CO at Casey by Commonwealth Scientific and Industrial Research Organisation, CO_CYA_surface-flask_CSIRO_data1, WDCGG [data set], ver.2021-04-08-1004, https://doi.org/10.50849/WDCGG_0016-7004-3001-01-02-9999, 2021a.
Loh, Z., Langenfelds, R., and Krummel, P.: Atmospheric CO at South Pole by Commonwealth Scientific and Industrial Research Organisation, dataset published as CO_SPO_surface-flask_CSIRO_data1, WDCGG [data set], ver.2021-04-08-1004, https://doi.org/10.50849/WDCGG_0016-7011-3001-01-02-9999, 2021b.
Loh, Z., Langenfelds, R., and Krummel, P.: Atmospheric CO at Mawson by Commonwealth Scientific and Industrial Research Organisation, CO_MAA_surface-flask_CSIRO_data1, WDCGG [data set], ver.2021-04-08-1004, https://doi.org/10.50849/WDCGG_0016-7005-3001-01-02-9999, 2021c.
Lelieveld, J., Gromov, S., Pozzer, A., and Taraborrelli, D.: Global tropospheric hydroxyl distribution, budget and reactivity, Atmos. Chem. Phys., 16, 12477–12493, https://doi.org/10.5194/acp-16-12477-2016, 2016.
Liu, P., Kaplan, J. O., Mickley, L. J., Li, Y., Chellman, N. J., Arienzo, M. M., Kodros, J. K., Pierce, J. R., Sigl, M., Freitag, J., Mulvaney, R., Curran, M. A. J., and Mcconnell, J. R.: Improved estimates of preindustrial biomass burning reduce the magnitude of aerosol climate forcing in the Southern Hemisphere, Sci. Adv., 27, PMC8163089, https://doi.org/10.1126/sciadv.abc1379, 2021.
Lukas, M. A.: Strong robust generalized cross-validation for choosing the regularization parameter, Inverse Probl., 24, 034006, https://doi.org/10.1088/0266-5611/24/3/034006, 2008.
Marlon, J. R., Bartlein, P. J., Carcaillet, C., Gavin, D. G., Harrison, S. P., Higuera, P. E., Joos, F., Power, M. J., and Prentice, I. C.: Climate and human influences on global biomass burning over the past two millennia, Nat. Geosci., 1, 697–702, https://doi.org/10.1038/ngeo313, 2008.
Marlon, J. R., Kelly, R., Daniau, A.-L., Vannière, B., Power, M. J., Bartlein, P., Higuera, P., Blarquez, O., Brewer, S., Brücher, T., Feurdean, A., Romera, G. G., Iglesias, V., Maezumi, S. Y., Magi, B., Courtney Mustaphi, C. J., and Zhihai, T.: Reconstructions of biomass burning from sediment-charcoal records to improve data–model comparisons, Biogeosciences, 13, 3225–3244, https://doi.org/10.5194/bg-13-3225-2016, 2016.
McConnell, J. R., Chellman, N. J., Mulvaney, R., Eckhardt, S., Stohl, A., Plunkett, G., Kipfstuhl, S., Freitag, J., Isaksson, E., Gleason, K. E., Brugger, S. O., McWethy, D. B., Abram, N. J., Liu, P., and Aristarain, A. J.: Hemispheric black carbon increase after the 13th-century Māori arrival in New Zealand, Nature, 598, 82–85, https://doi.org/10.1038/s41586-021-03858-9, 2021.
Mischler, J. A., Sowers, T. A., Alley, R. B., Battle, M., McConnell, J. R., Mitchell, L. E., Popp, T., Sofen, E., and Spencer, M. K.: Carbon and hydrogen isotopic composition of methane over the last 1000 years, Global Biogeochem. Cy., 23, GB4024, https://doi.org/10.1029/2009GB003460, 2009.
Morville, J., Kassi, S., Chenevier, M., and Romanini, D.: Fast, low-noise, mode-by-mode, cavity-enhanced absorption spectroscopy by diode-laser self-locking, Appl. Phys. B-Lasers O., 80, 1027–1038, https://doi.org/10.1007/s00340-005-1828-z, 2005.
Mulvaney, R., Oerter, H., Peel, D. A., Graf, W., Arrowsmith, C., Pasteur, E. C., Knight, B., Littot, G. C., and Miners, W. D.: 1000 year ice-core records from Berkner Island, Antarctica, Ann. Glaciol., 35, 45–51, https://doi.org/10.3189/172756402781817176, 2002.
Murray, L. T., Mickley, L. J., Kaplan, J. O., Sofen, E. D., Pfeiffer, M., and Alexander, B.: Factors controlling variability in the oxidative capacity of the troposphere since the Last Glacial Maximum, Atmos. Chem. Phys., 14, 3589–3622, https://doi.org/10.5194/acp-14-3589-2014, 2014.
Nicewonger, M. R., Aydin, M., Prather, M. J., and Saltzman, E. S.: Large changes in biomass burning over the last millennium inferred from paleoatmospheric ethane in polar ice cores, P. Natl. Acad. Sci., 115, 12413–12418, https://doi.org/10.1073/pnas.1807172115, 2018.
Nicewonger, M. R., Aydin, M., Prather, M. J., and Saltzman, E. S.: Reconstruction of paleofire emissions over the past millennium from measurements of ice core acetylene, Geophys. Res. Lett., 47, e2019GL085101, https://doi.org/10.1029/2019GL085101, 2020a.
Nicewonger, M. R., Aydin, M., Prather, M. J., and Saltzman, E. S.: Extracting a history of global fire emissions for the past millennium from ice core records of acetylene, Ethane, and Methane, J. Geophys. Res.-Atmos., 125, e2020JD032932, https://doi.org/10.1029/2020JD032932, 2020b.
Pan, X., Ichoku, C., Chin, M., Bian, H., Darmenov, A., Colarco, P., Ellison, L., Kucsera, T., da Silva, A., Wang, J., Oda, T., and Cui, G.: Six global biomass burning emission datasets: intercomparison and application in one global aerosol model, Atmos. Chem. Phys., 20, 969–994, https://doi.org/10.5194/acp-20-969-2020, 2020.
Petrenko, V. V., Martinerie, P., Novelli, P., Etheridge, D. M., Levin, I., Wang, Z., Blunier, T., Chappellaz, J., Kaiser, J., Lang, P., Steele, L. P., Hammer, S., Mak, J., Langenfelds, R. L., Schwander, J., Severinghaus, J. P., Witrant, E., Petron, G., Battle, M. O., Forster, G., Sturges, W. T., Lamarque, J.-F., Steffen, K., and White, J. W. C.: A 60 yr record of atmospheric carbon monoxide reconstructed from Greenland firn air, Atmos. Chem. Phys., 13, 7567–7585, https://doi.org/10.5194/acp-13-7567-2013, 2013.
Pongratz, J., Reick, C., Raddatz, T., and Claussen, M.: A reconstruction of global agricultural areas and land cover for the last millennium, Global Biogeochem. Cy., 22, GB3018, https://doi.org/10.1029/2007GB003153, 2008.
Power, M. J., Marlon, J. R., Ortiz, N., Bartlein, P. J., Harrison, S. P., Mayle, F. E., Ballouche, a., Bradshaw, R. H. W., Carcaillet, C., Cordova, C., Mooney, S., Moreno, P. I., Prentice, I. C., Thonicke, K., Tinner, W., Whitlock, C., Zhang, Y., Zhao, Y., Ali, a. a., Anderson, R. S., Beer, R., Behling, H., Briles, C., Brown, K. J., Brunelle, a., Bush, M., Camill, P., Chu, G. Q., Clark, J., Colombaroli, D., Connor, S., Daniau, A.-L., Daniels, M., Dodson, J., Doughty, E., Edwards, M. E., Finsinger, W., Foster, D., Frechette, J., Gaillard, M.-J. J., Gavin, D. G., Gobet, E., Haberle, S., Hallett, D. J., Higuera, P., Hope, G., Horn, S., Inoue, J., Kaltenrieder, P., Kennedy, L., Kong, Z. C., Larsen, C., Long, C. J., Lynch, J., Lynch, E. a., McGlone, M., Meeks, S., Mensing, S., Meyer, G., Minckley, T., Mohr, J., Nelson, D. M., New, J., Newnham, R., Noti, R., Oswald, W., Pierce, J., Richard, P. J. H., Rowe, C., Sanchez Goñi, M. F., Shuman, B. N., Takahara, H., Toney, J., Turney, C., Urrego-Sanchez, D. H., Umbanhowar, C., Vandergoes, M., Vannière, B., Vescovi, E., Walsh, M., Wang, X., Williams, N., Wilmshurst, J., Zhang, J. H., and Goni, M. F. S.: Changes in fire regimes since the Last Glacial Maximum: an assessment based on a global synthesis and analysis of charcoal data, Clim. Dynam., 30, 887–907, https://doi.org/10.1007/s00382-007-0334-x, 2008.
Rommelaere, V., Arnaud, L., and Barnola, J. M.: Reconstructing recent atmospheric trace gas concentrations from polar firn and bubbly ice data by inverse methods, J. Geophys. Res., 102, 30069–30083, 1997.
Rowlinson, M. J., Rap, A., Hamilton, D. S., Pope, R. J., Hantson, S., Arnold, S. R., Kaplan, J. O., Arneth, A., Chipperfield, M. P., Forster, P. M., and Nieradzik, L.: Tropospheric ozone radiative forcing uncertainty due to pre-industrial fire and biogenic emissions, Atmos. Chem. Phys., 20, 10937–10951, https://doi.org/10.5194/acp-20-10937-2020, 2020.
Rubino, M., D'Onofrio, A., Seki, O., and Bendle, J. A.: Ice-core records of biomass burning, Anthr. Rev., 3, 140–162, https://doi.org/10.1177/2053019615605117, 2016a.
Rubino, M., Etheridge, D. M., Trudinger, C. M., Allison, C. E., Rayner, P. J., Enting, I., Mulvaney, R., Steele, L. P., Langenfelds, R. L., Sturges, W. T., Curran, M. A. J., and Smith, A. M.: Low atmospheric CO2 levels during the Little Ice Age due to cooling induced terrestrial uptake, Nat. Geosci., 9, 691–694, https://doi.org/10.1038/ngeo2769, 2016b.
Rubino, M., Etheridge, D. M., Thornton, D. P., Howden, R., Allison, C. E., Francey, R. J., Langenfelds, R. L., Steele, L. P., Trudinger, C. M., Spencer, D. A., Curran, M. A. J., van Ommen, T. D., and Smith, A. M.: Revised records of atmospheric trace gases CO2, CH4, N2O, and δ13C-CO2 over the last 2000 years from Law Dome, Antarctica, Earth Syst. Sci. Data, 11, 473–492, https://doi.org/10.5194/essd-11-473-2019, 2019.
Sapart, C. J., Monteil, G., Prokopiou, M., van de Wal, R. S. W., Kaplan, J. O., Sperlich, P., Krumhardt, K. M., van der Veen, C., Houweling, S., Krol, M. C., Blunier, T., Sowers, T. A., Martinerie, P., Witrant, E., Dahl-Jensen, D., and Rockmann, T.: Natural and anthropogenic variations in methane sources during the past two millennia, Nature, 490, 85–88, https://doi.org/10.1038/Nature11461, 2012.
Servettaz, A., Orsi, A. J., Curran, M. A. J., Moy, A. D., Landais, A., Agosta, C., Winton, V. H. L., Touzeau, A., McConnell, J. R., Werner, M., and Baroni, M.: Snowfall and Water Stable Isotope Variability in East Antarctica Controlled by Warm Synoptic Events, J. Geophys. Res.-Atmos., 125, e2020JD032863, https://doi.org/10.1029/2020JD032863, 2020.
Servettaz, A. P. M., Orsi, A. J., Curran, M. A. J., Moy, A. D., Landais, A., McConnell, J. R., Popp, T. J., Le Meur, E., Faïn, X., and Chappellaz, J.: A 2000-year temperature reconstruction on the East Antarctic plateau from argon–nitrogen and water stable isotopes in the Aurora Basin North ice core, Clim. Past, 19, 1125–1152, https://doi.org/10.5194/cp-19-1125-2023, 2023.
Stenni, B., Proposito, M., Gragnani, R., Flora, O., Jouzel, J., Falourd, S., and Frezzotti, M.: Eight centuries of volcanic signal and climate change at Talos Dome (East Antarctica), J. Geophys. Res.-Atmos., 107, ACL 3-1–ACL 3–13, https://doi.org/10.1029/2000JD000317, 2002.
Stowasser, C., Buizert, C., Gkinis, V., Chappellaz, J., Schüpbach, S., Bigler, M., Faïn, X., Sperlich, P., Baumgartner, M., Schilt, A., and Blunier, T.: Continuous measurements of methane mixing ratios from ice cores, Atmos. Meas. Tech., 5, 999–1013, https://doi.org/10.5194/amt-5-999-2012, 2012.
Sturrock, G. A., Etheridge, D. M., Trudinger, C. M., Fraser, P. J., and Smith, A. M.: Atmospheric histories of halocarbons from analysis of Antarctic firn air: Major Montreal Protocol species, J. Geophys. Res.-Atmos., 107, 4765, https://doi.org/10.1029/2002JD002548, 2002.
Schwander, J. and Stauffer, B.: Age difference between polar ice and the air trapped in its bubbles, Nature, 311, 45–47, https://doi.org/10.1038/311045a0, 1984.
Schwander, J., Barnola, J. M., Andrie, C., Leuenberger, M., Ludin, A., Raynaud, D., and Stauffer, B.: The age of the air in the firn and the ice at Summit, Greenland, J. Geophys. Res., 98, 2831–2838, 1993.
Stevenson, D. S., Zhao, A., Naik, V., O'Connor, F. M., Tilmes, S., Zeng, G., Murray, L. T., Collins, W. J., Griffiths, P. T., Shim, S., Horowitz, L. W., Sentman, L. T., and Emmons, L.: Trends in global tropospheric hydroxyl radical and methane lifetime since 1850 from AerChemMIP, Atmos. Chem. Phys., 20, 12905–12920, https://doi.org/10.5194/acp-20-12905-2020, 2020.
Szopa, S., Naik, V., Adhikary, B., Artaxo, P., Berntsen, T., Collins, W. D., Fuzzi, S., Gallardo, L., Kiendler-Scharr, A., Klimont, Z., Liao, H., Unger, N., and Zanis, P.: Short-Lived Climate Forcers, in: Climate Change 2021: The Physical Science Basis. Contribution of Working Group I to the Sixth Assessment Report of the Intergovernmental Panel on Climate Change, edited by: Masson-Delmotte, V., Zhai, P., Pirani, A., Connors, S. L., Péan, C., Berger, S., Caud, N., Chen, Y., Goldfarb, L., Gomis, M. I., Huang, M., Leitzell, K., Lonnoy, E., Matthews, J. B. R., Maycock, T. K., Waterfield, T., Yelekçi, O., Yu, R., and Zhou, B., Cambridge University Press, Cambridge, United Kingdom and New York, NY, USA, 817–922, https://doi.org/10.1017/9781009157896.008, 2021.
Tarantola, A.: Inverse problem theory and methods for model parameter estimation, Society for Industrial Mathematics, https://epubs.siam.org/doi/book/10.1137/1.9780898717921 (last access: 6 November 2023), 2005.
Tarr, M. A., Miller, W. L., and Zepp, R. G.: Direct carbon monoxide photoproduction from plant matter, J. Geophys. Res., 100, 11403, https://doi.org/10.1029/94JD03324, 1995.
Thoning, K. W., Tans, P. P., and Komhyr, W. D., Atmospheric carbon dioxide at Mauna Loa Observatory: 2. Analysis of the NOAA GMCC data, 1974–1985, J. Geophys. Res., 94, 8549– 8565, https://doi.org/10.1029/JD094iD06p08549, 1989.
Tzompa-Sosa, Z. A., Mahieu, E., Franco, B., Keller, C. A., Turner, A. J., Helmig, D., Fried, A., Richter, D., Weibring, P., Walega, J., Yacovitch, T. I., Herndon, S. C., Blake, D. R., Hase, F., Hannigan, J. W., Conway, S., Strong, K., Schneider, M., and Fischer, E. V.: Revisiting global fossil fuel and biofuel emissions of ethane, J. Geophys. Res.-Atmos., 122, 2493–2512, https://doi.org/10.1002/2016JD025767, 2017.
Trudinger, C. M., Enting, I. G., Etheridge, D. M., Francey, R. J., Levchenko, V. A., Steele, L. P., Raynaud, D., and Arnaud, L.: Modeling air movement and bubble trapping in firn, J. Geophys. Res., 102, 6747–6763, 1997.
Trudinger, C. M., Etheridge, D. M., Rayner, P. J., Enting, I. G., Sturrock, G. A., and Langenfelds, R. L.: Reconstructing atmospheric histories from measurements of air composition in firn, J. Geophys. Res., 107, 4780, https://doi.org/10.1029/2002JD002545, 2002.
Trudinger, C. M., Enting, I. G., Rayner, P. J., Etheridge, D. M., Buizert, C., Rubino, M., Krummel, P. B., and Blunier, T.: How well do different tracers constrain the firn diffusivity profile?, Atmos. Chem. Phys., 13, 1485–1510, https://doi.org/10.5194/acp-13-1485-2013, 2013.
Trudinger, C. M., Fraser, P. J., Etheridge, D. M., Sturges, W. T., Vollmer, M. K., Rigby, M., Martinerie, P., Mühle, J., Worton, D. R., Krummel, P. B., Steele, L. P., Miller, B. R., Laube, J., Mani, F. S., Rayner, P. J., Harth, C. M., Witrant, E., Blunier, T., Schwander, J., O'Doherty, S., and Battle, M.: Atmospheric abundance and global emissions of perfluorocarbons CF4, C2F6 and C3F8 since 1800 inferred from ice core, firn, air archive and in situ measurements, Atmos. Chem. Phys., 16, 11733–11754, https://doi.org/10.5194/acp-16-11733-2016, 2016.
van der Werf, G. R., Randerson, J. T., Giglio, L., Collatz, G. J., Mu, M., Kasibhatla, P. S., Morton, D. C., DeFries, R. S., Jin, Y., and van Leeuwen, T. T.: Global fire emissions and the contribution of deforestation, savanna, forest, agricultural, and peat fires (1997–2009), Atmos. Chem. Phys., 10, 11707–11735, https://doi.org/10.5194/acp-10-11707-2010, 2010.
van der Werf, G. R., Peters, W., van Leeuwen, T. T., and Giglio, L.: What could have caused pre-industrial biomass burning emissions to exceed current rates?, Clim. Past, 9, 289–306, https://doi.org/10.5194/cp-9-289-2013, 2013.
van der Werf, G. R., Randerson, J. T., Giglio, L., van Leeuwen, T. T., Chen, Y., Rogers, B. M., Mu, M., van Marle, M. J. E., Morton, D. C., Collatz, G. J., Yokelson, R. J., and Kasibhatla, P. S.: Global fire emissions estimates during 1997–2016, Earth Syst. Sci. Data, 9, 697–720, https://doi.org/10.5194/essd-9-697-2017, 2017.
van Marle, M. J. E., Kloster, S., Magi, B. I., Marlon, J. R., Daniau, A.-L., Field, R. D., Arneth, A., Forrest, M., Hantson, S., Kehrwald, N. M., Knorr, W., Lasslop, G., Li, F., Mangeon, S., Yue, C., Kaiser, J. W., and van der Werf, G. R.: Historic global biomass burning emissions for CMIP6 (BB4CMIP) based on merging satellite observations with proxies and fire models (1750–2015), Geosci. Model Dev., 10, 3329–3357, https://doi.org/10.5194/gmd-10-3329-2017, 2017.
Vannière, B., Blarquez, O., Rius, D., Doyen, E., Brücher, T., Colombaroli, D., Connor, S., Feurdean, A., Hickler, T., Kaltenrieder, P., Lemmen, C., Leys, B., Massa, C., and Olofsson, J.: 7000-year human legacy of elevation-dependent European fire regimes, Quaternary Sci. Rev., 132, 206–212, https://doi.org/10.1016/J.QUASCIREV.2015.11.012, 2016.
Wang, Z., Chappellaz, J., Park, J. Y., and Mak, J.: Large variations in Southern Hemisphere biomass burning during the last 650 years, Science, 330, 1663–166, https://doi.org/10.1126/science.1197257, 2010.
Wang, Z., Chappellaz, J., Martinerie, P., Park, K., Petrenko, V., Witrant, E., Emmons, L. K., Blunier, T., Brenninkmeijer, C. A. M., and Mak, J. E.: The isotopic record of Northern Hemisphere atmospheric carbon monoxide since 1950: implications for the CO budget, Atmos. Chem. Phys., 12, 4365–4377, https://doi.org/10.5194/acp-12-4365-2012, 2012.
Werle, P., Mücke, R., and Slemr, F.: The Limits of Signal Averaging in Atmospheric Trace-Gas Monitoring by Tunable Diode-Laser Absorption Spectroscopy (TDLAS), Appl. Phys. B-Lasers Opt., 139, 131–139, 1993.
Witrant, E. and Martinerie, P.: Input Estimation from Sparse Measurements in LPV Systems and Isotopic Ratios in Polar Firns, IFAC Proc. Vol., 46, 659–664, https://doi.org/10.3182/20130204-3-FR-2033.00201, 2013.
Witrant, E., Martinerie, P., Hogan, C., Laube, J. C., Kawamura, K., Capron, E., Montzka, S. A., Dlugokencky, E. J., Etheridge, D., Blunier, T., and Sturges, W. T.: A new multi-gas constrained model of trace gas non-homogeneous transport in firn: evaluation and behaviour at eleven polar sites, Atmos. Chem. Phys., 12, 11465–11483, https://doi.org/10.5194/acp-12-11465-2012, 2012.
Worton, D. R., Sturges, W. T., Gohar, L. K., Shine, K. P., Martinerie, P., Oram, D. E., Humphrey, S. P., Begley, P., Gunn, L., Barnola, J. M., Schwander, J., and Mulvaney, R.: Atmospheric Trends and Radiative Forcings of CF4 and C2F6 Inferred from Firn Air, Environ. Sci. Technol., 41, 2184–2189, https://doi.org/10.1021/es061710t, 2007.
Xiao, Y., Jacob, D. J., and Turquety, S.: Atmospheric acetylene and its relationship with CO as an indicator of air mass age, J. Geophys. Res.-Atmos., 112, D12305, https://doi.org/10.1029/2006JD008268, 2007.
Xiao, Y., Logan, J. A., Jacob, D. J., Hudman, R. C., Yantosca, R., and Blake, D. R.: Global budget of ethane and regional constraints on U.S. sources, J. Geophys. Res., 113, D21306, https://doi.org/10.1029/2007JD009415, 2008.
Yeung, L. Y., Murray, L. T., Martinerie, P., Witrant, E., Hu, H., Banerjee, A., Orsi, A., and Chappellaz, J.: Isotopic constraint on the twentieth-century increase in tropospheric ozone, Nature, 570, 224–227, https://doi.org/10.1038/s41586-019-1277-1, 2019.
Zheng, B., Chevallier, F., Yin, Y., Ciais, P., Fortems-Cheiney, A., Deeter, M. N., Parker, R. J., Wang, Y., Worden, H. M., and Zhao, Y.: Global atmospheric carbon monoxide budget 2000–2017 inferred from multi-species atmospheric inversions, Earth Syst. Sci. Data, 11, 1411–1436, https://doi.org/10.5194/essd-11-1411-2019, 2019.