

Abstract
Spring snow cover extent (SCE) in the Northern Hemisphere has decreased in the last four decades but with significant interannual variability. Investigations of the mechanisms that control SCE variations were almost exclusively focused on the year-to-year variability of forcing variables and SCE integrated over a certain period of the year (e.g. season). Here, we use state-of-the-art climate reanalysis dataset to analyze the contribution of different surface energy fluxes to the inception and development of below-normal spring SCE from an intraseasonal perspective. During years identified with lower-than-average SCE by the end of spring, higher-than-average net longwave radiation and sensible heat that is greater than the decrease of net shortwave radiation in the early spring snowmelt season induces the initial SCE deficit. This can be mainly explained by the finding that the increase of downwelling longwave radiation because of increased water vapor significantly exceeds the attenuation of downwelling short-wave radiation due to increased cloudiness. When a SCE deficit has been incepted in early spring, net shortwave radiation in late spring gradually becomes higher than average through snow albedo feedback, which further accelerates snowmelt. This suggests that short-wave radiation is not responsible for the initiation of negative SCE anomaly by the end of spring but acts as an amplifying feedback once the snow melt is started.
Export citation and abstract BibTeX RIS

Content from this work may be used under the terms of the Creative Commons Attribution 3.0 licence. Any further distribution of this work must maintain attribution to the author(s) and the title of the work, journal citation and DOI.
1. Introduction
Spring snow cover extent (SCE) has decreased by about 0.8 × 10⁶ km2 per decade in the Northern Hemisphere (NH) since 1970 (Brown and Robinson 2011). SCE is an important indicator of climate change (Callaghan et al 2011). Changes in the space–time distribution of SCE impact surface energy budget (Déry and Brown 2007), regional climate (Groisman et al 1994, Graversen et al 2008), river discharge (Yang et al 2007, Tan et al 2011), ground thermal conditions (Zhang 2005) and vegetation phenology (Jia et al 2009). It is therefore important to quantify causes and mechanisms for the decline in spring SCE.
Rising temperature is considered to be the main driver of decreasing spring SCE (Brown et al 2007, Brown and Robinson 2011, Wang et al 2013), although the underlying processes are not fully understood. Warming effects on spring SCE have been linked with higher turbulent sensible heat fluxes from the atmosphere into the snowpack, and longwave radiation anomalies (Ohmura 2001). Analysis of changes in the energy budget of snow-covered surfaces allows separating the component energy fluxes that cause changes in spring SCE. Energy budget variations were however only examined in the context of year-to-year variability in forcing and response variables over a fixed time period of a month or season. For example, Shi et al (2013) identified that changes in surface net radiation and sensible heat flux could explain the trends of monthly SCE. This time (e.g. month, season) integration approach without considering intraseasonal progression can underestimate the role of some other processes in shaping spring SCE deficits during warm springs, in particular the role of short-wave solar radiation could be less important in inducing snow melt than that of longwave radiation during the early spring when solar radiation is low and fresh snow albedo is high.
In situ measurements of snow surface energy fluxes are extremely sparse (e.g. Shi et al 2013). Here, we use daily snow variables and surface radiative and turbulent fluxes from the European Centre for Medium-Range Weather Forecasts (ECMWF) Interim Re-Analysis product (ERA-I) (Dee et al 2011). This reanalysis product is derived from surface weather station and satellite data assimilation over the period 1979–2010, and has been recognized among the best climate datasets for the Arctic region (Cox et al 2012, Zygmuntowska et al 2012, Kapsch et al 2013). Among four state-of-the-art reanalysis products, Decker et al (2012) found that ERA-I has a relatively low bias in both latent heat and sensible heat fluxes when compared against flux tower observations. Furthermore, the inclusion of a new snow scheme in the ECMWF model (Dutra et al 2010) has been shown to improve the thermal energy exchange with a substantial reduction of near-surface temperature errors in snow-dominated areas. The main objective of this study is thus to understand the role of different energy fluxes in the inception and development of below normal spring SCE values during warm spring events, based upon the ERA-I reanalysis data.
2. Data and methods
2.1. ERA-I dataset
The energy balance of the snow surface is given by

where SWnet = SWd − SWu and LWnet = LWd − LWu indicate net shortwave (SWnet) and longwave (LWnet) radiation, defined as downward (d) minus upward (u) radiation fluxes, and SH and LH are the turbulent fluxes of sensible and latent heat, respectively. Compared to radiative and turbulent fluxes, both the ground heat flux (G) and the energy supplied by rain (QP) are relatively small components in the energy balance of a typical melting snowpack during the springtime (Male and Granger 1981, Gray and Prowse 1993). Thus, their effects on melting snowpack are not considered in this study. All terms in equation (1) are here defined positive downwards.
The fluxes that compose the surface energy budget over the period 1979–2010 are directly taken from the ECMWF operational forecast system in June 2012 (cycle 38R1). We also use ERA-I derived snow water equivalent (SWE), snow density, total column cloud cover (TCC) and total column water vapor (TCWV) on a daily timescale. Compared to the previous snow scheme used for ERA-I, the new scheme (Dutra et al 2010) that was introduced in the ECMWF operational forecast system in September 2009 (cycle 35R3) has an improved representation of the snowpack heat capacity considering liquid water content; and a parameterization of vegetation-dependent snow albedo values from Moody et al (2007). The detailed snow parameterization and its validation can be found in Dutra et al (2010). The ERA-Interim reanalysis is produced with a sequential data assimilation scheme (Dee et al 2011), and estimates of snow variables (snow depth, SWE and snow density) by the forecast model have been updated based on a Cressman analysis of snow depth observations from land surface synoptic observations station network and national networks and a product pre-processing of satellite-based snow cover data from daily Interactive Multi-Sensor (IMS) (Drusch et al 2004). Note that IMS snow-cover data was only used to constrain the ERA-I snow analysis since July 2003. In addition, the Cressman analysis used to interpolate snow depth observations could have shortcomings since this methodology can generate 'Bull's eyes' snow patterns where observations are scarce. Although this method has been replaced by 2D optimal interpolation in the ERA-I snow analysis since November 2010, the potential issues related to Cressman interpolation still exist in the data before 2010.
The methodology from Frei et al (2003) is used to convert grid-scale SWE to continental/latitudinal SCE (see S1 in the supplementary material, available at stacks.iop.org/ERL/10/024018/mmedia). Furthermore, we also use different snow products from satellites (see S2 in the supplementary material) to evaluate the quality of ERA-I derived SCE (see S3 in the supplementary material) over the period 1979–2010.
2.2. Definition of low SCE years (LSYs)
Here we analyze the evolution of anomalous snow cover during warm years for a given area (continental scale and latitudinal band in our case). In general, the SCE depletion curve shows a slow decrease from the seasonal peak during the early stages of the melting period, followed by a progression towards the minimum. The velocity of the SCE depletion in spring varies regionally and latitudinally, reflecting spatial differences in the onset date of snowmelt and melt intensity.
The following three steps are used to define LSYs for a given area.
Step 1: Definitions of early and late spring snowmelt periods: SDO and SDM. For a given area, SDO and SDM are respectively defined as a 20 day long interval centered on the day when SCE reaches 90 and 25% of the (multi-year mean) seasonal maximum SCE before July. The results given below are robust to the choice of other period lengths (e.g. 15 and 25 days). Note that only time before July 1st is considered since post-July SCE is mainly associated with glaciers (Shi et al 2013).
Step 2: Detrending the time series of SCE over SDM period. Daily SCE data (ERA-I derived) averaged over SDM period (hereafter SCESDM) from 1979 to 2004 were applied the Butterworth square-wave high-pass (<5 years) filter (Pollock 2000) to remove the long-term trend. High-pass filtering is preferred to linear detrending because the later could not effectively isolate the desired year-to-year signal. We excluded years after 2004 because ERA-I shows a warm bias (e.g. Brown and Derksen 2013) (see also S3 in the supplementary material).
Step 3: Defining LSYs. The detrended time series of SCESDM over 1979–2004, which has a mean value of zero, is used to define LSYs. LSYs are defined as years with an anomalous negative SCESDM.
2.3. Calculating daily LSY composite
Here we calculate daily LSY composite for all fields (SCE, energy fluxes, TCC and TCWV) within a given area. Daily anomalies are firstly calculated relative to the nonlinear long-term trend over 1979–2004 for each grid point and this nonlinear long-term trend is extracted based on the Butterworth square-wave high-pass (<5 years) filter (Pollock 2000). Daily LSY composite of each field is then obtained by averaging all grid points within a given area during LSYs. A student t-test is used to test whether the average of daily LSY composite during SDO and SDM differs significantly from zero.
3. Results and discussion
3.1. The role of surface energy fluxes in the development of lower-than-average SCE in low snow years
3.1.1. At the continental scale
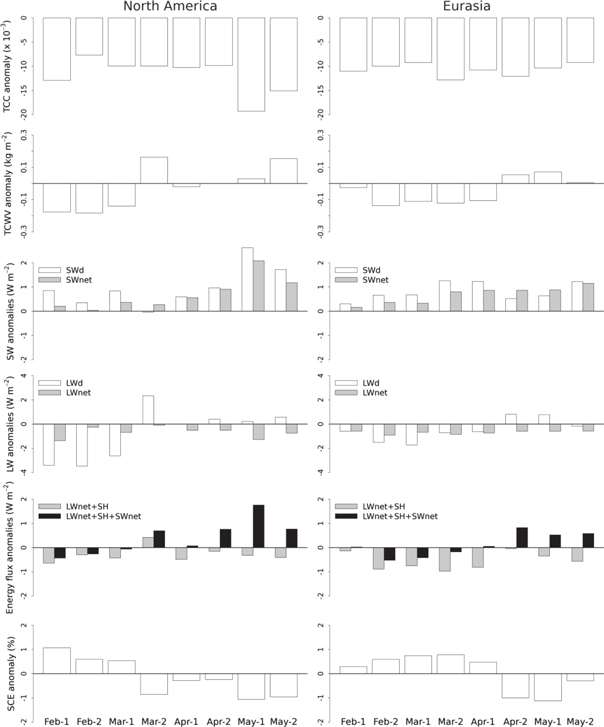
ERA-I has rather good performances in capturing satellite-based SCE anomalies during the snow-melt period (March throughout June). We analyze how different component fluxes of the surface energy budget (equation (1)) affect the inception and development of SCE anomalies in low snow years (figure 1). Daily SCE anomalies decreases steadily towards a minimum value mid-May over North America (−2.4%) and early-May in Eurasia (−2.5%), respectively. During these periods, daily anomalies of energy fluxes exhibit different behaviors.

Figure 1. Anomalies of net longwave (LWnet, W m−2) and net shortwave radiation (SWnet, W m−2), sensible (SH, W m−2) and latent fluxes (LH, W m−2) and LWnet plus SH (W m−2) for LSYs over (a) North America and (b) Eurasia. Anomalies of downwelling longwave (LWd, W m−2) and shortwave radiation (SWd, W m−2), total column water vapor (TCWV, kg m−2) and total column cloud cover (TCC, %) in LSYs over (c) North America and (d) Eurasia. The black line shows the SCE anomaly (%). All time series are based on daily anomalies and averaged over North America and Eurasia (North of 45° N). All data are high-pass (<5 years) filtered before calculating the anomalies and a 30 day running mean is applied.
Download figure:
Standard image High-resolution imageLWnet anomalies are positive in early spring snowmelt period (mid-March to mid-April in North America and mid-February to mid-April in Eurasia), which increase the energy available for melting snow. Then, the LWnet anomaly during low snow years decreases and takes negative values after mid-April over both continents (figures 1(a) and (b)). This is mainly due to the fact that LWd fluxes (figures 1(c) and (d)) are not compensated by an increase in LWu when the SCE anomaly is around the minimum. We do observe that the LWd anomaly always stays positive during low snow years, which can be attributed to a larger-than-average TCWV (figures 1(c) and (d)).
The daily evolution of SWnet anomalies mainly follows that of SWd, which is negatively correlated with TCC anomaly (figures 1(c) and (d)). SWnet has a negative (or near-zero) anomaly in the early spring snowmelt period (figures 1(a) and (b)). Then it gradually increases to reach a maximum positive anomaly which is in phase with the timing of the largest SCE negative anomaly. This suggests a dominant role of SWnet anomalies in controlling late spring SCE anomalies. By contrast, spring SWd anomalies are always negative or near-zero (figures 1(c) and (d)) for low snow years. The observation that SWnet gradually shows a positive anomaly whereas SWd anomalies are negative or neutral implies that a strong reduction of surface albedo occurs during low snow years (data not shown). We suggest that shortwave radiation is not directly responsible for the initiation of the negative SCE anomaly, but plays an important role in accelerating snowmelt through surface albedo feedbacks once the negative SCE anomaly has been initialized.
Daily SH anomalies in low-snow years are generally positive and gradually reach a peak value when the SCE negative anomaly is approximately the largest. This suggests that SH largely accounts for energy lost by the snow. By contrast, LH always shows a negative anomaly (e.g. Shi et al 2013). Positive SH anomalies during low-snow years were found to be associated with positive anomalies of air temperatures (data not shown). This is not surprising particularly for late spring snowmelt season because the melting snowpack could be near isothermal at 0 °C and the anomalous high air temperature is then necessary to maintain the positive anomaly of SH. Higher air temperature can be induced by higher-than-average TCWV since water vapor is a dominant greenhouse gas. In addition, the positive feedback between surface albedo and temperature could also amplify local air temperature (e.g. Scherrer et al 2012, Peng et al 2013).
For years with lower-than-average SCE, we always observe a higher-than-average LWd and lower-than-average SWd that are linked to positive anomalies of water-vapor and cloud cover. Throughout the early spring, the anomaly of LWnet and SH stays positive and accounts for most of the enhanced energy flux to the surface. By contrast, SWnet displays a negative (or near-zero) anomaly. Later, a gradually increasing and positive SWnet anomaly develops because of a large reduction in albedo, with a timing that parallels the development of the largest SCE negative anomaly. Meanwhile, the SH anomaly gradually reaches a peak while LWnet anomaly switches from positive to negative. In summary, during low snow years, the anomalous high LWnet and SH that are greater than the decrease of SWnet in the early spring initiate the snowmelt, and the further decrease of SCE is then amplified by anomalous high SWnet and SH. It is interesting to note that the seasonal progression of SWE anomaly generally follows that of SCE anomaly (figure S3), suggesting that the mechanisms controlling SCE variations can also explain the SWE retreat during LSYs. The main results are generally held if our analysis used weekly SCE from NOAA/NCDC CDR instead of SCE from ERA-I (figure S2). But the timing of the maximum SWnet positive anomaly is not in phase with that of the largest SCE negative anomaly, which is particularly found in North America (figure S2). We should realize that snow cover over land has a significant impact on the surface radiation budget and turbulent energy fluxes to the atmosphere in the coupled simulation. For this reason, in ECMWF modeling system, the surface energy fluxes should not be equivalent to those that are produced using SCE of NOAA/NCDC CDR. Thus, the results based on ERA-I dataset would not be exactly the same with those that are analyzed with modeled fluxes from ERA-I but SCE from NOAA/NCDC CDR.
3.1.2. At each latitudinal band
In an attempt to investigate the finding observed at the continental scale holds for different latitudinal bands of 10° between 45 and 85° N, we compare mean daily anomalies of surface energy fluxes during low snow years between SDO and SDM of snowmelt season. As shown in figure 2, LWnetSDO anomalies are mostly positive while SWnetSDO anomalies are mostly negative both for Eurasia and North America. The SWnetSDM and SHSDM anomalies are mostly positive, but LWnetSDM anomalies are negative (except in the band 75–85° N over Eurasia). There are more positive anomalies of LWnet and SH plus LWnet during SDO than during SDM period, and the SWnet anomaly switches from being negative during SDO to positive during SDM in most of the latitude bands considered (figure 2). This suggests that the continental scale mechanisms that control SCE anomalies in low spring years are similar for each latitude band. The main results are similarly found if our latitudinal analysis distinguished two types of vegetation (high and low) that are aggregated from 20 vegetation types according to Dee et al (2011) (data not shown).
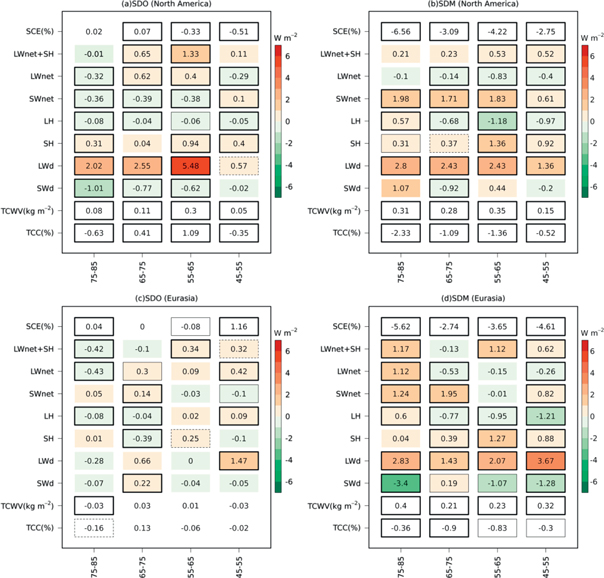
Figure 2. Statistical significance of the anomalies of SCE (%), surface energy fluxes (W m−2), TCWV (kg m−2), TCC (%) during SDO (denoting early spring snowmelt period) and SDM (denoting late spring snowmelt season) at four latitudinal bands (45–55°, 55–65°, 65–75°, 75–85° N) over North America ((a) and (b)) and Eurasia ((c) and (d)) in LSYs. The values in box represent that they are statistically significant (p < 0.05).
Download figure:
Standard image High-resolution imageIt is interesting to note that there is a larger gain of shortwave radiation during SDM over low vegetation than that over high vegetation, implying a stronger albedo feedback on low vegetation. For example, the gain of energy available to melt snow during SDM (approximated by SWnet anomaly relative to SWd anomaly) on short vegetation is 2.09–3.51 W m−2 in Eurasia and 1.41–2.91 W m−2 in North America, which is higher than 0.43–0.95 W m−2 in Eurasia and 0.69–1.27 W m−2 in North America over high vegetation. This is mainly due to the fact that the contrast between snow-covered and snow-free albedo, which largely controls the strength of snow albedo feedback (e.g. Loranty et al 2014, Qu and Hall 2014), is larger on short vegetation than that on high vegetation.
3.2. How clouds affect surface energy fluxes and spring SCE
Clouds can strongly affect the radiation balance at the Earth's surface. It remains unclear how cloud properties change surface energy fluxes and thus impact spring snowmelt. To illustrate this, the macrophysical cloud property TCC is used. We select years with lower-than-average TCC (hereafter as LCYs) in each 15 day period from 1st February to 31st May (see S5 in the supplementary material). At each 15 day period, a decrease of TCC always causes an overall increase of SW (figure 3), which is consistent with a strong negative correlation found between SW anomaly and TCC anomaly (SWd: r = −0.54, p < 0.01; SWnet: r = −0.62, p < 0.01) during the spring season across both continents. The influences of TCC on LWd and SH are less obvious (figure 3) since the alterations of LWd and SH are much more linked to the change in TCWV than the change in TCC. For example, the correlation coefficients linking TCWV anomaly with LWd and SH anomaly in the spring season across both continents are 0.88 (p < 0.01) and 0.65 (p < 0.01) respectively. By contrast, there is a relatively loose correlation of TCC anomaly to LWd anomaly (r = 0.12, p < 0.01) and SH anomaly (r = 0.22, p < 0.01).
Figure 3. Anomalies of SCE (%), surface energy fluxes (W m−2), TCWV (kg m−2), TCC (%) at each half-monthly period from 1st February to 31st May over North America and Eurasia in their respective low cloud-cover years.
Download figure:
Standard image High-resolution image
In the early spring snowmelt period (from early-February to mid-March in North America and from early-February to early-May in Eurasia) of LCYs, the increase of SW because of decreased cloudiness cannot compensate for the decrease of LWd and SH due to decreased TCWV. Hence, the net surface energy balance becomes negative that leads to a positive SCE anomaly. When it comes to late spring snowmelt period, the enhancement of SW because of decreased cloudiness becomes predominant and thus leads to a positive surface energy balance that favors a negative SCE anomaly. The different roles of cloud cover on radiative fluxes and thus net surface energy balance during early and later spring snowmelt seasons indirectly supports the finding that shortwave radiation (closely correlated with TCC) is not responsible for initializing spring snowmelt.
3.3. Implications for future research
Firstly, according to our analysis, longwave radiation is an important energy source for spring snowmelt, as recognized by e.g. Olyphant (1986), Fassnacht et al (2001), Sicart et al (2006), Pomeroy et al (2009). For example, Fassnacht et al (2001) showed that an accurate estimate of longwave radiation is necessary to correctly simulate streamflows resulting from snowmelt. Our study goes further on this issue and shows that high longwave radiation at the start of spring snowmelt season plays an important role in triggering the subsequent low (or below normal) spring snow cover. This highlights that the accuracy of the longwave radiation input in the snow model during the late winter season (or early spring snowmelt season) should also be ensured since it can significantly affect the model prediction of the snowmelt rates and timing. Note that longwave radiation reaching snow covered areas under the canopy of forests is also significantly affected by tree cover, density and vegetation type (e.g. Harding and Pomeroy 1996, Link and Marks 1999, Pomeroy et al 2009, Ellis et al 2010). Drawing upon some field studies and modeling exercises of snow processes, forest canopies can reduce shortwave radiation and increase longwave radiation reaching the underlying snow surface, compared with open areas, and thus affect rates at which forest snowpacks melt (e.g. Sicart et al 2006, Ellis et al 2010). In order to better estimate the radiation energy for sub-canopy snow in forested regions, a radiation transfer scheme is thus necessary to explicitly account for canopy scattering, absorption and reflection (e.g. Mahat and Tarboton 2012), however which is not considered in current HTESSEL (the hydrology tiled ECMWF scheme of surface exchanges over land) snow scheme of ECMWF model (Dutra et al 2010). Thus, this needs further investigation in the future study with different surface energy budgets independently resolved on and under forest canopy. But we still expect that the current scheme provides a first-order approximation in the representation of the shortwave radiation (snow-albedo) feedback for high vegetation. It is well established that the snow-albedo feedback is largely controlled by the contrast between snow-covered and snow-free albedo (e.g. Fletcher et al 2012, Loranty et al 2014, Qu and Hall 2014). In the snow scheme of ECMWF, for snow under high vegetation, snow albedo is vegetation-dependent and the values for different types of high vegetation are prescribed based on the high quality moderate resolution imaging spectroradiometer (MODIS) land surface albedo data (Moody et al 2007). The adoption of vegetation-dependent snow-covered albedo from MODIS data leads to a significant improvement in simulation of snow-covered albedo in the NH when compared against MODIS-derived albedo (Dutra et al 2010). This suggests that the snow albedo masking by high vegetation is relatively well considered in the snow scheme of ECWMF. More recently, Essery (2013) used the satellite-derived albedo data to parameterize three different albedo schemes including a canopy radiative transfer scheme (two-stream approximations). He found that all three schemes produce similar results and compare reasonably well with observations over seasonally snow-covered regions of the NH. The representation of snow albedo masking effect thus appears to rely more on the parameter values than the scheme itself.
Secondly, our study aimed to explore the drivers of spring SCE inter-annual variability from a surface energy budget perspective indirectly support the utility of air temperature in explaining the inter-annual variability of spring SCE (e.g. Brown et al 2010, Derksen and Brown 2012). The air temperature carries substantial information of LWd and SH on the snow surface (Ohmura 2001), both of which have shown to significantly account for enhanced energy fluxes to spring snowmelt in LSYs. Moreover, there exists a positive feedback between air temperature and surface albedo during spring snowmelt season, which allows for air temperature to capture the information on the shortwave radiation especially when the strength of the albedo feedback is the largest.
Finally, the changes in atmospheric water vapor and cloudiness can alter the atmospheric opacity and emissivity and then affect the downward components of longwave and shortwave radiation. Recent studies indicated that poleward atmospheric moisture transport from the middle latitudes has enhanced in response to global warming (e.g. Graversen and Wang 2009, Zhang et al 2012). These changes in poleward moisture transport, affecting the water vapor content and cloud cover in the atmosphere, can modify the atmospheric emissivity that strongly determines downwelling longwave radiation reaching upon the snow surface. Our findings connecting water vapor with spring snow through atmospheric longwave radiation provide a link to these recent studies and fit in the bigger picture of the Arctic change.
4. Conclusions
Analyzing intraseasonal progressions of surface energy fluxes and spring SCE has given us a new perspective on the mechanisms underlying the shrinking spring SCE over the past several decades. This time-dependent analysis highlights that the role of longwave radiation should not be underestimated since it plays an important role in initializing the SCE anomaly in low (below normal) spring SCE years. The downwelling shortwave radiation, which has been widely recognized as a predominant contributor to spring snowmelt through snow albedo feedback mechanisms, is found not to initialize but to accelerate or amplify the spring snowmelt in low spring SCE years. These findings, along with the result that the downwelling longwave radiation closely keeps track with the atmospheric water content, can provide great insights into the future changes of spring SCE at high-latitudes, which will likely experience enhanced atmospheric moisture transport from middle latitudes.
Acknowledgments
We are thankful for support from Agence Nationale de la Recherche CLimat, Agriculture et Société SIbérienne—QUelle Evolution and 'Changing permafrost in the arctic and its global effects in the 21st century' project funding. The daily ERA-Interim data can be downloaded from the ECMWF Data Server (http://ecmwf.int/en/research/climate-reanalysis/era-interim). We are thankful to Kari Luojus for providing GlobSnow data. Weekly NOAA/NCDC snow cover extent CDR data and MODIS snow cover data are available at National Snow & Ice Data Center.