Article

Surface Water Evolution (2001–2017) at the Cambodia/Vietnam Border in the Upper Mekong Delta Using Satellite MODIS Observations

1
LERMA, CNRS, Observatoire de Paris, 75014 Paris, France
2
UMR G-EAU, IRD, University of Montpellier, 34196 Montpellier, France
3
Royal University of Agriculture, Phnom Penh 2696, Cambodia
4
Université Grenoble Alpes, CNRS, IRD, Grenoble INP, IGE, 38058 Grenoble, France
5
CARE, Ho Chi Minh City University of Technology, VNU-HCM, District 10, Ho Chi Minh City 700000, Vietnam
6
Remosat, University of Science and Technique of Hanoi, Vietnam Academy of Science and Technology, Hanoi 100000, Vietnam
*
Author to whom correspondence should be addressed.
Remote Sens. 2020, 12(5), 800; https://doi.org/10.3390/rs12050800
Submission received: 20 January 2020 / Revised: 19 February 2020 / Accepted: 24 February 2020 / Published: 2 March 2020
(This article belongs to the Special Issue Land Use/Cover Change Detection with Geospatial Technologies)

Abstract

:
Studying the spatial and temporal distribution of surface water resources is critical, especially in highly populated areas and in regions under climate change pressure. There is an increasing number of satellite Earth observations that can provide information to monitor surface water at global scale. However, mapping surface waters at local and regional scales is still a challenge for numerous reasons (insufficient spatial resolution, vegetation or cloud opacity, limited time-frequency or time-record, information content of the instrument, lack in global retrieval method, interpretability of results, etc.). In this paper, we use 17 years of the MODIS (MODerate-resolution Imaging Spectro-radiometer) observations at a 8-day resolution. This satellite dataset is combined with ground expertise to analyse the evolution of surface waters at the Cambodia/Vietnam border in the Upper Mekong Delta. The trends and evolution of surface waters are very significant and contrasted, illustrating the impact of agriculture practices and dykes construction. In most of the study area in Cambodia. surface water areas show a decreasing trend but with a strong inter-annual variability. In specific areas, an increase of the wet surfaces is even observed. Ground expertise and historical knowledge of the development of the territory enable to link the decrease to ongoing excavation of drainage canals and the increase of deforestation and land reclamation, exposing flooded surfaces previously hidden by vegetation cover. By contrast, in Vietnam, the decreasing trend in wet surfaces is very clear and can be explained by the development of dykes dating back to the 1990s with an acceleration in the late 2000s as part of a national strategy of agriculture intensification. This study shows that coupling satellite data with ground-expertise allows to monitor surface waters at mesoscale (<100 × 100 km2), demonstrating the potential of interdisciplinary approaches for water ressource management and planning.

Graphical Abstract

1. Introduction

Monitoring the spatial and temporal distribution of surface water resources is critical at the global, national and regional scales. This is particularly important in highly populated areas and in regions under climate change pressure such as the floodplains of Cambodia or Vietnam. The Mekong Delta in Southeast Asia (the third largest delta in the world) is a vast triangular plain of approximately 55,000 km2, most of it lower than 5 m above sea level. It supports dynamic agricultural systems of great socio-economic importance for the related countries. For instance, the Mekong Delta region covers only 12% of Vietnam but produces ≃50% of the rice produced in the country (with two or three harvests per year depending on the provinces), supports ≃50% of the fisheries of the country, and ≃70% of its fruit production [1]. However, this environment has witnessed major changes due to large scale human interventions, for example, the construction of a very dense network of canals, roads, and dykes (see Reference [2,3] for a description of water control infrastructure development in the Vietnamese Mekong Delta). Over the last two decades, several changes have impacted the surface water regime. Agriculture practices have evolved, and the construction of high dykes in Vietnam has caused considerable changes in the hydrodynamics of the Mekong River (see for instance References [4,5,6]).
While most papers focus on understanding the impact of upstream water development and dykes construction in the Vietnamese Mekong Delta, we propose to focus and analyse in situ dynamics in the Upper Mekong Delta, a mesoscale region that spreads over Cambodia and Vietnam. This area was selected because it is a floodplain that has witnessed very contrasted evolution over the last two decades. Its subdivision into six zones offers the opportunity to discuss contrasting flood dynamics in a similar hydro-ecosystem that has witnessed the strikingly different development trajectories. In Vietnam, and since the mid 1980s, the government has engaged in large scale water control and reclamation projects [3] aimed at intensifying agriculture and notably the production of rice. These have culminated in the construction of high dykes that supported the implementation of a triple-rice cultivation policy since the early 2000s, though with significant environmental and economic impacts such as depleting soil fertility and decreasing fishery productivity (see for instance Reference [2]). In contrast, in Cambodia, minimal investment in water control infrastructure (apart from the dredging of large earth drainage canals) has been made though this is progressively changing as sluice gates meant to further control floods are currently being built.
To understand the complex dynamics of floods and the evolution of water surface areas in this transboundary region, we propose to mix an expert understanding of local hydrological dynamics and land- and water-use practices acquired through in depth field visits and interviews with farmers and key informant interviews (with ministries, non governmental organisation and donors staff) with the use of global remote sensing products and expertise. Field-level expertise allows for providing sound interpretation of remote sensing results, while the latter allows putting field-level insights into a broader perspective or larger regional area. The coupling of these methods appears particularly interesting for characterising dynamics at mesoscale, especially in a transboundary region where field-based hydrological data can be politically sensitive and data sharing mechanisms fraught with challenges.
There is an increasing number of Earth satellites and resulting datasets monitoring surface waters. However, mapping surface water is still a challenge [7]. It is difficult to provide products with the accuracy required for a large range of applications (e.g., agriculture, disaster management, and hydrology). Each satellite observation has its own advantages and drawbacks (insufficient spatial resolution, vegetation or cloud opacity, limited time-frequency or time-record, information content of the instrument, lack in global retrieval method, and so forth).
Different SAR (Synthetic Aperture Radar) observations have been exploited to study floods and wetlands over the Mekong Delta (see Reference [8] for rice monitoring). Reference [9] used 60 Envisat ASAR observations during the years 2007-2011 to study the flood regime in the Delta. Thanks to the launch of the Sentinel-1A & B satellites by the European Space Agency, Sentinel-1 SAR observations are now regularly accessible for scientific purposes. Similar to previous SAR instruments, Sentinel-1 instruments show strong potential for detecting open water bodies at high spatial resolution [10,11]. In Reference [12], a methodology was introduced to detect surface water with Sentinel-1 SAR data within Cambodia and the Vietnamese Mekong Delta, over the 2014-present period. Reference [13] used MODIS data to investigate floods in Southern Cambodia from 2002–2013. However, no long-term SAR dataset exists so far, and other datasets are required in order to measure long-term changes.
Several methods were proposed to monitor surface water using VISible (VIS) and Near-InfraRed (NIR) images. Reference [14] applied a threshold on NIR reflectances of the NOAA/AVHRR observations to delineate lakes. Reference [15] used positive values of the Normalised Difference Water Index (NDWI) to classify water bodies. Reference [16] detected surface water by identifying the positive values of the Modification of Normalised Difference Water Index (MNDWI). Detailed lake morphometry over basins with large water level fluctuations can also be obtained from MODIS satellite observations [17]. Reference [18] produced a monthly-mean climatology of the water extent from 2000 to 2004 with a spatial resolution of 500 m, on a 8-day temporal resolution (by compositing all the clear data available during these eight days), using VIS/NIR Terra/MODIS data. Mapping paddy rice agriculture in South and Southeast Asia can be done by using multi-temporal MODIS images [19]. Reference [20] produced a new Global Surface Water Explorer (GSWE) dataset from Landsat imagery using a 32-year record, allowing for a description of the trends of surface waters and their occurrence. However, with 85% to 95% cloud cover during the wet season over the Mekong Delta [21], remote sensing methods derived from VIS/NIR images present some evident limitations. Vegetation is also an issue, as it makes the water detection difficult or impossible under canopy [7]. Reference [22] explored the limits of Landsat imagery for the monitoring of small water bodies with rapid changes. Reference [23] investigates the retrieval of remotely sensed hydrological variables like water level and their corresponding drought indices (i.e., TRMM Standardized Precipitation Index (TRMM-SPI) and GRACE Drought Severity Index (GRACE-DSI)) over the Mekong and the Yangtze Rivers Basins.
The Global Inundation Extent from Multi-Satellites (GIEMS) database combines satellite observations in the VIS, NIR, and passive/active microwaves at coarse resolution [24], and GIEMS-D3 at high spatial resolution [25], over a 15-year period (1993–2007). In Reference [7], it was shown that GIEMS-D3 is a good solution to obtain inundation at the global scale, with high spatial resolution, over cloud-covered and vegetated areas. This is a perfect complement to optical databases (e.g., Landsat) that highly underestimate surface waters over some tropical regions. However, the high spatial resolution of GIEMS-D3 is not a native satellite information but rather an indirect information from topography. It was noticed that over anthropized and very flat regions such as the Mekong Delta, GIEMS-D3 could be misled by the topography information, and that downscaling is difficult over these areas [25].
Since we are interested here by long-term and recent changes in the hydrological system at the Cambodia/Vietnam border, we chose to use the MODIS data that is available over 2001–2017. This VIS/IR data has also the advantage to be available on a 8-day compositing temporal resolution, which is important for considerations such as detecting the start or the end of the flood season. The methodology presented in Reference [18] is being used to process the 17-year record [26].
Section 2 presents the spatial domain with the six zones studied here, the MODIS surface water estimates, and some preliminary analysis. The spatio-temporal analysis is conducted in Section 3 using a principal component analysis. The long-term evolution of spatial patterns and the changes in the seasonality are interpreted based on ground expertise acquired by some of the authors who conducted frequent interviews with key informants and farmers in Cambodia and Vietnam between 2016 and 2019 in the context of a research project focused on understanding current and past land and water management practices in the Upper Mekong Delta (see http://deltasoutheastasia-doubt.com). Finally, conclusions and perspectives are provided in Section 4.

2. Tools and Preliminary Analysis
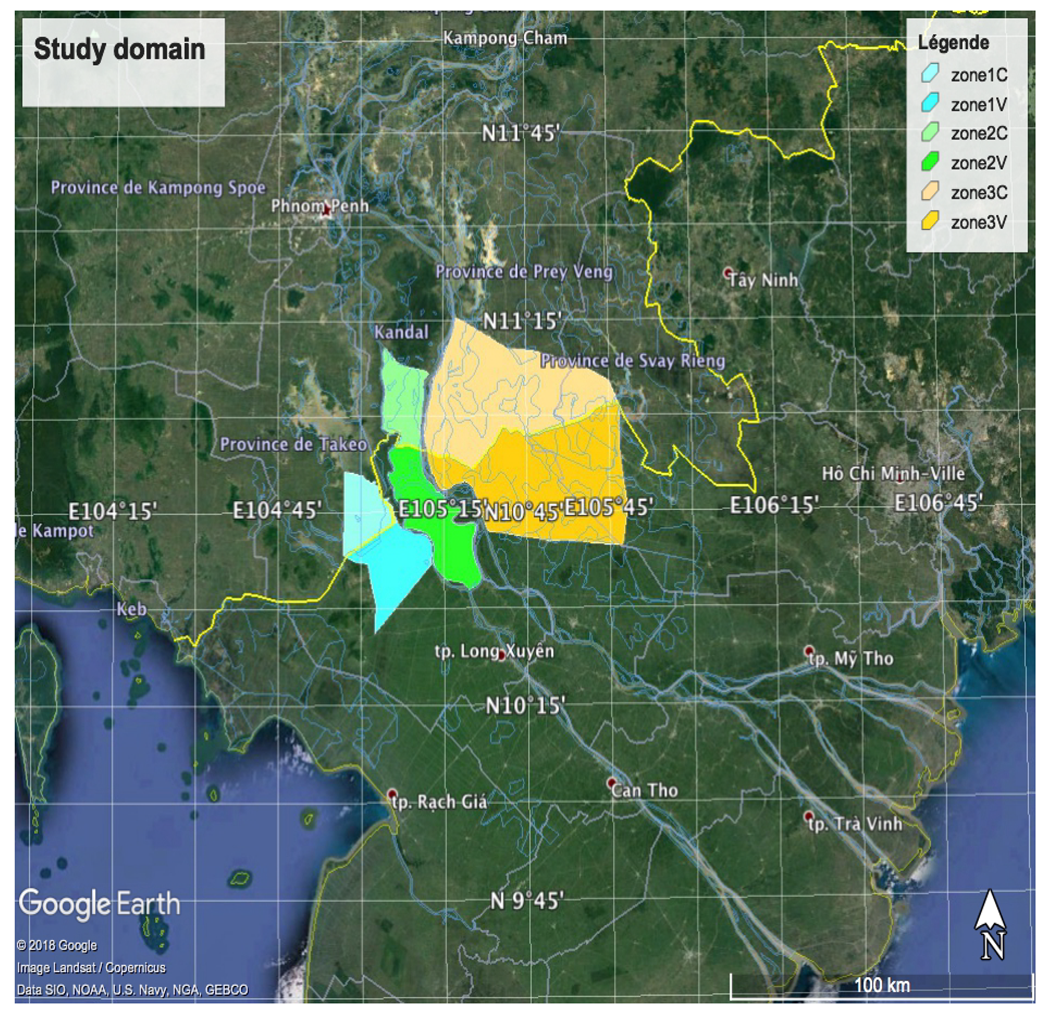
2.1. Study Domain

We focus here on six zones along the Cambodia/Vietnam border in the Upper Mekong Delta. These six zones are represented in Figure 1 and described in Table 1:
  • Zone 1C: This zone is located in the Takeo province of Cambodia and has been delineated to correspond to a sub-region where large scale investment in drainage canals have been conducted in the late 1990s/early 2000s—with further dredging being done in the mid 2010s. The area is composed of two sub-units. First, a protected wetland (preservation area since 2007) in the center–east of the zone. Second, a vast expanse of agricultural land where farmers engage in double rice cultivation with the first season spanning December-March, when the flood recedes, and the second season in May-July, before the flood arrives.
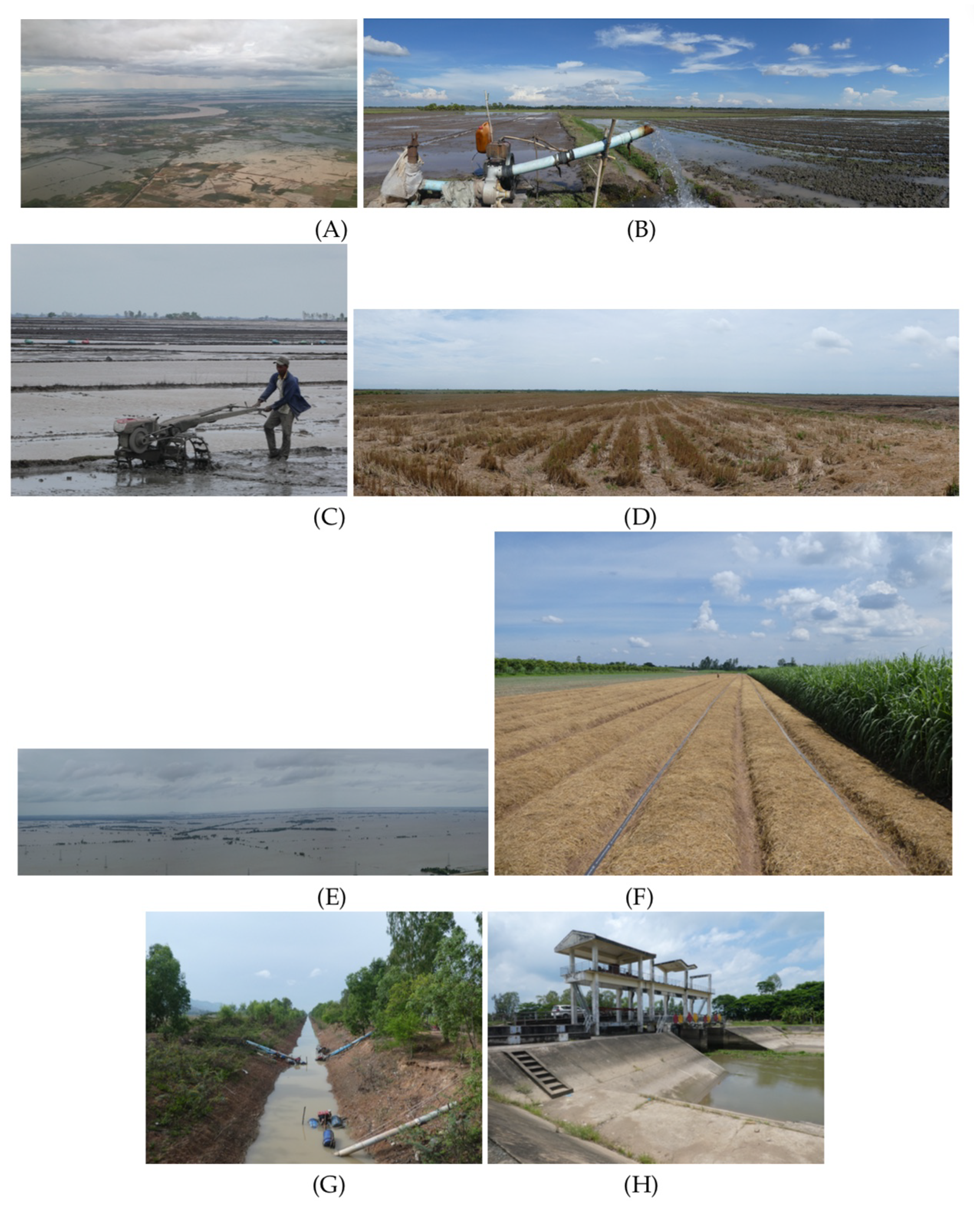
  • Zone 2C: This zone is located in the Kandal province of Cambodia. It is limited by the Bassac River (Hau River in Vietnam) to the west, the Mekong River (Tien River in Vietnam) to the east and lies south of a vast expanse of natural vegetation. A network of drainage canals and shallow reservoirs excavated during the Khmer rouge regime (late 1970s) supports one season of rice cultivation between December and March, in the central part of the zone. Closest to the river bank, vegetables and fruit trees can be cultivated (see Figure 2F). The rehabilitation of transversal canals (called Preks), drawing water from the Bassac and the Mekong, allows for an intensification of agriculture and a progressive shift to two rice cultivation seasons while capture fisheries are still an important activity when the flood recedes (November-February).
  • Zone 3C: This zone is located in the Prey Veng province of Cambodia. It is slightly more elevated than the two preceding Cambodian zones and faces drought conditions during the hot months of the year (March–May), see Figure 2D). For the most part, farmers engage in a single season of rice cultivation when the flood recedes (December-March), with occasional areas where double rice cultivation can be found, supported by groundwater extraction (wells, see Figure 2B) or collective pumping systems that supply surface water from a dense network of earth canals to fields in May-June before the flood comes.
  • Zone 1V: This zone constitutes part of the Long Xuyen Quadrangle, the area of the Vietnamese Mekong Delta that has witnessed the most extensive development of high dykes over the last two decades. More specifically, it spreads over the district of Chau Doc and Chau Phu of the An Giang province. Most of the area is protected by high dykes, most of which have been built from 2008 onwards, allowing farmers to engage in triple rice cultivation.
  • Zone 2V: This zone forms an “island” in the middle of the Upper Delta; it is located between the Hau River (Bassac in Cambodia) to the west and the Tien River (Mekong in Cambodia) to the east. It spreads over three districts (i.e., An Phu, Tan Chau and Phu Tan) of the An Giang province. The Phu Tan district, where the North Vam Nao Water Control project was implemented during the 2000s, is the only area of the Vietnamese Mekong Delta where the policy to enforce a 3-3-2 crop cycle has been adhered to Reference [27] (The “3-3-2 crop cycle” is a term indicating that farmers engage in three crop cycles for 2 years in a row and for only 2 crop cycles the third year. During that third year, water “is allowed” to enter the fields through control flooding to flush field and bring fertile sediments. Compartments are flooded on a rotational basis. The advantages and drawbacks of this policy have been strongly debated, see for instance Reference [27,28]). This is made possible because the “island” is surrounded by a high “ring dyke” and sluice gates are operated by a dedicated office according to a strict schedule, see Figure 2H.
  • Zone 3V: This zone constitutes part of what is commonly known as the “plain of reeds”. Located in Dong Thap province, the plain of reeds is one of the last areas of the Mekong Delta to have been reclaimed for agricultural purposes due to sociopolitical and ecological challenges [29]. Most of the zone is protected by low-dykes built in the 1990s (also called August dykes because they allow delaying the flood to harvest the summer-autumn crop) and farmers generally engage in double rice cultivation.
As can be seen in Table 1, there are thousands of pixels in each one of the six zones. These pixels are no independent from each other so we do not have thousands of independent pixels. However, the results obtained in the following appear to be statistically significant. In particular, retrieval errors from the MODIS database (e.g., misclassification between dry, mixed and water pixels) should compensate each other.

2.2. Long-Term Retrieval Using MODIS Instrument

In this study, atmospherically corrected land surface reflectance 8-day Level 3 global 500 m products from MODIS/Terra (MOD09A1) are used to estimate surface water extent at 500 m spatial resolution, for the 2001–2017 period. The MOD09Q1 product at a 250 m resolution could had been used but there is no blue band in this case so the 500 m resolution of the MOD09A1 was chosen instead. The MCD43A4 product could had been used at the daily time resolution but this was not necessary in this study, the 8-day resolution is a good compromise for the present analysis. Each MOD09A1 image was created by selecting the best Level-2 Gridded observation during an 8-day period on the basis of high observation coverage, low view angle, absence of clouds or cloud shadow, and aerosol loading [30]. As we have one MOD09A1 estimate every eight days, in the following and for simplicity purpose, we will sometimes call “week” the 8-day time step of the MODIS dataset. MODIS/Terra satellite observations are distributed free of charge for research and educational purposes from the NASA EarthData Hub at https://search.earthdata.nasa.gov/search.
Reference [18] introduced a methodology using MODIS observations to detect surface water over the Lower Mekong Basin for the 2000–2004 period. It was then applied in Reference [26] to obtain a 17-year long time record (2001–2017) period, which we apply to the transboundary Upper Mekong Delta in this paper. This methodology uses low values of water indices to detect the presence of surface water extent. Here, a summary of the methodology is briefly presented but other details should be searched for in Reference [18]. First, the Enhanced Vegetation Index (EVI, Equation (1)), the Land Surface Water Index (LSWI, Equation (2)), and the Different Value between EVI and LSWI (DVEL, Equation (3)) are calculated at the pixel level from the original atmospherically corrected surface reflectance data derived from the MOD09A1 8-day composite products.
E V I = 2.5 × N I R R E D N I R + 6 × R E D 7.5 × B L U E + 1
L S W I = N I R M I R N I R + M I R
D V E L = E V I L S W I ,
where RED, NIR, BLUE, and MIR are MODIS surface reflectances in the Visible band 1 (RED: 620–670 nm), NIR band 2 (NIR: 841–876 nm), Visible band 3 (BLUE: 459–479 nm), and MIR band 6 (MIR: 1628–1652 nm), respectively. Cloud-covered pixels (where surface reflectances the blue band 0.2 ) are filled using a linear interpolation before a simple weight function is applied to smooth all water indices [26]. All pixels with smoothed E V I 0.3 are classified as non-flooded pixels. Water-related pixels are marked if smoothed D V E L < = 0.05 and smoothed E V I 0.3 , or if smoothed E V I 0.05 and smoothed L S W I 0 . Next, water-related pixels are sub-classified into “water pixels” or “mixed pixels” by applying a threshold on the smoothed E V I . If smoothed E V I 0.1 , these pixels are set as WATER pixels, meaning that 100% of its surface is inundated (e.g., open water bodies, rivers, lakes or flooded areas). If smoothed 0.1 < E V I 0.3 , then these pixels are set as MIXED pixels, meaning that only a part of its surface is inundated and the inundation ratio is unknown (e.g., rice paddies, pixels with half water only, spare vegetation over standing water, and so forth). At the 500 m spatial resolution, MODIS instrument has limitations to detect water bodies with a size smaller than its spatial resolution. In addition, water under aquatic vegetation or canopy is mostly invisible from the optical MODIS sensor. However, the most important advantage of the MODIS products is its ability to provide continuous observations at good temporal resolution (8-day) suitable for both global and regional monitoring applications, over almost the last two decades.

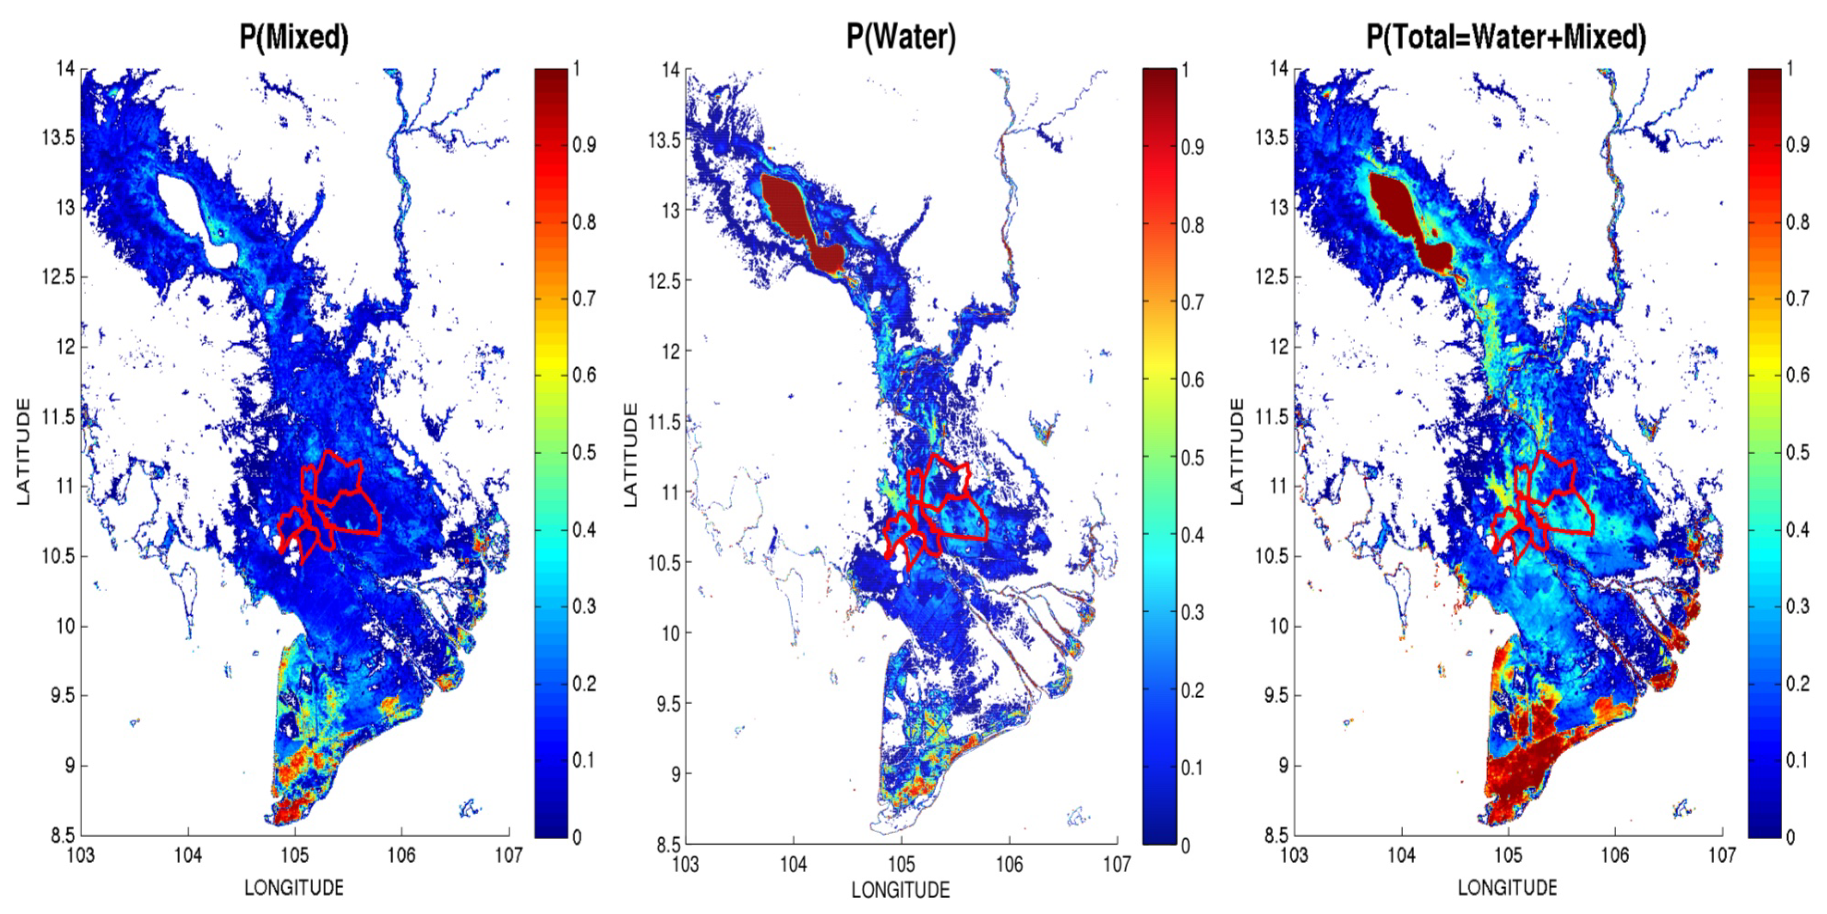
2.3. Preliminary Analysis of the MODIS Database

Figure 3 represents the probability of the mixed (left), water (middle) and total (right) states during the 2001–2017 MODIS record, over the Lower Mekong Basin. Most of the pixels are inundated at least once a year so the probability of the mixed state is not zero for most of the domain. The Tonle Sap is permanently in the water state, meaning that it is 100% covered by water during all the time steps of the long-term record. These three maps provide the overall surface water statistics in the whole Lower Mekong Basin but no long-term trend information is provided here as this statistics mixes what happened in the beginning and in the end of the time record.
Figure 4 represents the time evolution from 2001 to 2017 of the number of mixed, water and total (mixed + water) pixels over the six zones represented in Figure 1 and described in Table 1. Values oscillate between zero (no inundation) and 100% (zone fully inundated). The long-term evolution over Cambodia zones 1C, 2C and 3C appears relatively stable (except for a decrease in the last three years in 3C), but inter-annual variabilities can be strong, for both mixed and water areas, especially in subdomains 2C and 3C. In comparison, long-term trends are very pronounced over Vietnam. In particular, zones 1V and 2V display a significant decrease in the number of water or total pixels. Zone 3V has more stable inundation, except for the last years (2015–2017) because this region has witnessed less infrastructure development. It can also be noted that zone 1V has a higher number of mixed pixels during 2011–2017 when compared to the earlier period, especially during the beginning of the water season.
Figure 3 and Figure 4 provide indications on spatial and temporal changes of wet surfaces respectively. In the following sections, we will combine these two types of information to provide further understanding of flooding dynamics.

3. Spatio-Temporal Analysis of the Long-Term Variability of Surface Waters

A Principal Component Analysis (PCA) of the surface water area will first be performed to facilitate the space/time analysis of the raw database.

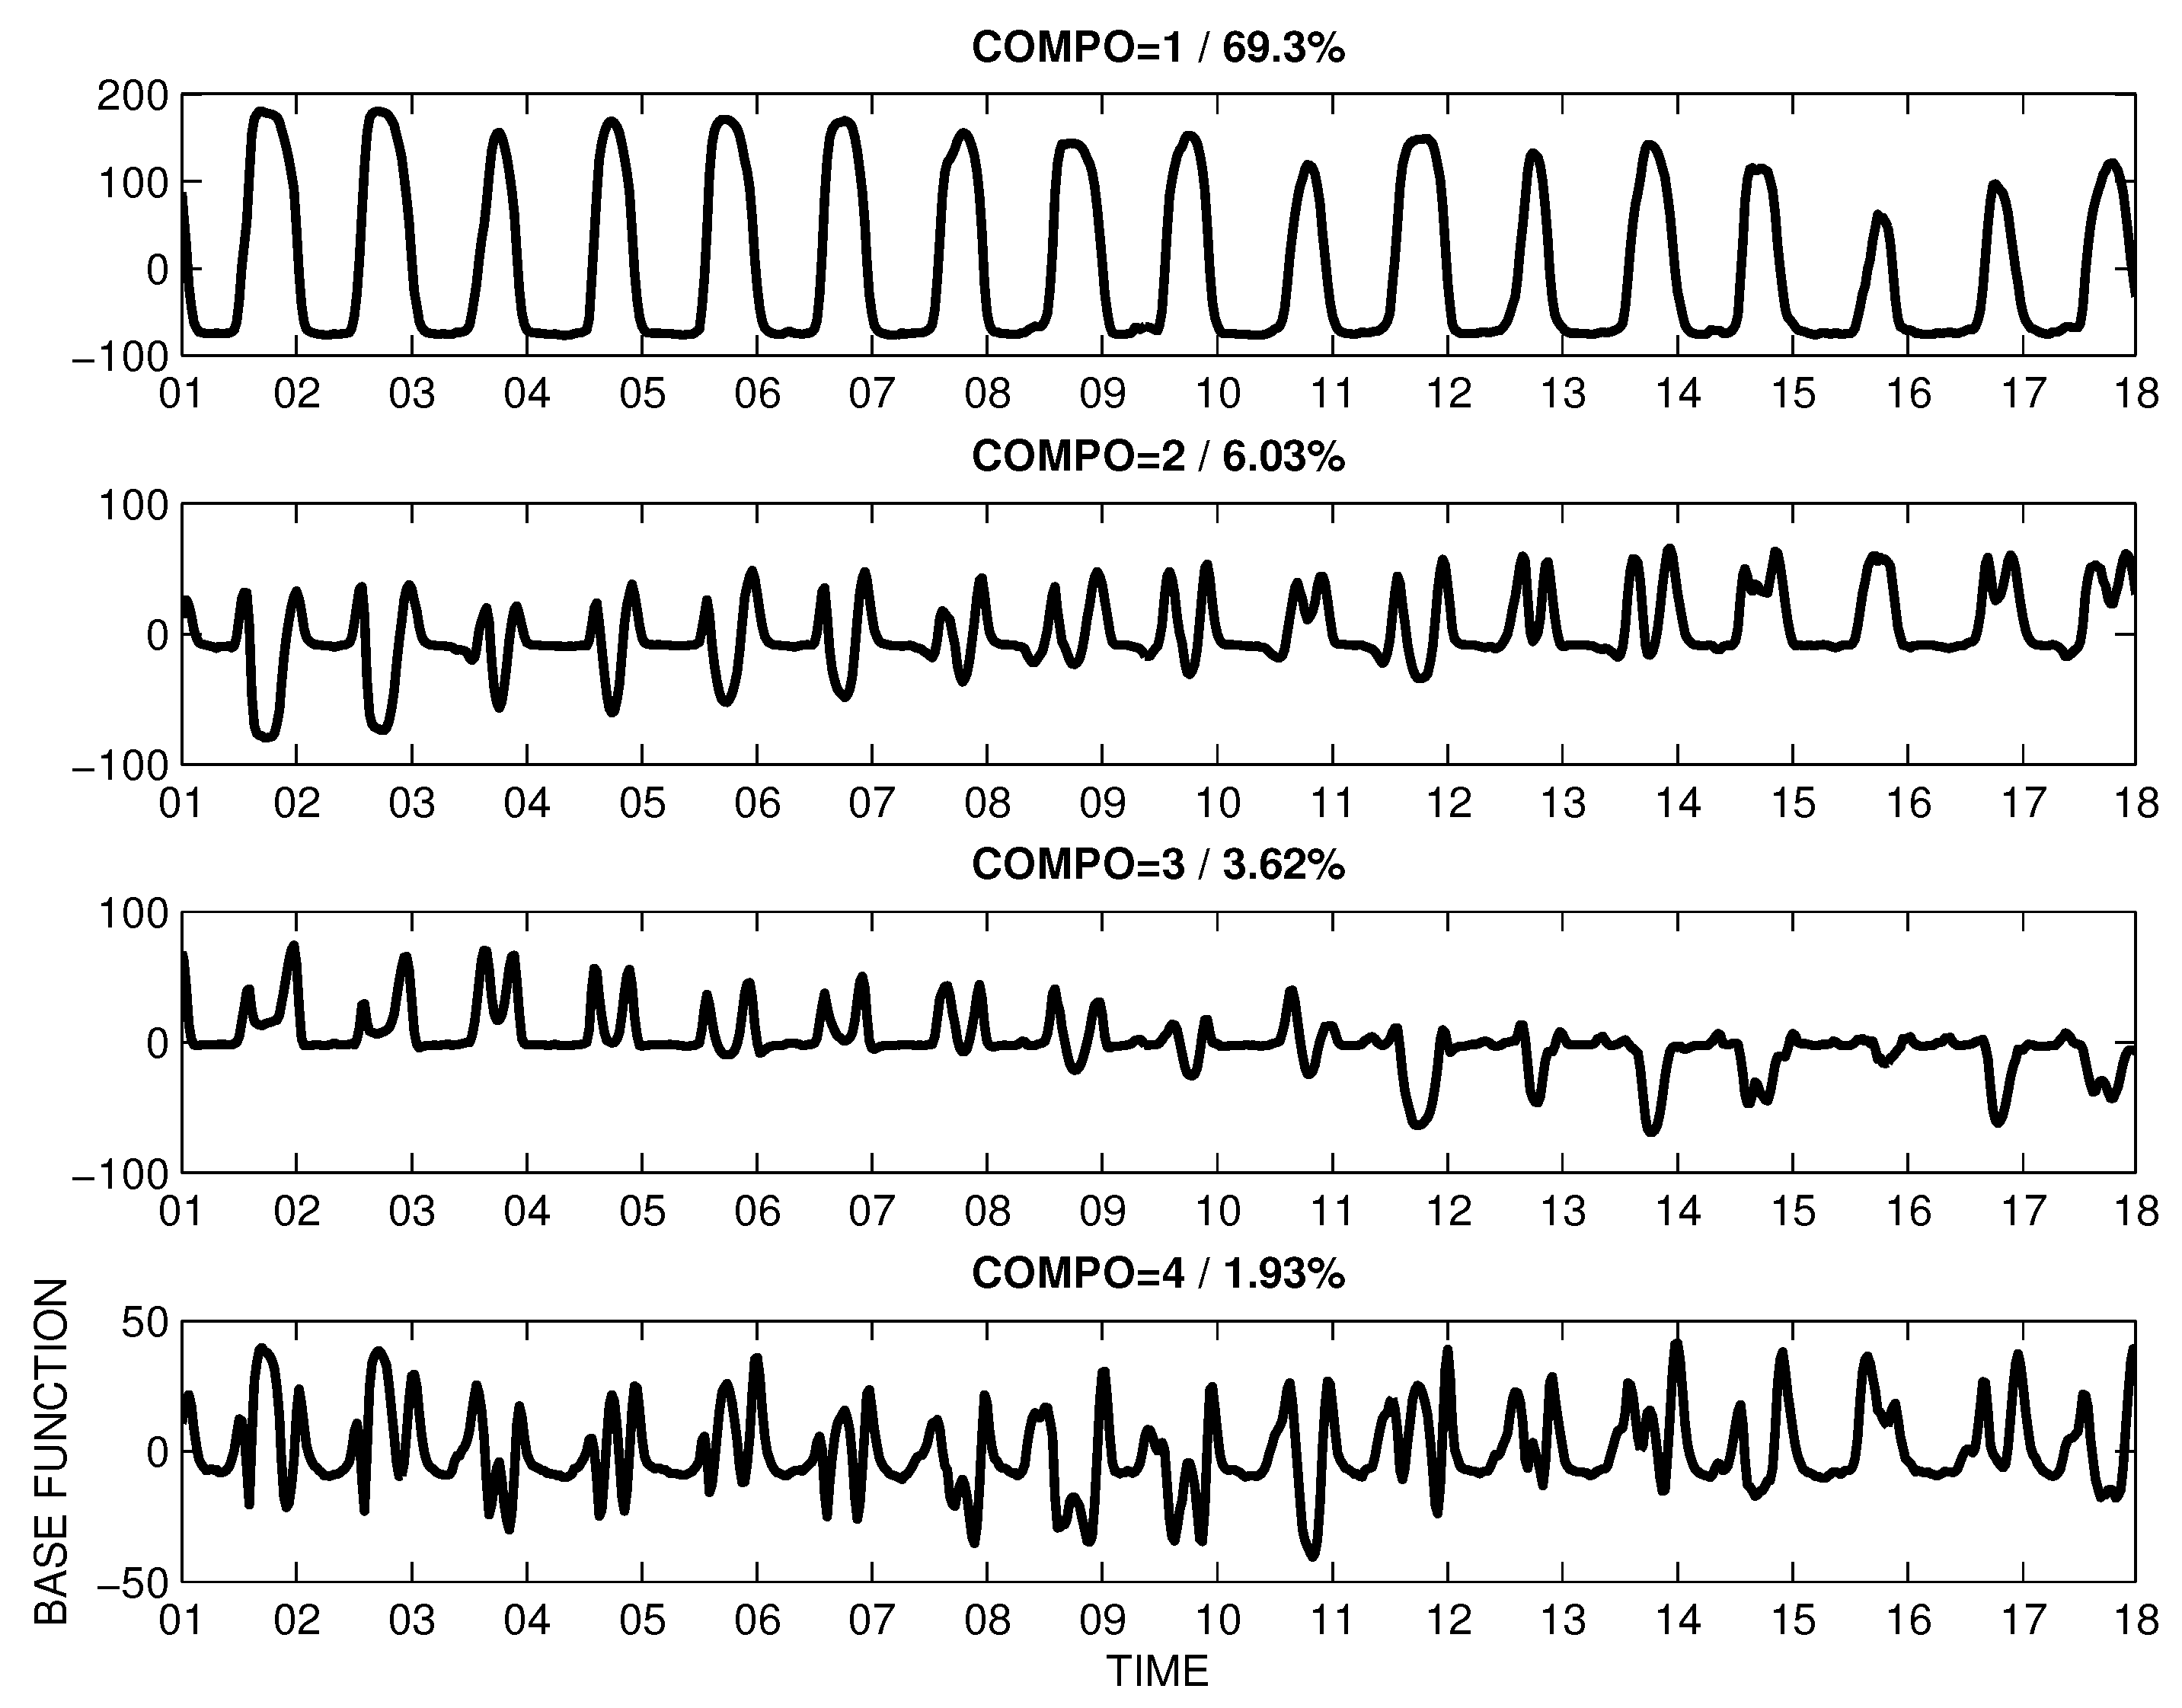
3.1. Principal Component Analysis

First of all, an important choice needs to be made. First, the PCA can be done individually in each one of the six considered zones of Section 2.1 and Table 1. In this case, the PCA can be more precise because the analysis will be better suited for each zone, and will be less ambiguous because inundation variabilities from different areas would be less mixed. Second, the PCA can also be done simultaneously on the whole domain of the six zones. The advantage of this later approach is that the extracted components are then applicable to the six zones, and the inter-comparison of the zones is made easier. In this paper, we chose to use the second strategy.

3.1.1. PCA Methodology
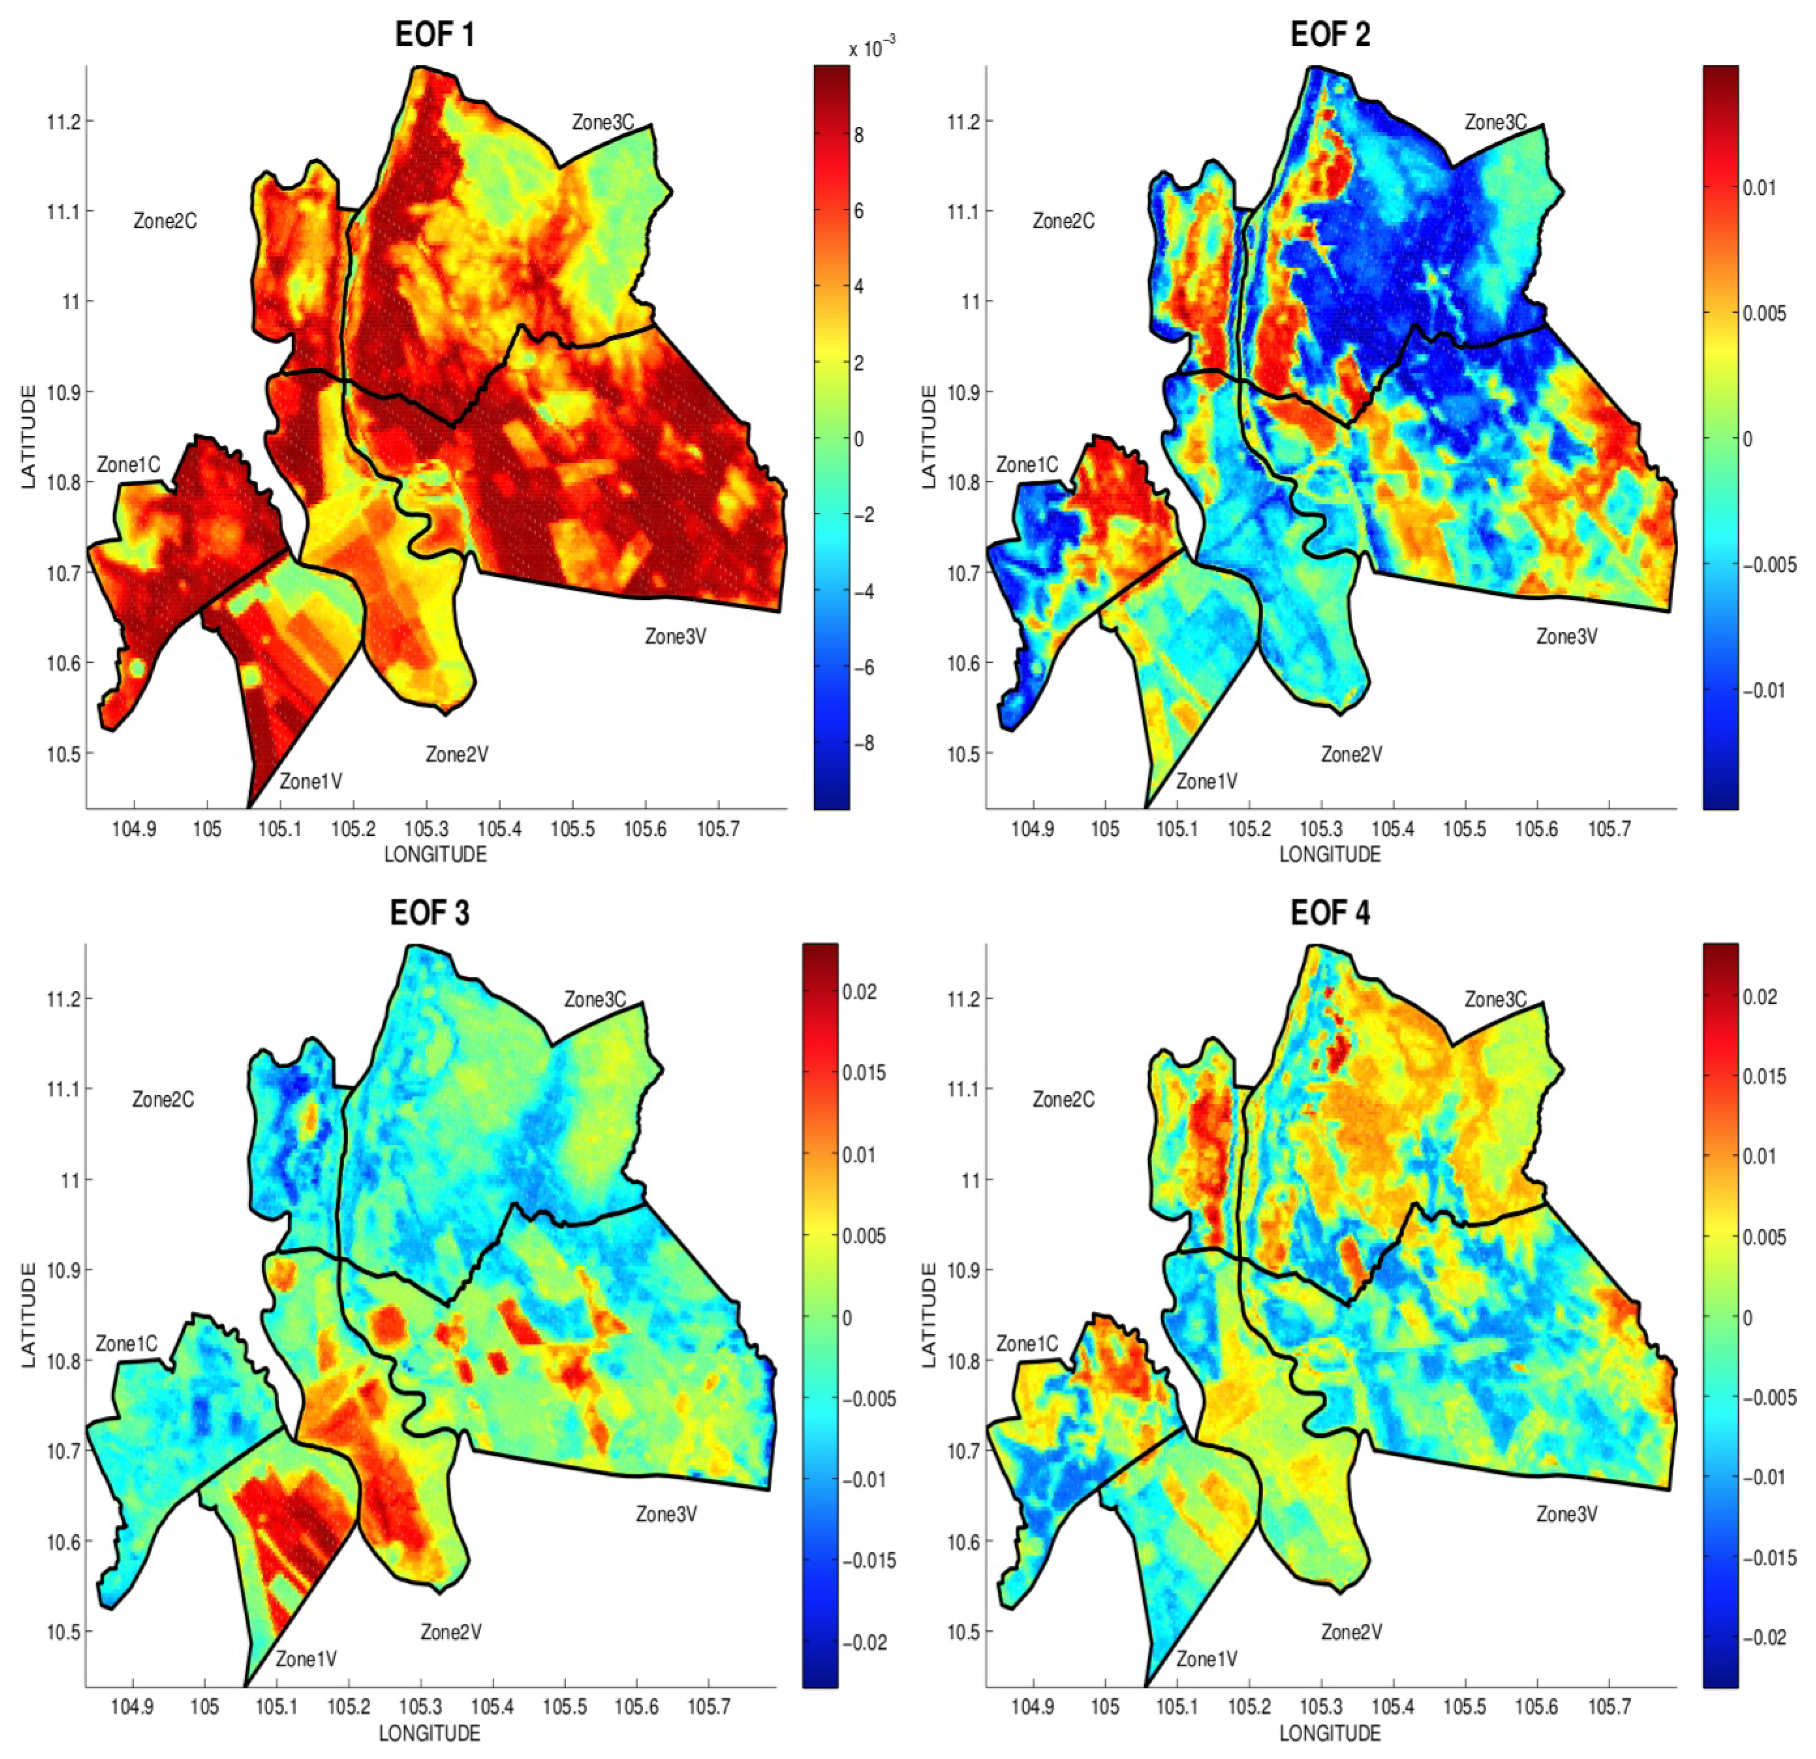
PCA is a very general statistical methodology that intends to describe the variability of multivariate observations using a new base defined by a limited set of patterns. PCA has been widely used in geophysics to isolate important spatial patterns, called Empirical Orthogonal Functions (EOFs) in this context (e.g., References [31,32,33]).
Let X be the inundation maps from MODIS in binary values (i.e., 0 for no inundation and 1 for inundation). A spatial map of inundation will be noted X ( t ) , for “week” t (with 1 t T = 17   years × 46 “weeks” = 782 “weeks”). The inundation time series for pixel i will be noted X i , for pixels i = 1 , , P (P = 21,618 pixels in this application, see Table 1). PCA is used to decompose the X space-time variability into a limited number of simple components [31]. Since the spatial dimension P = 21 , 618 is much larger than the time dimension T = 782 , it is highly recommended to perform the PCA in the time space. The PCA decomposition allows for the estimation of two matrices: C, the P × T matrix of the components (or scores), and F the T × T matrix with the T-dimensional temporal base function { f k ; k = 1 , , T } . The PCA is performed here on the covariance matrix, meaning that the input data is not normalised. Matrix F describes the axis of a new space of dimension T, and C are the coordinates of the data in this new space.
The temporal decomposition can be written:
X i ( t ) = C ( i , : ) · F , 1 t T = C ( i , 1 ) · F ( 1 , t ) + + C ( i , T ) · F ( T , t ) C ( i , 1 ) · F ( 1 , t ) + + C ( i , K ) · F ( K , t ) for 1 K T ,
where the sign “:” in a matrix coordinate indicates that all the lines or columns are considered. In the third line of Equation (4), instead of using the full T PCA components, only the first K components are used ( K T ). This allows to describe any time series using a limited number K ( K = 4 in the following) of temporal base functions but of course, part of the variability will be lost (i.e., higher- order components).
The interpretation of PCA components is not always trivial because physical processes can require more than one PCA component to describe their complexity [34,35,36], and the mixing of the components can be non-linear and involving higher-order statistics [37]. The PCA technique will be used here to assess the spatio-temporal variability of surface waters in a more robust way than by performing a time series analysis at each pixel.

3.1.2. PCA Results

Figure 5 represents the first four temporal base functions { f k = F ( j , : ) ; k = 1 , , 4 } . The percentage of variance explained by each one is also indicated. Together, the first four components explain 81% of the variability in the MODIS dataset. Figure 6 represents the corresponding spatial components C ( : , k ) of the first four components.
First component—The first component (representing 69.3% of the surface water variability) is a low-frequency time evolution that includes the seasonal cycle and some inter-annual variabilities such as a strong decrease of the total inundated area in 2015 or a shorter inundation season in 2012. A general decreasing trend can be noticed. This component shows that there is a well-identified seasonal cycle, but also strong inter-annual variations. It is not surprising that this inundation-related component appears to explain a large part of the variability in the data since the spatial domain under study is a large-scale floodplain. Of course, all the pixels in the study domain do not follow exactly the temporal patterns of this first base function and additional components are necessary to describe smaller or higher-order differences. These differences will be expressed in terms of anomalies with respect to this first base function. In Figure 6, this first component is positive for most regions, except two large areas in the Northeast of Zone 3C and in the Northwest of Zone 1C that have pixel values close to zero due to higher elevation.
Second component—The second base function in Figure 5 (i.e., 6.03% of the variability) has an annual behaviour, with a main downward peak in the middle of the inundation season, and two secondary peaks (mainly positive) at the beginning and the end of the season. This annual behaviour is used to modulate the quite regular seasonality of component 1, by increasing or decreasing the amplitude of the season, and by shortening or extending the duration of the season. This component is therefore used to describe the kurtosis (i.e., flatness) of the inondation season. The two peaks at the beginning and the end of the season can also be used to describe two “mixed” pixel peaks, corresponding to the watering of rice fields (this will be discussed below). In addition, component 2 has also a positive long-term trend, from lower to higher values. When this second component is positive, the seasonal inundation amplitude is lowered in the early years, and increased in the latest years; and the opposite is true when this component is negative. The spatial pattern of EOF 2 (Figure 6) displays strong contrasts: (1) high negative values in Zone 3C and the west of Zone 1C; this is representative of a long-term decreasing trend in inundation areas that are slightly more elevated; and (2) positive values in areas that have witnessed an increasing trend in inundation (eastern part of Zone 1C, Zone 2C, and western part of Zone 3C. Some positive values can also be observed in the eastern part of Zone 3V. Since both positive and negative trends can be observed in the three Cambodian zones, trends are not easy to analyse when doing zone-averaging as in Figure 4. The meaning of these positive and negative trends will be discussed in the following section.
Third component—The component 3 (3.62% of the variability) displays a strong temporal negative trend (see third base function in Figure 5). When positive, the amplitude of the season decreases with time. As for component 2, this component has a peak at the start and at the end of the inundation season, so this component is used to modulate the inundation duration. This component acts almost only in Vietnam (see EOF 3 in Figure 6), reflecting particularly well the construction of water control infrastructures. This component is therefore used to represent the decreasing trend of surface inundation in Vietnam due to the construction of low and high dykes over the last two decades.
Fourth component—Component 4 represents only 1.93% of the surface water variability in the MODIS record (Figure 5). This component has higher temporal frequencies during the year than the previous components. Furthermore, the variability it represents is more irregular over the years. For instance, the anomalies in this base function are positive in the earlier time record, negative in the 2007-2011 period, and positive again towards the end of the record. The spatial EOF 4 in Figure 6 is linked to EOF 2 but with a lower spatial extent. This suggests that this component is used to introduce a delay/progression of the inundation season, mostly in Cambodia and possibly in relation to land use change.
Overall, the PCA representation of surface waters is able to synthetise the variability present in the MODIS database. This PCA represents first (1) the seasonality of inundation with some inter-annual variability, (2) a natural increasing or decreasing trend in Cambodia, and (3) decreasing trend in Vietnam related to anthropic activities.

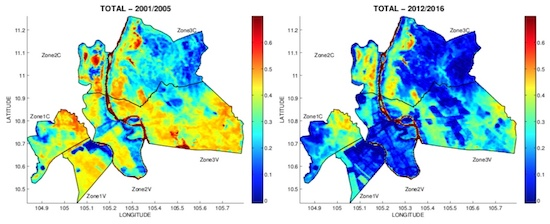
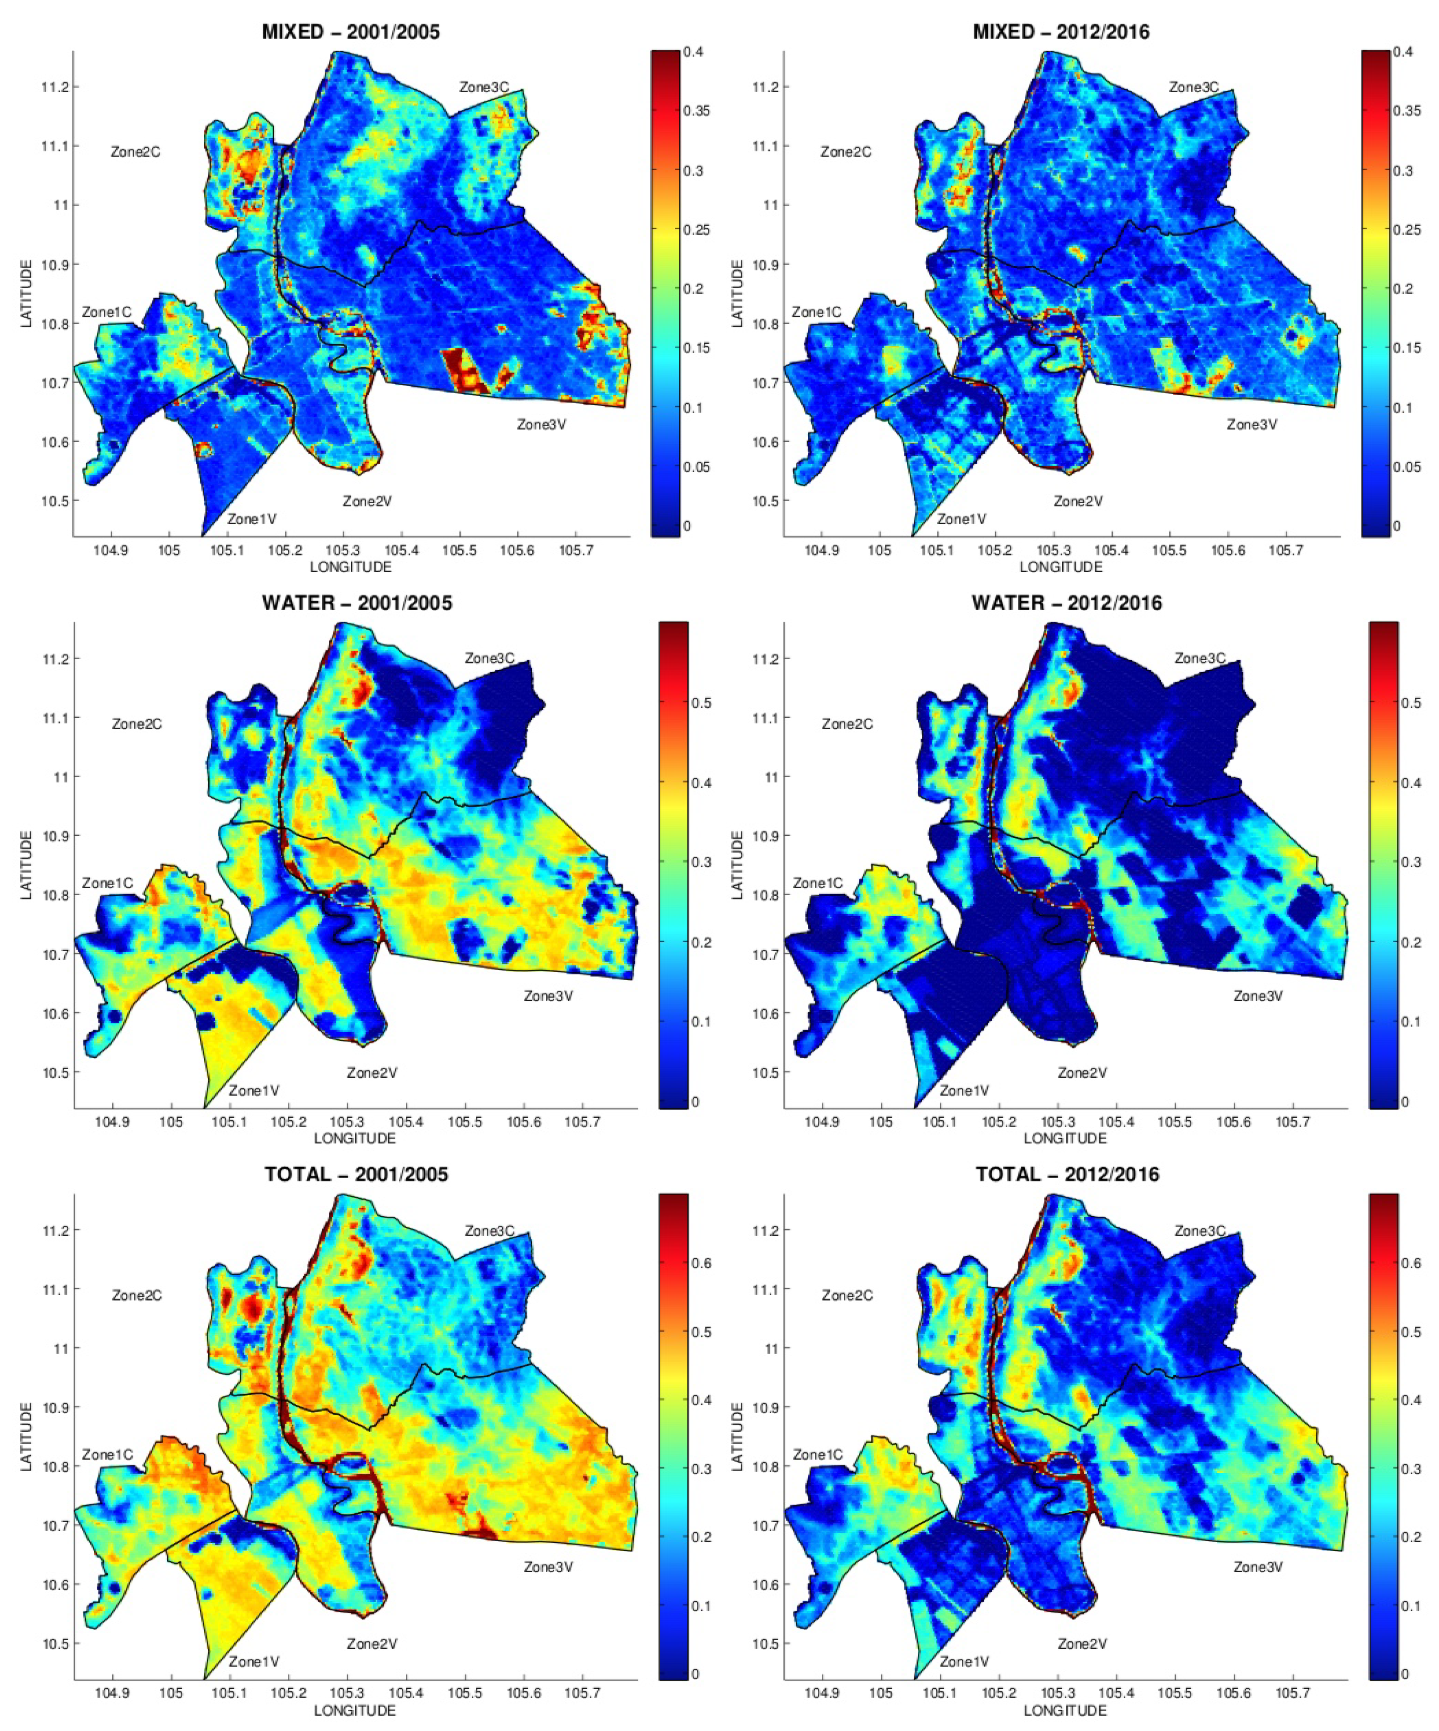
3.2. Long-Term Evolution of the Spatial Distribution of Surface Waters

The satellite observations can be used to analyse the spatial pattern of the long-term trends described above in Figure 7. These figures represent the changes in the frequency (between 0 to 1) of mixed, water and total pixels, when averaged in the first (2001–2005) and the (2012–2016) 5-year period of the long time record.
There is a decrease in the frequency of mixed pixels in the three Cambodian zones (Figure 7-Top). Zone 1C had a natural flooding pattern in 2001/2005 that almost disappeared in 2012/2016; this is the result of the development of rice cultivation. For Vietnam, the decrease is also noticeable, especially in regions that had high mixed-pixel frequency (one spot in Zone 1V and in the southeast of Zone 3V) and the most recent maps clearly show field-like structures and the canal network.
For water pixels, the decrease is again noticeable in the Cambodian zones, but the decrease is much more marked over Vietnam (Figure 7-Center). This is particularly true in Zones 1V and 2V where water pixels have almost disappeared. This striking change is linked to the construction of high dykes and water control infrastructure (see Figure 2H) that started in the early 2000s but accelerated from 2008 onwards. In Zone 3V, the water pixel frequency has decreased due to the construction of dykes too, but water pixels still represent 20 to 30% of the area with flooding occurring over large field-shaped structures. There is a particular V-shaped area in the south of Zone 3V (longitude = 105.55° and latitude = 10.7°), which corresponds to a protected area where cultivation has been forbidden and vegetation allowed to grow back naturally.
As a consequence, the total pixel frequency has also decreased (Figure 7-Bottom), mainly over the Vietnam zones, in a very significant way.

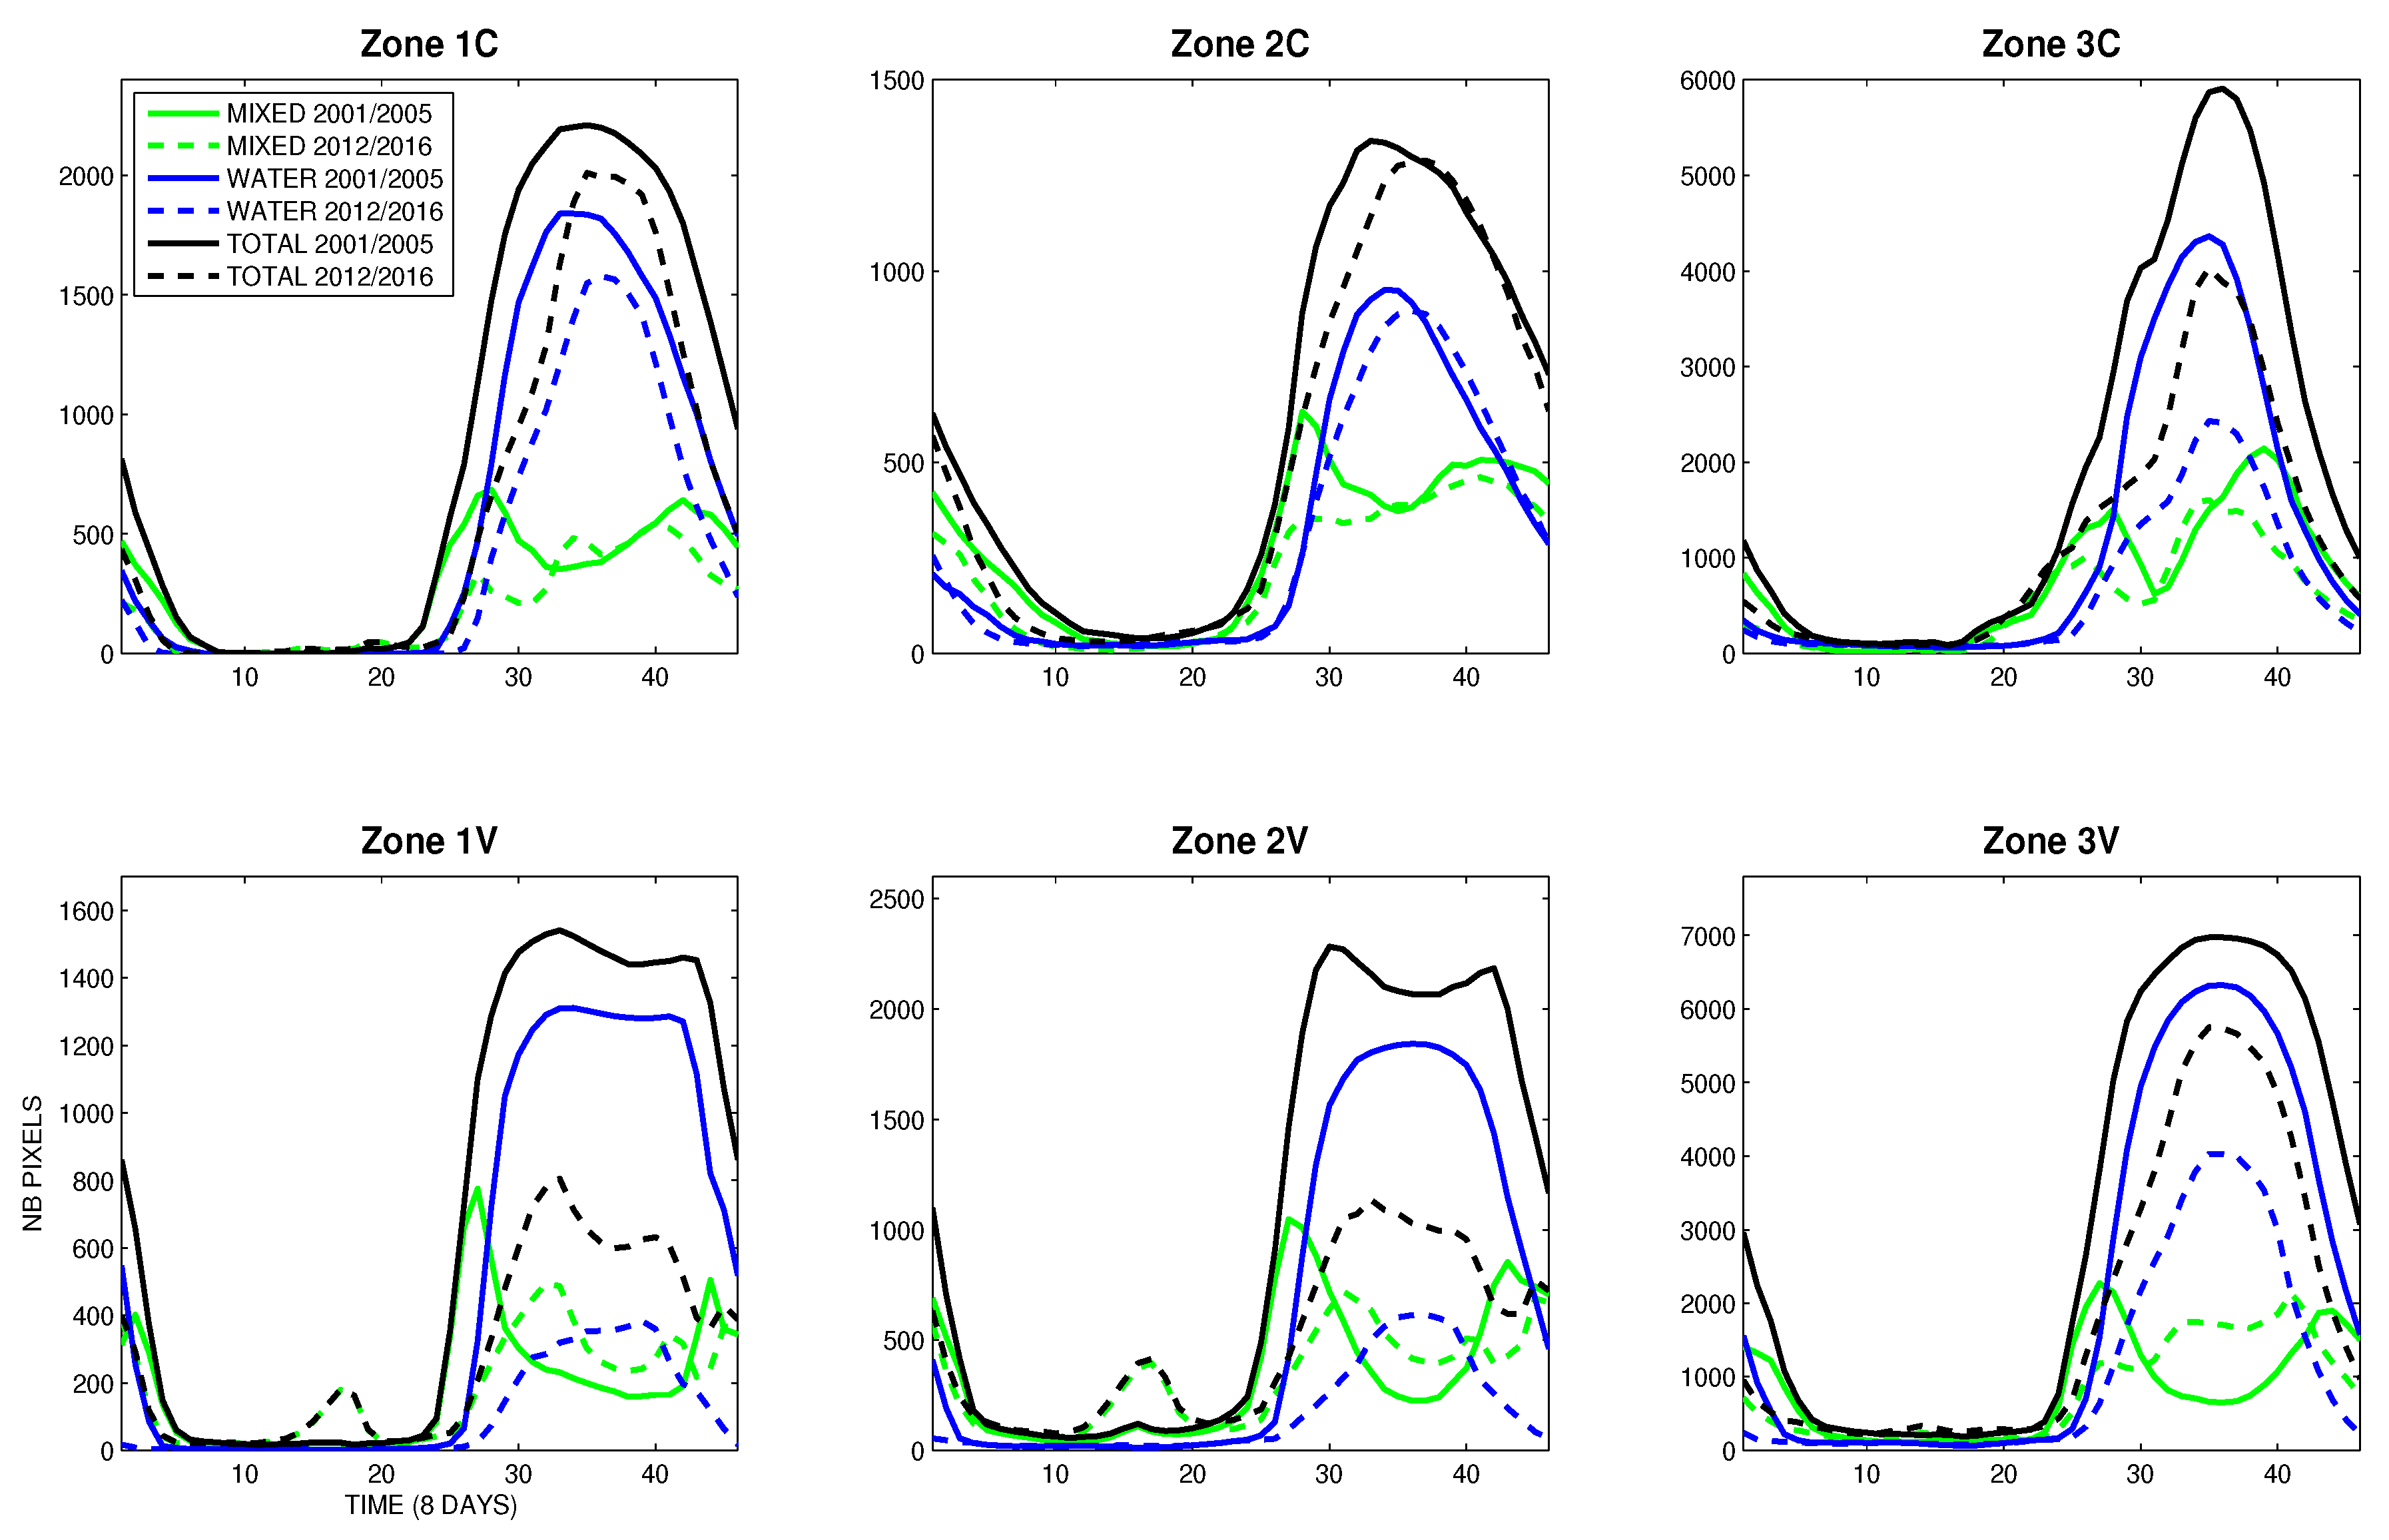
3.3. Long-Term Evolution of the Seasonality

Figure 8 shows the annual evolution of the mixed, water and total number of pixels for years 2001–2005 (plain lines) and 2012–2016 (dashed lines). The figure shows that changes have been relatively modest in Cambodia, with a similar amplitude of the inundated area when comparing the two periods (apart for the Zone 3C—see below).
In contrast, the changes in Vietnam are much more significant and results from man-made intervention can be seen, especially on Zones 1V and 2V (zone 3V is less anthropized and is more heterogeneous).
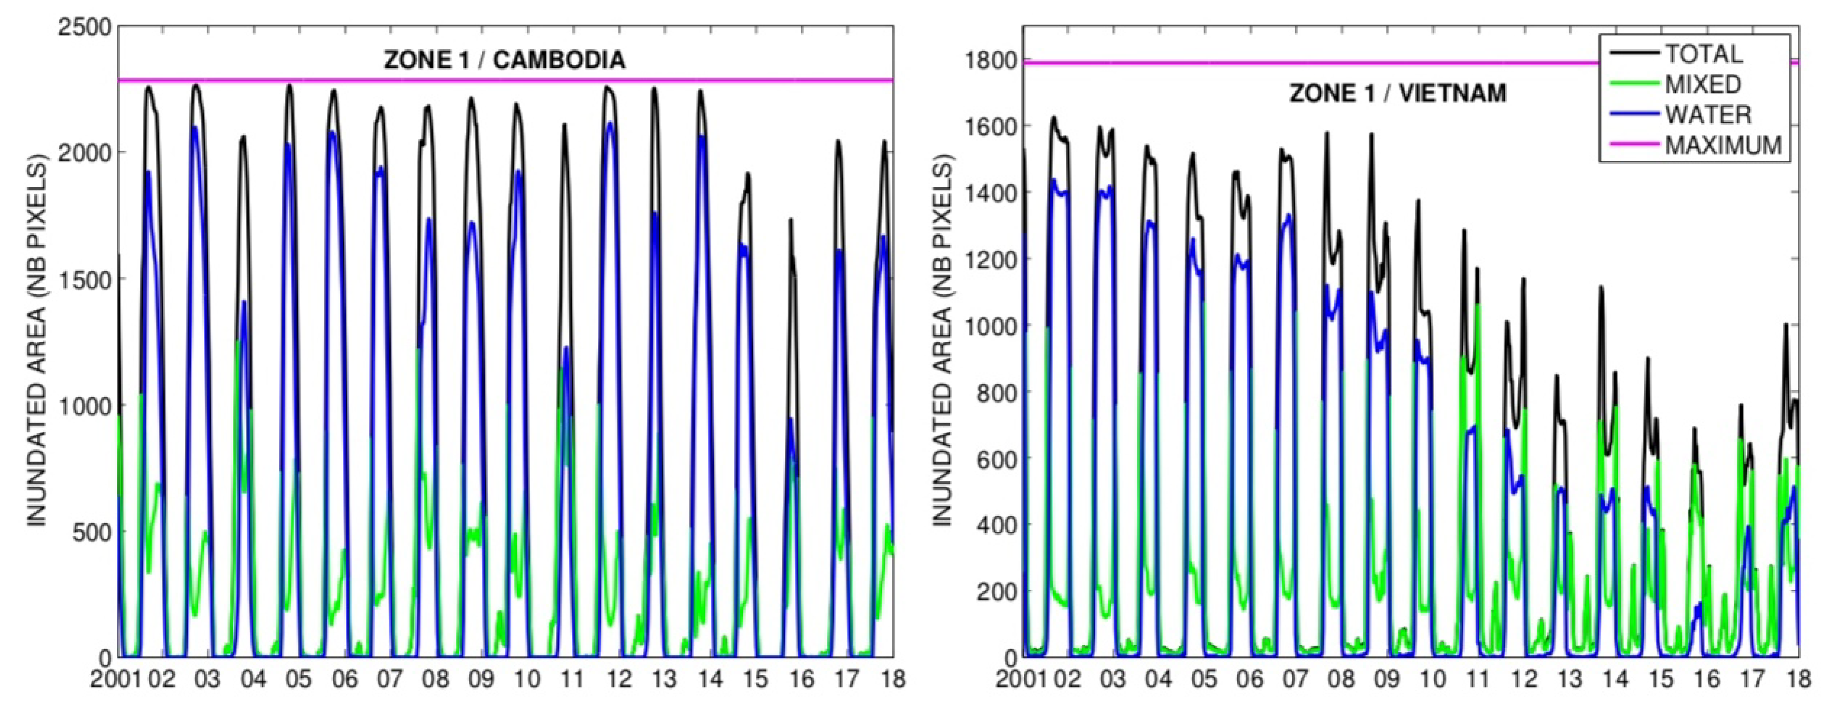
  • For instance, the dynamics in Zone 1C have not changed much except that water pixels are delayed by a few weeks. The mixed pixels peak are less pronounced in 2012–2016 than in 2001–2005 but still mimic the two cropping season in the area (with land preparation occurring in May and December, respectively, see Figure 2E). The water pixels season length seems to be shorter with a later start and a shorter duration, and amplitude is slightly lower (Figure 2E) shows the flooded landscape of the area in September 2018).
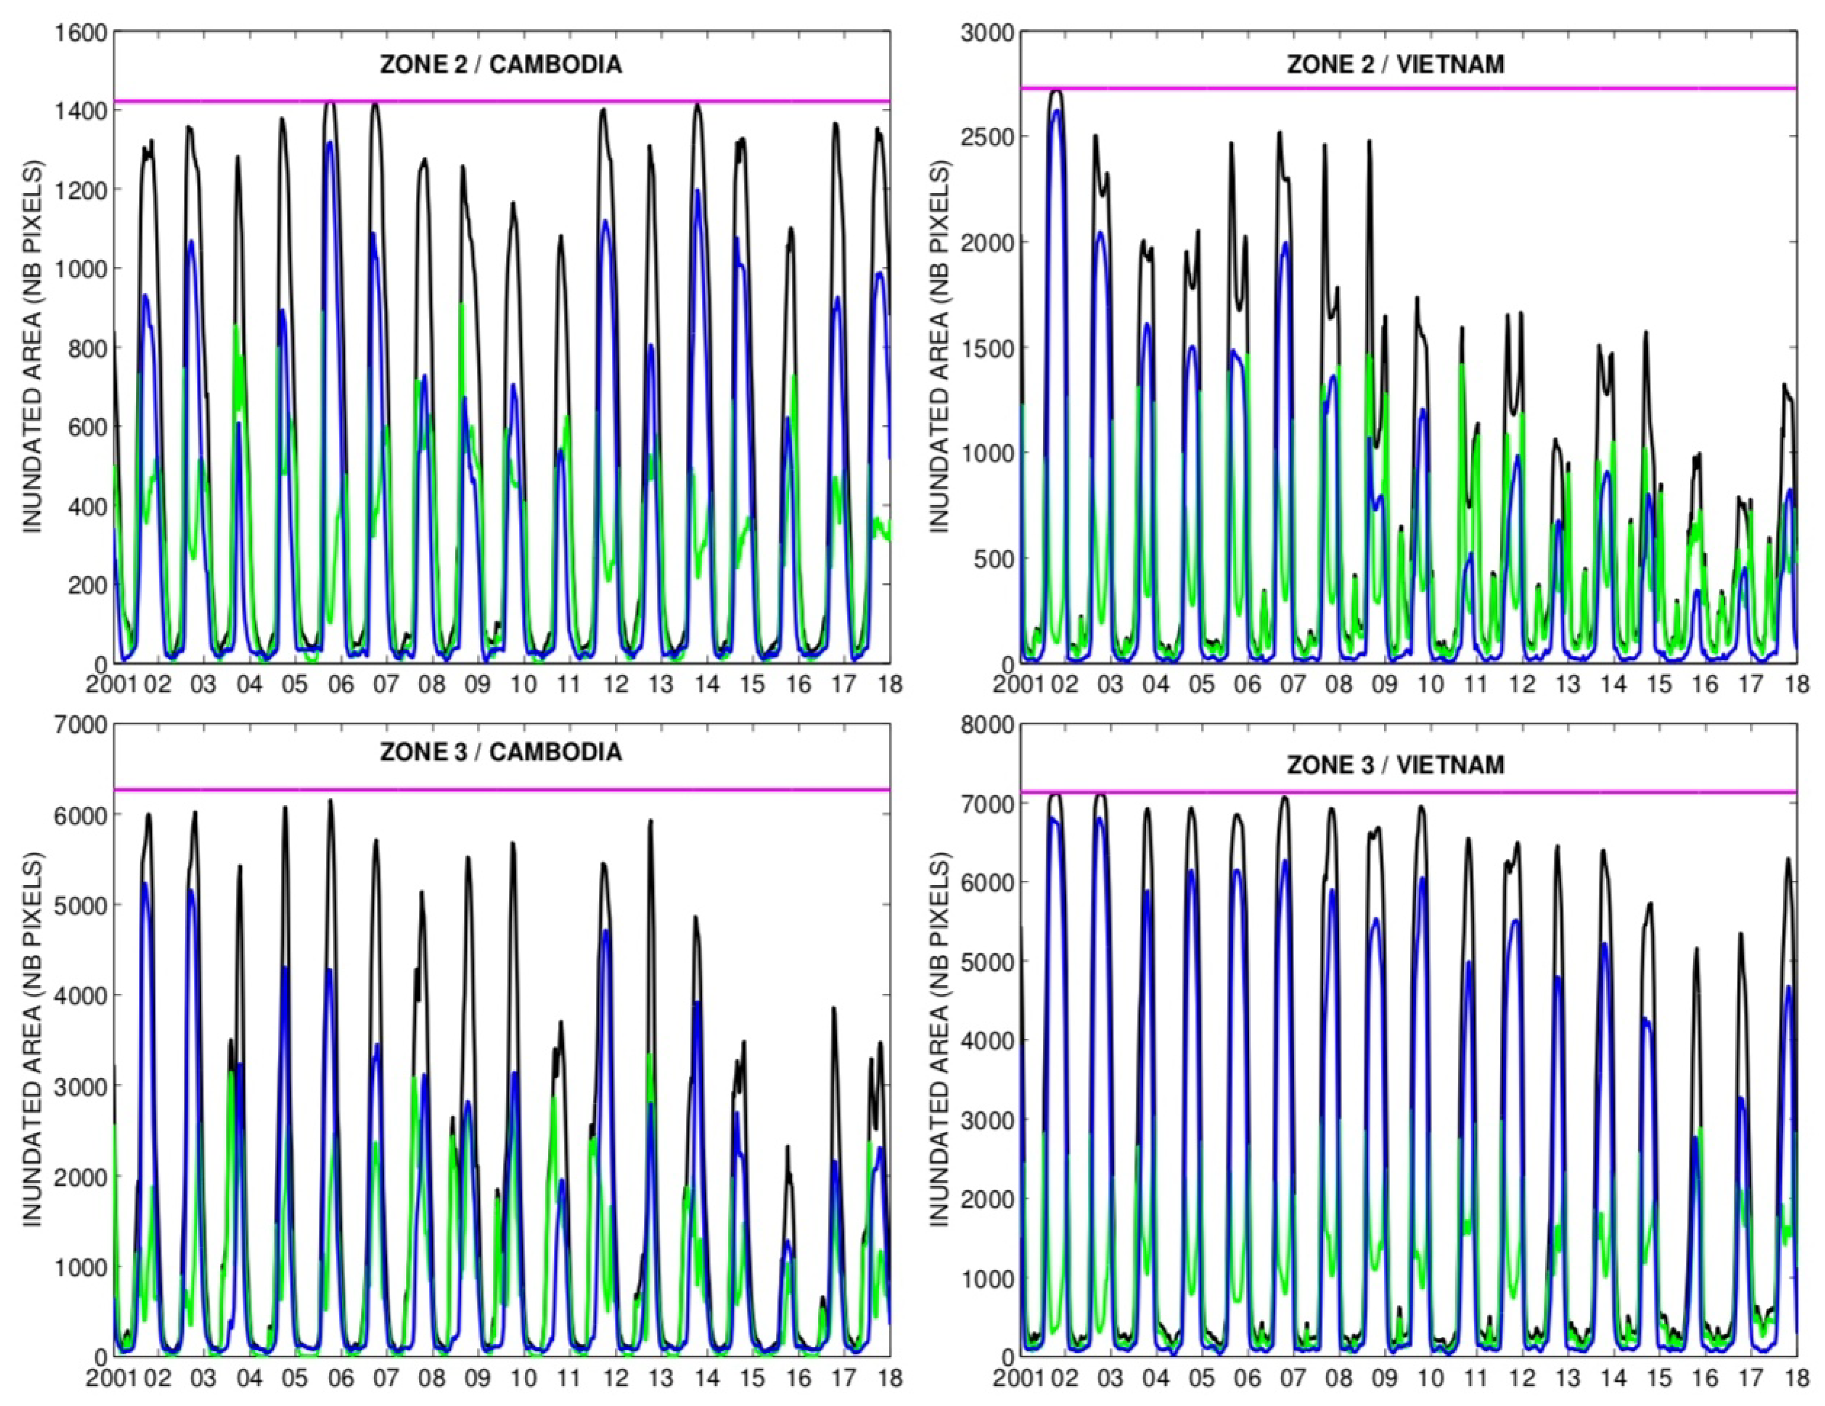
  • Zone 2C has also witnessed little change: the mixed and water pixels have a peak that is delayed by a few weeks, and the two peaks of the mixed pixels are less pronounced, as if the onset of the flood is more progressive while the recession of the flood is more rapid.
  • Zone 3C has trends more difficult to analyse due to the heterogeneity of the large area (6267 pixels). The water pixel area has dropped significantly (by 20% in the season maximum) and the mixed pixel peak seems to occur earlier but to be less pronounced.
  • Zone 1V shows a decrease in the number of water pixels by about 70%. Over one year, the total number of mixed pixels has not changed much but a first pick in the season in April has appeared. This peak marks the preparation of rice fields through flooding by the use of pumps.
  • In Zone 2V, again, the water pixels area has considerably decreased, by about 50%. A peak of mixed pixels occurs around mid of April in the period 2012–2016 and did not exist in 2001–2005 as observed in Zone 1V. The mixed pixels temporal behaviour remains similar in the main flood season, but the observed peaks are delayed.
  • Zone 3V has a lower decrease in the number of water pixels than the two other Vietnamese zones but it remains very significant (by more than 20%). The mixed pixels have a similar area, but the peaks are less noticeable in 2012–2016 than in 2001–2005 as was the case in Zone 3C.

3.4. Interpretation/Discussion

In Cambodia, the analysis shows some positive and negative trends (in terms of frequency of mixed and water pixels; see Figure 7). Most of the study area is characterised by a negative trend (i.e., a decrease in the spatial extent of surface water and in the duration of the flood season). This overall decreasing trend has come together with a delay of the onset of the flood by about two weeks, which we may attribute to large scale drainage works conducted in Zone 1C and the south of Zone 2C notably (Figure 8) as well as delayed river flows in long term MRC rime records (www.mrcmekong.org). The MODIS analysis seems to confirm interviews with farmers who frequently indicated that the flood comes and recedes faster in recent years than 15 years ago. This can be attributed to the combined effects of effective drainage and sluice gates operation in Vietnam—sluice gates remaining close to protect the August harvest as was the case in 2017 when the flood peaked relatively early.
Some areas in Cambodia (e.g., extreme north of Zone 1C and center of Zone 2C; Figure 8) have witnessed a positive trend (i.e., an increase of the flooded area and of the duration of the flood season). This may rather be linked to deforestation and land reclamation (discovering surface waters that were previously hidden by the natural vegetation at least for part of the year) than to an actual amplification of the flood. Many farmers and key informants we interviewed indeed mentioned that the natural vegetation had been progressively cleared and land converted to rice fields over the last 10 years when private fishing concessions wee cancelled and regulations to accessband use land for cultivation not as strictly enforced as before. It would be interesting to complement these farmers insights with an historical land use/land cover analysis. Such increase in the surface water area constitutes, therefore, an artefact of global remote sensing products.
The overwhelming trend in Vietnam is one of a lower amplitude and duration of the flood. This can be clearly attributed to the extensive construction of low and high dykes. The high dykes have been built higher than the maximum river water level in an attempt to totally flood-proof agricultural lands and allow triple rice cultivation. This decrease is particularly noticeable in Zones 1V and 2V, which show internal differences that can be linked to the dates at which the dykes were built. For instance, the western parts of Zones 1V and 2V were already protected from floods in the early 2000s (in blue, Figure 7 left side) while the eastern parts have become insulated from flood later (shift from yellow to blue in Figure 7) (see References [2,5] for a detailed discussion of the dynamics of dykes construction in Vietnam). Similarly to Cambodia, the duration of the flood season has decreased with a later onset and an earlier recession, marking an increased control of the flood through human engineering.
Two other trends are worth mentioning. First is the existence of a new peak of mixed pixels around April in Zone 1V and 2V in addition to the two pre-existing peaks that occur at the end of August and at the end of December. This may correspond to a period where farmers water their fields before sowing their third rice crop now protected from the floods by high dykes. In Cambodia, these peaks occur in May and in November, the two periods during which farmers water their field for rice cultivation. Second, there are small patches of mixed pixels (in the center south of Zone 3V and the center east of Zone 1C); these correspond to protection and conservation areas where the natural vegetation is still “allowed to grow” (the national park of Tràm Chim in Vietnam and the Boeung Prek Lapouv in Cambodia). In both instances, the extent of mixed pixels has decreased when comparing the two periods analysed (2001–2005 and 2012–2016) pointing out to the fact that these areas are under human-pressure despite their protected status (precipitation trend is a second-order here considering the strong human intervention). This would also require a more detailed analysis in these regions, including the monitoring of the vegetation and precipitation.

4. Conclusions

The MODIS flood database developed and used here enables the monitoring of seasonal, inter-annual, and long-term trend evolution of the surface water distribution in the floodplain of the Upper Mekong Delta at the Cambodia/Vietnam border. There are clear differences in the distribution of these changes between Cambodia and Vietnam, over the 2001–2017 record. In Cambodia, changes detected by visible/infrared observations can be misleading because some of them are related to deforestation and land reclamation instead of a change in water presence. In contrast, over Vietnam, very significative negative trends in the extent and duration of flooding can be observed. Climate change may explain some of these changes, in particular for precipitation, but they are mainly the result of land use and water management changes that have occurred over the last twenty years. In Vietnam, notably, the construction of high dykes and drainage networks has induced a large decrease in the extent and duration of flooding so as to support triple rice cultivation.
The 500 m spatial resolution of the MODIS data appears to be compatible with the heterogeneity observed in the field. Satellite data, especially when combined with ground truth expertise, can contribute to better monitoring and understanding hydrological dynamics at such mesoscale (≃100 × 100 km2), hence inform water managers and policy makers involved in designing water control infrastructure projects to support agricultural intensification. Visible data are an essential long-term source of information but this type of observation (MODIS as well as Landsat and Sentinel-2 data) is limited by cloud cover and vegetation presence. It is very important to keep these two limitations in mind when using such visible-based databases. Furthermore, satellite observations need to be complemented by ground-truth expertise in order to interpret the results correctly. Our results—and notably our ground knowledge—allows putting in perspective Pekel’s analysis [20] which points to an increase in the frequency of flooding in the Upper Mekong Delta of Cambodia, which we attribute at least partly to deforestation and land reclamation rather than actual change in flood dynamics.
This study also stresses that, for any long-term analysis, older satellite missions such as MODIS or Landsat will continue to be necessary: newer and more precise missions such as SWOT (to be launched in 2021) will not be able to describe the long-term evolution of continental hydrology due to climate change or water management. Satellite observations are a promising tool to build a historical inundation record where and when ground observation is missing. Each satellite observation has its own advantages and drawbacks. We suggest to combine all sources of information to benefit from the quality of each of them. Once reliable global SAR estimates become available—from ENVISAT, Sentinel-1 or SWOT [38]—they can be combined with historic GIEMS/MODIS/Landsat estimates to build a very long record of inundation areas back to 1978, which, when coupled with ground level expertise will allow to understand in situ dynamics at meso- and even local-scale. A perspective of this work would be to analyse other parts of the Mekong River system. It could be used to study the long-term evolution of water bodies in the coastal area of the Mekong Delta, where shrimp farming has significantly expanded over the last two decades. Vegetation occultation would be less of a concern there.
In this study, we show that the consequences of a national policy to control water (construction of dykes and drainage canals in Vietnam) can be monitored using global remote sensing database such as MODIS. The construction of water control infrastructures has had some advantages for agriculture allowing to have up to three rice harvests a year but it also brought some difficulties such as the demise of capture fisheries and the decrease of soil fertility due to a lack of silt brought by the natural flood, which made necessary the use of chemical fertilisers. The relevance of such policy is now being questioned and further analysis will be needed to measure its long-term impacts. This is particularly relevant as Cambodia tends to follow the path followed by Vietnam over a decade ago and invests significantly in water control infrastructure projects. Before investing in such a strategy, conducting a long-term sustainability and trade-off assessment is needed. We have shown in this study that satellite observations, although coarse in spatial (500 m) and temporal resolution (8 days), can help monitor these changes in the long-term. It can therefore be one of the tools to help study, improve our knowledge, calibrate and validate hydrological models. In the future, satellite data could also be assimilated into hydrological models to improve their reliability and prediction ability. Finally, such study that cross boundaries can provide useful insights when data sharing mechanisms between countries are fraught with challenges.

Author Contributions

F.A. has conducted the whole analysis of the paper, both scientifically and practically (results, graphs and redaction). J.-P.V. has participated to the definition of the experiments, and largely contributed to the writing of the analysis and he brought in-depth knowledge of the studied area. S.M. and N.G. have participated in the analysis of the results. B.P.-D. has implemented the MODIS retrieval algorithm and performed the remote sensing processing. C.P. has contributed to the MODIS remote sensing development. All authors have read and agreed to the published version of the manuscript.

Funding

This research received no external funding.

Acknowledgments

The authors would like to thank Hugo Munier, a Master student who participated in the initial project, as well as Sarah Tweed who initiated the dialogue among several authors of this paper.

Conflicts of Interest

The authors declare no conflict of interest.

References

  1. Planning Atlas of the Lower Mekong River Basin, Basic Development Plan Programme for Sustainable Development; Technical Report; Mekong River Comission: Phnom Penh, Vietnam, 2011.
  2. Duc Tran, D.; van Halsema, G.; Hellegers, P.J.G.J.; Phi Hoang, L.; Quang Tran, T.; Kummu, M.; Ludwig, F. Assessing impacts of dike construction on the flood dynamics of the Mekong Delta. Hydrol. Earth Syst. Sci. 2018, 22, 1875–1896. [Google Scholar] [CrossRef] [Green Version]
  3. Biggs, D.A. Quagmire: Nation-Building and Nature in the Mekong Delta; University of Washington Press: Seattle, WA, USA, 2012. [Google Scholar]
  4. Triet, N.V.K.; Dung, N.V.; Fujii, H.; Kummu, M.; Merz, B.; Apel, H. Has dyke development in the Vietnamese Mekong Delta shifted flood hazard downstream? Hydrol. Earth Syst. Sci. 2017, 21, 3991–4010. [Google Scholar] [CrossRef] [Green Version]
  5. Tran, D.D.; Van Halsema, G.; Hellegers, P.J.G.J.; Ludwig, F.; Seijger, C. Stakeholders’ assessment of dike-protected and flood-based alternatives from a sustainable livelihood perspective in An Giang Province, Mekong Delta, Vietnam. Agric. Water Manag. 2018, 206, 187–199. [Google Scholar] [CrossRef]
  6. Thanh, V.Q.; Roelvink, D.; van der Wegen, M.; Reyns, J.; Kernkamp, H.; Van Vinh, G.; Thi Phuong Linh, V. Flooding in the Mekong Delta: Impact of dyke systems on downstream hydrodynamics. Hydrol. Earth Syst. Sci. Discuss. 2019, 1–34. [Google Scholar] [CrossRef] [Green Version]
  7. Aires, F.; Prigent, C.; Fluet-Chouinard, E.; Yamazaki, D.; Papa, F.; Lehner, B. Comparison of visible and multi-satellite global inundation datasets at high-spatial resolution. Remote Sens. Environ. 2018, 216, 427–441. [Google Scholar] [CrossRef] [Green Version]
  8. Kontgis, C.; Schneider, A.; Ozdogan, M. Mapping rice paddy extent and intensification in the Vietnamese Mekong River Delta with dense time stacks of Landsat data. Remote Sens. Environ. 2015, 169, 255–269. [Google Scholar] [CrossRef]
  9. Kuenzer, C.; Guo, H.; Huth, J.; Leinenkugel, P.; Li, X.; Dech, S. Flood Mapping and Flood Dynamics of the Mekong Delta: ENVISAT-ASAR-WSM Based Time Series Analyses. Remote Sens. 2013, 5, 687–715. [Google Scholar] [CrossRef] [Green Version]
  10. Amitrano, D.; Martino, G.; Iodice, A.; Mitidieri, F.; Papa, M.; Riccio, D.; Ruello, G. Sentinel-1 for Monitoring Reservoirs: A Performance Analysis. Remote Sens. 2014, 6, 10676–10693. [Google Scholar] [CrossRef] [Green Version]
  11. Santoro, M.; Wegmüller, U. Multi-temporal Synthetic Aperture Radar Metrics Applied to Map Open Water Bodies. IEEE J. Sel. Top. Appl. Earth Obs. Remote Sens. 2016, 7, 3225–3238. [Google Scholar] [CrossRef]
  12. Pham-Duc, B.; Prigent, C.; Aires, F. Surface Water Monitoring within Cambodia and the Vietnamese Mekong Delta over a Year, with Sentinel-1 SAR Observations. Water 2017, 9, 366. [Google Scholar] [CrossRef] [Green Version]
  13. Vichet, N.; Kawamura, K.; Trong, D.P.; Van On, N.; Gong, Z.; Lim, J.; Khom, S.; Bunly, C. MODIS-Based Investigation of Flood Areas in Southern Cambodia from 2002–2013. Environment 2019, 6, 57. [Google Scholar] [CrossRef] [Green Version]
  14. Bryant, R.G.; Rainey, M.P. Investigation of flood inundation on playas within the Zone of Chotts, using a time-series of AVHRR. Remote Sens. Environ. 2002, 82, 360–375. [Google Scholar] [CrossRef]
  15. McFeeters, S.K. The use of the Normalized Difference Water Index (NDWI) in the delineation of open water features. Int. J. Remote Sens. 2007, 17, 1425–1432. [Google Scholar] [CrossRef]
  16. Xu, H. Modification of normalised difference water index (NDWI) to enhance open water features in remotely sensed imagery. Int. J. Remote Sens. 2007. [Google Scholar] [CrossRef]
  17. Ovakoglou, G.; Alexandridis, T.K.; Crisman, T.L.; Skoulikaris, C.; Vergos, G.S. Use of MODIS satellite images for detailed lake morphometry: Application to basins with large water level fluctuations. Int. J. Appl. Earth Obs. Geoinf. 2016, 51, 37–46. [Google Scholar] [CrossRef]
  18. Sakamoto, T.; Van Nguyen, N.; Kotera, A.; Ohno, H.; Ishitsuka, N.; Yokozawa, M. Detecting temporal changes in the extent of annual flooding within the Cambodia and the Vietnamese Mekong Delta from MODIS time-series imagery. Remote Sens. Environ. 2007, 109, 295–313. [Google Scholar] [CrossRef]
  19. Xiao, X.; Boles, S.; Frolking, S.; Li, C.; Babu, J.Y.; Salas, W.; Moore III, B. Mapping paddy rice agriculture in South and Southeast Asia using multi-temporal MODIS images. Remote Sens. Environ. 2006, 100, 95–113. [Google Scholar] [CrossRef]
  20. Pekel, J.F.; Cottam, A.; Gorelick, N.; Belward, A.S. High-resolution mapping of global surface water and its long-term changes. Nature 2016, 540, 418–422. [Google Scholar] [CrossRef]
  21. Leinenkugel, P.; Kuenzer, C.; Dech, S. Comparison and enhancement of MODIS cloud mask products for Southeast Asia. Int. J. Remote Sens. 2013, 34, 2730–2748. [Google Scholar] [CrossRef]
  22. Ogilvie, A.; Belaud, G.; Massuel, S.; Mulligan, M.; Le Goulven, P.; Calvez, R. Surface water monitoring in small water bodies: potential and limits of multi-sensor Landsat time series. Hydrol. Earth Syst. Sci. 2018, 22, 4349–4380. [Google Scholar] [CrossRef] [Green Version]
  23. He, Q.; Fok, H.; Chen, Q.; Chun, K. Water Level Reconstruction and Prediction Based on Space-Borne Sensors: A Case Study in the Mekong and Yangtze River Basins. Sensors 2018, 18, 3076. [Google Scholar] [CrossRef] [PubMed] [Green Version]
  24. Prigent, C.; Papa, F.; Aires, F.; Rossow, W.B.; Matthews, E. Global inundation dynamics inferred from multiple satellite observations, 1993–2000. J. Geophys. Res. Atmos. 2007, 112. [Google Scholar] [CrossRef]
  25. Aires, F.; Miolane, L.; Prigent, C.; Pham, B.; Fluet-Chouinard, E.; Lehner, B.; Papa, F. A Global Dynamic Long-Term Inundation Extent Dataset at High Spatial Resolution Derived through Downscaling of Satellite Observations. J. Hydrometeorol. 2017, 18, 1305–1325. [Google Scholar] [CrossRef]
  26. Pham-Duc, B. Satellite Remote Sensing of the Variability of the Continental Hydrology Cycle in the Lower Mekong Basin over the Last Two Decades. Ph.D. Thesis, Sorbonne University, Paris, France, 2018. [Google Scholar]
  27. Tran, D.D.; Weger, J. Barriers to Implementing Irrigation and Drainage Policies in An Giang Province, Mekong Delta, Vietnam. Irrig. Drain. 2017, 67, 81–95. [Google Scholar] [CrossRef] [Green Version]
  28. Chapman, A.; Darby, S. Evaluating sustainable adaptation strategies for vulnerable mega-deltas using system dynamics modelling: Rice agriculture in the Mekong Delta’s an Giang Province, Vietnam. Sci. Total Environ. 2016, 559, 326–338. [Google Scholar] [CrossRef] [PubMed] [Green Version]
  29. Biggs, D. Breaking from the Colonial Mold: Water Engineering and the Failure of Nation-Building in the Plain of Reeds, Vietnam. Technol. Cult. 2008, 49, 599–623. [Google Scholar] [CrossRef]
  30. Vermote, E. MOD09A1 MODIS Surface Reflectance 8-Day L3 Global 500 m SIN Grid V006, NASA EOSDIS Land Processes DAAC. USGS Report. 2015. Available online: https://lpdaac.usgs.gov/products/mod09a1v006/ (accessed on 19 February 2020).
  31. Jolliffe, I.T. Principal Component Analysis, 2nd ed.; Springer Series in Statistics; Springer: New York, NY, USA, 2002. [Google Scholar]
  32. Von Storch, H.; Zwiers, F.W. Statistical Analysis in Climate Research; Cambridge University Press: Cambridge, UK, 2001. [Google Scholar] [CrossRef] [Green Version]
  33. Piwowar, J.M.; LeDrew, E.F. Principal Components Analysis of Arctic Ice Conditions between 1978 and 1987 as Observed from the SMMR Data Record. Can. J. Remote Sens. 2014, 22, 390–403. [Google Scholar] [CrossRef]
  34. Small, C. Spatiotemporal dimensionality and Time-Space characterization of multitemporal imagery. Remote Sens. Environ. 2012, 124, 793–809. [Google Scholar] [CrossRef] [Green Version]
  35. Sousa, D.; Small, C.; Spalton, A.; Kwarteng, A. Coupled Spatiotemporal Characterization of Monsoon Cloud Cover and Vegetation Phenology. Remote Sens. 2019, 11, 1203. [Google Scholar] [CrossRef] [Green Version]
  36. Piwowar, J.M.; Peddle, D.R.; LeDrew, E.F. Temporal mixture analysis of arctic sea ice imagery: A new approach for monitoring environmental change. Remote Sens. Environ. 1998, 63, 195–207. [Google Scholar] [CrossRef]
  37. Aires, F.; Rossow, W.B.; ChéDin, A. Rotation of EOFs by the Independent Component Analysis: Toward a Solution of the Mixing Problem in the Decomposition of Geophysical Time Series. J. Atmos. Sci. 2002, 59, 111–123. [Google Scholar] [CrossRef]
  38. Rodriguez, E. Surface Water and Ocean Topography Mission (SWOT); Technical Report JPL D-61923; NASA JPL, California Institute of Technology: Pasadena, CA, USA, 2015. [Google Scholar]
Figure 1. Study domain, with the six considered zones (see Table 1). Zone 1 is in blue, zone 2 in green, and zone 3 in yellow. Cambodian zones are in a lighter colour than Vietnamese ones. The Cambodia/Vietnam border is indicated in yellow. This full domain represents 21,618 MODIS pixels (500 m × 500 m).
Remotesensing 12 00800 g001
Figure 2. (A) The floodplain in Kandal province, Cambodia, October 2017; (B) Watering rice fields for recession rice, September 2017, representative of zone 3C; (C) Preparing rice fields for recession rice, November 2017, zone 1C; (D) Dry rice fields in Prey Veng province, Cambodia, May 2018, zone 3C; (E) The PRASAC area under water during a normal flood year, Takeo Province, Cambodia, September 2018, zone 3C; (F) Vegetable fields in Kandal Province, Cambodia, September 2017, zone 2C); (G) An earthen drainage channel in Takeo province, Cambodia, May 2018, zone 3C; (H) A sluice gate in An Giang province, Vietnam, May 2018, zone 2V (Photo credit: Jean-Philippe Venot).
Remotesensing 12 00800 g002
Figure 3. Probability of mixed (left), water (middle), and total = mixed + water (right) pixels, over the 2001–2017 period, over the Lower Mekong Basin. The six zones considered in this study over the Cambodia-Vietnam frontier (Figure 1 and Table 1) are represented in red.
Remotesensing 12 00800 g003
Figure 4. Time series of the total = mixed + water (black), mixed (green), and water (blue) areas (in number of pixels) over the six zones of Figure 1 over Cambodia (left) and Vietnam (right), from 2001 to 2017. The total number of pixels in each zone is also indicated in magenta, it represents the maximum flooding area for each zone. Each pixel is about 500 m × 500 m = 0.25 km2.
Remotesensing 12 00800 g004aRemotesensing 12 00800 g004b
Figure 5. The first four temporal Principal Component Analysis (PCA) base functions of the MODIS inundation associated to the spatial patterns in Figure 6.
Remotesensing 12 00800 g005
Figure 6. The first four spatial Empirical Orthogonal Functions (EOFs) of the MODIS inundation estimates associated to the temporal base functions of Figure 5.
Remotesensing 12 00800 g006
Figure 7. Frequency occurence (0–1) maps where 0 means never in a given state (mixed, water or total) and 1 means always in that given state, during the 2001–2005 (left column) and the 2012–2016 (right column) periods. From top to bottom, for mixed, water and total pixels.
Remotesensing 12 00800 g007
Figure 8. Season of the mixed (green), water (blue), and total (black) seasons for years 2001–2005 (continuous line) and years 2012–2016 (dashed line). These seasons are represented over the three zones in Cambodia (top row: 1C, 2C, 3C) and over the three zones in Vietnam (bottom row: 1V, 2V, 3V).
Remotesensing 12 00800 g008
Table 1. Description of the six zones of Figure 1, over Cambodia (top) and Vietnam (bottom). Each pixel is about 500 m × 500 m = 0.25 km2.
Zone IdNameNb PixelsCharacteristics
CAMBODIA9972
1CTakeo2283Large scale drainage network/Pumping/Double crop
2CKandal1422Former Pol Pot irrigation system/Single crop
3CPrey Veng6267Single rice crop/Little water control/Heterogeneous
VIETNAM11,646
1VLong Xuyen Quadrangle1787Majority of high dykes
2VVam Nao Water Control project2727Full water control (dykes and sluice gates)
3VPlain of Reeds7132Majority of low dykes
TOTAL21,618

