Article

Sustainable Hydroelectric Dam Management in the Context of Climate Change: Case of the Taabo Dam in Côte D’Ivoire, West Africa

by
Eric Mensah Mortey
1,*,
Kouakou Lazare Kouassi
2,
Arona Diedhiou
1,3,
Sandrine Anquetin
4,
Mathieu Genoud
5,
Benoit Hingray
4 and
Didier Guy Marcel Kouame
6
1
LAPAMF-African Centre of Excellence on Climate Change, Biodiversity and Sustainable Development, Université Félix Houphouët Boigny, 22 B.P. 582 Abidjan 22, Côte D’Ivoire
2
UFR-Environnement, Université Jean Lorougnon GUEDE, BP 150 Daloa, Côte D’Ivoire
3
Univ. Grenoble Alpes, IRD, CNRS, Grenoble INP Institute of Engineering University Grenoble Alpes, IGE, 38000 Grenoble, France
4
Univ. Grenoble Alpes, CNRS, IRD, Grenoble INP Institute of Engineering University Grenoble Alpes, IGE, 38000 Grenoble, France
5
Ecole Centrale de Lyon, 36 Avenue Guy de Collongue, 69134 Lyon, France
6
Ivory Coast National Company of Electricity (CIE), 01 BP 6923 Abidjan 01, Côte D’Ivoire
*
Author to whom correspondence should be addressed.
Sustainability 2019, 11(18), 4846; https://doi.org/10.3390/su11184846
Submission received: 8 August 2019 / Revised: 26 August 2019 / Accepted: 29 August 2019 / Published: 5 September 2019
(This article belongs to the Section Energy Sustainability)

Abstract

:
Management of hydroelectric dams is an aspect of sustainability that comes with resolving problems locally. The use of global indicators has not been a sustainable solution, thus the need for local indicators. Besides, current sustainability assessment tools lack the integration of climate, making assessments in a climate change context impossible. In this paper, we present management and sustainability assessment in a climate change context using sustainability indicators. We modeled a change in the climate using normal, moderate, and extreme climate conditions defined by Standardized Precipitation Indices (SPI) values. Out of 36 years analyzed, 24 years fall in the near-normal climate regime, and the remaining 12 years in moderate and extreme conditions, making near-normal climate regime the basis for managing the Taabo Dam. The impact of climate, techno-economic, and socio-environmental indicators on sustainability were investigated, and the results were analyzed according to scenarios. Climate adaptation shows higher sustainability indices than techno-economic and socio-environmental scenarios. Probability matrices show high and low values, respectively, for environmental and flooding indicators. Risk matrices, on the other hand, show that even with small probability values, risks still exist, and such small probabilities should not be taken as an absence of risk. The study reveals that sustainability can be improved by integrating climate into existing assessment methods.

1. Introduction

Sustainable development has a long-standing history, developed by a variety of disciplines. Since the 1972 UN Conference on the Environment, Stockholm, the meaning of “sustainable development” has evolved with emphasis was on “slow down growth and protect the environment” (ecodevelopment) [1]. The term sustainable development was coined for the first time in an international document World Conservation Strategy, published by the International Union for the Conservation of Natural Resources in 1980 [2]. However, this document did not provide a scientific definition of sustainable development. The sustainable development idea made international advancement when the Report of the United Nations’ World Commission on Environment and Development (WCED), Our Common Future, was published in 1987 [3,4]. Commonly known as the Brundtland Report, it defines sustainable development as, “development that meets the needs of the present generation without compromising the ability of the future generation to meet their own needs” [5,6,7,8]. From Stockholm to WCED (1972–1987), sustainability discussion was mainly by the scientific community and NGOs and defined merely by any economic development conducted without the depletion of natural resources [1]. In 1992 and 2002, the Earth Summit, Rio, and World Summit on Sustainable Development, Johannesburg, were major events that continued the discussions on sustainable development [1,8]. By this period, governments became actively involved. Within the same period, corporate social responsibility, which involves corporations, investors, consumers, and bankers trying to integrate the social, economic, and environmental performance of all matter came on the scene. By this time, social, economic, and environmental became pillars for defining sustainable development in general [3,9,10]. On 16 November 2000, the World Commission on Dams (WCD) recommended “sustainability” as one of the five basic standards necessary to address environmental and social impacts of dams [11]. In 2010, the International Hydropower Association (IHA) published the Hydropower Sustainability Assessment Protocol (HSAP), as guidelines for hydroelectric dam assessment using social, economic, environmental, and technical criteria [12]. Similarly, the Rapid Basin-wide Sustainability Assessment Tool (RSAT) was drafted for the Mekong region to assess hydropower in a basin-wide context, based on Integrated Water Resource Management (IWRM) principles [13,14] and social, economic, and environmental criteria [15]. Thus, the HSAP was among the first to introduce the technical criteria for hydropower sustainability assessment, criteria missing from the general pillars of sustainable development. Since then, the social, economic, environmental, and technical criteria have been used for hydropower sustainability assessment. The HSAP method also adopted the use of sub-criteria or indicators [12] to enhance its sustainability assessment method. Since then, indicators have been used to assess hydroelectric dams. Kumar and Katoch, 2014 [16], compiled a list of indicators that may be of use for policymakers and designers while planning Run-of-River (RoR) projects in hydro rich regions of India and similar regions throughout the world. Calabria, Camanho, and Zanella, 2018 [17], made use of composite indicators to evaluate the performance of 78% installed capacity Brazilian hydropower plants. Some studies have used a multi-criteria analysis approach to perform a quality assessment for hydroelectric schemes [18,19]. Thus, the use of indicators, both quantitative and qualitative, for hydropower sustainability assessment has increased over the last few years. A major step in sustainability assessment is the choice of criteria and indicators to use in the assessment. Defined as results obtained after processing and interpretation of primary data [20], indicators must be Specific, Measurable, Achievable, Relevant, and Time-bound (SMART) [16,21,22]. For hydropower sustainability, the HSAP and RSAT are good advancements toward developing hydropower assessment methods, especially for different stages of a hydropower project. With the introduction of the Sustainability Development Goals (SDGs), however, the emphasis is shifting from non-renewables, including large hydro to clean sources. As a result, the main concern currently, and in the future, will be to keep existing hydroelectric dams and reduce the environmental impacts associated with their operation. Management and monitoring have thus become a key sustainability issue for existing hydroelectric plants globally. Under this scenario, the state-of-the-art in managing hydroelectric dams needs indicators that vary with time, so they can serve as limits to decide when hydroelectric schemes have adverse environmental impacts. The approach will help monitor the relationship between a dam and its environment and evaluate thresholds for which dams pose threats to their environment. Indicators developed in this manner can also measure local impacts—a key weakness and gap in existing hydropower sustainability assessment tools. Another challenge is the impacts of climate change on available water and its effects on hydropower production in the future. To this end, the link between climate, water, and energy has become a key subject of research globally, referred to as climate-water-energy nexus. In West Africa, many studies have been done to evaluate the impacts of climate change on future water availability [23,24,25,26,27]. While some studies present severe decrease of water available [26,28], others suggest less severe decrease [29], some other are uncertain about future water availability [30], and some even predict an increase [23,25]. Beside these uncertainties, it is factual that rainfall and temperature will continue to impact hydroelectric dam production, so long as the dams exist. The basic problem of a hydroelectric dam operation is that these climate variables cannot be manipulated to benefit hydropower production. The only choice left is to manage the hydroelectric schemes to suit the climate, its impact, and future changes. To achieve this, assessment of a hydroelectric dam’s sustainability, within the context of climate, is most important, while managing synergies and trade-offs of social, economic, environmental, technical, and resource indicators. In this paper, we integrate climate into hydropower sustainability while preserving existing criteria in the global assessment tools. Also, we develop local indicators that can incorporate interactions of a local dam (Taabo) and its environment to aid effective management and monitoring of the dam. We are optimistic the approach is easily transferable to other hydroelectric plants, according to site-specific needs. Most importantly, current existing hydropower sustainability assessment tools can use this approach to integrate climate into their frameworks.

2. Study Area

The Bandama Basin is a major river basin between 3°50′ and 7°00′ W and 5°00′ and 10°20′ N in Côte d’Ivoire, West Africa (Figure 1) [31]. It covers a total area of about 98,863 km2 and consist of three major sub-basins: white Bandama (31,860 km2), N’zi (38,312 km2), and Marahoué (28,691 km2). The topography is mostly flat, with a maximum elevation of 809m above sea level. The vegetation cover of the Bandama Basin varies from savannahs in the north to forests toward the south. Three climate regimes influence the Bandama Basin. The northern part is characterized by a dry sub-tropical climate (between 1000 mm and 1700 mm) [32], which has a unimodal rainfall distribution or pattern, with distinct wet (rainy) and dry seasons. The central and southern parts of the basin are characterized by two rainy seasons. In the equatorial climate, the annual rainfall is greater than 1500 mm [32]. Rainfall amount is higher in the humid equatorial climate, with a yearly mean of 1800 mm. On the main Bandama River, the Kossou and Taabo Dams were constructed, forming artificial lakes. The Kossou lake formed after building the dam in 1971. The lake has a length, area, and an estimated volume of 150 km, 1855 km2 and 28.8 × 10⁹ m3, respectively, at full capacity [33,34]. The Taboo lake is 120 km downstream of the Kossou Dam, formed later in 1975 after the construction of the dam (Figure 1). The area and stock volume of the Taabo Lake are about 69 km2 and stocks and 630 × 106 m3, respectively [33,34,35]. The Taabo Dam catchment area is about 59,506.66 km2, in which 2975.33 km2 (about 0.05%) is located in Mali. The Kossou Dam catchment area is a subset of the Taabo Dam catchment, and as a result, the two dams interact with each other. The Taabo Dam water regime is determined by alternating wet and dry seasons, streamflow from Marahoué, and discharges from Kossou Dam. Discharge from Taabo and streamflow from N’zi river contribute to the streamflow at Bafecao, which drains gradually into the Gulf of Guinea. The main purpose of the hydroelectric dams is electricity production.

Identification of Energy System to Be Assessed

In this paper, we use the Taabo Hydroelectric Dam in Côte d’Ivoire, West Africa, as a case study. The choice of the dam is because of data available for the research, coupled with the urgent need of management to adapt the dam to extreme climate events such as flooding.

3. Materials and Methods

The framework for sustainable management of the Taabo Hydroelectric Dam in the context of climate change is shown in Figure 2 below. It consists of a sequence of eight steps, which includes (1) selection or creation of indicators; (2) estimation of initial value of each indicator ( q i ) , their thresholds values ( τ ) and impact values ( q imp = q i τ ) ; (3) computation of probability ( P i ) or expectation value associated with each indicator; (4) determination of the risk associated with each indicator; (5) normalization of indicators ( q n ) ; (6) estimation of weight coefficient values ( w ) of indicators; (7) sensitivity analysis of the general sustainability index (GSI) to individual indicators; and (8) scenario-based analysis of options for sustainable management of the Taabo Hydroelectric Dam. We used a total number of 15 indicators with each indicator value estimated at six (6) different climate regimes, forming an initial matrix of six climate regimes by 15 indicator values (Table 3). A threshold matrix (Table 4), was derived based on threshold values of each indicator, irrespective of the climate regime, resulting in a row matrix of 15 indicator threshold values (Table 4). An impact matrix (Table 5) and a probability matrix (Table 6) were derived based on the impact and probability values of the indicators. Indicators were numbered with a subscript 1 to 15 with q 1 i ,   P 1 ,   τ 1 ,   q 1 imp   =   ( q 1 i τ 1 ) ,   q 1 n ,   w 1   and   w 1 q 1 n (Figure 2) representing initial, probability, threshold, impact, normalized, weight coefficient, and the single preference index values, respectively of indicator 1, and so on. We obtained a risk matrix as a product of the impact matrix (Table 5) and the probability matrix (Table 6). Probability, impact, and risk matrices formed our basis for defining a management framework for the Taabo Dam (Figure 2). We evaluate the contribution of each indicator ( w i q i n ) , on general sustainability index ( i = 1 i = n w i q in ) by looking at the resultant GSI value obtained when the indicator in question is given the highest priority (sensitivity test—Figure 2). Alternatively, we define specific scenarios depending on the actors and interests involved and compute a resultant GSI value (scenario-based assessment—Figure 2). The sensitivity test described above and scenario-based assessment formed our basis for evaluating sustainability (sustainability assessment) of the Taabo Hydroelectric Dam (Figure 2). The entire methodology for this work is summarized in Figure 2 and described in detail from Section 3.1, Section 3.2, Section 3.3, Section 3.4, Section 3.5, Section 3.6, Section 3.7 and Section 3.8 below.

3.1. Selection or Creation of Indicators

Indicators were selected based on the Specific, Measurable, Achievable, Reliable, and Time-bound (SMART) criteria as recommended by [20,36]. To ensure indicators replicate local conditions and are useful for managing and monitoring the dam, they were derived from historical data of the dam’s environment, hydrology, and production. Besides, environmental concerns were considered during the creation of indicators to adapt the dam to current environmental conditions. Climate and hydrological drought indices were used to include the impacts of climate and hydrology impacts in the assessment. To ensure the final scheme monitor changes as the climate evolves, we compute indicators according to climate regimes. The final set of indicators, their probabilities, thresholds and impact values are presented below.

3.1.1. Drought Indicators

The Standardized Precipitation Index (SPI) and the Standardized Streamflow Index (SSI) were used to integrate climatic and hydrological aspects of drought into the assessment. Drought, as used here, refers to both dry and wet conditions.

Standardized Precipitation Index (SPI)

The procedure for calculating SPI is well documented [37] and is realized in many software applications. For this work, we use the DrinC software [38] to estimate 12-month non-running SPI and the SPI package in R to estimate 12-month running SPI values. Non-running 12-month SPI values were used to group years of similar SPI category into the same class. Categorization was based on SPI classification shown in Table 1, and climate regimes realized from the classification are shown in Table 2.
For each climate regime, we compute an initial SPI12 value, representative of the climate regime. Then we set a threshold and define the impact as:
SP I imp   =   SPI i SP I thresh
where SPIimp, SPIi, and SPIthresh are the impact, initial and threshold values, respectively, of SPI12. To preserve the original interpretation of the SPI, we take the threshold in equation 1 to be zero, so the SPI value at any instance equals the impact SPI.
SP I i   =   SPI imp

Standardized Streamflow Index (SSI)

The Standardized Stream Index (SSI) was derived using the same method as the SPI but is, however, based on streamflow data. Similarly, a zero was chosen as the threshold to preserve the original interpretation of the SSI. Thus, the SSI at an instance i, in time, equals the impact SSI.
SS I i = SSI imp

3.1.2. Environmental Indicators

Power density (PD), Global Warming Potential (GWP), and Area indicator (AR) are global indicators used to assess the environmental impacts of energy systems. In this paper, we used them to account for both positive and negative impacts of the Taabo Dam on the environment.

Power Density

The power density (PD) is an environmental index which measures the environmental impact of a hydroelectric dam. It is defined by the ratio of installed capacity to area inundated by a hydroelectric dam [19,39,40]. We define the power density at an instance i, in time, is given by
P D i   =   Installed   capacity ( W ) Reservoir   coverage i ( m 2 )
We define a threshold PD, as the value of PD which corresponds to the maximum coverage area of the reservoir, above which adverse environmental impacts will be experienced. The Taabo Dam covers 80 km2 at the maximum operating level of 125 m [41]. Thus,
P D thresh =   210   MW 80   km 2 2.625   W / m 2
The impact PD at any instance i, in time, is defined by a value of the instantaneous PD above or below the threshold PD and is given by
P D imp   =   PD i P D thresh

Global Warming Potential (GWP)

The GWP accounts for the contribution of a reservoir to global warming and is important, especially in present times, where the emphasis is on clean energy. At any instance i, in time, of the reservoir’s life, emission was estimated in kg CO2-eq using the IPCC methodology for estimating land converted permanently to flooded land. The GWP was obtained by dividing the emissions by production in kWh, with units in kg CO2-eq/kWh. The Intergovernmental Panel on Climate Change (IPCC), 2006 [42] presents the method in detail. The threshold value of GWPthresh was taken as 1 (GWP of reference CO2). The impact GWP is the value below or above the GWPthresh, calculated as
GWPimp = GWPi − GWPthresh

Area Indicator (AR)

Area indicator evaluates the value of land for power production. We estimate AR at any instance i as:
A R i =   Area   coverage   by   reservoir   ( km 2 ) Power   produced   ( MWh )
AR was computed by dividing the area covered by the reservoir at any instance i, in time, with energy produced in MWh at the same time. The threshold value of AR was taken as the long-term mean of all A R i values, found to be 1.8751. The impact AR was then estimated as:
A R imp = A R i A R thresh

3.1.3. Hydrological Indicators

Hydrological indicators were used to integrate local flows into the assessment. Upstream flows have impacts on hydropower production, and the presence dams alter flows available to downstream. To effectively represent all forms of flows and impact, we categorized hydrological indicators into two—resource indicators and flow impact indicators. Resource indicators were used to assess water available for hydropower production and the impact of hydropower production on water available to downstream.

Available Water for Hydropower Production (AWP)

Available water for hydropower production was calculated as the difference between streamflow into the reservoir and discharge out of the dam. Thus, at any instance i,
A W P i =   Streamflow   into   reservoir i     Discharge   out   of   Dam i
The threshold AWP was taken as the long-term mean of all AWP, numerically equal to 2.62 m3/s. The impact AWP is the value of the instantaneous AWP, above or below the AWPthresh.
AW P imp   =   AWP i     AWP thresh

Available Water for Downstream (AWD)

Available water for downstream was determined as a fraction of water discharge from the dam which is measured at a hydrologic station at Bafecao (Figure 1), downstream of the Taabo Dam. That is,
AW D i =   Discharge   from   Dam i   ( m 3 / s ) Streamflow   at   Downstream i   ( m 3 / s )
The AWDthresh is taken as the long-term mean of all AWDi, calculated as 0.83. The AWDimp was calculated as the difference between AWDi and AWDthresh. Thus,
AW D imp = AWD i     AWD thresh
Taabo Dam’s streamflow is determined by two sources, a natural source (Marahoue or Red Bandama), and artificial flow from Kossou Dam (discharge). The impacts of streamflow from the Marahoue and Kossou Dams are modeled using the flow impact indicators.

Impact of Natural Flow (INF)

We estimate the impact of natural flow as the fraction of streamflow measured at a hydrological station at Bouafle located on the Red Bandama (Figure 1) to streamflow into the dam.
IN F i = Natural   flow   from   upstream i   ( m 3 / s ) Streamflow   into   the   Taabo   Dam i   ( m 3 / s )
The threshold value was taken as the long-term mean, calculated as 0.464. The impact INF is the value of the instantaneous INF above or below the long-term mean, calculated as:
IN F imp = IN F i   INF thresh

Impact of Artificial Flow (IAF)

The artificial flow was computed as a ratio of discharge from upstream (Kossou Dam) to streamflow measured at the Taabo Dam.
IA F i = Artificial   flow / Discharge   from   Kossou   Dam i   ( m 3 / s ) Streamflow   into   Taabo   Dam i   ( m 3 / s )
The threshold value of IAF is the long-term mean of all instantaneous IAF estimated as 0.55. The impact of IAF was calculated as:
IA F imp   =   IAF i     IAF thresh

3.1.4. Flooding Indicators

Flooding of hydroelectric dams and surrounding towns has become a problem in recent times throughout Ivory Coast. According to [43], flooding is not a serious problem in Ivory Coast. Recent experiences of flooding in hydroelectric dams and surrounding cities call for the inclusion of flooding indicators in this work. To build indicators for flooding, we hypothesize that spillage is a primary indication of flooding, which is true in practice. We identified three potential sources of flooding of the Taabo Dam and environment as (1) natural flow from Bouafle, (2) artificial flow from Kossou, and (3) Taabo reservoir storage. To examine flooding in more detail, we estimate flooding risk associated with natural flow (FNF), artificial flows (FAF) and reservoir initial storage (FIS). We identify months on which Taabo Dam spilled and computed the contribution of natural and artificial flows to flow into the reservoir.

Flooding due to Natural Flow (FNF)

Streamflow measured at Bouafle (Figure 1) is the main source of natural flow into the Taabo Lake, as such FNF is estimated as:
FN F i =   Volumetric   Streamflow   ( Bouafle ) Volumetric   streamflow   into   Reservoir   ( Taabo )
The threshold value FNF is the long-term average of all FNFi which is estimated as 0.25243. We compute the impact FNF as:
FN F imp = FN F i FN F thresh

Flooding Due to Artificial Flow (FAF)

Kossou Dam is the source of artificial flows into Taabo Lake, so we estimate FAF using
FA F i =   Volumetric   Discharge   Upstream   ( Kossou ) Volumetric   streamflow   into   Reservoir   ( Taabo )
The threshold FAF is the average value of all FAFi for the study period, estimated as 0.00499. The impact FAF is the value of the instantaneous FAF above or below the threshold value mathematically expressed as:
FA F imp   =   FAF i     FAF thresh

Flooding Due to Initial Storage (FIS)

As indicated earlier, there are three possible causes of flooding of the Taabo Dam and environs: (1) streamflow from Bouafle, (2) discharge from the Kossou Dam, and (3) initial storage of Taabo Dam. To estimate FIS, we note that the fractional contribution of these three sources to flooding should sum up to 1. Thus, flooding due to initial storage was estimated as:
FI S i = 1     ( FNF i   +   FAF i )
FIS threshold is the long-term mean of all FISi values for the study period, numerically equal to 0.74257. The impact of FIS is estimated as the difference between the FISi and FISthresh. Thus,
FI S imp = FI S i FI S thresh

3.1.5. Techno-Economic Indicators

Techno-economic indicators were used to incorporate the technical and economic benefits of the Taabo Hydroelectric Dam into the assessment. Contribution to National Grid (CNG), Equivalent Availability Factor (EAF), and Hydraulic Index (HI), were used to quantify techno-economic impacts.

Contribution to National Grid (CNG)

Contribution to National Grid is defined as the contribution of Taabo Hydroelectric Dam to the grid, compared to total contribution into the grid, expressed by [19] as:
%   CN G Taabo   =   CN G Taabo CN G Total ×   100  
The threshold CNG is the ratio of Taabo installed capacity to the total grid installed capacity as of 2017, calculated as:
CN G thresh =   210   MW 1886   MW   ×   100 %   11.135 %
The impact CNG at any instance i, in time, is calculated as
CN G imp   =   CNG i     CNG thresh

Equivalent Availability Factor (EAF)

We use EAF to estimate the availability of the Taabo Hydroelectric Dam for power production, taking into account the reliability of generation units [19,44]. The EAF for a specific period i, in time, was estimated using the following equation:
EA F i   =   Energy   generated i   ( MWh ) Peak   capacity   ( MW )   ×   time i   ( h / period )
Threshold EAF was estimated as the fraction of the generation potential of Taabo Dam that could be realized assuming it is operated to full capacity throughout a specific year.
EA F thresh   =   1050000   MWh 210   MW   ×   365   ×   24 h 0.5708
The impact EAF was calculated as the value of the EAFi above or below the threshold value. Thus,
EA F imp =   EAF i     EAF thresh

Hydraulic Index (HI)

We obtain hydraulic indices values from the Taabo Dam and compute the mean values. The threshold value of HI is the long-term average of all hydraulic index values, numerically equal to 0.85. The impact HI is the difference between the HIi and HIthresh.
H I imp = H I i H I thresh
For the indicators above to measure the sustainability of a hydroelectric dam, it is required that they reflect social, economic, environmental, and technical aspects. For this reason, the indicators were diligently selected to capture important social, economic, environmental, and technical sustainability issues directly impacting the Taabo Dam and environment. For example, the resource indicator AWD was carefully selected to assess the impact of downstream flow, which has some social consequences as well. Similarly, flooding indicators were carefully designed to capture both managerial concerns and social impacts. All other indicators were selected to assess current and recent concerns for effective management of the dam. We now look at occurrence frequencies (probability values) and risk associated with each indicator under all climate regimes.

3.1.6. Indicator’s Probability and Risk Formulation

Probability matrices give an idea of the likelihood, probability, probability of occurrence, or occurrence frequency of indicators. They are useful in the formation or creation of risk matrices. Challenges often arise in computing and interpreting probabilities values for different indicators measured on different scales. To overcome this limitation, we ensured that all indicators were derived from quantitative monthly data for the period (1981–2017). Besides, the classification of risk probability was done such that all indicators within a specific climate regime have the same sample space. What distinguishes one indicator from another is the occurrence frequencies (events). Thus, for indicator i, which occurs x (events) number of months in S total number months (sample space), we compute the probability as
P I = n ( x ) n ( S )
For each indicator, a specific probability rule is applied to derive its value. To ensure that the probability of an indicator in a specific climate regime is unique, we compute the occurrence frequency of the climate regime in 36 years (values in Figure 4b). Thus, if the indicator i, is found in a climate regime c, which occurs z years in Z total number of years, the probability of the climate regime occurring is
P c = n ( z ) n ( Z )
We finally obtain the climatological mean probability Pcm of indicator i by multiplying the two probabilities Equations (31) and (32).
P cm = P ic P c
A project risk is defined as “an uncertain event or condition that, if it occurs, has a positive or negative effect on a project’s objectives” [45]. A more standard definition of risk is “risk is the chance, in quantitative terms, of a defined hazard occurring” [46]. We express it mathematically as
R = P × I
where R is the risk or risk score, P is the probability/likelihood/occurrence frequency/probability of occurrence, and I is the impact/consequences/severity [46,47,48,49]. Risk matrices developed using categorical data can produce ambiguous output that is difficult to interpret. They also lead to assigning higher qualitative ratings to quantitatively smaller risks among other factors. To avoid this, both the probability and impact component of risk used in this work are quantitative measures. Categorization of risk level is also based on climate regimes, defined by the SPI values, which can be interpreted numerically according to the degree of wetness or dryness. To overcome the problem of poor resolution that can result from assigning identical values to quantitatively different risk, we normalized all indicators such that, the risk of one indicator can be compared directly to the risk of another indicator in the same or different climate regime. Finally, we use different color schemes for positive and negative risks. We compute normalized risks based on probability of indicators in a climate regime and the climatological mean probability (Figure 4).

3.2. Estimation of Initial Indicator Values, Their Thresholds, and Impact Values

Initial indicator values obtained from preprocessing of data on dams’ environment, hydrology and production are shown in Table 3.
The threshold values (Table 4) of the initial indicators are values above or below the initial indicator values (Table 3) for which a specific impact will be experienced. They are obtained as part of results from Equations (1)–(30), are given in Table 4, below.
Similarly, the impact associated with indicators in Table 3 above are obtained as part of results from equations (1)–(30) and shown in Table 5 below.

3.3. Computation of Probability or Expectation Associated with the Initial Indicator Values

For each indicator in all climate regimes, we estimate the probability (frequency of occurrence) and compute the average value of all non-zero probabilities. Where an indicator is derived from more than one dataset, dependent on each other, the total probability associated with the indicator is a product of the individual probabilities associated with the datasets. The resultant probability matrix or expectation matrix is shown in Table 6.
The probability of each indicator in 36 years (1981–2017) was also estimated as the product of the probability in a climate regime (Table 6—using Equation (31)) and the probability of that climate regime occurring in 36 years (Equation (32)). We refer to this probability as the climatological mean probability.

3.4. Determination of the risk associated with each indicator

We define a risk matrix as the product of the impact matrix (Table 5) and the probability matrix (Table 6). We derived a normalized risk matrix from the risk matrix as the value of the risk matrix on a normalized scale (0 to 1). The risk matrix and the normalized risk matrix are shown in Table 7 and Table 8 below.
The normalized risk matrix allows us to represent the different risk (Table 7) on the same scale for easy interpretation. We now present how we achieve normalization everywhere in this work.

3.5. Normalization of Indicators ( q n )

We achieve normalization through a mathematical expression that uses a membership function q i ( x i ) for each indicator x i . For each indicator x i we determine the maximum max ( x i ) and minimum min ( x i ) value and analyze if the function q i ( x i ) increase or decrease with the increased value of x i on the interval [ min ( x i ) , max ( x i ) ] . If the membership function q ( x i ) increase with increasing value of indicator x i , we use an increasing power normalization function given by:
q i = q i ( x i ) = { 0 if   x i     MIN i x i M I N i M A X i M I N i if   MIN i   <   x i     MAX i 1   if   x i   >   MAX i
However, if the membership function q ( x ) decreases with increasing value of indicator x i , we use the decreasing power normalization function expressed as:
q i = q i ( x i ) = { 1 if   x i     MIN i MAX i x i MAX i MIN i if   MIN i   <   x i     MAX i 0   if   x i   >   MAX i
In practice, we examined each indicator to see if it has a positive or negative impact according to managerial or sustainability expectations. If indicator value increases with increasing sustainability (positive impact), the increasing membership function is applied to normalize the indicator. On the other hand, if the indicator value decreases with increasing sustainability (negative impact), the decreasing power normalization function is applied to normalize that indicator. For this work, all flooding indicators (FAF, FNF, FIS) have negative impacts on managerial interest (sustainability), as such, the decreasing normalization function is applied to them. Conversely, drought, water resource, and technical indicator values (SPI, SSI, AWP, AWD, NF, AF) have positive impacts as their values increases (increasing sustainability), so the increasing power normalization function is used to normalize them. For environmental indicators, PD increase with increasing sustainability, while GWP and AR decrease with increasing sustainability, hence the increasing and decreasing normalization functions were applied, respectively.

3.6. Estimation of Weight Coefficient ( w n )

DSS APIS, which is a modification of certified DSS ASPID-3W, was used to generate weight coefficients for indicators based on non-numeric weighting information. APIS can estimate weight using non-numeric, non-exact, and non-complete (NNN) information [50,51,52]. This approach is important because information obtained about the weight of indicators is non-numeric, but their magnitude can be compared using a non-numeric language. APIS accepts the non-numeric language in the form of a comparative proposition between the indicators. Thus a < b, is used to specify that indicator “a” is less than indicator “b” and a = b is used to specify that indicator “a” is equal to indicator “b.” APIS is then able to provide a numeric estimate for weight based on user input information about the weight of indicators.
In Section 3.7, we considered how the general sustainability index (quality assessment index or sustainability index) responds to each indicator used in the assessment. In Section 3.8, however, we consider three sustainability scenarios for the development of Taabo Dam and proposed a fourth one. In each case, weighting information is input by the authors and APIS generates numeric estimates of weights based on authors’ weighting information.

3.7. Sensitivity Analysis of General Sustainability Index (GSI)

In this case, priority is given to one indicator at a time, with all other indicators having the same weight, and the resultant GSI (quality assessment) is determined. For instance,
SPI > SSI = PD = GWP = AR = AWD = INF = IAF = FNF = FAS = FIS = CNG = EAF = HI
APIS generate numeric estimates of the input non-numeric information and also compute the GSI value [19]. Thus, the quality of each indicator is determined by the resultant GSI value obtained when it is prioritized all other indicators.

3.8. Sustainability Scenarios for Management of the Taabo Dam

Four scenarios are considered here for management of the Taabo Hydroelectric Dam according to actors and priorities set. These are (1) techno-economic scenario or pathway, (2) environmental and social activist scenario or pathway, (3) adaptation to climate scenario or pathway, and (4) proposed scenario or pathway.

3.8.1. Case 1. Techno-Economic Pathway—Business as Usual

In the business as usual pathway, priority is given to technical and economic aspects with little or no focus on environmental, social, economic, resource, and climate. The non-numeric weighting information used is
CNG = EAF = HI = INF = IAF > SPI = SSI = PD = GWP = AR = AWP = AWD = FNF = FAF = FIS

3.8.2. Case 2. Environmentalist and Socialist Pathway

To environmentalists and human right activist, social and environmental aspects are paramount and should be protected during the planning, construction and operation stages of dams. Dams, in this case, are perceived to significantly alter the natural environment with some positive and negative impacts. We model this scenario using the non-numeric input weight information
PD = GWP = AR = AWD > FAF = FIS > SPI = SSI = AWP = INF = IAF = FNF = CNG = EAF = HI

3.8.3. Case 3. Adaptation to Climate Pathway—Climate-Smart

In this scenario, priority is given to trends in the climate to adapt the hydroelectric dam to current climate conditions. The NNN information specified is:
SPI = SSI > PD = GWP = AR = AWP = AWD = INF = IAF = FNF = FAF = FIS = CNG = EAF = HI

3.8.4. Case 4. Proposed Pathway—Authors Recommendation

In this case, priority is given to trends in climate to adapt the dam to recent climate conditions. Besides, there is a comparative weighting of options that will optimally benefit hydropower production, as well as reduce impacts on the environment. This case model compromises that actors pursuing cases 1–3 will have to make to a sustainable energy future. The weighting information used is:
SPI = SSI > EAF = CNG > IAF
Also, we set preference for climate regimes as
Extremely   dry   <   Severely   dry   <   Moderately   dry   <   Near   Normal   <   Moderately   wet   <   Very   wet

4. Results and Discussion

We present this part in five (5) sections, namely (1) analysis of standardized precipitation and streamflow indices, (2) analysis of the probability matrices, (3) analysis of risk matrices, (4) sensitivity analysis of Taabo Dam indicators, and (5) sustainable development options for the Taabo Dam.

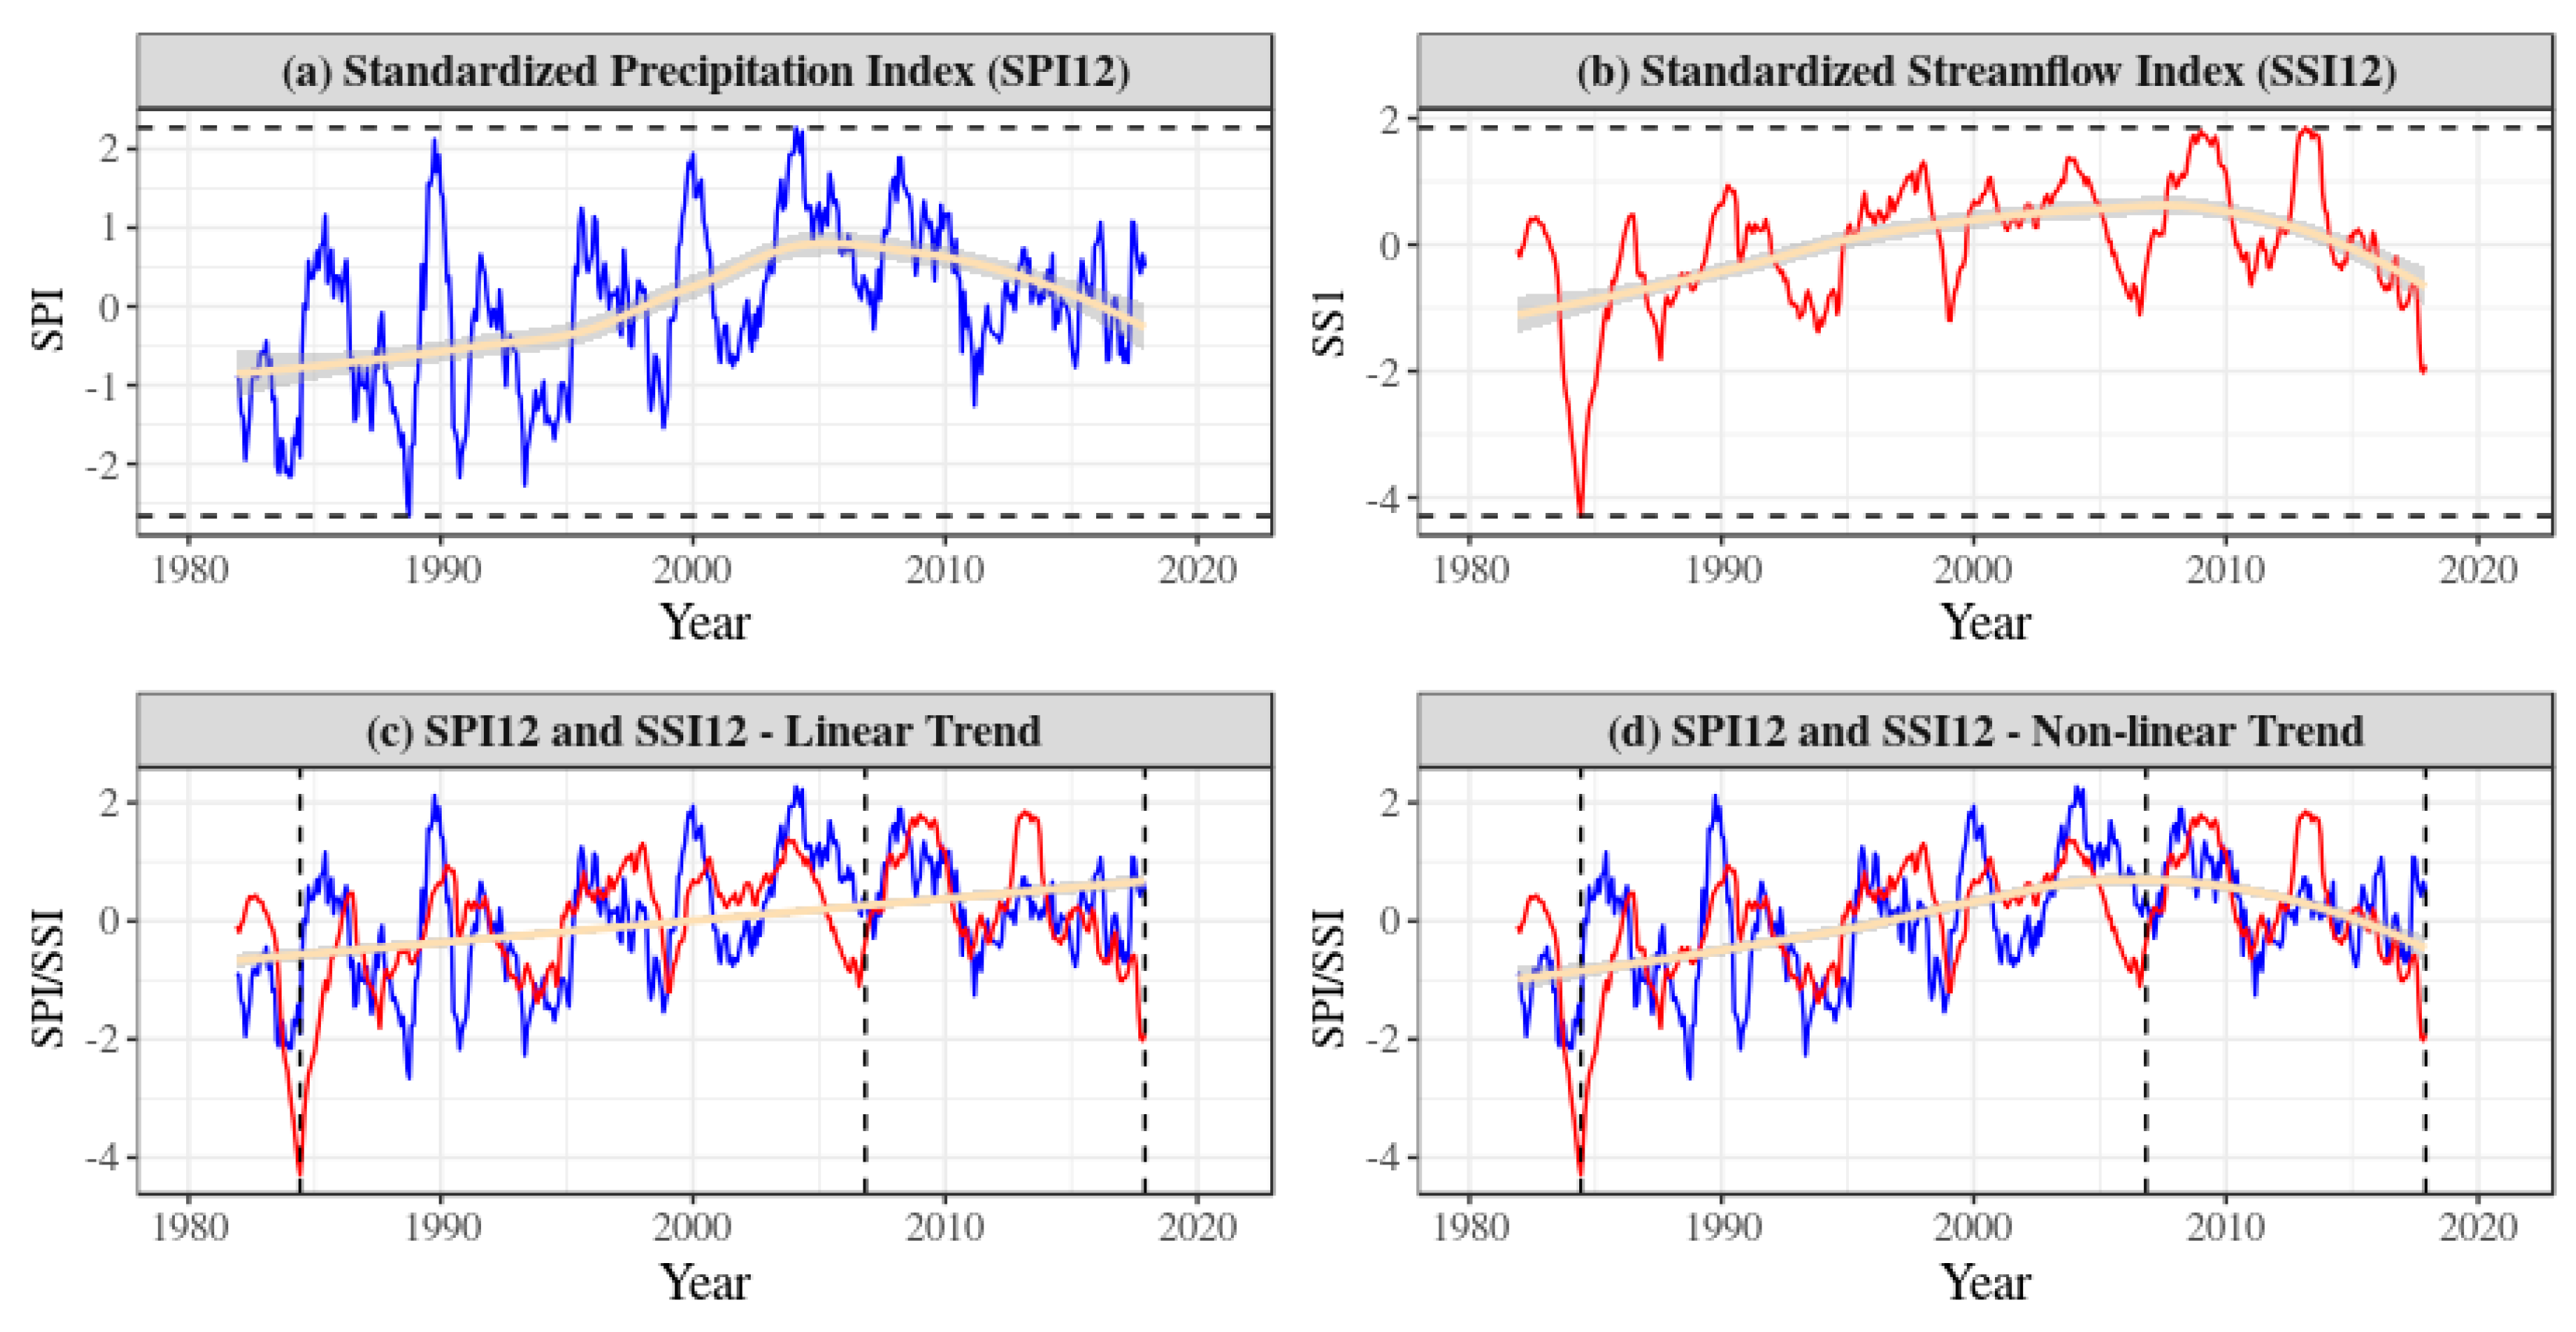
4.1. Analysis of Standardized Precipitation and Streamflow Indices

Figure 3a,b shows the evolution of the 12-month Standardized Precipitation Index (in blue) and 12-month Standardized Streamflow Index (in red) from 1981 to 2017. We will refer to the precipitation and streamflow indices hereafter as SPI12 and SSI12, respectively. Figure 3c,d are comparisons between SPI12 and SS12 with a linear and non-linear trend, respectively.
From Figure 3a, the maximum and minimum SPI12 values recorded for the period (1981–2017) are 2.27 and −2.66 respectively, suggesting extremely dry and wet conditions. The SPI and SSI in Figure 3c,d suggest that a general increase in precipitation leads to a corresponding increase in streamflow and vice versa, for the entire period. However, the link between SPI and SSI is nonlinear. The famous drought period of the early 1980s in West Africa is also captured more prominently by SSI than the SPI. For most of the period (1981–2007), the SSI values show seasonal lags to SPI values, suggesting streamflow to some extent is determined by rainfall. After 2007, however, SPI and SSI match closely for most of the period, showing streamflow is responding quickly to rainfall in recent times. This could be attributed to climate change impacts and land use and land cover changes in the Bandama basin. In general, climate change and land use and land cover change play significant roles [26,27,29,53,54] to water availability. However, studies that distinguish the impact of climate change and land use and land cover changes or the combined effect of the two are limited. Climate change impacts on hydrological resources are often done using baseline conditions to simulate changes in the future. Mostly, the land surface model used consists of one year of historical data which is kept constant throughout the simulation to reduce computation time and resources needed. By so doing, the dynamism of land use and land cover changes are not fully represented in climate change simulations and hence the results. However, studies have shown that regional climate models are sensitive to their underlying land surface models [55], making this exogenous introduction of land surface model a limitation of climate simulations. Conversely, analysis of the impact of land use and land cover change on hydrological resources focus on classification of land types, their changes, and intensities with time, neglecting the climate response and feedback. To this end, the use of SPI and SSI in this work is an attempt to reduce the complexity and explain the link between climate and hydrology with a little computing resource. Our analysis revealed a close association between rainfall and streamflow for the Taabo Dam catchment area. The close matching between the two indices, irrespective of the impacts of land use and land cover changes for the entire period, indicates that hydrological condition of the Taabo catchment is influenced somehow directly by climate conditions. This is particularly true for the last decade (2007–2017) (Figure 3d). Consequently, the future hydrological resource for Taabo Dam is more likely to be climate-dependent than it is on land use and land cover changes. A study in the Zilberia River in Iran [56] show that land use and land cover change will have less impact on hydrology than climate variables such as rainfall and temperature. Our approach seems a simple way to establish a relationship between rainfall and streamflow in the Bandama basin. Figure 3c enables us to see that rainfall and streamflow has increased in general since 1981. Figure 3d, however, shows that both rainfall and streamflow are decreasing in recent times. While the SPI and SSI are similarly based on long, accumulated periods, the SSI incorporated hydrological processes that determine season lags in the influence of climate on streamflow [57]. In simple terms, while SPI is useful for characterization of meteorological drought at different timescales, the SSI is a useful complement to the SPI for depicting hydrological aspects of drought [58]. Our choice for SPI12 and SSI12 is that the 12-month time scale is most representative of hydrological conditions connected to streamflow and reservoir storage [59]. Secondly, we chose SPI12 and SSI12 as indices to allow us to characterize the climate and investigate the sustainability of the Taabo Dam based on climate indices. To achieve this, we compute SPI12 for each year and used it as the basis for grouping years of similar SPI into the same category (Table 2). According to SPI classification, all climate regimes have been experienced in the Taabo Dam area except for extremely wet conditions. The procedure adopted allows us to investigate how indirectly climate and hydrological conditions of the Taabo catchment influence social, economic, environmental, technical, and resource indicators. Besides, climate change impacts on hydropower are mainly in two folds: water scarcity which leads to a decrease in hydropower production or excess water leading to flooding and inundation of surrounding towns and villages. In effect, the consequences of any form of climate change impact are related to the impacts of dry and wet conditions which are depicted by the SPI and SSI. Thus, SPI and SSI represent a smarter approach to characterizing the impact of climate change without a complex climate change analysis. For this work, the SPI values captured all climate conditions that may be experienced in the present and future, except for extremely wet conditions. We advise that, in replicating this work, the data used for SPI computation should cover a significant amount of years, as demonstrated above.

4.2. Expectation Matrix—Probability of Occurrence

The probability matrix of the Taabo Dam is shown in Figure 4 below The probability matrix represents the expectation or probability of occurrence of an indicator. Figure 4a shows the probability of an indicator in a specific climate regime, whilst 4b demonstrates the probability or expectation in 36 years (1982–2017) or the climatological mean probability. Figure 4a illustrates the probabilities associated with year-to-year management of the Taabo Dam, from one climate regime to another. Figure 4b, on the other hand, show the probabilities associated with long-term management. The uniqueness of Figure 4b lies in its ability to reveal that the Taabo catchment area experiences most often, a “near normal” climate, which is completely unnoticed in Figure 4a. From Figure 4, the expectation values differ from one indicator to another within the same climate regime. Similarly, the expectation value of an indicator may differ for one climate regime to another. Figure 4a shows that the probability of occurrence of environmental indicators (PD, GWP, AR) is highest with expectation values of 1, irrespective of the climate regime. This is expected as environmental indicators are characteristic of the dam. On the other hand, flooding indicators (FNF, FAF, FIS) have low probability values, indicating that they do not occur frequently. While environmental indicators have high expectation values, the risk associated with their impacts can be very low. Conversely, indicators with very low probabilities can adversely affect hydroelectric systems when their impacts are being experienced. We classify such indicators as emergency indicators. In between the two probability extremes, the expectation value of an indicator in Figure 4a,b corresponds to its probability of occurrence. If an indicator has a negative impact, the higher the expectation value, the higher the probability that it negatively affects the system. However, if an indicator is positive, the higher the expectation values the more beneficial it is to the system. For management, indicators with low probabilities should be given more attention as the occurrence might introduce instability in the system (Flooding indicators). For the Taabo Dam, our estimations reveal that FIS (0.74257—Equation (23)) has the highest risk to contribute to flooding, followed by FNF (0.25243—Equation (18)) and FAF (0.00499—Equation (20)). However, this may differ from one climate regime to another. The probability matrix is useful in many ways: (i) it helps to evaluate different occurrence frequencies associated with the indicators in same climate regime (ii) it helps evaluate an indicator’s occurrence frequency from one climate regime to another. The matrix shown here can be updated to include more years as the dam becomes older and data becomes available. For now, it covers a significant number of years from the start of the dam to current conditions (1981–2017). Practically, the probability matrix is useful for management to make inform decisions based on occurrence frequencies associated with indicators. Probabilities attributes of risk events are often described as “probability”, “likelihood”, “probability of occurrence” and “occurrence frequency” [45]. Scales used for these probability ratings range from low, medium, and high, 1 to 10, 0 to 1.0, or some other nonlinear or linear scale. According to [45], the use of these terms and scales are all correct, however, inconsistent use and terminology create confusions. To avoid this confusion and ease interpretation, we choose the absolute bound [0,1] to estimate probabilities for all indicators at each climate regime. Besides the categorical scale (climate regimes) were derived based on quantitative data (SPI values). This allows us to compare all indicators across the matrix. As the probability matrix presented here is based on 36 years of historical data, it best describes the occurrence frequency. However, we expect it to give an idea of the probability of occurrence or the expectation. In sum, the specialty of the probability matrix in this work is to use historical data to derive “occurrence frequencies” and use the occurrence frequencies in turn as “probability of occurrence or expectation values” for monitoring and managing hydroelectric dams in the future.

4.3. Normalized Risk Matrix

The normalized risk matrix considers the impact and the probability associated with the impact normalized on a scale of 0 to 1. Thus, the risk is defined here as the product of the impact and the probability of the impact, mathematically expressed by Equation (34).
The normalized risk matrix is the value of a risk matrix normalized between 0 to 1. As risk could be positive or negative depending on the objective of the project, we different positive from negative risks by assigning red and blue colors respectively. We observe that negative high risks are associated with environmental indicators (GWP, AR) and flooding indicators (FNF, FAF, FIS). Indicators with highly negative impacts have the most intense red colors and those with positive impacts have the most intense blue colors. For instance, it is observed that flooding does not occur frequently (Figure 4), but when they do, their impacts can be significant (Figure 5). Also, the normalized risk matrix suggests that even with a zero probability of occurrence risk still exist. Thus, in the management of hydroelectric systems in general, it is misleading to rely solely on the probability of events. The risk matrix allows us to see the intensities associated with small probabilities and that can become criteria for safety measures. The problem with hydroelectric dam management is not ignorance of the factors but uncertainties in their frequencies and intensities associated with their impacts. With probability, impact and risk matrices as demonstrated above, we can show the occurrence frequencies, impacts, and intensities of impacts, which is useful for management and monitoring of Taabo Hydroelectric Dam.
A risk matrix is a common methodology used for estimating risks. This is often done by setting opposing scale for severity of harm and likelihood of harm, and either descriptive terms or numerical values are used to populate the scales [47]. Unlike the probability matrices (Figure 4) which rely solely on the probability of events, the risk matrix has a probability component and an impact component. Depending on our impact matrix (Table 5), the resultant risk matrix (Table 7) has a range of positive and negative values, making interpretation difficult. This observation is one of the limitations of risk matrices in general, not exclusive to this work. For example, an assessment of risk matrices by [49] outlines the following limitations: (i) Output can be ambiguous if inputs are based on categorical ambiguous scales. (ii) Effective resource allocation as countermeasures cannot be based on categorical scales. (iii) Typical risk matrices can only compare small fractions of randomly selected pair of hazards resulting in matrices of poor resolution. (iv) Errors due to assigning higher qualitative ratings to quantitatively smaller risks. To avoid limitations associated with risk matrices, we employ normalized risk matrices instead to show risk distribution on a scale of 0 to 1. To overcome the limitations of (i) and (ii) listed above, we derived normalized risked purely from quantitative data. The normalized risked values are quantitative and the normalized risk scores which are based on SPI values can also be interpreted numerically. The normalized matrix presented here could be effective for resource allocation for hydroelectric dam management as risk scores can be ascertained quantitatively for appropriate action. Normalization was done twice to obtain the normalized risk matrix in Figure 5. The first normalization is carried out separately for each indicator class at a 99% confidence interval base on whether risk increases or decreases with the increased value of sustainability (Equations (35) and (36)). Normalization was done at a 99% confidence interval primarily to eliminate the edge conditions [0,1] in Equations (35) and (36) and to enhance comparison of the value of each indicator within climate regimes. By so doing, the problem of range compression in (iii) is resolved as all indicators risk values are fully represented between the interval [0,1]. Similarly, by using specific normalization rules, each climate regime takes its normalized value based on the same rules, eliminating to a larger extent the possibility of assigning higher qualitative ratings to smaller risks. We apply a single second normalization for all indicators to evaluate how each indicator compares to each other in the entire matrix. In the second normalization, each indicator brings its risk scores and compare with another. Thus, we achieve inter-comparison of risk scores of each indicator, which is difficult to achieve with an ordinary risk matrix.

4.4. Sensitivity Analysis of Taabo Dam Indicators

In this section, we analyze the sensitivity of the General Sustainability Index (GSI) to individual sustainability indicators. This was first done by [19]. We employed the normalized indicator (Table 9) and weight coefficient values obtained after giving each indicator the highest priority, to calculate the GSI. The normalized indicator values used and the resultant GSI matrices are shown in Table 9 and Table 10 below.
The General Sustainability Index (GSI) or quality index is an additive aggregation of all individual indicators, times their respective weights coefficient values. For each indicator prioritized, the GSI obtained is shown in Table 10. Indicators having highest GSI values when prioritized also have the highest contribution to GSI formation and vice versa. Indicators with equal GSI when prioritized also have equal contributions to the formation of GSI. The GSI values under each indicator in Table 10 are the GSI values obtained when the indicator is prioritized. At the extremely dry climate regime, environmental (GWP, PD) and flooding (FIS, FAF, and FNF) indicators have highest GSI value of 0.8066 while SPI, SSI, AR, EAF, and HI have the least GSI value of 0.1816. At the severely dry climate regime, AWD and CNG have equal and the highest GSI values of 0.8225 and AWP has the least GSI of 0.1975. For the moderately dry regime, AWP, INF and HI have the highest GSI value of 0.7826 compared to PD, GWP, AWD, IAF, and FNF with the least GSI value of 0.1576. EAF and FIS have the highest and least GSI values of 0.8007 and 0.1756 respectively for the near-normal climate regime. At the moderately wet climate regime, however, IAF, FNF, FAS, and FIS have the highest GSI values of 0.8394 while INF and CNG have the least GSI value of 0.2144. Finally, FAF has the least GSI value of 0.2074 at the very wet climate regime whilst SPI, SSI and AR have the highest GSI value of 0.8324. The GSI values reveal within which climate regime an indicator can be very sensitive. A pictorial view of the GSI for each climate regime is shown in Figure 6 below.
The results shown are similar to the IHA’s HSAP results, also presented on a spider diagram. The HSAP spider diagram, however, contains 20 indicators covering the social, economic, environmental and technical aspects of hydropower sustainability. Sustainability scores are ranked based on quality corresponding gaps in predefined good practice at some level of assessment [12]. The IHA approach can be carried out at the early, planning, implementation, and operation phases. In this paper, we present a single one-time assessment of a hydroelectric dam which is applicable for monitoring and management over its lifetime. While we do not intend to suggest weaknesses in the IHA approach, we think of our approach as a more quantitative quality assessment based on local indicators that are most often absent from global hydropower sustainability assessment frameworks. The specialty of our approach is the fact that it provides a one-time visualization of all possible climate regimes that a hydropower system is likely to undergo over its lifetime and so makes room for management and monitoring.
For the Taabo Dam managerial decision, the GSI chart is useful for visualizing the importance of an indicator in each climate regime. In addition, the area colored under the chart shows the optimal quality index that should be expected for each climate regime based on indicators used. The greater the area under chart, the better the overall measure of sustainability (quality index) and vice versa. Based on average GSI values from the chart, we rank the performance of the Taabo Dam for the period 1982–2017, according to climate regime as
Moderately   dry   <   Near   normal   <   Extremely   dry   <   Severy   dry   <   Very   wet   <   Moderately   wet
It is worth mentioning that the true sustainability of the Taabo Dam is depicted by the near-normal climate regime. This is because the near-normal climate regime consists of 24 years out of 36 years of data analyzed and therefore more representative of real conditions of the Taabo Dam. The other climate regimes may be considered a departure from normal conditions. For example, the high contribution of flooding indicators to GSI values at extremely dry and moderately wet conditions is so observed because no flooding records were observed in these climate regimes. For the management of the Taabo Dam, it is also worth noting that flooding indicators and water resource indicators are most interesting due to recent flooding events in the area. Recent flooding events are a departure from normal climate conditions. At near-normal climate, FIS has the least GSI value hence a greater contribution to flooding and consequently least contribution to sustainability, compared to FNF and FAF. Consequently, at normal climate conditions, the primary threat to flooding of the Taabo Dam is reservoir storage (FIS), followed by discharges from Kossou Dam (FAF) and finally the natural flow from Bouafle (FNF), which differs from one climate regime to the other. For resource indicators, higher GSI values are obtained when IAF is prioritized compared to when INF for all climate regimes except for moderately dry conditions. In effect, water in the reservoir of Taabo Hydroelectric Dam is much dependent on artificial flow form Kossou Dam than it is on natural flow from Bouafle. It is, however, important to note that at normal conditions, the contribution of streamflow of Bouafle to Taabo storage is significant. The GSI values also increase from normal to wet conditions when AWP and AWD are prioritized, showing water availability for hydropower production and for downstream also increases as the climate depart from normal to wet conditions. The spider charts presented above are based on an analysis of data from 1981 to 2017. This is a useful reference to serves as a limit to distinguish which times an indicator can be a positive risk factor and times where the same indicator can be a negative risk factor. We now present a quality assessment index representative of the Taabo hydroelectric project based on indicators used in this work.

4.5. General Sustainability Index of the Taabo Hydroelectric Dam

To assess the sustainability of the Taabo hydroelectric project in the context of management, we model four scenarios that are possible depending on which aspect of sustainability management wish to consider. The above is to make available options for management to consider for future development.

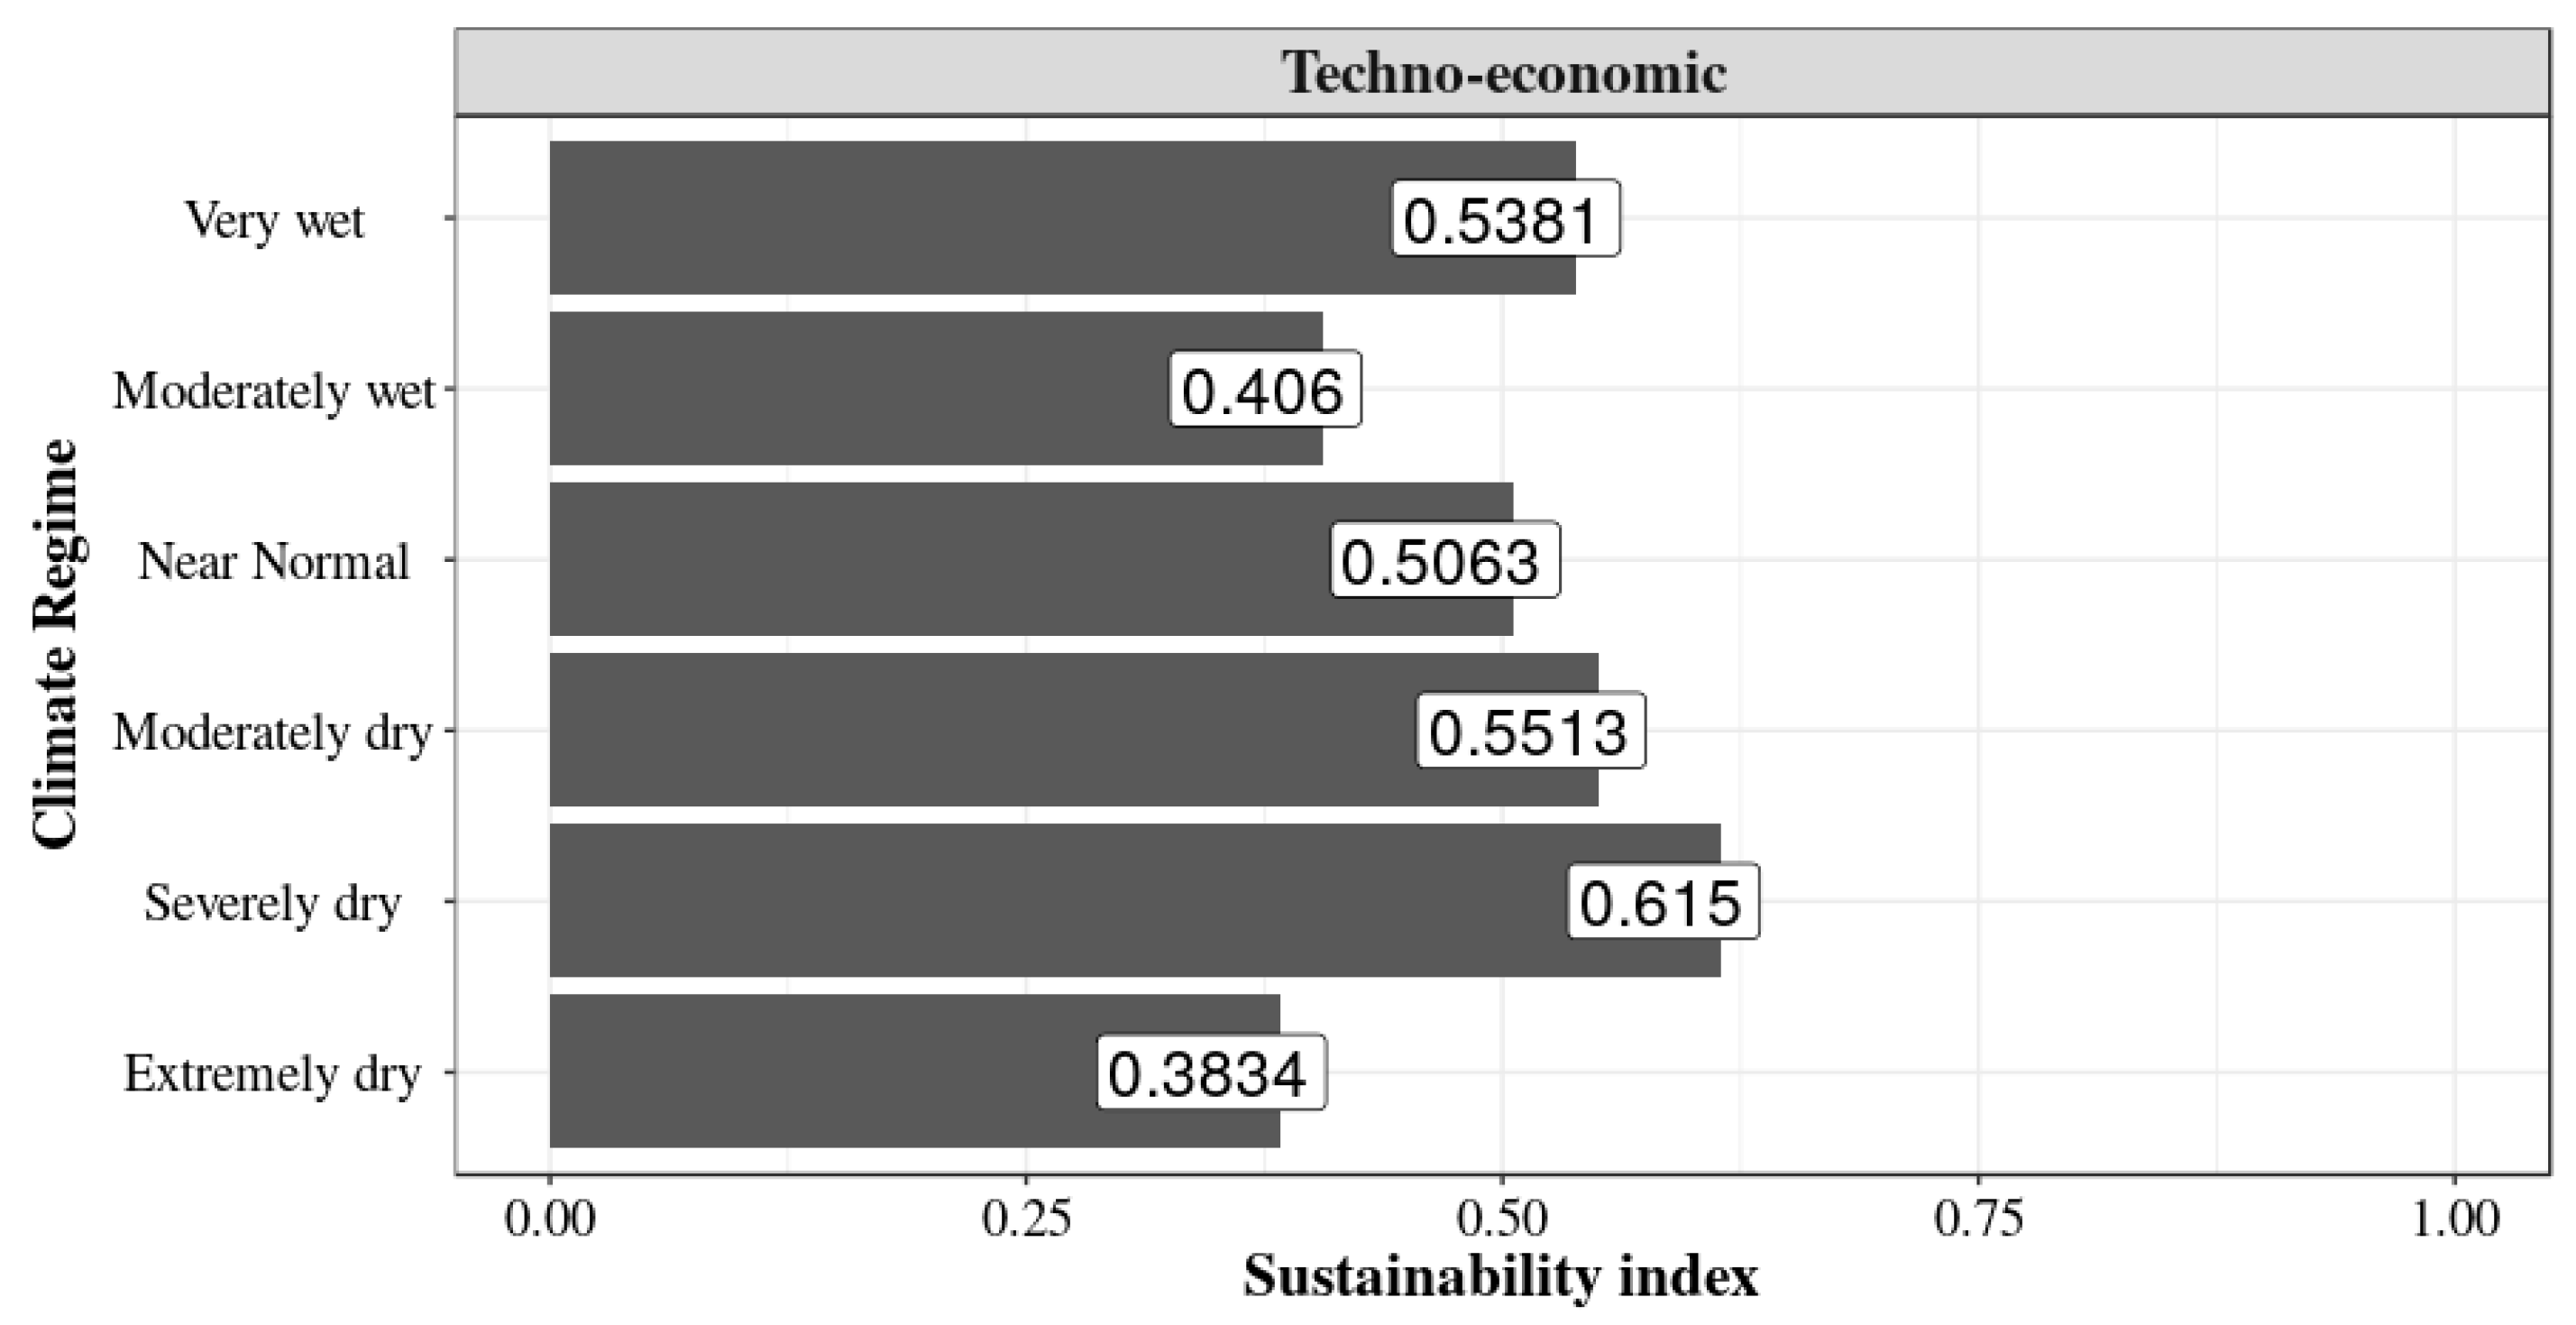
4.5.1. Case 1. Techno-Economic Sustainability Pathway—Business as Usual Scenario

The sustainability index obtained when priority is given to the techno-economic indicators is shown in Figure 7 below. On the abscissa is the GSI values (quality assessment index or sustainability index), on a scale of 0 to1. On the ordinate is the climate regimes for which the assessment was carried out.
The results for techno-economic pathway shows that when priority is given to technical and economic aspects, the dam is more sustainable in the severely dry climate conditions and least sustainable in extremely dry conditions with sustainability indices of 0.615 and 0.3834 respectively. Severely dry, moderately dry, very wet and near-normal climate regimes have sustainability indices greater than 0.5. On the other hand, moderately wet and extremely wet climate regimes have sustainability indices greater than the mean GSI value of 0.5. It will be expected that since hydroelectric dams are dependent on water resources, the GSI will have been highest for the very wet season or moderately wet season and least for extremely dry or severely dry conditions. The results here demonstrate that in reality, prioritizing technical and economic indicators will not necessarily lead to an improvement in the quality as desired. It is worth noting that the results obtained here are based on prioritizing resource (IAF, INF), technical (EAF, HI), and economic (CNG) indicators above the rest of the indicators. In essence, this represents what management of Taabo Hydroelectric Dam does under normal circumstance or business as usual scenario, which includes observing of flows, producing electricity, and transmission on the grid.

4.5.2. Case 2. Socio-Environmental Sustainability Pathway—Environmental and Human Activist Scenario

The sustainability index obtained when priority is given to the environmental aspect is shown in Figure 8 below.
The GSI here is obtained when priority is given to indicators related to the formation and existence of Taabo Dam reservoir (PD, GWP, AR) and impact on the dam’s downstream (AWD). AWD and AR are also related to the social consequences of the dam. For instance, AR evaluates the value of land use for power production. Similarly, AWD evaluates interruption to the normal flow of the river that will have been available downstream, without the dam’s presence. This case represents the socio-environmental pathway, which might be pursued by an environmental and human right activist. The results show very high (0.6025) and below-average (0.3778) respectively at extremely dry and moderately dry conditions, which unexpected for real-life operations of the Taabo Dam. The results suggest that in the context of environmental impacts, the dam is most sustainable in the extremely dry conditions and least sustainable at moderately dry conditions. The result is possible since the interest of environmental and human right activist is people and environment, with least care for energy production. In effect, the socio-environmental option is a mixture of GSI for climate regimes with an unclear path for sustainability energy production. Pursuing this option will imply more concerns for socio-ecological systems at the expense of energy development. In the context of increasing population growth and high demand for energy, this option is unrealistic in the discourse of sustainable energy development. It might, however, be a development pathway to consider in an attempt to reduce the destruction of socio-ecological systems caused by the construction and operation of energy systems in general and hydroelectric dams for that matter [19,60,61].

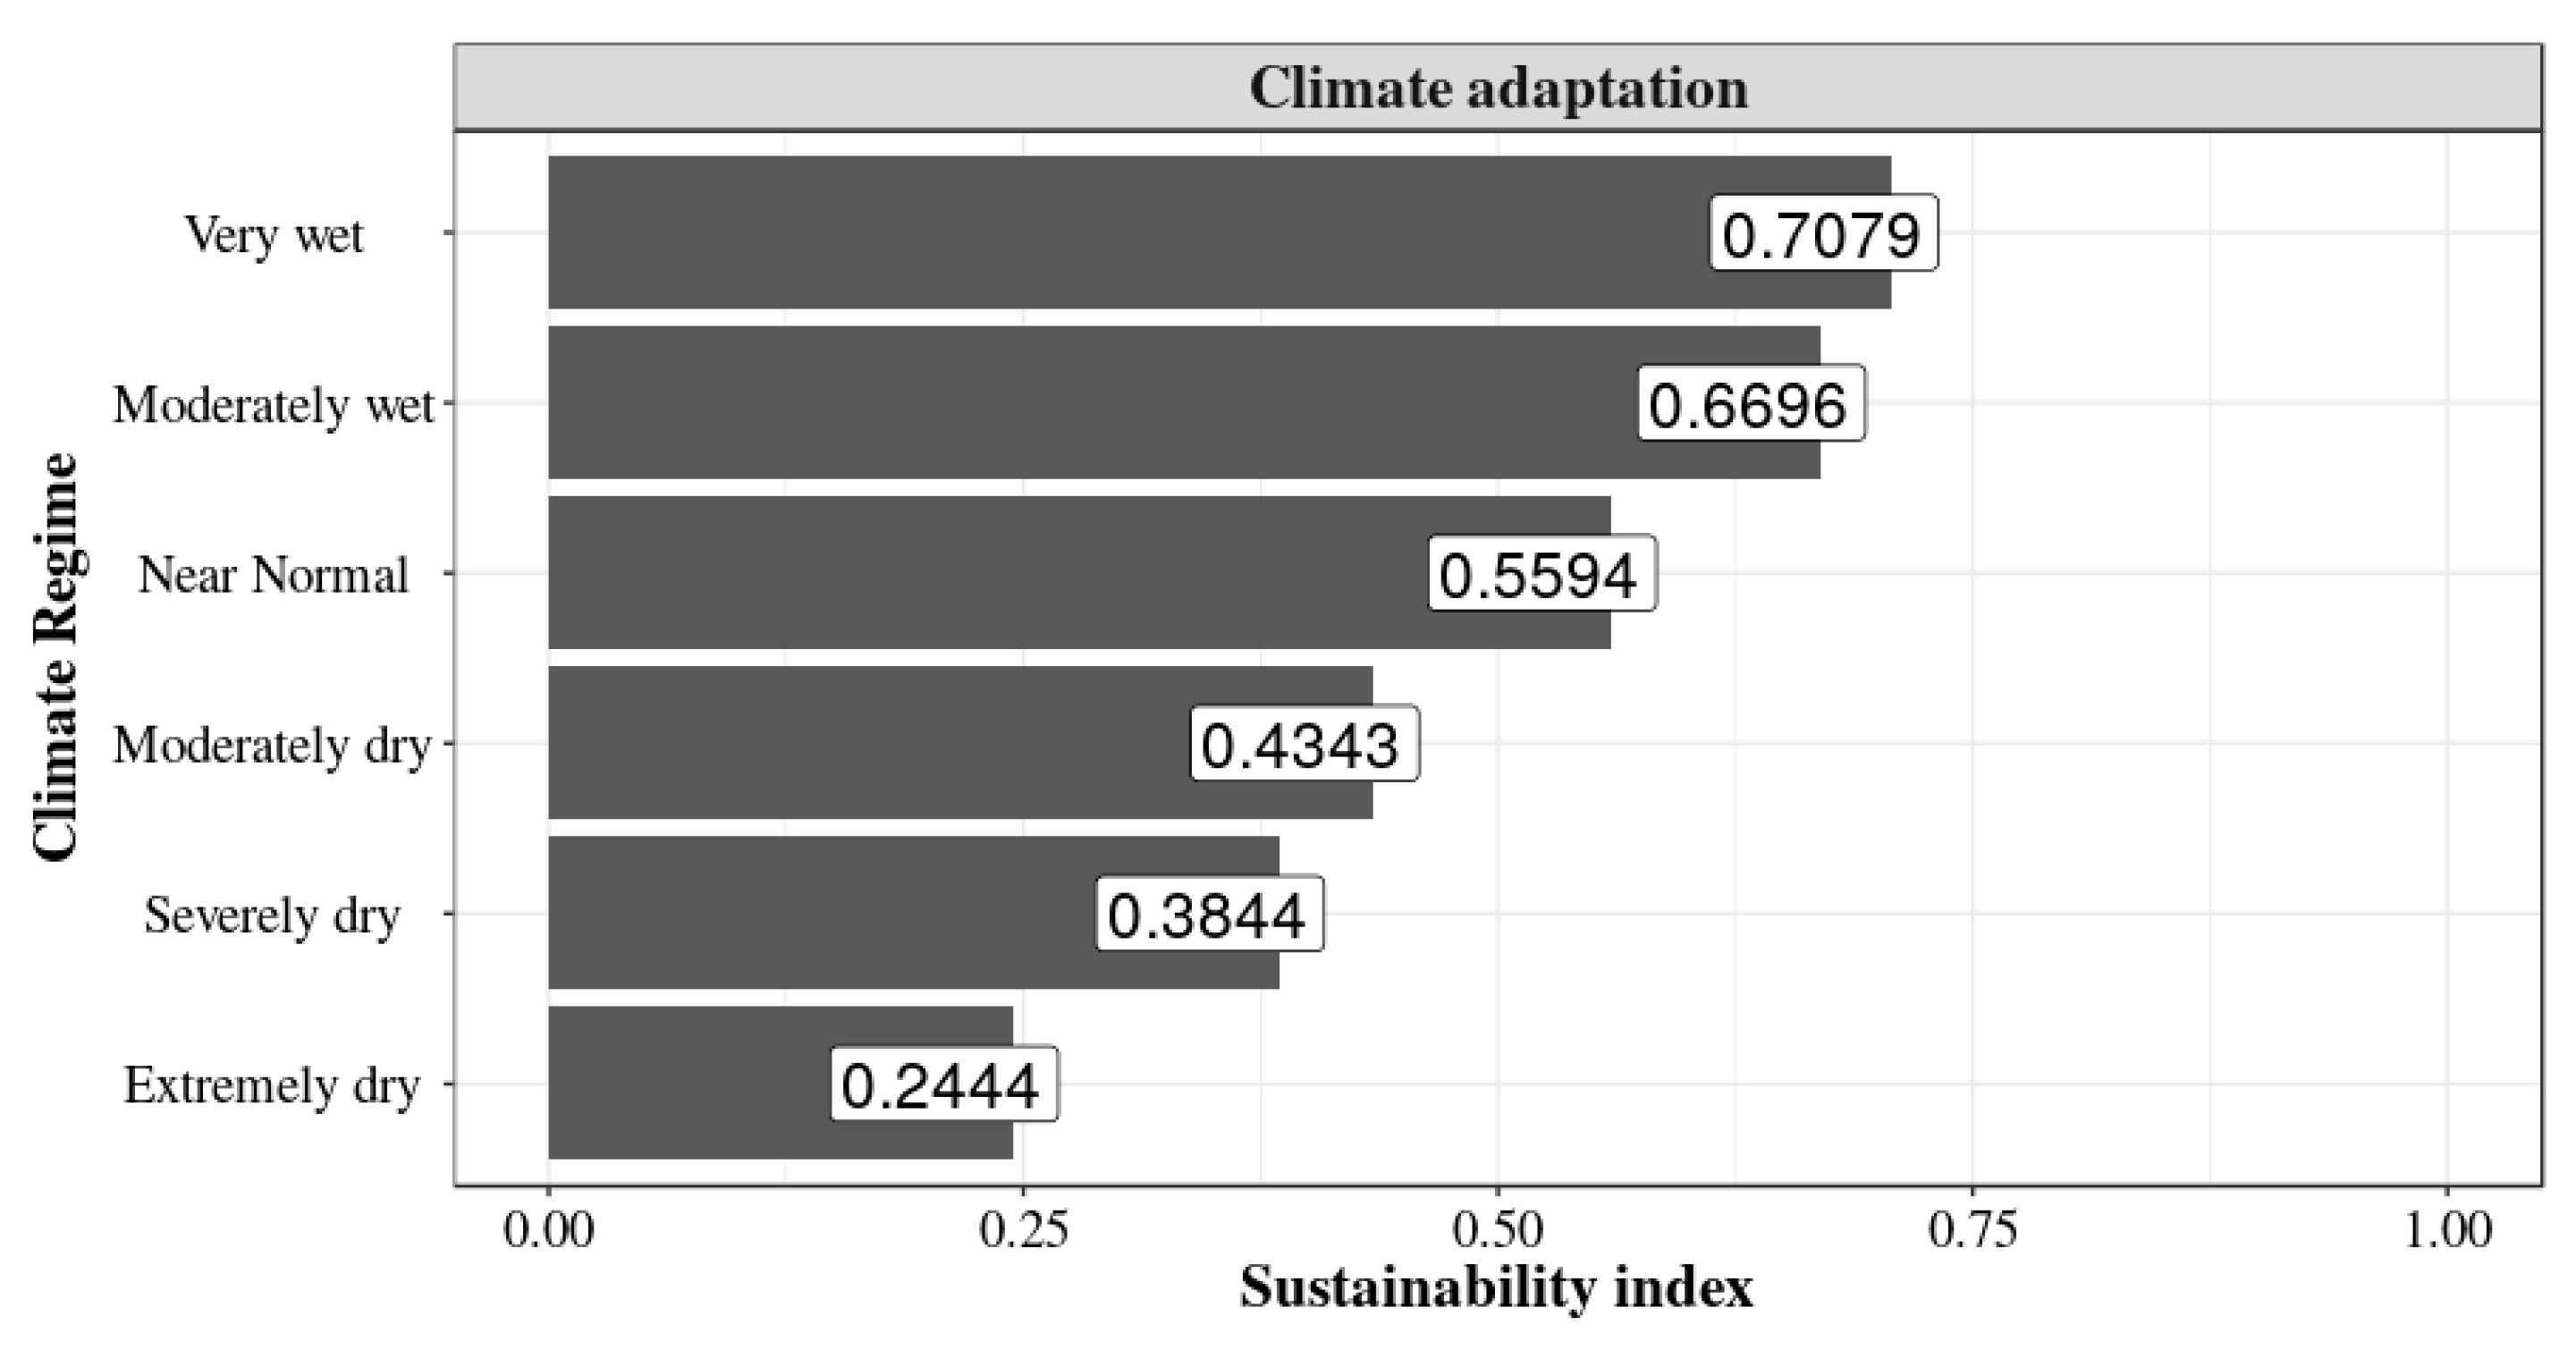
4.5.3. Case 3. Climate-Smart Sustainability Pathway—Adaptation to Climate Scenario

The sustainability index obtained when priority is given to climate indicators is shown in below Figure 9 below.
In this case, priority is given to climate indicators to adapt the hydroelectric dam to the evolving trends in the climate and the risks associated, such as flooding. Thus, priority is given to trends in climate and hydrological conditions defined by SPI and SSI, respectively. This scenario is based on the fact that hydropower production relies on streamflow which to some extent is determined by rainfall and hydrological conditions of a basin. As such, to optimize hydroelectric production and reduce the risk associated with them, climate and hydrological aspects are paramount. Specifically, this scenario models the idea that water resource indicators (AWP, AWD, INF, IAF) are both important resources for hydropower production and sources of risks (flooding). In effect, they integrate both positive and negative aspects associated with climate and hydrological impacts. The results show that very wet and extremely dry conditions have the highest (0.7079) and lowest (0.2444) indices respectively. Above near-normal conditions, the sustainability indices are greater for this option than all sustainability indices in Figure 8 and Figure 9. Also, the near-normal condition which is typically representative of the Taabo Dam has indices greater than the mean GSI of 0.5, compared to techno-economic and socio-environmental options. The high indices observed in this case prove that GSI is more sensitive to climate compared to the other indicators. Within the context of decision making, both the climate expert and hydroelectric dam management will prefer this option. Consequently, this option is comparatively better than the techno-economic and socio-environmental options. It must, however, be noted that the climate is a part of the natural environment. For this reason, climate indicators for sustainable energy development are often put under environmental indicators [44]. Thus, Case 3 might be considered an assessment of the impacts of very high environmental factors. The results also prove that SPI and SSI have very high impacts. The approach used here is to verify how other environmental, social, economic and technical indicators respond to these climate indices, which is crucial for hydroelectric dam management.

4.5.4. Case 4. Proposed Pathway—Authors Recommendation

In this scenario, priority is given to a mixture of indicators from all criteria (climate, social, economic, environmental, technical) to take advantages from as many indicators as possible for use in the assessment. This scenario is a nexus problem that involves decision making in the context of conflicting interests. We include SPI and SSI (climate), CNG and EAF (techno-economic), and AWP (resource) in this scenario. At least 12 indicators are fully represented in this scenario, and the results are shown in Figure 10 below.
The results for the proposed scenario (Figure 10) show the same preference of GSI ranking as in climate adaptation scenario. The GSI values are above 0.5 for normal and wet conditions and approximately 0.5 for moderately dry conditions. The fact the mean GSI value is greater than 0.5 for wet and normal conditions and nearly 0.5 for moderately dry conditions makes it a scenario worth taking advantage of. High standard deviations are likely for this scenario due to uncertainties when integrating indicators of conflicting interest. Thus, this case is, in reality, the decision that a climate expert, management of hydroelectric dams, and environmental and social activist will arrive at after deliberation. The highest and lowest index values, in this case, are 0.6216 and 0.3377 respectively compared to 0.7079 and 0.3244 in the climate adaptation scenario. The proposed alternative is preferred over climate adaptation alternative mainly because the former integrates climate as well as to other indicators. Secondly, the proposed option has a greater index of sustainability (0.4941 0.5) at moderately dry conditions while the climate adaptation option has a sustainability index of 0.4343. The dividing line for sustainable and unsustainable is an average sustainability index of 0.5. The results show that in practice, what should be done in the management of a hydroelectric dam (Taabo here) is an integration of various aspects, particular climate. Integration of climate can include acquiring climate service for operational monitoring of the climate for hydropower production, monitoring and keeping water stored in the dam below certain thresholds to reduce the risk of flooding during rainy periods. Again, this option emphasizes the compromises that need to be made to promote sustainable energy development in the hydropower sector. The key feature of this approach is to incorporate climate change analysis into already existing approaches which employ social, economic, environmental and technical for a hydroelectric dam sustainability assessment.
From the foregoing discussions, we rank the pathways for attaining sustainability of the Taabo Hydroelectric Dam in the context of climate as
Socio environmental < Techno economic < Climate smart < Proposed

5. Conclusions

Management and sustainability assessment are two key requirements for maintaining and operating existing hydropower plants. For site-specific hydroelectric dams, managerial problems are compounded by the need for local sustainability indicators that are not included in global sustainability assessment frameworks. This often arises because the socioeconomic, environmental, technical, and resource conditions of any hydroelectric dam are unique and largely determined by hydrological conditions and dynamism of activities in its catchment area. In addition, hydroelectric dams’ assessment within the context of climate is missing from most hydropower sustainability assessment frameworks. However, climate and local indicators are crucial for a hydroelectric dam sustainability assessment, especially in the context of climate change. In this paper we demonstrated the possibility of including climate indicators and local indicators to build a management framework as well as a sustainability assessment framework, using the Taabo Dam in Cote d’Ivoire, West Africa, as a case study. To allow linkages between climate and hydroelectric dam sustainability indicators, we use the standardized precipitation index to group years of similar SPI classification into so-called climate regimes. Global and local indicators are determined for each climate regime, forming a matrix of climate regimes and indicators. This initial matrix is the starting point for all analysis related to the management of hydroelectric dams in a climate change context. As all climate regimes are represented in this matrix, it provides the opportunity to visualize the hydroelectric dam under climate conditions that may result from a change in the climate. The approach also makes possible the definition of a probability matrix associated with the initial matrix of indicators. The probability matrix gives the occurrence frequencies or probability of occurrence of the initial matrix of indicators. Similarly, with threshold values set for each indicator class in the initial matrix, an impact matrix can be defined as values above or below the threshold value set for each indicator class. This probability and impact matrices are useful to create a risk matrix that is used as a system for managing and monitoring a hydroelectric dam. Normalized risk matrices present a better way to overcome problems such as poor resolution, range compression, errors, and ambiguity that are often associated with an ordinary risk matrix.
In the case of the Taabo Dam, our findings show that even though flooding indicators have a very low probability of occurrence, they could be associated with high impacts. In general, we observed that indicators with low probabilities can introduce great instability into the system when their impacts are being experienced. Our findings also reveal that even with a zero probability of occurrence, risks still exist and management should not take zero or very small probability of occurrence to be the absence of risk. Apart from using initial, probability, risk and impact matrices as a system for management and monitoring of hydroelectric dams, we employ normalized indicators and weight coefficient values of indicators to compute a General Sustainability Indices (GSI). We define a GSI as the linear aggregation of all indicator’s times their respective weight under a given scenario. The sensitivity of the GSI of the Taabo Hydroelectric Dam was tested by prioritizing each indicator in turn, to see output GSI values. This allows a comparison of the strengths of indicators with each other based on the GSI values. Comparison of indicators strength is achieved using a spider chart where all indicators are fully represented for all climate regimes. The pictorial representation forms a set of useful information for the management of the hydroelectric dam to identify the kind of indicator to focus more on in a particular climate regime. Thus, advantages and disadvantages are identified for optimizing of the hydroelectric dam in question. Alternatively, the ranking of indicators according to scenario preference leads to a resultant GSI value which is used to evaluate the overall quality of the dam at each climate regime. This approach is also able to rank climate regimes against each other. For the Taabo hydroelectric project, four scenarios were considered, (a) techno-economic sustainability pathway, (b) socio-environmental sustainability pathway, (c) climate-smart pathway, and (ii) proposed pathway. The techno-economic pathway shows the current method of dam management, which focus on techno-economic issues, is not the best approach to attaining sustainability of the dam. Similarly, the socio-environmental pathway, which represents environmental and human right activist’s ambition to attain environmental and social justice, is not a sustainable option either. The climate-smart option, which represents an adaptation of the hydroelectric electric system to climate conditions, is a better option than the techno-economic and socio-environmental options presented above. However, as optimal as the climate-smart option may be, the authors recommend an appropriate and wise combination of sustainability indicators that will be interesting to the techno-economic activist, socio-environmental activist, as well as the climate-smart scientist. The proposed option is more presentable, practical and much easier to discuss for a sustainable future. In summary, we present both a management scheme and sustainability assessment scheme for hydroelectric dams using Taabo Hydroelectric Dam in Cote d’Ivoire, West Africa, as a case study. We have demonstrated that hydropower sustainability assessment is a mixture of probabilities, impacts, risks, and uncertainties that can be quantified for management and monitoring of a hydroelectric dam in question. The main contribution to literature is that it integrates climate into the assessment framework, making it possible to assess sustainability a hydroelectric dam in the context of its climate. The strength of this approach is that it is based on a rainfall index (SPI values), which is unique and applicable to any hydroelectric scheme in any part of the world. The approach is thus applicable globally and to site-specific hydroelectric dams. The limitation of this approach is related to the age of the dam in question, as SPI requires some significant amount of monthly data. For new hydroelectric dams, we recommended that sustainability assessment be carried out on a seasonal basis as demonstrated by [19] using the Bui Dam in Ghana, West Africa. Last but not least, our analysis relationship between SPI and SSI suggest a strong link between climate and hydrological with minimum impact of changes associated with land use and land cover change for the entire period. Consequently, climate change is more likely to impact water availability in the Bandama Basin in the future compared to land use and land cover changes.

Author Contributions

Conceptualization, E.M.M.; Funding acquisition, A.D.; Methodology, E.M.M. and A.D.; Project administration, K.L.K. and S.A.; Resources, K.L.K. and D.G.M.K.; Supervision, K.L.K. and A.D.; Validation, M.G.; Writing—review & editing, S.A., M.G. and B.H.

Funding

The research leading to this publication is co-funded by the NERC/DFID “Future Climate for Africa” program under the AMMA-2050 project, grant number NE/M019969/1 and by IRD (Institut de Recherche pour le Développement; France) grant number UMR IGE Imputation 252RA5.”

Acknowledgments

The authors wish to acknowledge the management of the Taabo dam for providing data and information on the dam.

Conflicts of Interest

The authors declare no conflict of interest.

References

  1. Locher, H.; Scanlon, A. Sustainable Hydropower-Issues and Approaches. In Hydropower—Practice and Application; Samadi-Boroujeni, H.E., Ed.; InTech Open Access Publisher: Rijeka, Croatia, 2012; pp. 1–23. [Google Scholar]
  2. Cole, M.A. Limits to Growth, Sustainable Development and Environmental Kuznets Curves: An Examination of the Environmental Impact of Economic Development. Sustain. Dev. 1999, 7, 87–97. [Google Scholar] [CrossRef]
  3. Robert, W.K.; Thomas, M.P.; Leiserowitz, A.A. Editorial-What Is Sustainable Development? Goals, Indicators, Values, and Practice. Environ. Sci. Policy Sustain. Dev. 2005, 47, 8–21. [Google Scholar] [CrossRef]
  4. World Commission on Environment and Development. Our Common Future; Oxford University Press: Oxford, UK, 1987; pp. 1–91. [Google Scholar]
  5. Emas, R. The Concept of Sustainable Development: Definition and Defining Principles. Br. GSDR 2015, 1–3. [Google Scholar] [CrossRef]
  6. Luige. Microsoft Word—Full Report Final. 2013, pp. 1–179. Available online: http://www.unece.org/fileadmin/DAM/stats/documents/ece/ces/2013/SD_framework_and_indicators_final.pdf (accessed on 8 August 2019).
  7. Mebratu, D. Sustainability and Sustainable Development: Historical and Conceptual Review. Environ. Impact Assess. Rev. 1998, 18, 493–520. [Google Scholar] [CrossRef]
  8. Schumann, K.; Saili, L.; Taylor, R.; Abdel-Malek, R. Hydropower and Sustainable Development: A Journey. In Proceedings of the 21st World Energy Congress, Montreal, QC, Canada, 12–16 September 2010; pp. 11–16. [Google Scholar]
  9. Purvis, B.; Mao, Y.; Robinson, D. Three Pillars of Sustainability: In Search of Conceptual Origins. Sustain. Sci. 2019, 14, 681–695. [Google Scholar] [CrossRef]
  10. Haller, C.R. Sustainability and Sustainable Development. Top. Environ. Rhetor. 2018, 2003, 213–233. [Google Scholar] [CrossRef]
  11. Fujikura, R.; Nakayama, M. Lessons Learned from the World Commission on Dams. Int. Environ. Agreem. Polit. Law Econ. 2009, 9, 173–190. [Google Scholar] [CrossRef]
  12. International Hydropower Association. Hydropower Sustainability Assessment Protocol; IHA: London, UK, 2011. [Google Scholar]
  13. Bach, H.; Clausen, T.; Trang, D.; Emerton, L.; Facon, T.; Hofer, T.; Lazarus, K.; Muziol, C.; Noble, A.; Schill, P.; et al. From Local Watershed Management to Integrated River Basin Management at National and Transboundary Levels; Mekong River Commission: Vientiane, Lao PDR, 2011. [Google Scholar]
  14. Ngoc Bao, P.; Mitra, B.K.; Kuyama, T. Integrated Approach for Sustainable Hydropower Development in the Mekong River Basin. Environ. Nat. Resour. Res. 2017, 7, 60–75. [Google Scholar] [CrossRef]
  15. Chen, D.; Schudeleit, T.; Posselt, G.; Thiede, S. A State-of-the-Art Review and Evaluation of Tools for Factory Sustainability Assessment. Procedia CIRP 2013, 9, 85–90. [Google Scholar] [CrossRef]
  16. Kumar, D.; Katoch, S.S. Sustainability Indicators for Run of the River (RoR) Hydropower Projects in Hydro Rich Regions of India. Renew. Sustain. Energy Rev. 2014, 35, 101–108. [Google Scholar] [CrossRef]
  17. Calabria, F.A.; Camanho, A.S.; Zanella, A. The Use of Composite Indicators to Evaluate the Performance of Brazilian Hydropower Plants. Int. Trans. Oper. Res. 2018, 25, 1323–1343. [Google Scholar] [CrossRef]
  18. Bhandari, R.; Saptalena, L.G.; Kusch, W. Sustainability Assessment of a Micro Hydropower Plant in Nepal. Energy Sustain. Soc. 2018, 8, 3. [Google Scholar] [CrossRef]
  19. Mortey, E.; Ofosu, E.; Kolodko, D.; Kabobah, A. Sustainability Assessment of the Bui Hydropower System. Environments 2017, 4, 25. [Google Scholar] [CrossRef]
  20. Liu, G. Development of a General Sustainability Indicator for Renewable Energy Systems: A Review. Renew. Sustain. Energy Rev. 2014, 31, 611–621. [Google Scholar] [CrossRef]
  21. Afgan, N.; da Graça Carvalho, M. Sustainable Assessment Method for Energy Systems: Indicators, Criteria and Decision Making Procedure; Springer Science & Business Media: Berlin, Germany, 2000. [Google Scholar]
  22. Gadonneix, P.; de Castro, F.B.; de Medeiros, N.F.; Drouin, R.; Jain, C.P.; Kim, Y.D.; Frei, C. Pursuing Sustainability: 2010 Assessment of Country Energy and Climate Policy; World Energy Council: London, UK, 2010. [Google Scholar]
  23. Abubakari, S.; Dong, X.; Su, B.; Hu, X.; Liu, J.; Li, Y.; Peng, T.; Ma, H.; Wang, K.; Xu, S. Modelling Streamflow Response to Climate Change in Data-Scarce White Volta River Basin of West Africa Using a Semi-Distributed Hydrologic Model. J. Water Clim. Chang. 2018. [Google Scholar] [CrossRef]
  24. Coulibaly, N.; Coulibaly, T.; Mpakama, Z.; Savané, I. The Impact of Climate Change on Water Resource Availability in a Trans-Boundary Basin in West Africa: The Case of Sassandra. Hydrology 2018, 5, 12. [Google Scholar] [CrossRef]
  25. Jin, L.; Whitehead, P.G.; Appeaning Addo, K.; Amisigo, B.; Macadam, I.; Janes, T.; Crossman, J.; Nicholls, R.J.; McCartney, M.; Rodda, H.J.E. Modeling Future Flows of the Volta River System: Impacts of Climate Change and Socio-Economic Changes. Sci. Total Environ. 2018, 637–638, 1069–1080. [Google Scholar] [CrossRef] [PubMed]
  26. Sylla, M.B.; Faye, A. Projected Increased Risk of Water Deficit over Major West African River Basins under Future Climates. Clim. Chang. 2018, 151, 247–258. [Google Scholar] [CrossRef]
  27. Tall, M.; Sylla, M.B.; Diallo, I.; Pal, J.S.; Faye, A.; Mbaye, M.L.; Gaye, A.T. Projected Impact of Climate Change in the Hydroclimatology of Senegal with a Focus over the Lake of Guiers for the Twenty-First Century. Theor. Appl. Climatol. 2017, 129, 655–665. [Google Scholar] [CrossRef]
  28. Sylla, M.B.; Pal, J.S.; Faye, A.; Dimobe, K.; Kunstmann, H. Climate Change to Severely Impact West African Basin Scale Irrigation in 2 °C and 1.5 °C Global Warming Scenarios. Sci. Rep. 2018, 8, 14395. [Google Scholar] [CrossRef]
  29. Stanzel, P.; Kling, H.; Bauer, H. Climate Change Impact on West African Rivers under an Ensemble of CORDEX Climate Projections. Clim. Serv. 2018, 11, 1–13. [Google Scholar] [CrossRef]
  30. Roudier, P.; Ducharne, A.; Feyen, L. Climate Change Impacts on Runoff in West Africa: A Review. Hydrol. Earth Syst. Sci. 2014, 18, 2789–2801. [Google Scholar] [CrossRef]
  31. Danielle, A.B.; N’ZI, K.G.; Mamadou, B.; Paul, K.E. Ichthyologic Diversity of Bandama River Basin (Côte D’Ivoire): An Update and Environmental Influences on Fish Distribution Aboua Benie Rose Danielle. Eur. Sci. J. 2015, 11, 99–116. [Google Scholar]
  32. Soro, G.; Yao, A.; Kouame, Y.; Bi, T. Climate Change and Its Impacts on Water Resources in the Bandama Basin, Côte D’ivoire. Hydrology 2017, 4, 18. [Google Scholar] [CrossRef]
  33. Anoh, K.A.; Koua, T.J.J.; Kouamé, K.J.; Jourda, J.P.; Laurent, F. Modelling Water Flow in a Complex Watershed in Humid a Tropical Area Using SWAT: A Case Study of Taabo Watershed in Ivory Coast. Int. J. River Basin Manag. 2018, 16, 157–167. [Google Scholar] [CrossRef]
  34. Anoh, K.A.; Koua, T.J.J.; Eblin, S.G.; Kouamé, K.J.; Jourda, J.P. Modelling Freshwater Availability Using SWAT Model at a Catchment-Scale in Ivory Coast. J. Geosci. Environ. Prot. 2017, 5, 70–83. [Google Scholar] [CrossRef] [Green Version]
  35. N’Goran, E.K.; Diabate, S.; Utzinger, J.; Sellin, B. Changes in Human Schistosomiasis Levels after the Construction of Two Large Hydroelectric Dams in Central Cote d’Ivoire. Bull. World Health Organ. 1997, 75, 541–545. [Google Scholar] [PubMed]
  36. Afgan, N.H. Sustainability Paradigm: Intelligent Energy System. Sustainability 2010, 2, 3812–3830. [Google Scholar] [CrossRef] [Green Version]
  37. Svoboda, M.; Hayes, M.; Wood, D. Standardized Precipitation Index User Guide; World Meteorological Organization: Geneva, Switzerland, 2012. [Google Scholar]
  38. Tigkas, D.; Vangelis, H.; Tsakiris, G. DrinC: A Software for Drought Analysis Based on Drought Indices. Earth Sci. Inform. 2015, 8, 697–709. [Google Scholar] [CrossRef]
  39. Afgan, N.H.; Carvalho, M.G. Multi-Criteria Assessment of New and Renewable Energy Power Plants. Energy 2002, 27, 739–755. [Google Scholar] [CrossRef]
  40. Caetano de Souza, A.C. Assessment and Statistics of Brazilian Hydroelectric Power Plants: Dam Areas versus Installed and Firm Power. Renew. Sustain. Energy Rev. 2008, 12, 1843–1863. [Google Scholar] [CrossRef]
  41. Groga, N.; Ouattara, A.; Koulibaly, A.; Dauta, A.; Amblard, C.; Laffaille, P.; Gourene, G. Dynamic and Structure of Phytoplankton Community and Environment in the Lake Taabo (Côte d’Ivoire). Int. Res. J. Public Environ. Heal. 2014, 1, 70–86. [Google Scholar]
  42. Intergovermental Panel on Climate Change (IPCC). 2006 IPCC Guidelines for National Greenhouse Gas Inventories; Intergovernmental Panel on Climate Change: Geneva, Switzerland, 2006. [Google Scholar]
  43. Copernicus, I. Oco Opи Aкадем Ия. Tpyды Aкадемuu A 2009, 4, 65–69. [Google Scholar]
  44. Hirschberg, S.; Bauer, C.; Burgherr, P.; Dones, R.; Schenler, W.; Bachmann, T.; Gallego Carrera, D. New Energy Externalities Developments for Sustainability Deliverable D3. 1—RS2b—Environmental, Economic and Social Criteria and Indicators for Sustainability Assessment of Energy Technologies; New Energy Externalities Developments for Sustainability (NEEDS): Brussels, Belgium, 2007. [Google Scholar]
  45. Carbone, T.A.; Tippett, D.D. Project Risk Management Using the Project Risk Fmea. EMJ Eng. Manag. J. 2004, 16, 28–35. [Google Scholar] [CrossRef]
  46. Norrman, A.; Jansson, U. Ericsson’s Proactive Supply Chain Risk Management Approach after a Serious Sub-Supplier Accident. Int. J. Phys. Distrib. Logist. Manag. 2004, 34, 434–456. [Google Scholar] [CrossRef]
  47. Woodruff, J.M. Consequence and Likelihood in Risk Estimation: A Matter of Balance in UK Health and Safety Risk Assessment Practice. Saf. Sci. 2005, 43, 345–353. [Google Scholar] [CrossRef]
  48. Dumbravă, V. Using Probability—Impact Matrix in Analysis and Risk Assessment Projects. J. Knowl. Manag. Econ. Inf. Technol. 2013, 2013, 76–96. Available online: http://www.Scientificpapers.Org (accessed on 20 August 2019).
  49. Anthony Cox, L. What’s Wrong with Risk Matrices? Risk Anal. 2008, 28, 497–512. [Google Scholar] [CrossRef]
  50. Hovanov, N. Decision Support System APIS for MEAD: Advanced User Guide. Decis. Support Syst. 2008, 1, 2008. [Google Scholar]
  51. Hovanov, N.V.; Hovanov, H.K. The Official Registration Certification of Computer Program “Analysis and Synthesis of Parameters under Information Deficiency” (ASPID-3W); Russian Federal Computer Programs Legal Safeguard Agency (RosAPO): Moscow, Russia, 1996. [Google Scholar]
  52. Hovanov, N.; Yudaeva, M.; Hovanov, K. Multicriteria Estimation of Probabilities on Basis of Expert Non-Numeric, Non-Exact and Non-Complete Knowledge. Eur. J. Oper. Res. 2009, 195, 857–863. [Google Scholar] [CrossRef]
  53. Dam, K.; Kouame, Y.M.; Obahoundje, S.; Diedhiou, A.; François, B.; Amoussou, E.; Anquetin, S.; Didi, S.; Kouassi, L.K.; Hermann, V.; et al. Climate, Land Use and Land Cover Changes in the Bandama Basin (Côte D’Ivoire, West Africa) and Incidences on Hydropower Production of the Kossou Dam. Land 2019, 8, 103. [Google Scholar] [CrossRef]
  54. Hayicho, H.; Alemu, M.; Kedir, H. Assessment of Land-Use and Land Cover Change Effect on Melka Wakena Hydropower Dam in Melka Wakena Catchment of Sub-Upper Wabe-Shebelle Watershed, South Eastern Ethiopia. Agric. Sci. 2019, 10, 819–840. [Google Scholar] [CrossRef] [Green Version]
  55. Zhan, J.; Liu, J.; Lin, Y.; Wu, F.; Ma, E. Land Use Change Dynamics Model Compatible with Climate Models. In Land Use Impacts on Climate; Springer: Berlin, Germany, 2014; pp. 19–46. [Google Scholar]
  56. Andaryani, S.; Trolle, D.; Nikjoo, M.R.; Moghadam, M.H.R.; Mokhtari, D. Forecasting Near-Future Impacts of Land Use and Climate Change on the Zilbier River Hydrological Regime, Northwestern Iran. Environ. Earth Sci. 2019, 78. [Google Scholar] [CrossRef]
  57. Shukla, S.; Wood, A.W. Use of a Standardized Runoff Index for Characterizing Hydrologic Drought. Geophys. Res. Lett. 2008, 35, 1–7. [Google Scholar] [CrossRef]
  58. Vazifehkhah, S.; Kahya, E. Hydrological and Agricultural Droughts Assessment in a Semi-Arid Basin: Inspecting the Teleconnections of Climate Indices on a Catchment Scale. Agric. Water Manag. 2019, 217, 413–425. [Google Scholar] [CrossRef]
  59. Yihdego, Y.; Vaheddoost, B.; Al-Weshah, R.A. Drought Indices and Indicators Revisited. Arab. J. Geosci. 2019, 12. [Google Scholar] [CrossRef]
  60. Obour, P.B.; Owusu, K.; Agyeman, E.A.; Ahenkan, A.; Madrid, À.N. The Impacts of Dams on Local Livelihoods: A Study of the Bui Hydroelectric Project in Ghana. Int. J. Water Resour. Dev. 2016, 32, 286–300. [Google Scholar] [CrossRef]
  61. Yankson, P.W.K.; Asiedu, A.B.; Owusu, K.; Urban, F.; Siciliano, G. The Livelihood Challenges of Resettled Communities of the Bui Dam Project in Ghana and the Role of Chinese Dam-Builders. Dev. Policy Rev. 2018, 36, O476–O494. [Google Scholar] [CrossRef]
Figure 1. Bandama basin showing Taabo Dam and Kossou Dam catchment area.
Sustainability 11 04846 g001
Figure 2. Framework for management and sustainability assessment.
Sustainability 11 04846 g002
Figure 3. Standardized Precipitation and Streamflow Indices of Taabo Dam area (1981–2017).
Sustainability 11 04846 g003
Figure 4. Probability matrix of the Taabo Hydroelectric Dam.
Sustainability 11 04846 g004
Figure 5. Normalized risk matrix.
Sustainability 11 04846 g005
Figure 6. Indicator sensitivity to sustainability.
Sustainability 11 04846 g006
Figure 7. General sustainability index estimation—techno-economic pathway.
Sustainability 11 04846 g007
Figure 8. General sustainability index estimation—socio-environmental pathway.
Sustainability 11 04846 g008
Figure 9. General sustainability index estimation—Adaptation-to-climate pathway.
Sustainability 11 04846 g009
Figure 10. General sustainability index estimation—proposed pathway.
Sustainability 11 04846 g010
Table 1. Standardized precipitation index classification.
Climate RegimeClassification Based on SPI
Extremely wet2.0+
Very wet1.5–1.99
Moderately wet1.0–1.49
Near normal−0.99–0.99
Moderately dry−1.49–1.0
Severely dry−1.50–−1.99
Extremely dry−2.0 and less
Table 2. Climate regimes based on SPI12 classification.
Climate RegimeYears
Extremely dry1983, 1984
Severely dry1989, 1991
Moderately dry1994, 1995, 1999
Near Normal1982, 1985–1988, 1992, 1993, 1996–1998, 2001–2003, 2006, 2007, 2009–2017
Moderately wet2004, 2005
Very wet1990, 2000, 2008
Table 3. Initial indicator values.
Climate RegimeSPISSIPDGWPARAWPAWDINFIAFFNFFAFFISCNGEAFHI
Extremely dry−2.051−2.5268.1971.0596.2822.2100.8190.4130.63200032.3780.2820.665
Severely dry−1.744−0.8774.3131.5361.458−1.6250.8860.4550.5850.3990.0010.60038.0910.6241.360
Moderately dry−1.204−0.6244.2361.5831.7849.3120.7380.7700.4160.5120.0120.47633.3610.5431.510
Near Normal0.0340.1024.6391.4521.6631.8130.8310.4820.5390.2140.0100.77631.3640.6521.195
Moderately wet1.2070.6784.2661.5361.3711.9220.8530.3420.64800030.2540.4570.770
Very wet1.7570.7674.4841.4731.1275.9310.8710.3490.6250.3840.0140.60235.5350.5441.223
Notes: Table 3. m × k matrices of m climate regimes and k initial value indicators; SPI—Standardized Precipitation Index (dimensionless); SSI—Standardized Streamflow Index (dimensionless), PD—Power Density indicator (W/m2); GWP—Global Warming Potential (kg CO2-eq/kWh); AR—Area (m2/kWh); AWP—Available Water for Production (m3/s); AWD—Available Water for Downstream (fraction); INF—Impact of Natural Flow (fraction), IAF—Impact of Artificial Flow (fraction), FNF—Flooding risk due to Natural Flow (ratio), FAF—Flooding risk due to Artificial Flow (ratio), FIS—Flooding risk due to Initial Storage (fraction); CNG—Contribution to National Grid (%); EAF—Equivalent Availability Factor (fraction); HI—Hydraulic Index (dimensionless).
Table 4. Threshold values of initial indicators.
IndicatorSPISSIPDGWPARAWPAWDINFIAFFNFFAFFISCNGEAFHI
Threshold value002.625102.6100.8300.4600.5500.2520.0050.74311.1350.5710.850
Table 5. Impact matrices of initial value indicators.
Climate RegimeSPISSIPDGWPARAWPAWDINFIAFFNFFAFFISCNGEAFHI
Extremely dry−2.051−2.5265.5720.0596.282−0.400−0.011−0.0470.082−0.252−0.005−0.74321.243−0.289−0.185
Severely dry−1.744−0.8771.6880.5361.458−4.2350.056−0.0050.0350.147-0.004−0.14326.9560.0530.510
Moderately dry−1.204−0.6241.6110.5831.7846.702−0.0920.310−0.1340.2600.007-0.26722.226-0.0280.660
Near Normal0.0340.1022.0140.4521.663−0.7970.0010.022−0.011−0.0380.0050.03320.2290.0810.345
Moderately wet1.2070.6781.6410.5361.371−0.6880.023−0.1180.098-0.252−0.005−0.74319.119−0.114−0.080
Very wet1.7570.7671.8590.4731.1273.3210.041−0.1110.0750.1320.009−0.14124.400−0.0270.373
Table 6. Expectation matrix of initial value indicators.
Climate RegimeSPISSIPDGWPARAWPAWDINFIAFFNFFAFFISCNGEAFHI
Extremely dry0.8330.8181110.6370.9580.6880.6530000.9170.9170.583
Severely dry1.0000.9091111.00010.9581.0000.1670.1670.167110.833
Moderately dry0.9170.8791110.97210.9170.9720.1670.1670.167110.944
Near Normal0.9270.9281110.96210.9860.9620.1300.1300.130110.868
Moderately wet1.00011111.00011.00010.00000110.875
Very wet0.91711111.00010.95810.1670.1670.167110.917
Table 7. Table of risk matrix.
Climate RegimeSPISSIPDGWPARAWPAWDINFIAFFNFFAFFISCNGEAFHI
Extremely dry−1.709−2.0675.5720.0594.407-0.255−0.011−0.0320.05400019.473−0.265−0.108
Severely dry−1.744−0.7971.6880.536−0.417−4.2350.056−0.0050.0350.025−0.001−0.02426.9560.0530.425
Moderately dry−1.104−0.5481.6110.583−0.0916.516−0.0920.284−0.1300.0430.001−0.04522.226−0.0280.623
Near Normal0.0320.0952.0140.452−0.212−0.7670.0010.022−0.011−0.0050.0010.00420.2290.0810.299
Moderately wet1.2070.6781.6410.536−0.504−0.6880.023−0.1180.09800019.119−0.114−0.070
Very wet1.6110.7671.8590.473−0.7483.3210.041−0.1060.0750.0220.002−0.02424.400−0.0270.342
Table 8. Table of Normalized risk matrix.
Climate RegimeSPISSIPDGWPARAWPAWDINFIAFFNFFAFFISCNGEAFHI
Extremely dry0.99010010.6300.4530.7860.1970.1040.2860.9170.95511
Severely dry1.0000.5520.9800.9100.064100.7190.2750.60400.41700.0810.271
Moderately dry0.8090.464110.127010110.85700.6040.3150
Near Normal0.4710.2370.8980.7500.1040.6770.3720.6540.47200.61910.85800.442
Moderately wet0.1200.0310.9920.9100.0470.6700.223100.1040.2860.91710.5640.948
Very wet000.9370.79000.2970.1010.9700.1000.56310.4170.3260.3120.384
Table 9. Normalized indicator values.
Climate RegimeSPISSIPDGWPARAWPAWDINFIAFFNFFAFFISCNGEAFHI
Extremely dry001100.35060.54730.16590.93101110.271000
Severely dry0.08060.66050.01940.08970.9358010.26400.72840.22070.92860.226810.92430.8225
Moderately dry0.22240.5776000.872610100.00000.14290.38660.39650.70541
Near Normal0.54750.79810.10170.25000.89600.31430.62840.32710.53020.58200.285700.141610.6272
Moderately wet0.85560.97300.00760.08970.95270.32430.77700111100.47300.1243
Very wet110.06260.209910.69090.89860.01640.90090.250000.22420.67390.70810.6604
Notes: Table 9 m × k matrix of m climate seasons and k initial value indicators; SPI—Standardized Precipitation Index (dimensionless); SSI—Standardized Streamflow Index (dimensionless), PD—Power Density indicator (W/m2); GWP—Global Warming Potential (kg CO2-eq/kWh); AR—Area indicator (m2/kWh); AWP—Available Water for Production (m3/s); AWD—Available Water for Downstream (fraction); INF—Impact of Natural Flow (fraction), IAF—Impact of Artificial Flow (fraction), FNF—Flooding risk due to Natural Flow (ratio), FAF—Flooding risk due to Artificial Flow (ratio), FIS—Flooding risk due to Initial Storage (fraction); CNG—Contribution to National Grid (%); EAF—Equivalent Availability Factor (fraction); HI—Hydraulic Index (dimensionless).
Table 10. General sustainability index matrix.
Climate RegimeSPISSIPDGWPARAWPAWDINFIAFFNFFAFFISCNGEAFHI
Extremely dry0.18160.18160.80660.80660.18160.40080.52370.28530.76350.80660.80660.80660.35100.18160.1816
Severely dry0.24790.61030.20970.25360.78240.19750.82250.36250.65280.33550.77790.33930.82250.77520.7116
Moderately dry0.29660.51860.15760.15760.70300.78260.15760.78260.15760.15760.24690.39920.40540.59850.7826
Near Normal0.51790.67460.23930.33200.73570.37220.56850.38020.50710.53950.35430.17570.26420.80070.5677
Moderately wet0.74920.82260.21920.27050.80990.41710.70010.21440.83940.83940.83940.83940.21440.51010.2921
Very wet0.83240.83240.24650.33860.83240.63920.76900.21760.77050.36360.20740.34750.62860.65000.6201
Note: A dimensionless General Sustainability Index (GSI).

