

Abstract
Andean vegetation and agriculture depend on the patterns of rainfall during the South American monsoon. However, our understanding on the importance of dynamic (upper-level wind circulation) as compared to thermodynamic (Amazon basin moisture) drivers for Andes rainfall remains limited. This study examines the effect of these drivers on 3–7 day wet and dry spells across the Tropical Andes and assesses resulting impacts on vegetation. Using reanalysis and remote sensing data from 1985–2018, we find that both dynamic and thermodynamic drivers play a role in determining the rainfall patterns. Notably, we show that the upper-level wind is an important driver of rainfall across the entire Tropical Andes mountain range, but not in the Amazon lowlands, suggesting a crucial role of topography in this relationship. From thermodynamic perspective, we find wet spell conditions to be associated with increased moisture along the Andes' eastern foothills accompanied by a strengthened South American low-level jet, with moisture lifted into the Andes via topography and convection for all considered regions. Our results suggest that while changes in Amazon basin moisture dominate rainfall changes on daily time scales associated with three day spells, upper-level dynamics play a more important role on the synoptic time scale of 5–7 day spells. Considering impacts on the ground, we find that only 5–7 day spells in the semi-arid Andes have a prolonged effect on vegetation. Our study emphasizes the need to consider both dynamic and thermodynamic drivers when estimating rainfall changes in the Tropical Andes, including in the context of future climate projections.
Export citation and abstract BibTeX RIS

Original content from this work may be used under the terms of the Creative Commons Attribution 4.0 license. Any further distribution of this work must maintain attribution to the author(s) and the title of the work, journal citation and DOI.
1. Introduction
Rainfall seasonality in the Tropical Andes (0–25∘S) is strongly controlled by the inland progression and retreat of the South American monsoon (SAM) system, affecting the timing of moisture transport into the Andes (e.g. Espinoza et al 2020), the majority of which originates from the Amazon basin (Trachte 2018). Locally, intra- and inter-annual SAM variability can crucially control water availability, affecting vegetation greening (Hänchen et al 2022), and increasing perceived challenges for small-scale farmers to plan crop cycles (Gurgiser et al 2016). Across the Andes, local precipitation characteristics vary considerably due to a multitude of local- to large-scale drivers and their interaction with topography (Garreaud and Aceituno 2001, Laraque et al 2007, Junquas et al 2018). In that context, the variability of the upper-level wind field has been identified as a major dynamical factor in controlling wet and dry years in particular over the Altiplano in the Southern Tropical Andes (∼14∘–22∘S), where the SAM reaches its southernmost extent and rainfall peaks in December to February (DJF). In that region and for the DJF peak rainy season, various studies illustrated enhanced upper-level (200 hPa) easterly wind to be consistently associated with more rainfall, linked to the development of the Bolivian high (BH) at that time of year (Vuille 1999, Garreaud et al 2003, Vuille and Keimig 2004, Thibeault et al 2012).
This significant inter-annual rainfall relationship with upper-level wind has subsequently been used as basis for predictions of potential future rainfall changes in the Southern Tropical Andes, with suggested future drying driven by a weakening of 200 hPa easterly wind anomalies in climate model projections (Minvielle and Garreaud 2011, Neukom et al 2015). At the same time, Segura et al (2020) have recently reported that the Southern Tropical Andes' rainfall relationship to upper-level wind conditions has weakened over the last two decades, while decreased atmospheric stability from moister mid-levels in the western Amazon gained of importance. Analysing four decades of reanalysis data, they suggest the latter thermodynamic driver to be independent from the dynamical 200 hPa wind effects and that it has been driving a positive rainfall trend in the region since the 2000s. Their findings thus imply that upper-level easterly winds are a favouring factor for rainfall in the Southern Tropical Andes, though not a sufficient condition in the face of moisture changes.
These results for the Southern Tropical Andes raise the question as to how rainfall sensitivities in the Central and Equatorial Tropical Andes compare to Southern conditions. Looking at drivers of wet and dry spells in the Mantaro Basin in the Central Tropical Andes, Sulca et al (2016) confirmed a relationship between upper-level easterly anomalies and rainfall as in Southern regions, but noted that even sustained strong upper-level easterlies often produce no or little rainfall. They concluded that moisture transport processes from the Amazon basin would have to be explored in more detail as additional wet spell driver. Thus, it remains an open question how upper-level wind as a dynamical driver and Amazon basin moisture as a thermodynamical driver interact to affect rainfall in the Andes.
The study aims to provide an integrated picture of the described regional findings by evaluating the relative importance of upper-level wind versus Amazon basin moisture changes for three to seven day dry and wet spells across the entire Tropical Andes mountain range. We investigate the circulation patterns that coincide with these spells during the regional rainy seasons between SAM passage and retreat, and quantify the dynamic and thermodynamic driver contribution to rainfall in the Equatorial (0∘–5∘S), Transition (5∘–8∘S), Central (8∘–12∘S) and Southern Tropical Andes (15∘–18∘S) above 2000 m altitude. Finally, we consider the effect on soil moisture (SM) and vegetation to better understand potential impacts from the evaluated spells. This study thus provides the first comparison of rainfall drivers for the entirety of the Tropical Andes and of the regional effect of multi-day spells on the ground.
2. Datasets and methods
2.1. Atmospheric conditions
We use a combination of remote sensing and reanalysis data to identify driver-rainfall relationships for 1985–2018. Atmospheric conditions are analysed based on hourly data from the ECMWF Reanalysis v5 (ERA5 Hersbach et al 2020, CDS 2021) at 0.25∘ resolution and for 1500 UTC (1000 local time, LT). By focusing on 1000 LT, we minimise atmospheric signatures from the typical heating-driven afternoon peak in convection (Vuille and Keimig 2004, Seidel et al 2019). For all described analyses, all other datasets were regridded onto the ERA5 grid of 0.25∘, which is thus the highest spatial resolution considered here.
2.2. Local DRS
We define the local DRS on a pixel-basis as the period of the year when upper-level 200 hPa wind correlates with cloud top temperatures (CTTs), marking the period when variability in upper-level dynamics control cloud and potential rainfall development. To determine the CTTs, we use GRIDSAT-B1 data (Knapp et al
2011), which is a cross-calibrated homogenised product from Meteosat first and second-generation satellites at a resolution of 0.07∘, available at 3-hourly interval. We concentrate on daily minimum CTTs  20 ∘C, which are associated with a ∼5%–20% probability for rainfall, increasing to ∼75%–90% for clouds
  40 ∘C, depending on region (supplementary file figure 1(a)). For each domain pixel, we correlate the three day running means of 200 hPa zonal wind at 1000 LT with the daily minimum CTT, centred on each calendar day over 33 years (i.e. 33 days correlation). Starting from 1 August—the late dry season—we define the start of the DRS for a pixel as the first day where this correlation is statistically significant (p≤0.05). This date is therefore the first day of the year where, on average, correlation with dynamical indices can be expected. The end of the local DRS is then defined as the final day in the last consecutive five day correlation period before August, intending to capture the average timing of the relationship breakdown. Pixels that have fewer than 90 correlation days between November and February, or where start and breakdown days cannot be defined, are considered not significant and are not included in any analysis. This provides us with a mean DRS start and breakdown date for every pixel with significant correlation, encompassing the calendar days when upper-level dynamics on average controlled rainfall over the last three decades. Interannual variability of these dates is not considered here. The aim is to define a local multi-year consensus rainy season, as is more conventionally done by focusing on DJF alone, but that instead allows to consider the full seasonal period when rainfall is sensitive to upper-level dynamics.
2.3. Wet and dry spells
We identify wet and dry spells from the climate hazards group infra-red precipitation with stations (CHIRPS, 0.05∘, conservatively regridded to 0.25∘ resolution) dataset, which provides precipitation estimates from thermal-infrared imagery, calibrated with active microwave retrievals and bias-corrected using gauge observations (Funk et al
2015), and has been found to have good accuracy at regional scale in the Andes as compared to rain gauges and vegetation response (e.g. Segura et al
2020, Hänchen et al
2022). We define the wet and dry spells at 0.25∘ resolution and at  2000 m altitude as contiguous three day, five day and seven day periods with rainfall above (rainy day) and below (dry day) 1 mm day−1, respectively, that occur within the identified local DRSs (c.f. supplementary file figure 2). An absolute rather than relative spell threshold is used here as it is better suited for detection of vegetation responses. By definition, dry spells begin (day0) after a rainy day (day−1), and vice-versa for identified wet spells. For regional-mean analyses, dry and wet spell days are included only if the spell covers at least 15% of pixels in the considered region at spell start.
2.4. Vegetation response
To investigate whether vegetation responds to 3–7 day spells, we use the ESA CCI combined daily soil moisture (SM, 0.25∘) product v6.1, which gives volumetric top-SM (∼0–5 cm) (Dorigo et al 2017, Gruber et al 2019), to quantify the first-order change in plant available water. In addition, daily X-band microwave vegetation optical depth (VOD, 0.25∘) from the global long-term VOD Climate Archive (VODCA) product (Moesinger et al 2020) for 2000–2018 is used to test whether plants respond to the SM fluctuations over spell periods. The VOD product was filtered to remove unphysical day-to-day jumps and vegetation changes associated with surface water dynamics (Harris et al 2022). VOD changes were found to have a close relationship with changes in vegetation water content as well as biomass, where the X-band is the most sensitive to leaf water (c.f. review in Frappart et al 2020).
Finally, as an indicator for photosynthesis activity and physiological vegetation changes, we approximate physiological sun-induced chlorophyll fluorescence (SIF) yield  (Kimm et al
2021, c.f. details in supplementaries).
(Kimm et al
2021, c.f. details in supplementaries).  is approximated by removing effects of canopy structure and radiation variability from the SIF signal (Wang et al
2020). Following previous studies, we define
is approximated by removing effects of canopy structure and radiation variability from the SIF signal (Wang et al
2020). Following previous studies, we define  (Zeng et al
2019, Dechant et al
2022), where NIRv is the near-infrared reflectance of vegetation, and PAR the photosynthetically active radiation. For calculation, we use the four-daily clear-sky daily contiguous SIF (CSIF) v2 dataset (Zhang et al
2018), the daily MODIS 6.1 NBAR dataset (MCD43A4v061) for NIRv calculation, and the daily average Breathing Earth System Simulator (BESS) radiation product for PAR (Ryu et al
2018). The SIF data were linearly interpolated to daily resolution, covering 2004–2018.
(Zeng et al
2019, Dechant et al
2022), where NIRv is the near-infrared reflectance of vegetation, and PAR the photosynthetically active radiation. For calculation, we use the four-daily clear-sky daily contiguous SIF (CSIF) v2 dataset (Zhang et al
2018), the daily MODIS 6.1 NBAR dataset (MCD43A4v061) for NIRv calculation, and the daily average Breathing Earth System Simulator (BESS) radiation product for PAR (Ryu et al
2018). The SIF data were linearly interpolated to daily resolution, covering 2004–2018.
3. Local timing of the DRS
Focusing on the dynamical driver, we first evaluate the pattern of the identified local DRSs across our full analysis domain. Figures 1(a) and (b) reveals significant seasonally-dependent cloud/wind relationships over the full latitudinal extent of the Tropical Andes (0∘–25∘S). In contrast, we find no significant relationship in the adjacent Amazon lowlands (figure 1(b)), suggesting that the sensitivity to the upper-level flow is coupled to orographic effects and induced circulations. Considering seasonal timing, figures 1(a) and (b) reveals a strong north–south gradient in the timing and length of correlation periods, in line with the seasonal movement of the SAM. While regions nearest to the equator show significant cloud/wind co-variability over ten months, with a break in July–August, the relationship is only evident for ∼5 months from November to March in the Southern region. These results illustrate that, while seasonally varying, the rainfall sensitivity to the 200 hPa wind dynamical driver exists across the Tropical Andes region, albeit specifically confined to the mountain range and its vicinity. The identified CTT/wind relationship is exclusively positive, i.e. easterly wind anomalies drive colder clouds (figure 1(c)). In addition, the relationship is strongest in the western Andes and weakens towards the moister eastern slopes, potentially reflecting increased importance of this dynamical driver to allow moisture transport to the drier western Andes. Given our focus on drivers for Andes rainfall, all following analyses only consider pixels with significant upper-level wind correlation that lie above 2000 m altitude (shaded pixels within black contours in figures 1(b) and (c)).
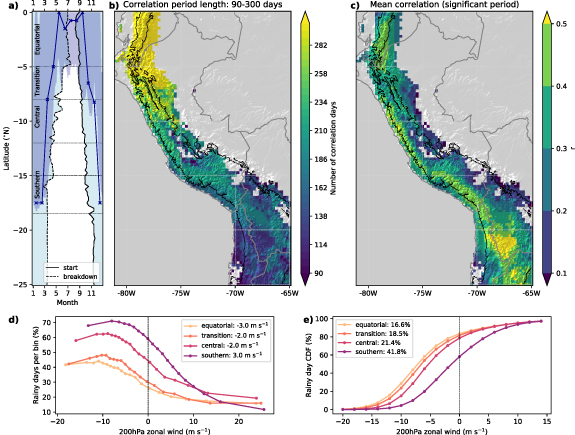
Figure 1. Dynamical rainy seasons (DRS) for 1985–2018. (a) Shows the zonal-median calendar day for the start (solid black line) and breakdown (dashed black line) of the correlation between 200 hPa zonal wind and CTTs, defining the DRS (light blue area). Overplotted are latitudes of zonal-mean three day rolling easterly wind (dark blue shading), and maximum relative rainfall (blue line, % = [mm month−1/mm year−1]), with indicated Tropical Andes sub-regions. (b) Shows the DRS length and (d) the mean DRS correlation coefficient for significant periods ( ). (d) Shows the frequency (%) and (e) the cumulative distribution function (%, CDF) of rainy days (
 1 mm day−1) as a function of pixel-wise co-located 200 hPa zonal wind per sub-region. Legends show (d) climatological mean zonal wind and (e) fraction of rainy days under westerly wind. DRS correlations are calculated for the full domain, with insignificant regions shown grey in (b) and (c). For (a), (d) and (e), only significant DRS pixels
  2000 m altitude (black contour in (b) and (c)) are considered.
Download figure:
Standard image High-resolution imageNext, to explore the relation of the 200 hPa easterly wind inland progression and SAM rainfall seasonality over the Andes, we consider four different latitudinal regions across our Andes domain (figure 1(c)). These are characterised by a temporally bimodal rainfall seasonality in the Equatorial and Transition regions, and a unimodal season in the Central and Southern regions (e.g. Segura et al 2020). This comparison intentionally only covers the regions that experience mean upper-level easterly winds at some point in the seasonal cycle (figure 1(a), dark blue shading), which reach as far south as 18∘S, imposed by the anticyclonic circulation of the well-known BH during the peak monsoon (December–March). However, we find that an anticyclonic circulation can in fact be identified for all months except May–July, positioned in the central Amazon during the transition months before strengthening and moving south-westward to form the BH (cf supplementary file figure 3). Mean upper-level easterly winds over the Andes move with this circulation over the seasonal cycle, and relative maximum rainfall over the Andes occurs co-located with the southernmost boundary of the easterlies (figure 1(a), blue line). This seasonal movement of easterly wind and rainfall is fully contained within our local DRS periods for all regions (figure 1(a), light blue shading), with a break in August when rainfall stays close to the Equator.
We thus showed that we can define a DRS based on CTT sensitivity to upper-level wind conditions, which encompasses the easterly wind and SAM rainfall progression over the Andes (figure 1(a)). Easterly wind anomalies are associated with colder CTTs across all regions, which translates into increased rainy day probabilities (figure 1(d)). However, while from the Equatorial to Central Andes region the mean wind direction during the DRS is easterly, it is on average westerly in the Southern region. Indeed, 17% of equatorial and 42% of southern rainy pixels occur under 200 hPa westerly wind conditions (figure 1(e)), illustrating that prevailing upper-level easterly winds favour rainy days in all regions, but are not a necessary nor a sufficient condition.
4. Atmospheric drivers during wet and dry spells
We now investigate the differences in upper-level wind and Amazon basin moisture conditions between three day wet and dry spells for the local DRSs as identified in figure 1. We first focus on these shortest and most frequent spells, assuming that this allows to detect shorter- as well as longer-lived spell drivers. Figures 2(a) and (b) show the differences between wet and dry spell conditions, composited on the first spell day (day0) at 1000 LT to capture the atmospheric conditions that facilitate spell initiation, aiming to reduce anomaly patterns that are a consequence of rather than a cause for spell development.

Figure 2. Difference between three day dry and wet spell conditions. (a) Day0 differences in 850 hPa specific humidity (shading, g kg−1) and wind, with 0-line contours of 200 hPa zonal wind, where easterly switches to westerly wind (blue: wet, red: dry). Black contour lines indicate regions with +50% and +70% wet-spell rainy days compared to dry, and vertical left/right black bars mark the latitudes of the regions plotted in (b) and (c). (b) Cross-sections of the wet-dry spell difference in specific humidity (shading) and u − w wind. Contours show difference in LLJ meridional wind for the Equatorial to Central Andes, and zonal wind in the Southern Andes. Black horizontal bars indicate regions of increased 200 hPa divergence. Only significant (  ) wet-dry differences are shown. Grey areas indicate Andes topography and white lines the altitude above which spells were detected (
 m). (c) Shows standard deviation-normalised evolutions of 850 hPa specific humidity (light blue), total column water vapour (TCWV, dark blue), 850 hPa wind speed representing the LLJ (yellow) sampled along the eastern foothills (vertical lines in (b)) and 200 hPa zonal wind over the Andes (green) during wet spells, expressed as the difference to conditions on day−4.
Download figure:
Standard image High-resolution imageThe spatial differences between day0 wet and dry spell conditions in figure 2(a) reveal similar patterns across the regions: During wet spells, 850 hPa northerly wind and atmospheric moisture are significantly increased along the eastern slopes of the Andes bordering the respective spell region. Notably, there is no dominant large-scale low-level moisture increase in the Amazon basin in any of the regions, suggesting that the positive lowland moisture anomalies preceding Andes wet spells are critically fostered by the low-level flow encountering the topographic barrier. In the Central and Southern regions, this is accompanied by a tendency for 200 hPa easterly winds reaching further south, while there is little to no difference in easterly wind position for the Equatorial and Transition regions. However, the regional cross-sections in figure 2(b) show significantly enhanced upper-level divergence (black bars) positioned over the mountain range for all regions, indicating enhanced lifting. At the same time, the northerly wind associated with the South American low-level jet (LLJ) along the Andes eastern slopes is strengthened, partly due to a downward expansion compared to dry spell conditions (supplementary file figure 4). In line with figure 2(a), increased low-level humidity is maximised at the Andes foothills, and follows the eastern slopes with a secondary peak in anomalous humidity between 500 and 600 hPa stretching from the east over the Andes crest (figure 2(b)). In all regions, three day wet spell initiation is hence associated with increased low-level moisture within the LLJ and lifting along the eastern slopes, with apparent convective moistening of the mid-levels. The latter is further strengthened for seven day spells, and patterns remain similar when instead of spell differences, spell anomalies from a seasonal climatology are considered (supplementary file figure 4).
The temporal evolution of three day wet spells in figure 2(c) shows similarities between regions, with 200 hPa easterly wind anomalies gradually increasing over a period of 4–6 days, covering start and end of the spell (green lines). The increase in low-level moisture (light blue) at the Andes eastern slopes similarly starts before the spell, but peaks on days , accompanied by the strengthening of the northerly LLJ (yellow lines). This increase precedes a co-located increase in total column water vapour (TCWV, dark blue), indicating the moistening of the mid-levels on day0, which continues throughout the wet spell. This suggests that in addition to favourable upper-level wind conditions, low-level moisture injection into the latitudinal band of the wet spell during periods of a strengthened LLJ is of importance and a common feature across regions for their development.
4.1. Contribution of dynamic and thermodynamic drivers
To further quantify the control of Andes basin moisture as compared to upper-level wind conditions, we bin daily regional-mean Andean rainfall ( 2000 m) as a function of 200 hPa zonal wind as well as Andes' foothill TCWV (calculated from between the vertical lines in figure 2(b)) in figure 3. For all regions, average rainfall intensities increase with stronger easterly wind and higher TCWV, which together explain 67% (Equatorial) to 83% (Southern) of the binned rainfall variability. However, while the scaling rate of daily rainfall with zonal wind is very stable across regions with 0.12–0.14 mm per m s−1, rainfall scales at a rate of 0.35–0.38 mm per mm TCWV only from the Equatorial to Central region, while it drops to 0.19 mm in the south. This may be linked to the considerably lower mean relative humidity of ∼64% at 550 hPa in the Southern region, implying a higher necessary increase in moisture for a similar increase in precipitation compared to the equator-ward regions (71%–74% mean relative humidity). In line with that, the differences in average wind and TCWV values between same-length dry and wet spells are most pronounced in the Southern region (red and blue markers in figure 3(a)). Notably, however, wet spells in all regions show an increase in upper-level easterly wind as well as in Andes foothill TCWV compared to dry spells.

Figure 3. Thermodynamic and dynamic contributions to rainfall. (a) Binned average daily rainfall intensity as a function of 200 hPa zonal wind (m s−1, x-axis) and TCWV (mm, y-axis). Variables are averaged over the regions' latitudes (c.f. figure 1(c), with zonal wind sampled where topography  m, while TCWV is averaged at eastern foothills (figure 2(b), between vertical lines). White dots mark conditions that include 80% of all days. Multi-variate regression results (title) are based on the plotted binned-average values. Crosses indicate average zonal wind and TCWV day0 conditions for three, five and seven day wet (light, medium, dark blue) and dry (light, medium, dark red) spells with standard deviations (whiskers). (b) Estimates TCWV and zonal wind (u) contributions to regional rainfall differences between wet and dry spells (Δ) by scaling ΔTCWV and
  with respective regression coefficients from (a). Contribution is defined relative to the combined rainfall change [
 ], with 0% indicating same contribution (50%–50%) and negative values signifying higher TCWV contribution.
Download figure:
Standard image High-resolution imageWe now want to estimate the separate contribution of TCWV and wind changes to regional rainfall changes for wet and dry spell situations. For that, we first calculate the day0 differences between same-length wet and dry spells for TCWV and 200 hPa zonal wind, which we translate into rainfall changes using regression coefficients from figure 3(a). The result is presented in figure 3(b), showing the contribution difference between wind and TCWV (Δ%) relative to the combined ( ) rainfall change, i.e. 0% indicates equal contribution from both drivers. Across the four regions, we find TCWV changes to dominate rainfall changes for three day spells, with a contribution of more than 90% in the equatorial region. Upper-level wind changes gradually increase in importance for longer spells over 5–7 days, reaching a maximum contribution of 58% in the Southern region. When considering these relationships since the 2000s, the contribution of TCWV increases further in all regions (supplementary file figure 5), in line with previously suggested increases in thermodynamic driver importance for recent decades in the Southern Andes (Segura et al
2020). Overall, the increase in wind contribution going from 3- to 7-day spells may reflect the synoptic time scale to which the upper-level wind changes are linked and is in line with the temporal spell evolution in figure 2(c), where the upper-level wind anomalies are longer-lived than anomalies in atmospheric moisture and may represent a synoptic constraint on maximum spell length.
) rainfall change, i.e. 0% indicates equal contribution from both drivers. Across the four regions, we find TCWV changes to dominate rainfall changes for three day spells, with a contribution of more than 90% in the equatorial region. Upper-level wind changes gradually increase in importance for longer spells over 5–7 days, reaching a maximum contribution of 58% in the Southern region. When considering these relationships since the 2000s, the contribution of TCWV increases further in all regions (supplementary file figure 5), in line with previously suggested increases in thermodynamic driver importance for recent decades in the Southern Andes (Segura et al
2020). Overall, the increase in wind contribution going from 3- to 7-day spells may reflect the synoptic time scale to which the upper-level wind changes are linked and is in line with the temporal spell evolution in figure 2(c), where the upper-level wind anomalies are longer-lived than anomalies in atmospheric moisture and may represent a synoptic constraint on maximum spell length.
5. Importance of 3–7 day spells on the ground
We now examine the importance of the multi-day spells on the ground by considering SM and vegetation responses. Feldman et al (2021) found rapid VOD increases 0–1 days after a rainfall pulse in wet regions, with subsequent drying along with SM. They linked this to immediate plant rehydration while slower responses, mostly in dry regions, may reflect vegetation growth. Figure 4(a) first illustrates the direct response of SM to wet and dry spells by compositing and averaging 24-day timeseries around the local per-pixel spells for each region (Northern = Equatorial + Transition regions) from which the climatological seasonal cycle is subtracted. The anomalies, depicted as deviations from day−2 before spell start, illustrate an SM signal of within ±1.5%–2% for the seven day wet and dry spells in all regions, a deviation from an average SM of 26%–27% for all regions. Any response in the vegetation metrics VOD and physiological SIF yield  (figures 4(b) and (c)) generally co-occurs immediately with SM on day0 of each spell. However, compared to SM, VOD and
  show clearer inter-regional differences.

Figure 4. On-the-ground effect of 3–7 day spells. Evolution of average (a) soil moisture (SM), (b) vegetation optical depth (VOD) and (c) relative physiological SIF yield ( in %, relative to climatology) anomalies for individual regions (
 m) shown as difference to day−2 conditions. Dashed vertical lines indicate the last spell day. The calendar-day climatology is removed from each spell timeseries before averaging. The Northern region is combining the Equatorial and Transition regions and titles are showing the climatological regional maximum–minimum annual change (Δannual) for reference.
Download figure:
Standard image High-resolution imageVOD responses are weak in the humid Northern region (figure 4(b)) and correlation between SM and VOD is non-existent (supplementary file figure 6), suggesting that the spells have limited effect on vegetation water content here. Correspondingly, the  signal remains noisy and is not affected by wet spells in this region. In the semi-arid Southern region on the other hand, we find a larger increase in VOD during wet spells and a more pronounced drying over the dry spells, reaching 0.016 and −0.012 over seven days, respectively, which, in terms of magnitude, corresponds to ∼24% of the average seasonal change in VOD in this region (annual ΔVOD = 0.05). In the Central and Southern region, the physiological signal from
  agrees with the VOD signal, implying that both vegetation structure and physiology respond to 3–7 day wet and dry spells. In all regions, anomalies rebound and stabilise after 2–3 days after spell end, suggesting that spell effects are short-lived, even for seven day spells. However, prolonged increase in VOD after the wet spells and decrease after dry spells beyond that timeframe in the Southern region, and to a lesser degree in the Central region, may suggest biomass buildup and loss, respectively, continuing beyond the pure plant hydration signal. This indicates that, in line with the climatological differences of these Andean regions, wet and dry spells seem to have the most important and longest-lasting effects on vegetation in the drier, semi-arid Central and Southern regions, reaching more than 20 days.
6. Discussion and conclusion
Based on 33 years of reanalysis and remote sensing data, we examined the control of upper-level wind and Amazon basin moisture on 3 to 7 day wet and dry spells across four different zones in the Tropical Andes and quantified their contribution to regional rainfall during the SAM. This was motivated by our relatively extensive knowledge on drivers of interannual rainfall conditions in the Southern Tropical Andes (Altiplano region). In particular, the Amazon basin was previously suggested as crucial moisture source for wet periods in the Southern region, with enhanced moisture advection linked to upper-level easterly winds controlling the majority of interannual rainfall variability (Garreaud et al 2003, Thibeault et al 2012). Here, we show that this rainfall sensitivity to upper-level winds exists on a multi-day basis across the entire Tropical Andes, however with pronounced seasonal dependence in line with the progression of the SAM. We found easterly wind anomalies to accompany wet spells in all regions compared to dry spells. However, in the mean, light westerly winds prevail in the Southern region even during 3–5 day wet spells. Indeed, we find 42% of wet days to occur under upper-level westerlies in the Southern region. On the other hand, mean winds are easterly for seven day wet spells, suggesting that the most intense and wider-spread wet spells are likely associated with mean easterly winds even in the Southern region, as was found for intense wet periods by Falvey and Garreaud (2005) and is in line with findings on the interannual timescale for the Altiplano (Garreaud and Aceituno 2001, Vuille and Keimig 2004).
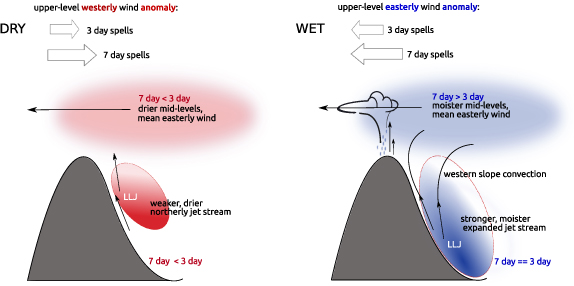
This is summarised in figure 5, which furthermore highlights our findings on the importance of positive low-level moisture anomalies along the Andes foothills at wet spell start in all regions. The moisture anomaly is accompanied by a surface-ward expansion and strengthening of the South American LLJ, tapping into moisture that is lifted above the Andes crest level by convection along the eastern slopes. As a consequence, Amazon basin mid-level moisture gradually increases over wet spells. During dry spells on the other hand, the LLJ is weaker, holds a lifted position and air masses at both low- and mid-levels are significantly drier. By quantifying rainfall changes as a function of upper-level wind and Amazon basin moisture, we find moisture to dominate three day wet spells with a maximum in the Equatorial region of 91% contribution to mean rainfall, while upper-level wind control increases for 5–7 day wet spells. These results indicate that while moisture changes along the eastern Andes slopes dominate rainfall changes on daily time scales associated with three day spells, upper-level dynamics play a more important role at the synoptic time scale of 5–7 day spells. This is true in particular in the Southern region, where upper-level wind conditions are less frequently favourable for moisture advection and where wind changes thus contribute 55%–58% to mean rainfall changes. Considering effects on the ground, the immediate effect of 3–7 day spells on vegetation remain short lived, visible to ∼2 days after spell end in all regions. However, prolonged changes after 5–7 spells in the Central and Southern Tropical Andes with increased VOD/ after wet and decreased VOD/
 after dry periods out to day 20 after spell start suggest potential effects on vegetation growth, which shows the importance of spells at these timescales and may also translate into crop growth sensitivity in these semi-arid regions.
Figure 5. Schematic of wet and dry spell characteristics. Dry spells (left) are associated with upper-level (200 hPa) westerly wind anomalies (thick arrows), which are stronger for seven day than for three day dry spells. The opposite holds for wet spells (thick arrows on right), where easterly anomalies prevail that are strongest for seven day spells. Mid-levels are drier (red shading) for seven day than three day dry spells, while they are wetter for seven day than three day wet spells (blue shading). Winds remain easterly at mid-levels at all times (thin horizontal arrows). During dry spells, the northerly LLJ core is elevated, weak and dry (red ellipse), which is more pronounced for seven day dry spells. For wet spells, the stronger jet core reaches further towards the low-levels (blue ellipse), with a positive low-level moisture anomaly that is approximately similar for 3–7 day spells. Orographic lifting and convection along the eastern slopes contributes to moister mid-levels (vertical thin arrows).
Download figure:
Standard image High-resolution image
Our findings highlight strong similarities in drivers of wet and dry periods across all of the Tropical Andes, and emphasize the need to consider both dynamic and thermodynamic changes when evaluating effects on Andes rainfall. For the Southern Tropical Andes, Segura et al (2020) already identified increased southward moisture transport via the LLJ and associated mid-level moistening as an important and independent driver of rainfall trends there. This renders future rainfall predictions exclusively based on upper-level wind changes (e.g Minvielle and Garreaud 2011, Neukom et al 2015) questionable, particularly considering likely increases in TCWV with higher future temperatures, which may be able to buffer easterly wind weakening. Emerging multi-decadal convection-permitting simulations for the region will help to better quantify in particular contributions from moisture transport and changes therein, which requires both improved representation of topography and of convective processes, both of which current coarse-scale climate models cannot sufficiently capture.
Acknowledgment
The research leading to these results was conducted within the AgroClim-Huaraz project (https://agroclim-huaraz.info/), which received funding from the Österreichische Akademie der Wissenschaften. CK also acknowledges funding from the NERC-funded LMCS project (NE/W001888/1). We thank the providers of key data sets used here. GRIDSAT-1B is available from www.ncdc.noaa.gov/gridsat, ECMWF ERA5 reanalysis data is available from the Copernicus Data Store (https://cds.climate.copernicus.eu/), CHIRPS data are available from www.chc.ucsb.edu/data/chirps, VOD data from https://doi.org/10.5281/zenodo.2575599, soil moisture data from www.esa-soilmoisture-cci.org/v06.1_release, BESS data (for PAR) from www.environment.snu.ac.kr/bess-rad, CSIFv2 (for SIF) data from https://osf.io/8xqy6/ and MODIS MCD43A4v061 (for NIRv) data were acquired via AppEEARS https://appeears.earthdatacloud.nasa.gov/. Special thanks go to the providers of the python packages matplotlib/cartopy, xarray, salem, scipy, metpy, and their dependencies.
Data availability statement
No new data were created or analysed in this study.
Author contributions
CK and FM conceptualised the study, with input from EP and CJ. All authors contributed to the methodological design, analyses were conducted by CK and LH, and data was provided by BH. CK led the writing of the manuscript with contributions from all authors.
Supplementary data (7.5 MB PDF)