
Abstract
Increasing crop productivity while simultaneously reducing the environmental footprint of crop production is considered a major challenge for the coming decades. Even short episodes of heat stress can reduce crop yield considerably causing low resource use efficiency. Studies on the impact of heat stress on crop yields over larger regions generally rely on temperatures measured by standard weather stations at 2 m height. Canopy temperatures measured in this study in field plots of rye were up to 7 °C higher than air temperature measured at typical weather station height with the differences in temperatures controlled by soil moisture contents. Relationships between heat stress and grain number derived from controlled environment studies were only confirmed under field conditions when canopy temperature was used to calculate stress thermal time. By using hourly mean temperatures measured by 78 weather stations located across Germany for the period 1994–2009 it is estimated, that mean yield declines in wheat due to heat stress during flowering were 0.7% when temperatures are measured at 2 m height, but yield declines increase to 22% for temperatures measured at the ground. These results suggest that canopy temperature should be simulated or estimated to reduce uncertainty in assessing heat stress impacts on crop yield.
Export citation and abstract BibTeX RIS

Content from this work may be used under the terms of the Creative Commons Attribution 3.0 licence. Any further distribution of this work must maintain attribution to the author(s) and the title of the work, journal citation and DOI.
1. Introduction
As sustainably meeting increasing world food demand is a major challenge for humanity [1–3], it is important to understand factors constraining crop yields and resource use efficiency. Evidence of the negative impact of heat stress on major world food crop yields is considered increasingly robust. Formerly studied in climate chambers or plastic tunnels controlling temperature during crop growth [4–9], the negative impacts of heat stress on yield has recently been confirmed for actual production conditions at large spatial scales by the interpretation of field trials, statistical analyses of large scale observational datasets and the application of crop models [10–20].
Heat and drought have multiple, negative impacts on crop yields, including reducing leaf photosynthesis and enhancing leaf senescence rates. More critically for yield determination, however, are the reported effects of decreasing grain number when heat stress occurs before or around anthesis and reduced grain weight when it occurs during grain filling [6, 21–24]. While drought represents a process that develops and intensifies slowly, heat stress can occur very abruptly and even short episodes of high temperature can cause a severe decline in grain yields. This reality that both heat stress and drought occur together, makes it difficult to assess the unique impact of heat stress on crop yields under field conditions and bares the risk of confounding effects [23]. Previous work, has used statistical methods to analyze the relationship between high temperature and crop yields for different crops and regions [15, 20], though such methods are not able to identify nor explain the specific processes responsible for yield losses [16, 25]. Process-based crop models are increasingly used to quantify the impact of heat and drought on crop yield but differ with respect to the stresses and processes considered [26–28]. A remaining challenge is to implement relationships into crop models describing the impact of heat stress around flowering [29, 30]. Reported relationships between heat stress and grain yield or grain number indentified under controlled environment conditions may not hold under field conditions as temperatures in the canopy close to the flowers may diverge considerably from weather station measurements [31], where air temperature is typically measured above a grass canopy at 2 m height. Further, the degree of deviation of canopy and flower temperatures from weather station measurements is likely dependent on crop type, cultivar and crop management. As such, the uncertainties in assessments of heat stress impacts on crop yield due to air temperature measurements are not well reported. The objectives of this study were (i) to determine differences between air temperature at 2 m height and canopy temperature under field conditions, (ii) to evaluate the relationship between stress thermal time around flowering calculated from temperatures measured at different heights and grain number or grain yield, and (iii) to estimate the uncertainty in heat stress assessments caused by the missing information on canopy temperature. The study was performed in Germany but the findings are of general relevance for cereal cultivation in temperate regions.
2. Materials and methods
2.1. Experimental setup to determine differences between canopy temperature and air temperature above the canopy
To determine the range of differences between canopy temperature and air temperature under field conditions, temperature was measured in 1920 rye plots on field trials of KWS LOCHOW GmbH located at Wohlde (52.80 °N, 10.02 °E, 80 m a.s.l.) in northern Germany on 30th of May 2012 (anthesis). Canopy temperature Tc was measured by two infrared radiometers (Campbell IR 120) fixed to a carrier at 50 cm on average above the canopy while air temperature T350 was measured using a band-gap temperature sensor (Campbell CS 215) at 350 cm above ground or about 250 cm above the rye canopy (figure 1, SI figure 1(a)). The test site consisted of 480 inbred lines and hybrids of rye grown under rainfed and irrigated conditions on loamy or sandy soil in 2 replications (1920 test plots, SI figure 1(c)) and accounted therefore for a considerable part of the heterogeneity in varieties, soils and water management as observed under real field conditions. The test plots of 1.25 m times 4 m size were arranged in a rectangular setup with gaps of 0.1 m between the plots. Measurements were conducted under clear sky conditions in the period 10 AM to 2 PM. Plant height varied between 70 cm and 150 cm with the majority of plants with a height of about 115 cm (irrigated) and 95 cm (rainfed). In addition, air temperature (T200), humidity, wind speed and global radiation were measured at 200 cm height above ground on a grass canopy by a nearby standard weather station. Temperatures measured at the standard weather station at 200 cm height were in good agreement to the measurements taken at 350 cm height at the rye fields but on average 0.6 K lower during the measurement period (SI figure 1(b)). Mean wind speed during the measurement period was 2.0 m s−1, global radiation ranged between 526 W m−2 and 969 W m−2 and relative humidity between 40% and 54%. The soil properties differed between an area in the southeast characterized by sandy soil texture (Su3, 69% sand, 26% silt, 5% clay) and a loamy part in the northwest (Su4, 53% sand, 41% silt, 6% clay). Soil water content was measured by an FDR probe (Sentek Diviner 2000) to a depth of 85 cm (measurements every 10 cm, 8 different depths) for 19 loamy rainfed plots, 20 loamy irrigated plots, 12 sandy rainfed plots, and 20 sandy irrigated plots. Mean plant available water content in the root zone was 17% for the rainfed sandy soil, 24% for the rainfed loamy soil, 67% for the irrigated sandy soil, and 59% for the irrigated loamy soil. The experiment at Wohlde was however not suitable to test relationships between temperature measured at different height and grain number or grain yield because the temperature differences were measured on one day only.

Figure 1. Schematic illustration of the temperature measurements used in this study. Tc is canopy temperature in rye measured by two infrared radiometers placed about 50 cm above the canopy while the other measurements refer to air temperature measured at a height of 350 cm (T350), 200 cm (T200), 20 cm (T20) above ground or at the ground (Tg).
Download figure:
Standard image High-resolution image2.2. Impact of heat stress on winter wheat grain number and yield
We tested the relationship between stress thermal time around anthesis STT (°C minutes), computed as the accumulated temperature sum above a threshold of 31 °C [6], and grain number per ear or grain yield at winter wheat variety trials in Saxony (Eastern Germany) during period 2001–2011. The trials, performed by the State Office of Environment, Agriculture and Geology of the federal state of Saxony (http://www.smul.sachsen.de/lfulg), are designed to test the performance of cultivars registered for commercial growing in Germany at test sites representing the range of climate and soil conditions found in this federal state. Annual reports have been available for the period 2001–2011 and contained data for 7 test sites in Saxony. The number of varieties tested in these trials varied between locations and years with a minimum of 37 cultivars grown in year 2009 and a maximum of 45 cultivars tested in year 2005. For each year and test site the mean of cultivar specific heading dates, grain number per ear and grain yield was computed from the observations. While heading date and grain yield was available for every year, data on grain number per ear were missing for the years 2004 and 2011. Hourly mean of air temperature measured by agro-climatic stations at the variety test sites at 20 cm height (T20, °C) and at 200 cm height (T200, °C) were extracted from the database of the agro-meteorological service of the state of Saxony [32]. The automated weather stations were placed above a short grass canopy. The sites Christgrün (50.58 °N, 12.21 °E, 430 m), Nossen (51.06 °N, 13.27 °E, 255 m), and Roda (51.05 °N, 12.62 °E, 224 m) were selected for further analysis because there was complete data coverage for both, weather data and crop data, within the period 2001–2011. The soil type at the test sites was sandy loam (Christgrün) or loam (Nossen, Roda). Long-term annual precipitation sum was 722 mm yr−1 at Christgrün, 711 mm yr−1 at Roda and 643 mm yr−1 at Nossen, while long-term annual mean temperature was 7.4 °C at Christgrün, 8.6 °C at Roda and 8.1 °C at Nossen. Stress thermal time STT (°C minutes) was computed from hourly mean temperature Th (°C) measured at 20 cm height (STT20, °C minutes) and at 200 cm height (STT200, °C minutes) by accumulating temperature sums above a threshold Tcrit set to 31 °C for an 18-day period starting at the day of heading:

Experiments undertaken before in climate chambers or plastic tunnels showed that temperatures above this threshold cause a reduction of grain number and grain yield of wheat [6, 33]. The length of the period around flowering in which heat stress was applied was 5–12 days in some experiments [5, 34] but other reports indicate that the sensitive period may be longer [24, 35, 36]. Teixeira et al [36] for example, assumed a thermal-sensitive period of 30 days centered in the mid-point of the reproductive phase. To account for the cultivar differences in heading date and the typical length of the period between heading and flowering at the test sites it was decided to use a constant sensitive period of 18 days for this study. STT20 and STT200 was then compared to mean grain number per ear and relative yields Yrel (-) computed as ratio between the yield in a specific year and maximum yield observed at the research site during the period 2001–2011.
2.3. Uncertainty of heat stress impact around anthesis on winter wheat in Germany
To estimate the uncertainty in STT arising from unknown canopy temperatures for other locations in Germany, we computed STT around flowering of winter wheat by using hourly mean temperatures measured at the ground (Tg , °C) or at 200 cm height (T200, °C) for 78 weather stations located across Germany and period 1994–2009. We estimated the corresponding relative crop yield by applying an equation obtained from data collected under a controlled environment

where Yrel-heat was grain yield reduced by the effect of heat stress around flowering [37]. Tg and T200 were extracted from a database providing observations for all weather stations that are maintained by the German Meteorological Service [38]. We selected 78 weather stations located on—or close to—areas classified as cropland according to the Corine land cover classification 2006 [39] with complete data coverage for the thermal sensitive phase around flowering (18 days starting with heading of winter wheat) within the period 1994–2009 and calculated stress thermal time at 200 cm height (STT200, °C min) and stress thermal time at the ground (STTg , °C min). Heading day at each weather station and each year was calculated by linear interpolation (inverse distance weighting method with 12 neighbours and power of 2) of phenological observations provided by the WebWerdis database [38]. The observations of the beginning of heading of winter wheat extracted from the data base of the German Meteorological Service were first filtered to exclude potential outliers or suspect data from the analysis [40]. The number of heading day observations used as input into the interpolation after application of this filtering procedure varied between 502 in year 2007 and 1373 in year 1995. From the STT computed at the 2 different heights, 78 stations and the period 1994–2009 we then computed the annual mean across observation sites and the mean across years for each station. In addition, the frequency of years with heat stress around flowering of winter wheat was compared.
3. Results
3.1. Comparison of canopy and air temperatures measured at anthesis
Canopy temperature Tc was 19.5 °C–33.5 °C while air temperature measured above the rye canopy T350 varied between 22.0 °C and 26.0 °C (figure 2(a)). In irrigated treatments, Tc was on average 2 °C lower than T350 while in rainfed treatments Tc was up to 7.5 °C higher than T350. The difference between Tc and T350 was mainly controlled by soil moisture (figure 2(a)) and net radiation (figure 2(b)). On sandy rainfed plots, which had the lowest soil moisture content, Tc was higher than T350 for almost all measurements. The temperature difference was low in the morning hours with low net radiation and increased then to 3–7 °C in the hours with the highest sun elevation and highest net radiation (figure 2(b)). The critical temperature threshold of 31 °C reported for wheat and other temperate cereals [5, 6, 41], was already surpassed at a T350 of about 25 °C (figure 2(a)). In contrast, Tc was lower than T350 for almost all measurements at irrigated plots with largest differences of up to 6 °C in the morning hours (figure 2(b)). In the period around midday with net radiation between 400 and 700 W m−2, the temperature difference at irrigated plots was 0–2 °C (figure 2(b)). Under irrigated conditions, the canopy temperature Tc was always lower than 26 °C and thus well below the critical threshold of 31 °C.
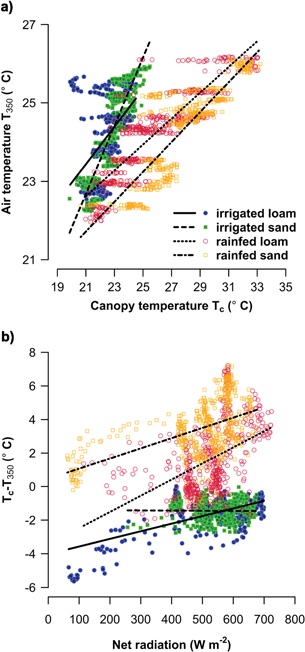
Figure 2. Relationship between air temperature 350 cm above ground T350 and canopy temperature Tc (a) and between the difference Tc − T350 and net radiation at the time of measurement (b) in irrigated (filled symbols) and rainfed (unfilled symbols) treatments, for sandy (squares) and loamy (circles) soil. Measurements are shown for 1920 test plots of 480 inbred lines and hybrids of rye at Wohlde (Germany) on 30 May 2012 (flowering). Regression lines: loamy irrigated (solid), sandy irrigated (dashed), loamy rainfed (dotted), sandy rainfed (dotdashed). Depending on plant height, T350 was measured 200–280 cm above the canopy.
Download figure:
Standard image High-resolution image3.2. Relationship between stress thermal time and grain yield
The decline in grain number per ear with increasing STT, reported from experiments under controlled conditions [5, 22, 41], was reproduced well when temperatures measured at 20 cm height were used to compute STT (figure 3) while there was no relationship when standard air temperature measurements at 200 cm height were used (figure 3). A similar result was obtained when STT was related to relative crop yield (SI figure 2), which indicates that the decline in grain number caused by heat stress around anthesis was not compensated for in later growing stages. T20 at the three sites in Saxony was up to 7 °C higher than T200 with annual means of the temperature difference of 1.0–4.7 °C in periods with a T20 larger than 31 °C (SI figure 2). Consequently, STT20 was much higher than STT200 (figure 3 and SI figure 2). Air temperature in the period around anthesis of winter wheat exceeded 31 °C in 5–7, depending on the site, out of 12 years when it was measured at 20 cm height but only in 2–3, depending on the site, out of 12 years when it was measured at 200 cm height (SI figure 2). Linear trends of relative yield on STT20 were in good agreement to relative yield calculated by applying equation (2) which was derived from experiments under controlled conditions [37]. The slope of the trend lines for the three sites in Saxony, indicating the yield reduction per °C minutes of STT, was −0.000 134 for Christgrün, −0.000 224 for Nossen, and −0.000 335 for Roda.

Figure 3. Relationship between mean grain number per ear and stress thermal time calculated from hourly temperature measurements at 20 cm height STT20 (°C min) and at 200 cm height STT200 (°C min) of winter wheat at three sites in Saxony (Germany). Stress thermal time was computed for a period of 18 days starting at heading of winter wheat by using a temperature threshold of 31 °C, only years with heat stress during flowering (stress thermal time > 0 °C min) are shown.
Download figure:
Standard image High-resolution image3.3. Uncertainty in estimates of heat stress impact on wheat yield from air temperatures
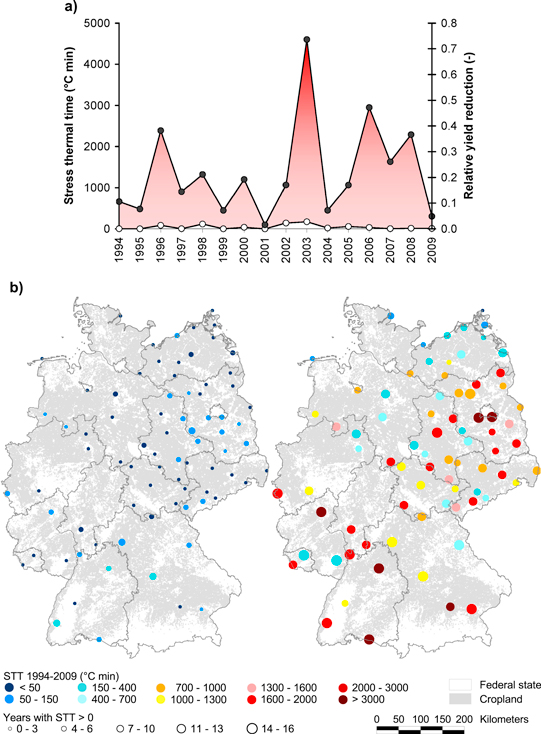
We found that mean STT across all stations and years was only 44 °C min when temperature measurements at 200 cm height were used but 1366 °C min when temperature was measured at the ground, with corresponding declines in crop yield estimated by 0.7% and 22.4%, respectively. The mean number of years with heat stress across all stations was 2.8 (out of 16 years) when temperature at 200 cm height was used but 11.1 when temperature was measured at the ground (figure 4). Inter-annual variability in STT was large with the highest STT computed for year 2003 and the lowest in year 2001. The relative yield reduction due to heat stress estimated for year 2003 was 75% when using data for temperature measured at the ground and 3% when temperature measured at 200 cm height was used (figure 4(a)). In addition, we found large spatial differences in STT with almost no heat stress along the coastline and in higher altitudes and hot spots of heat stress with highest STT in the river valleys in Southern Germany and in the lowlands of the southern part of Eastern Germany (figure 4(b)). In contrast to the large uncertainty in the magnitude of STT, its spatial pattern was found to be in good agreement to means of daily maximum temperature in months May and June, measured at 200 cm height (figure 4(b), SI figure 3).
Figure 4. Stress thermal time (STT) during flowering of winter wheat at 78 weather stations across Germany in the period 1994–2009 (°C minutes). Mean STT across sites and respective mean relative yield reduction according to Ferris et al (2000) [37] computed from hourly temperatures measured at 200 cm height T200 (open circles) and temperature at the ground Tg (filled circles) (a), mean STT across years and number of years with a STT > 0 computed from T200 (left) or Tg (right) (b).
Download figure:
Standard image High-resolution image
4. Discussion
Due to the thermal gradient in the canopy and typical crop heights of German winter wheat between 70 cm and 100 cm, STT computed by using ground temperature measured in a short grass canopy (e.g. used in section 3.3) will likely represent an overestimate while using air temperature measured at 200 cm height will underestimate STT and corresponding yield losses, as shown in the previous section. According to the German agricultural statistics [42], the lowest winter wheat yield in period 1994–2009 was recorded in year 2003 (6.55 t ha−1) representing a 20% decline to the highest yield reported for year 2004 (8.21 t ha−1), while mean yield reduction across all sites due to heat stress estimated in this study for year 2003 was 75% when using data for Tg and 3% when T200 was used (figure 3). However, the weather stations, considered in section 3.3, were selected based on the completeness of hourly temperature data resulting in dense station coverage in heat affected regions of Germany but low station coverage in the more humid and less heat affected north-western part of Germany (SI figure 3). Therefore the derived stress thermal time and corresponding yield reduction may not be representative for the whole wheat growing area of Germany.
Heat stress with a canopy temperature of more than 31 °C typically occurs in the early afternoon on warm days with clear sky. Standard weather stations are placed on a short grass so that the ground will heat up in this period resulting in a temperature gradient of high temperature at the ground (Tg ) to lower temperature at 200 cm height (T200) and intermediate temperature at 20 cm height (T20) which is also reduced by the cooling effect of transpiration of the grass vegetation. The results presented in sections 3.2 and 3.3 suggest that T20 measured on grass might be a better indicator of heat stress in wheat than T200 or Tg . Unfortunately, T20 is only measured by agro-meteorological stations in Germany so that the data coverage for regional scale analyses is very limited.
Our results from the field experiment at Wohlde (section 3.1) show that canopy temperature can differ substantially from the temperature measured at 200 cm height, which is typically used to assess the impact of the heat stress on agricultural crops. This is consistent to results of previous research [13, 43, 44]. The magnitude of the difference between these temperatures depends on weather variables like incoming radiation, wind speed or humidity, on canopy properties like canopy roughness, plant height or LAI, and on actual soil moisture [13, 43, 44]. Under rainfed conditions, that are typical for Germany, we propose that the impact of heat stress during flowering would be underestimated for major cereals like rye and wheat when air temperature measured at 200 cm height was used.
We suggest that crop models should be improved by simulating canopy temperature instead of relying on 200 cm air temperature measured at standard weather stations. An alternative might be to use surface temperatures derived by satellite imagery [45]. Interestingly, remote sensing products are used to predict patterns of actual evapotranspiration and corresponding drought stress based on differences in surface temperature, e.g. by using the SEBAL or METRIC methods [46–48]. However, currently available sensors do not have the temporal and spatial resolution required for heat stress assessments at field scale but may be used to determine the soil moisture status around flowering at large extent. Because of the dependency of canopy temperature on soil moisture this information may be well suited to inform models simulating canopy temperature.
Another alternative to account for the difference between canopy temperature and 200 cm air temperature may be to use air temperature measured at 200 cm height but to reduce the critical temperature threshold determined by pot experiments under controlled conditions (Tcrit in equation (1)) when calculating the heat stress effect. Previous heat stress assessments performed at the large scale used a wide range of thresholds for the critical temperature when heat stress starts, e.g. for wheat a range of 27–31 °C when daily maximum temperatures were considered [5, 14, 49] or lower thresholds of 22–28 °C when mean daytime temperature or mean temperature in a season were considered [18, 36]. Reducing the temperature threshold in the calculation of stress thermal time represents however a simplification which does not account for the soil moisture status and other impacts on canopy temperature and will thus tend to produce less precise results. We demonstrate this by comparing STT20 calculated with a temperature threshold of 31 °C and STT200 with a threshold ranging between 27 °C and 31 °C for the site Christgrün (SI figure 4). To derive a STT200 similar to STT20 it would be required to reduce the temperature threshold in the STT200 calculations at this location from 31 °C to 27 °C. The coefficient of determination r2 is then, however, lower because a high STT200 and corresponding yield loss is calculated for two years when using this temperature threshold although STT20 and observed yield loss in these two years was small (SI figure 4). This may point to the effect of other factors such as soil moisture on canopy temperature which are less important for air temperature at 200 cm height.
The strong interaction between heat and drought, implied by our results, indicates that the impact of these stressors needs to be assessed in future research simultaneously. Because soil moisture was not measured at the agro-climatic stations in Saxony, we cannot exclude that there was also some drought stress in years with heat stress around flowering at the sites used here to analyze heat stress effects on grain number and grain yield (section 2.2). This could also explain the different slopes of the trends shown in SI figure 2. However, because of the suitable soil texture at the sites in Saxony, a high water storage capacity can be expected which facilitates storage of winter rains. Therefore drought stress should be less frequent in the spring season when flowering typically occurs in Germany. Our measurements at the site Wohlde showed that the magnitude of heat stress differed for the same temperature measured at the weather station at 200 cm height depending on the soil moisture status (figure 1(a)). Similarly, the exposure to drought stress is assumed to be higher on hot days with a high evaporative demand of the atmosphere as compared to colder days, even when the soil moisture content is the same [50, 51]. Previous research indicated that also the effects of heat and drought stress on grain yield are hypo-additive, the effect of combined stress was higher than the individual effects but lower than their sum [7]. In regional assessments it will therefore become very difficult to disentangle occurrence and effects of heat and drought, in particular when these stresses occur more than once in a growing season. Here it may be suggested to define a two dimensional stress function describing effects of heat and drought simultaneously. Alternatively, crop models should be able to account for these different mechanisms and possible interactions. Another implication of our results is that increased soil moisture (and corresponding increased evapotranspiration) due to irrigation has two positive effects on crop growth and crop yield: reduction of drought stress and reduction of heat stress. The cooling effect of irrigation has been assessed and quantified before [31, 52–55], but the direct positive impact on crop growth by reducing heat stress requires more attention in further research.
Acknowledgements
Research support was provided by grants from the German Research Foundation DFG (grant no. EW 119/5-1) and by the Federal Ministry of Food and Agriculture BMEL via the Agency for Renewable Resources FNR (grant no. FKZ 22013509).