Article

Seasonal Soil Respiration Dynamics and Carbon-Stock Variations in Mountain Permanent Grasslands Compared to Arable Lands

1
Dipartimento di Scienze Agrarie, Alimentari ed Ambientali, Università Politecnica delle Marche, 60121 Ancona, Italy
2
Nucleo di Ricerca Sulla Desertificazione (NRD), Università degli Studi di Sassari, 07100 Sassari, Italy
3
Dipartimento di Agraria, Università degli Studi di Sassari, 07100 Sassari, Italy
4
East Malling Research, East Malling ME19, UK
5
Institute for Agro-Environmental Sciences, National Agriculture and Food Research Organization, 305-8604 Tsukuba, Japan
*
Author to whom correspondence should be addressed.
Agriculture 2019, 9(8), 165; https://doi.org/10.3390/agriculture9080165
Submission received: 23 May 2019 / Revised: 10 July 2019 / Accepted: 16 July 2019 / Published: 27 July 2019
(This article belongs to the Special Issue Greenhouse Gas Emissions in Agroecosystems)

Abstract

:
Permanent grasslands provide a wide array of ecosystem services. Despite this, few studies have investigated grassland carbon (C) dynamics, and especially those related to the effects of land-use changes. This study aimed to determine whether the land-use change from permanent grassland to arable lands resulted in variations in the soil C stock, and whether such variations were due to increased soil respiration or to management practices. To address this, seasonal variations of soil respiration, sensitivity of soil respiration to soil temperature (Q10), and soil C stock variations generated by land-use changes were analyzed in a temperate mountain area of central Italy. The comparisons were performed for a permanent grassland and two adjacent fields, one cultivated with lentil and the other with emmer, during the 2015 crop year. Soil respiration and its heterotrophic component showed different spatial and temporal dynamics. Annual cumulative soil respiration rates were 6.05, 5.05 and 3.99 t C ha−1 year−1 for grassland, lentil and emmer, respectively. Both soil respiration and heterotrophic soil respiration were positively correlated with soil temperature at 10 cm depth. Derived Q10 values were from 2.23 to 6.05 for soil respiration, and from 1.82 to 4.06 for heterotrophic respiration. Soil C stock at over 0.2 m in depth was 93.56, 48.74 and 46.80 t C ha−1 for grassland, lentil and emmer, respectively. The land-use changes from permanent grassland to arable land lead to depletion in terms of the soil C stock due to water soil erosion. A more general evaluation appears necessary to determine the multiple effects of this land-use change at the landscape scale.

1. Introduction

Soil respiration is defined as the release of carbon dioxide (CO2) from the soil, and it includes the respiration of plant roots, the rhizosphere, microbes and fauna. This respiration is the second most relevant carbon (C) flux between terrestrial ecosystems and the atmosphere [1], and due to climate change, many studies have been focused on the CO2 emissions over the last decades. Although the C stored in soils and the living terrestrial biomass is estimated to be about three-fold that in CO2 in the atmosphere [2], even small changes in soil respiration rates might affect CO2 concentrations in the atmosphere [3].
Land use changes are defined as conversion from one land cover type to another, and these can have key roles in terms of the global C budget [4,5,6]. This is in turn affected by changes in management practices (e.g., reduced grazing pressure), which can lead to encroachment of shrubs and/or trees into grasslands [7]. Although the influence of soil respiration on climatic changes is well recognized and has been studied for a wide array of terrestrial ecosystems, there remains a lack of extensive assessment for grassland ecosystems [1,8,9].
Permanent grasslands cover about 13% of the global agricultural area [10]. Grasslands are considered to be pivotal for biodiversity conservation, and they also have a significant role in greenhouse gas emission, as they have potential to mitigate global warming [8]. For these reasons, it has become crucial to study the effects of human activities on C stored in terrestrial ecosystems [11], and particularly for soil heterotrophic respiration, which is strongly related to soil organic C decomposition [12,13]. Due to low soil temperatures, soil organic matter in mountain temperate grasslands tends to decompose at low rates [14], although management practices such as soil tillage might have relevant roles on the soil C cycling because of their influence on soil aggregate turnover, aeration, erosion, infiltration and water-holding capacity [15]. Uncertainties and contrasting data on the size and distribution of CO2 sources and sinks such as grasslands indicate the need for further efforts to understand soil respiration dynamics, so as to better understand how the soil C sock responds to global changes, including land-use changes [8]. In this context of uncertainties, we investigated whether land-use change from permanent grassland to arable lands in temperate mountain areas results in variations in soil C stock, and whether such variations are due to increased soil respiration or to management practices.

2. Materials and Methods
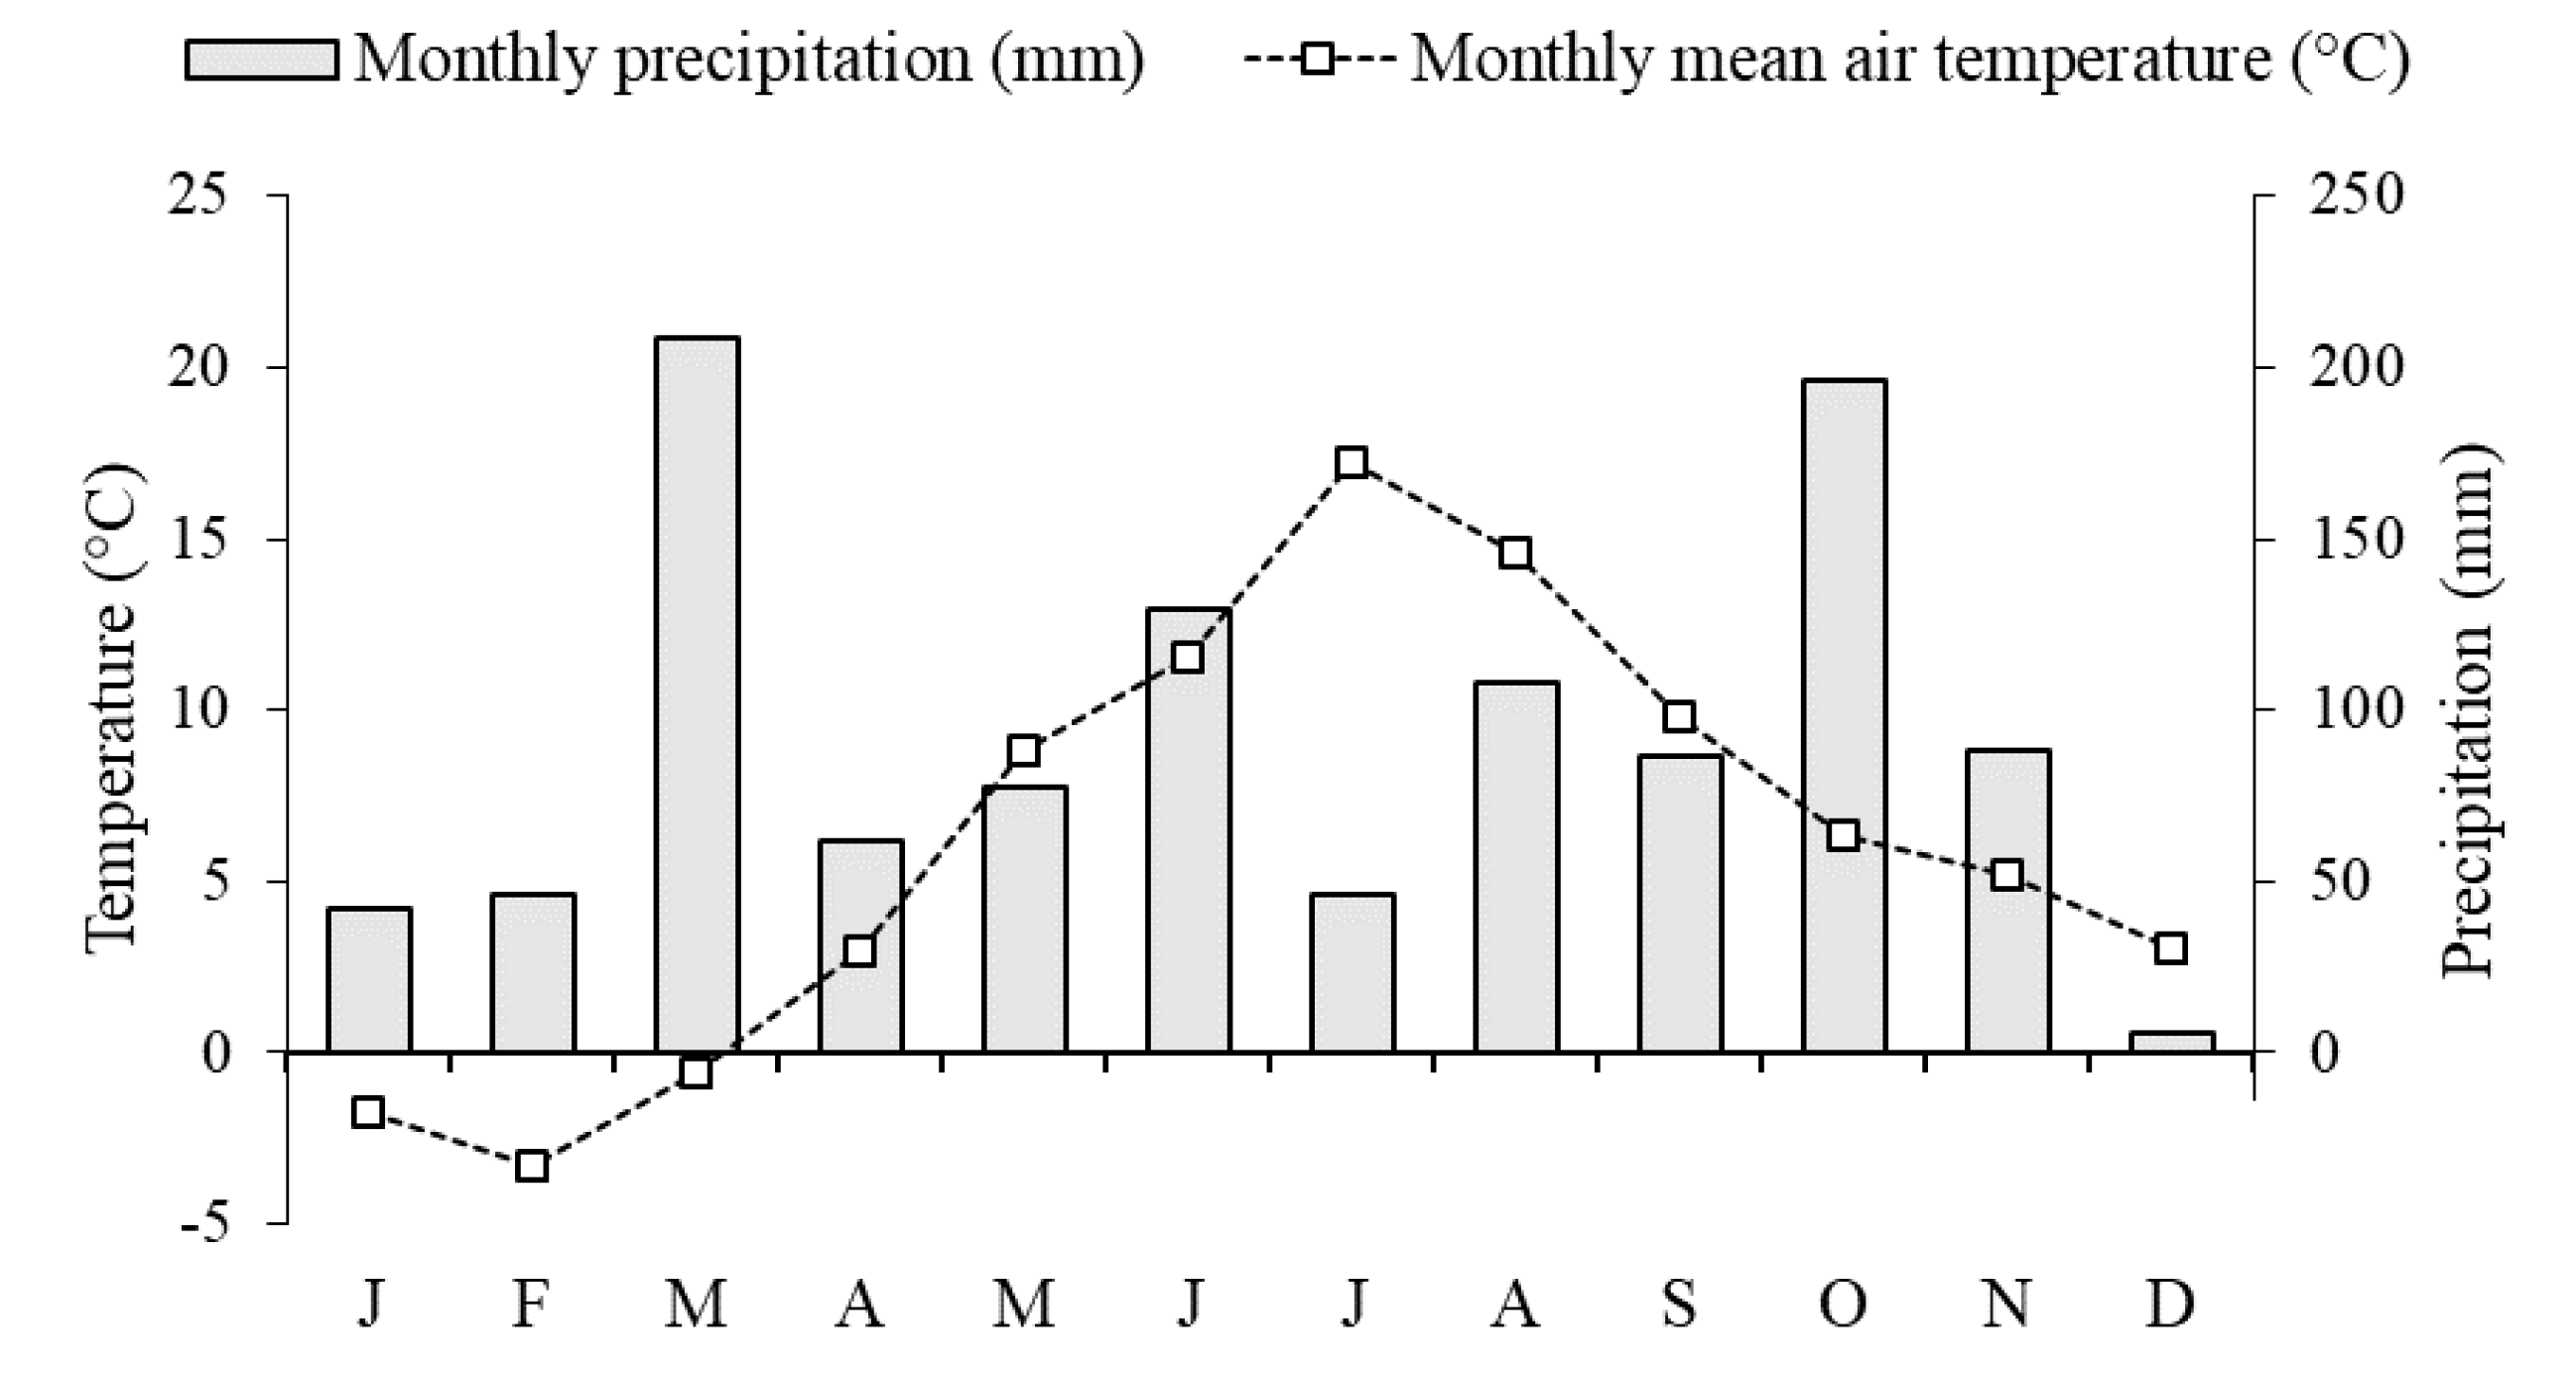
2.1. Study Area

The study area was located in the territory of Castelluccio di Norcia (42°49′ N, 13°13′ E; central Italy), inside the Monti Sibillini National Park, and within the Natura 2000 site of “Site of Community Importance” IT5210052 “Piani di Castelluccio di Norcia”, which includes two main priority grassland habitats (habitat code 6210* and 6170; EU Habitat Directive, Annex I). The bedrock of the study area is calcareous, and the climate is temperate oceanic, characterized by an annual mean temperature of 8.2 °C and mean precipitation of 867 mm, with the higher values in autumn and spring and the minima in summer [16]. The monthly mean air temperature and precipitation during the study period (January–December 2015) are shown in Figure 1. The area is characterized by a low-input cropping system. The main crops for these grassland-dominated landscapes, which are mostly used for summer grazing by cattle or transhumant flocks [17], are winter cereals, including emmer (Triticum turgidum L. ssp. dicoccum (Schrank) Thell.), oat (Avena sativa L.), and legumes, mainly lentil (Lens culinaris Medik.).
The study site (altitude, 1345 m a.s.l.; south-west exposure; 20° slope) is composed of a homogenous portion of permanent grassland dominated by Bromus erectus Hud., and two adjacent and seamless fields (≅0.5 ha each) that until 1995 were part of the same grassland; one was cultivated with lentil and the other with emmer for the 2015 crop year (data obtained through interviews with farmers and aerial photographs). The lentil was sown in the first week of May, and harvested in the last week of August. The emmer was sown in the first week of April, and harvested in the second week of September. The crop rotation system of these fields had been an alternation of emmer, lentil and fallow on a yearly basis since at least 1990. Both lentil and emmer were rain fed and did not require any particular treatments, except for soil plowing to 20 cm depth, which was performed 1 month before sowing. No fertilization was applied anywhere.
The soils in the experimental fields were classified as Mollisols, according to the USDA Soil Taxonomy system [18], and their basic physicochemical characteristics are shown in Table 1. Soil samples were collected at the beginning of the monitoring period following the nonsystematic “W” pattern described by [19]. Five soil samples (≅1 kg each) were collected from 0–20 cm depth for each field. Soil C stock (t C ha−1) at 0.2 m in depth was estimated according to Equation (1):
Soil   C   stock   =   TOC   ×   SBD   ×   depth   ( 0.2   m )   ×   ( 100 gravel ) / 100 ,
where TOC is the total organic C (g C kg−1 soil; Springer–Klee method), SBD is the soil bulk density (g soil cm−3), and the soil gravel content is expressed in %.

2.2. Soil CO2 Efflux, Temperature and Water Content Analysis

In November 2014, for each field, six polyvinyl chloride collars (inner diameter, 10 cm; height, 10 cm; perforated walls for the first 5 cm from the bottom) were inserted into the soil to a depth of 9 cm. Three of these were used to measure the total soil respiration, and three were isolated from roots using a polyvinyl chloride cylinder (diameter, 40 cm; height, 40 cm; open at both ends), to measure heterotrophic soil respiration following the method described by [20]. This method, known as ‘trenching’, has been widely applied to similar studies (e.g., [13,20,21]), with the aim of estimating the root contributions to total soil respiration by physically excluding any root access to the isolated area, regardless of root biomass. The collars were placed at about 10 m from each other in a homogenous area within each field.
Soil CO2 efflux was measured in situ using a portable closed-chamber soil respiration system (EGM-4; with SRC-1; PP-Systems, Hitchin, UK) placed on top of the 10 cm polyvinyl chloride collars. The measurement time was 120 s. Due to snow cover between January and March, the measurements started in April 2015, and ended in November 2015, with a frequency of two to three measurements per month, depending on the weather variability and agricultural practices (n = 18 per field). Soil respiration and its heterotrophic component were always measured between 8:30 am and 12:00 noon (standard time), to avoid efflux fluctuations [22]. Soil temperatures were measured for each plot at the same time as the CO2 efflux, using the built-in temperature probe of the respiration system (EMG-4), at 10 cm in depth. The soil water content (SWC) was determined on each sampling date from soil samples collected from the top 0.2 m layer, using oven drying at 105 °C until a constant weight was reached [23].

2.3. Data Analysis

One-way analysis of variance (ANOVA; general linear model procedure (ProcGLM); SAS) followed by Tukey tests, were used to compare seasonal cumulative total soil respiration, heterotrophic soil respiration and soil C stock. Seasonal cumulative total and heterotrophic soil respiration were calculated by linear interpolation according to [14]. Exponential regression analysis was used to examine the relationships between total soil respiration or heterotrophic soil respiration and soil temperature [24], according to Equation (2):
y   =   a   e bx ,
where y is the measured total or heterotrophic soil respiration (g CO2 m−2 h−1), b is the soil temperature coefficient and x is the constant coefficient.
The sensitivity of soil respiration to soil temperature (Q10) was calculated from the differences in the rates of the soil and heterotrophic respiration at 10 °C intervals, using an exponential regression model [25], according to Equations (3) and (4):
R 10   =   a   e 10 b ,
Q 10   =   e 10 b ,
where R10 is the basal respiration rate at the reference temperature of 10 °C.
All of the statistical analyses were performed using the SAS/Studio software, version 3.5 (SAS System for Windows).

3. Results and Discussion

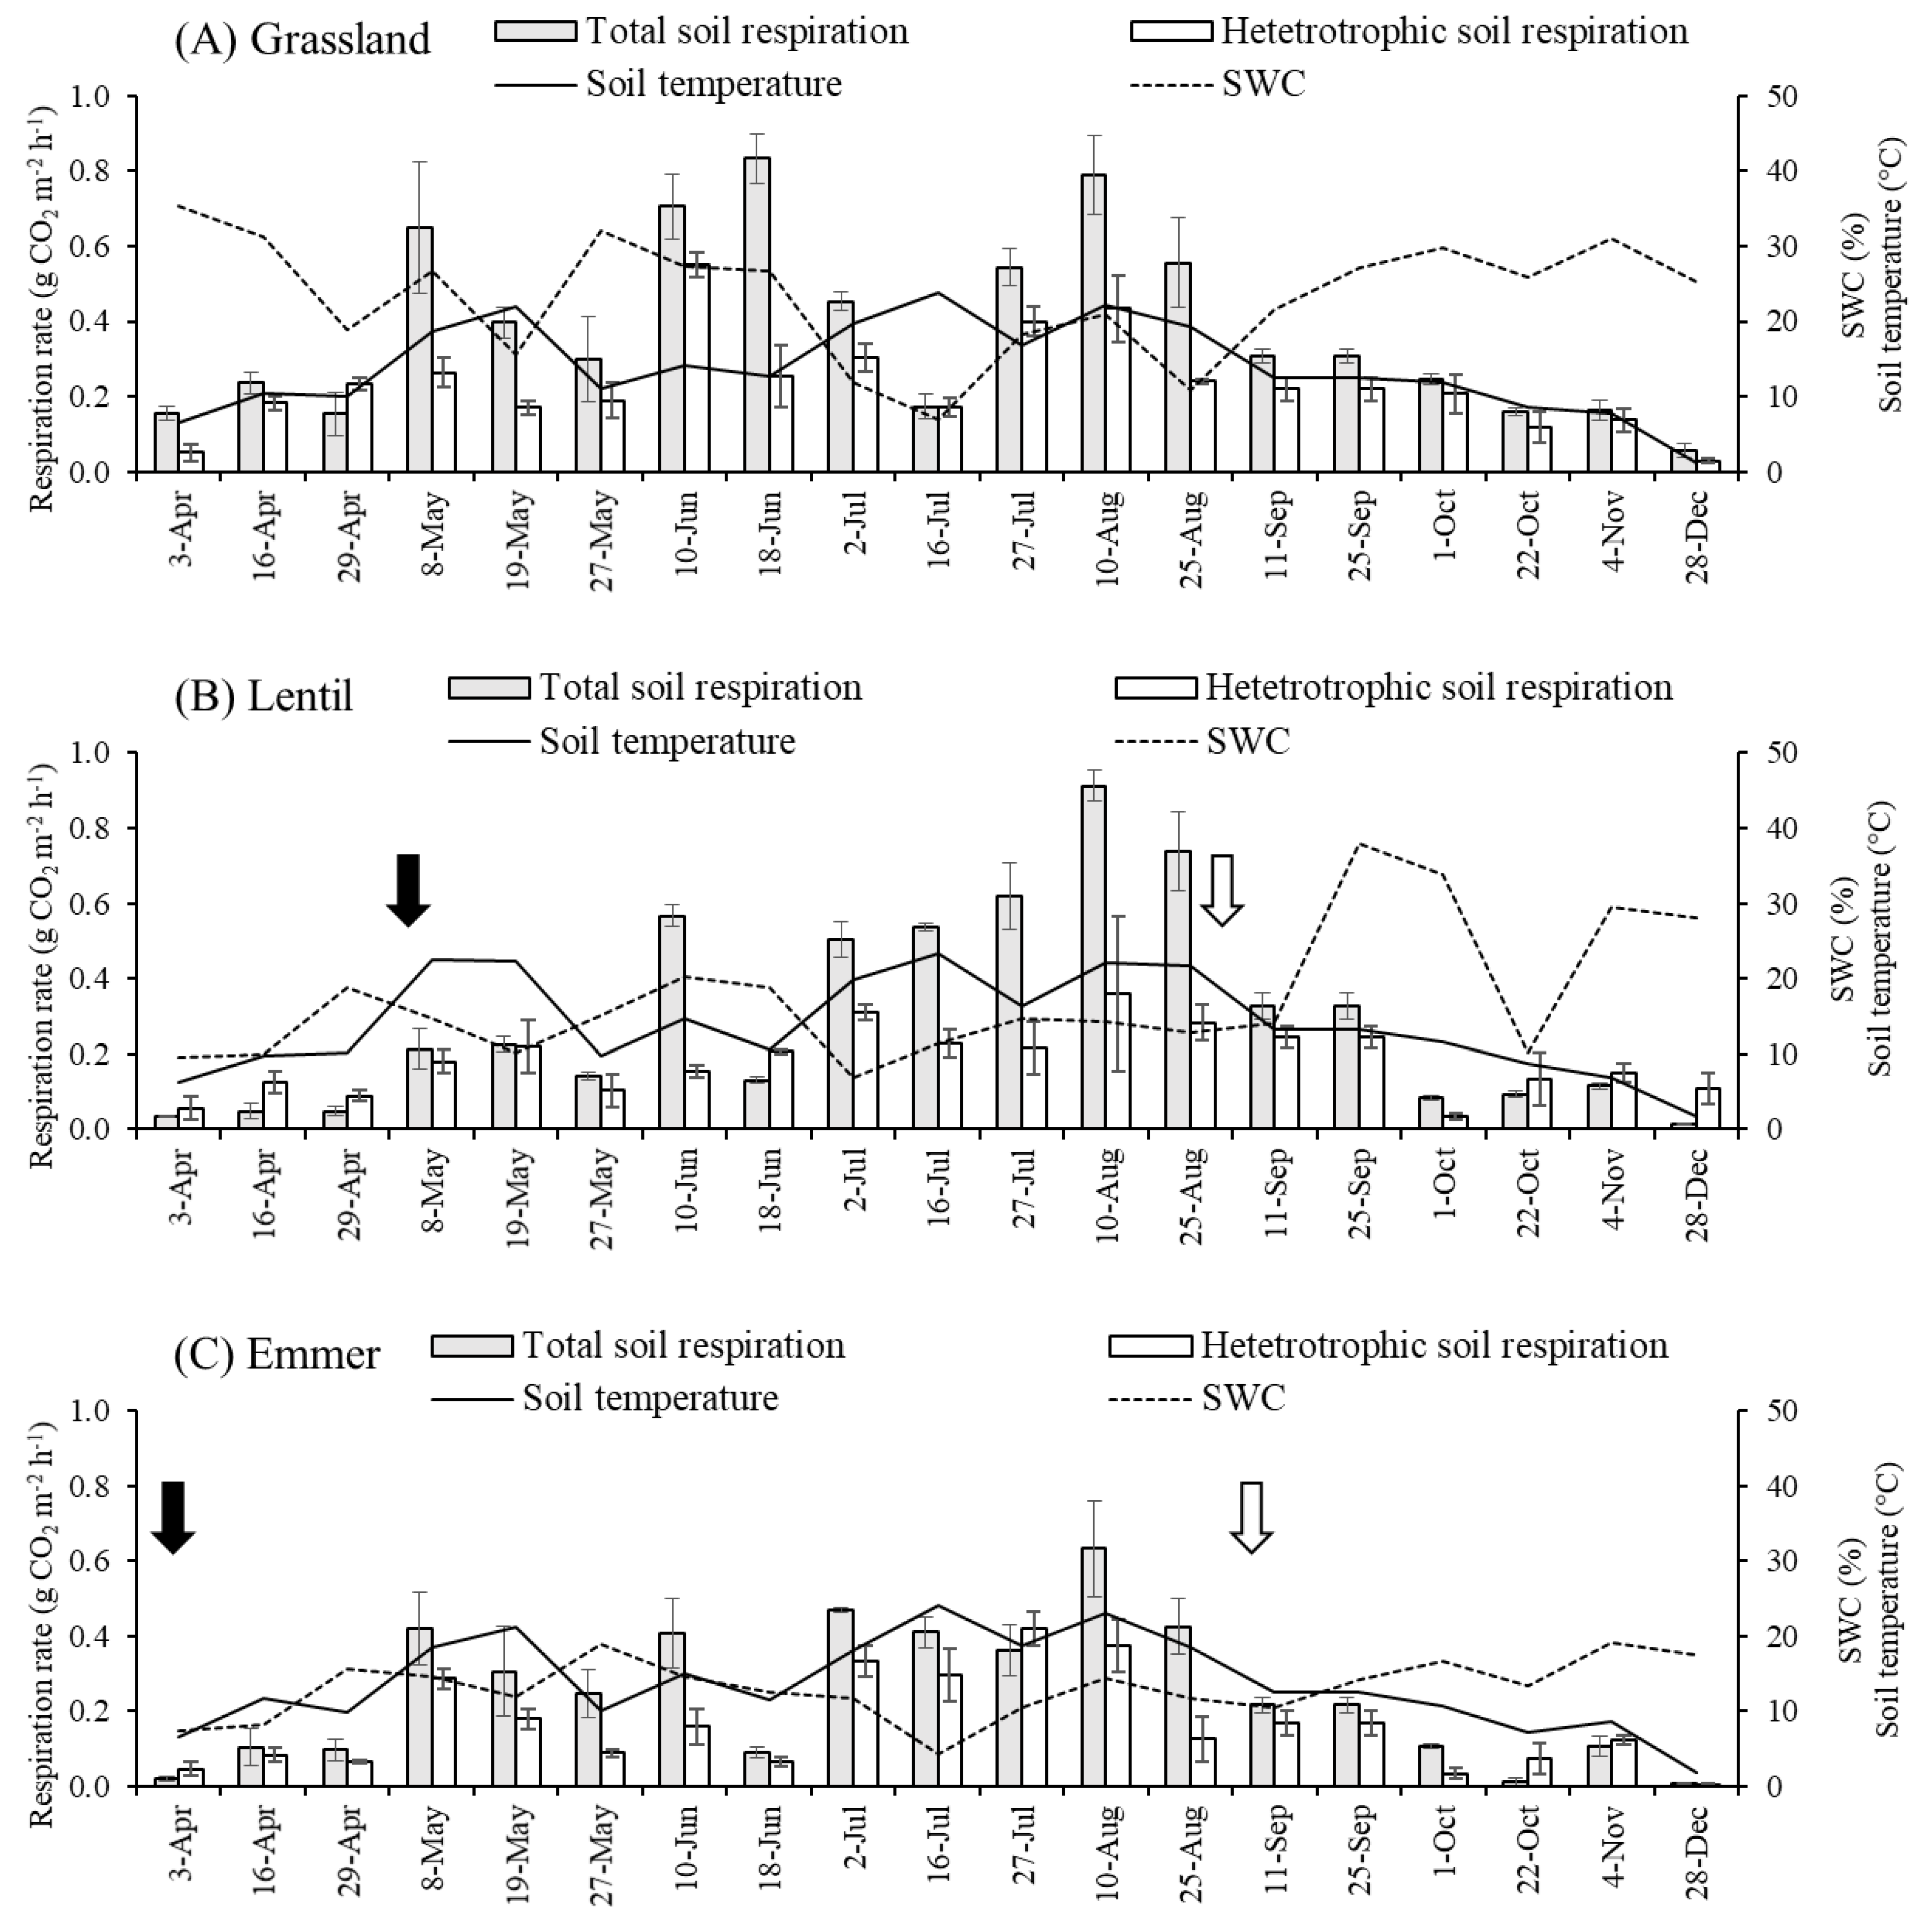
3.1. Soil CO2 Dynamics

Soil respiration, and its heterotrophic component in particular, is considered a major source of soil C depletion [12]. Soil respiration dynamics are influenced by climate and weather conditions, and different patterns of CO2 fluxes have been reported in different climate areas. For example, soil respiration dynamics of croplands in temperate areas are mainly controlled by soil temperature [8,15,26], while soil CO2 efflux in areas under Mediterranean conditions are often constrained by soil water content during the dry periods, when pulses of soil respiration can occur after prolonged dry periods [9,27]. Thus, reporting the dynamics of soil CO2 effluxes is pivotal to understanding the implications of a land-use change from permanent grasslands to arable lands in terms of soil C stock variations [8,15,28].
The seasonal variations in the soil respiration and its heterotrophic component for the grassland and the lentil and emmer fields are summarized in Figure 2. For the grassland (Figure 2A), the total soil respiration reached its first peak in the first half of May (0.65 g CO2 m−2 h−1), in conjunction with a rapid increase in soil temperature. The following decreasing trend for the total soil respiration to the end of May appears to have been related to the drop in the relative SWC to mid-May and the soil temperature (to the end of May) (Figure 2). High peaks were seen for the total soil respiration in the second (0.71 g CO2 m−2 h−1) and third (0.83 g CO2 m−2 h−1) weeks of June, when the grassland was in full vegetative activity, with relatively high SWC. The drop in the total soil respiration in July appears to have been related to the low SWC (6.92%), even though the soil temperature was at its highest (23.77 °C). This indicates that the SWC acted as a limiting factor for the total soil respiration [29]. From the end of July to the end of August, the total soil respiration ranged from 0.54 to 0.79 g CO2 m−2 h−1 on the basis of the favorable (relatively high) conditions of the soil temperature and the SWC. A gradual decrease in the total soil respiration was then seen until the end of the monitoring period (i.e., end of December), along with a decreasing trend for soil temperature, despite the increased SWC.
For lentil, the total soil respiration from April to June was always lower than for the grassland. From July to October, the total soil respiration rates for lentil were very similar to those for the grassland, except in the second half of July, where lentil showed higher CO2 emissions compared to the grassland (0.54 vs. 0.17 g CO2 m−2 h−1, respectively). Lentil reached its maximum total soil respiration rates in the second week of August (0.91 g CO2 m−2 h−1), when the soil temperature was also at its peak (22.07 °C). The high total soil respiration rates for lentil between July and August (i.e., from 0.50 to 0.91 g CO2 m−2 h−1) were probably related to the optimal and stable range of the soil temperature and SWC [29]. A large fall in the total soil respiration for the lentils was seen in September, which was attributed to the effects of crop harvesting on the root activities [13]. From October onwards, the total soil respiration remained at these low levels until December, when the CO2 emissions were 0.01 g CO2 m−2 h−1.
For emmer, again, the total soil respiration was always lower than that for the grassland, with the exception of the first half of July. The total soil respiration for emmer reached its maximum in the second week of August (0.63 g CO2 m−2 h−1), and then decreased gradually until the end of the monitoring period. The highest levels of CO2 emission for emmer were between July and the first half of August, and this was attributed to the root contributions to the total soil respiration, which was higher during the growing season [12]. Several studies that investigated total soil respiration dynamics have shown how soil CO2 emissions depend mostly on soil temperature and SWC (e.g., [27]). If the soil temperature is generally positively correlated to total soil respiration, precipitation might have the opposite effect if the soil reaches anaerobic conditions [8]. In general, this was not the case with the total soil respiration rates for grassland, lentil or emmer, as the relatively scarce precipitation in November and December (94 mm), coupled with the elevated gravel and sand contents of the soil (Table 1), avoided anaerobic conditions.
In general, the heterotrophic soil respiration showed spatial and temporal variability that was less pronounced than for the total soil respiration (Figure 2). For the grassland, the heterotrophic soil respiration in April was from 0.05 to 0.26 g CO2 m−2 h−1. The peak of heterotrophic soil respiration for the grassland was in June (0.55 g CO2 m−2 h−1). From the second half of June, however, the heterotrophic soil respiration decreased markedly, down to 0.17 g CO2 m−2 h−1 (in mid-July), when the SWC was at its lowest (6.92%), and the soil temperature was at its highest (21.53 °C). This suggests that the SWC was the limiting factor for heterotrophic soil respiration [29]. Indeed, the heterotrophic soil respiration for the grassland then gradually increased again until the end of August, when together with the soil temperature, it decreased once again, to reach its lowest rate of 0.03 g CO2 m−2 h−1 at the end of December.
Compared to the grassland, lentil showed a less marked temporal variability for the heterotrophic soil respiration. The peak here was in the second week of August (0.36 g CO2 m−2 h−1), with the optimal conditions of the soil temperature and the SWC [29]. The lowest heterotrophic CO2 emissions for lentil were observed in the first week of October, despite the soil temperature of 11.37 °C and the particularly high SWC (40.53%). This will probably have created temporary anaerobic conditions [8].
In April, emmer showed relatively low heterotrophic soil respiration rates, from 0.05 to 0.07 g CO2 m−2 h−1. The first particular peak of heterotrophic soil respiration for emmer was in May (0.29 g CO2 m−2 h−1), in conjunction with a large increase in the soil temperature. The highest heterotrophic soil respiration peak for emmer was at the end of July (0.42 g CO2 m−2 h−1), approximately 1 week after the highest soil temperature (24.83 °C) and the lowest SWC (4.26%). In this case, the favorable soil temperature and the increase in SWC would have stimulated the soil microbial activities [29].

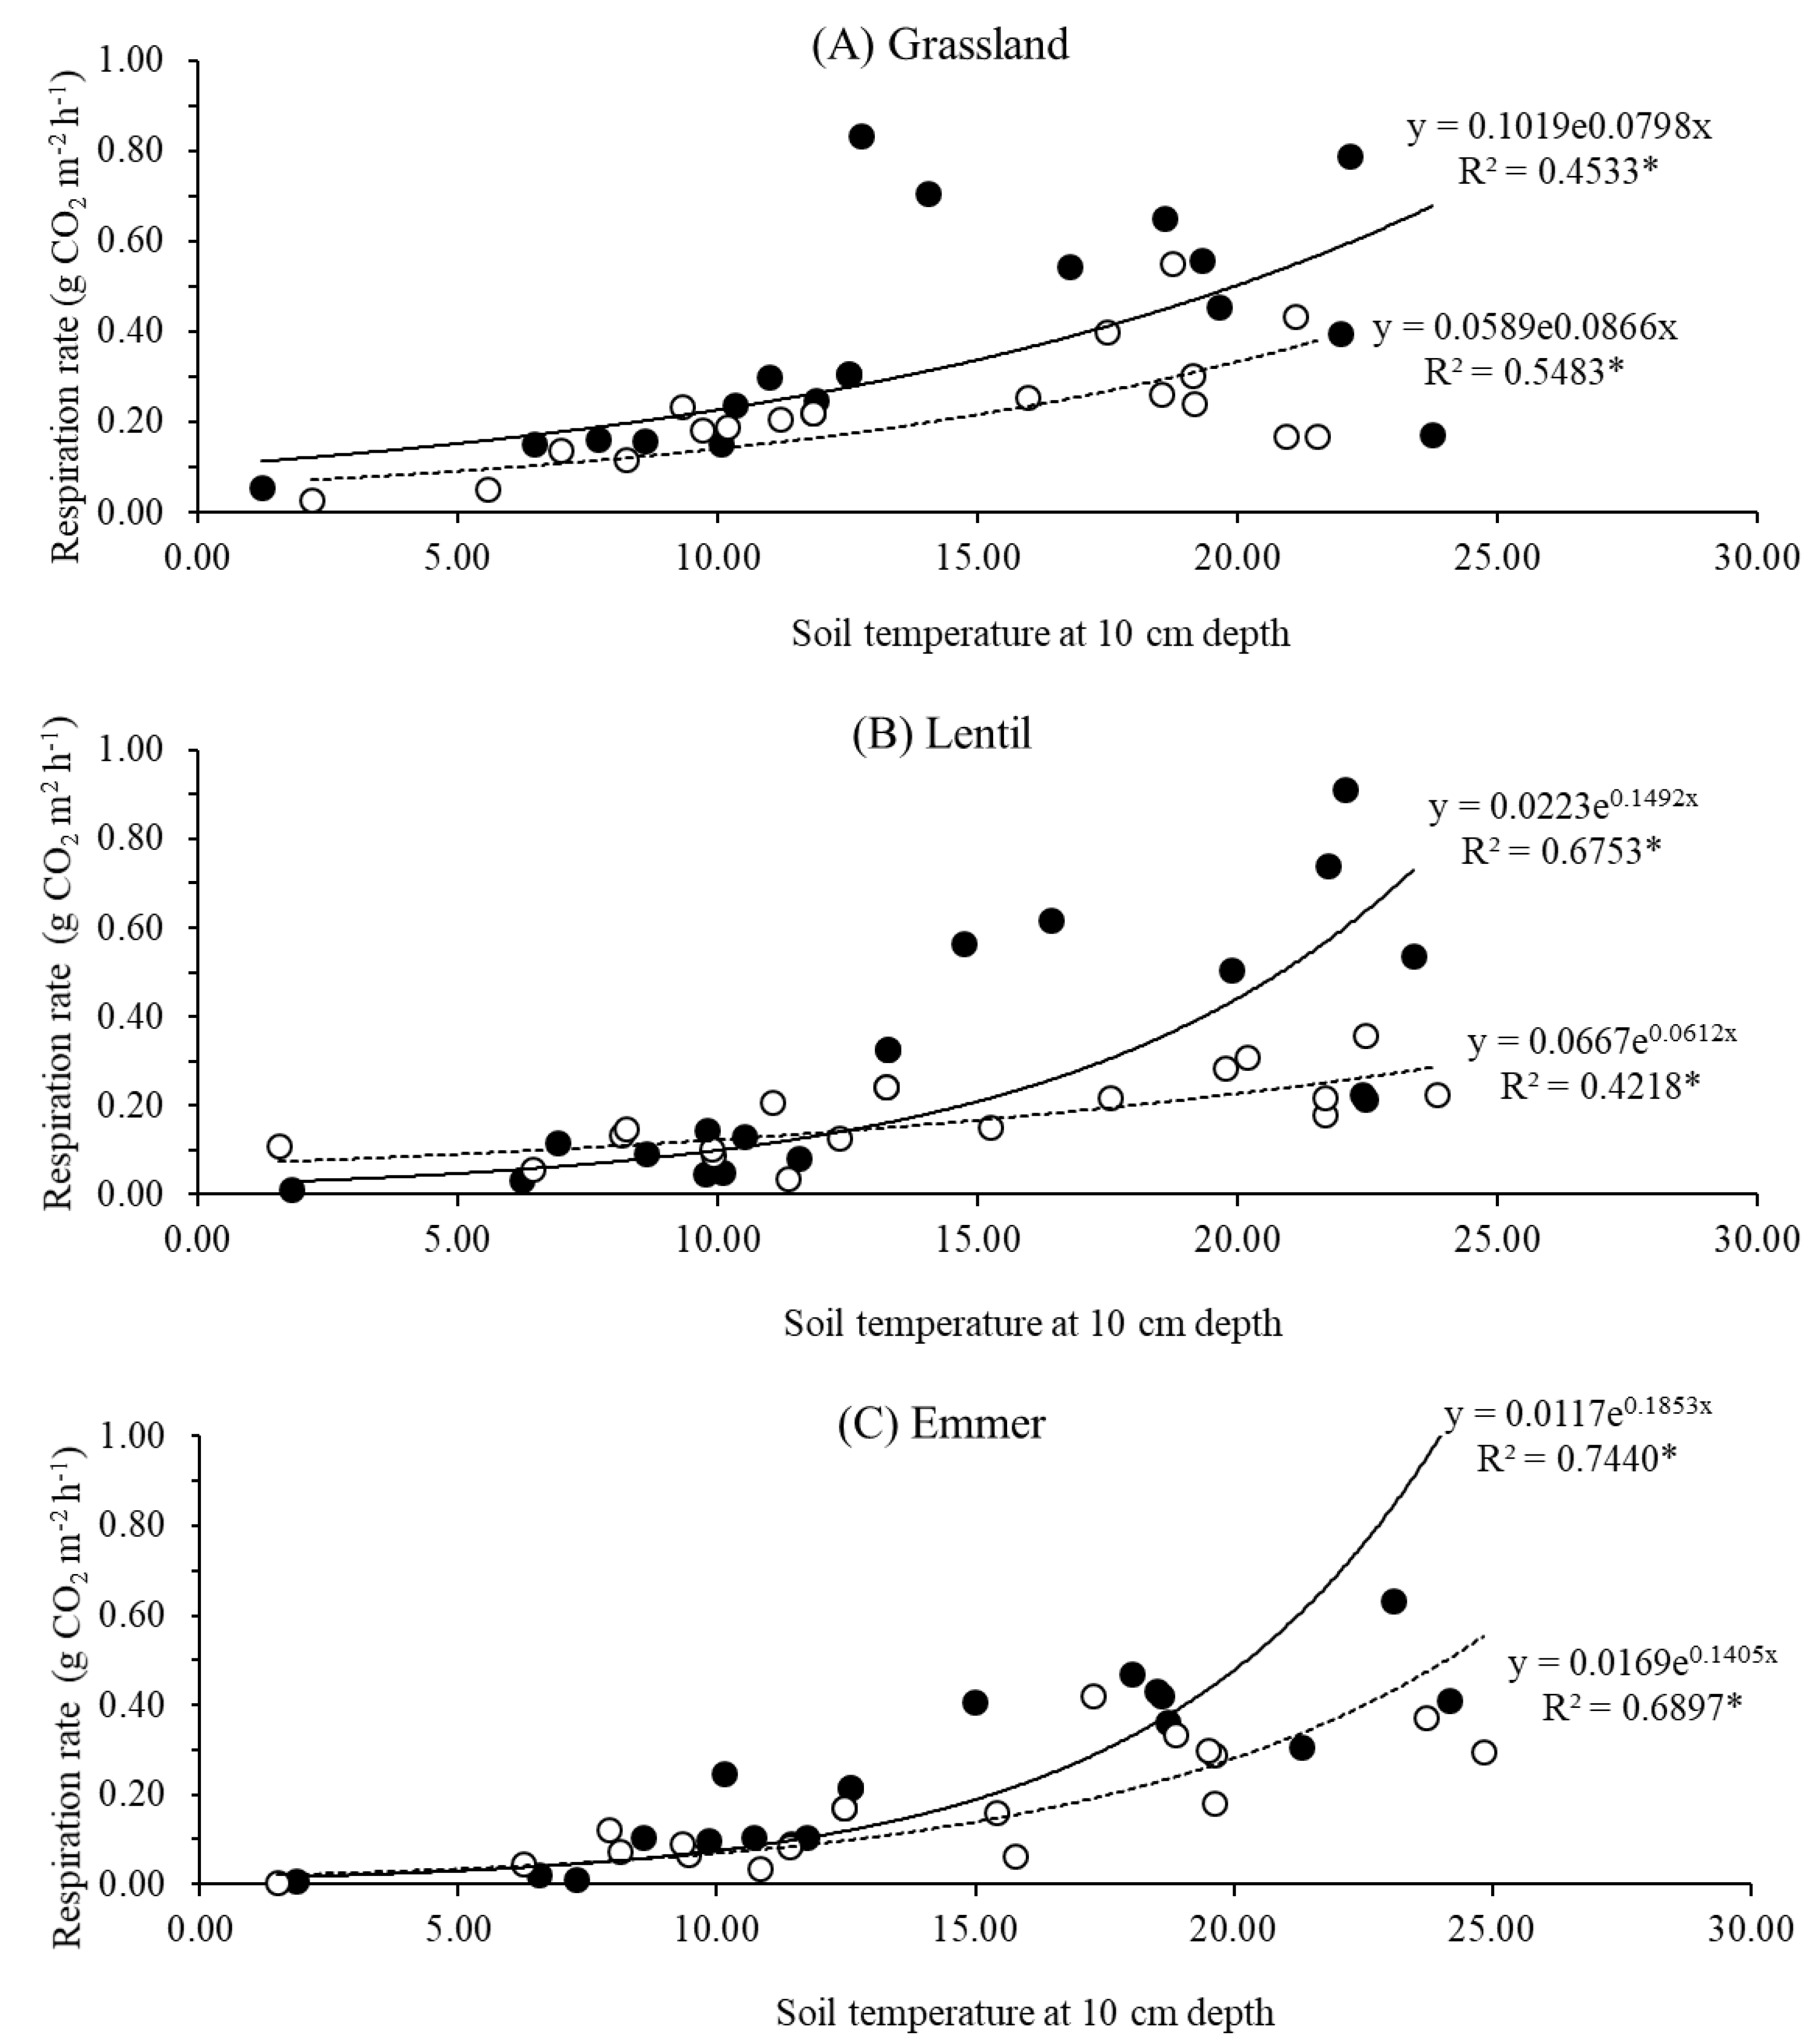
3.2. Relationships between Soil CO2 Efflux and Soil Temperature and Water Content

Soil respiration can be affected by many biotic and abiotic factors, although it is widely accepted that soil temperature and moisture represent the two main drivers of soil CO2 effluxes [3,30]. However, no general rule can be identified for such drivers, because the data tend to be highly context dependent [13,24]. Indeed, many studies carried out in different pedo-climatic contents have shown that soil temperature is the main driver of soil respiration, and that its relationship with soil respiration is exponential [22,23,27,31]. On the other hand, soil moisture usually shows a linear relationship with soil respiration, and sometimes it might act as a limiting factor, to reduce soil aeration or constrain the metabolic activities of soil microbial communities and/or root respiration [23].
In the present study, there were significant exponential relationships between the soil and heterotrophic respiration in each experimental field and the seasonal variations of the soil temperature (p < 0.05). Here, the seasonal variations of the soil temperature explained 45.33% of the total soil respiration for the grassland, 67.53% for lentil and 74.40% for emmer. The heterotrophic component of soil respiration explained 54.83%, 42.18% and 68.97% of these seasonal variations for grassland, lentil and emmer, respectively (Figure 3). In contrast with these results, no significant relationships were observed between the total or heterotrophic soil respiration and soil water content in each experimental field. However, some other studies (e.g., [32]) have reported that while soil CO2 efflux of mountain systems increased with temperature, soil water content had no effects due to the relatively low soil temperature. In the present study, the lack of a significant relationship between soil respiration and soil water content was attributed to the observed values of soil water content, which was rarely under the considered limiting values [21,23]. The Q10 values calculated were all above the median of 2.1 from a global survey of soil respiration carried out by [33], except for lentil heterotrophic soil respiration. Despite the minimal spatial distance, the experimental fields showed Q10 values from 2.23 to 6.05 for total soil respiration, and from 1.82 to 4.06 for heterotrophic soil respiration (Table 2). Different studies have suggested that although Q10 values are used in many studies, these can be biased by confounding effects of crop phenology, soil biophysical characteristics and SWC on the soil temperature (e.g., [25]). This might well explain the wide range of Q10 values here, which for lentil heterotrophic soil respiration and emmer soil and heterotrophic soil respiration are considerably greater than the median reported by [33]. For the Q10 derived from the total soil respiration, the different phenology of lentil and emmer with respect to the grassland might have promoted variations in photosynthate supply from the canopy to the rhizosphere that might have altered the total soil respiration. Consequently, the high Q10 values might reflect variations in the labile C supply to the roots and rhizosphere, and the root growth and activity [34]. Thus, to have a complete, systemic and organic vision, future studies should address the multiple factors involved in total and heterotrophic soil respiration. Such factors include, for example, enzyme activities, soil aeration, passage of soluble C substrates through the soil, air and water, and across the cellular membranes, and the dynamics of microbial populations and roots [25].

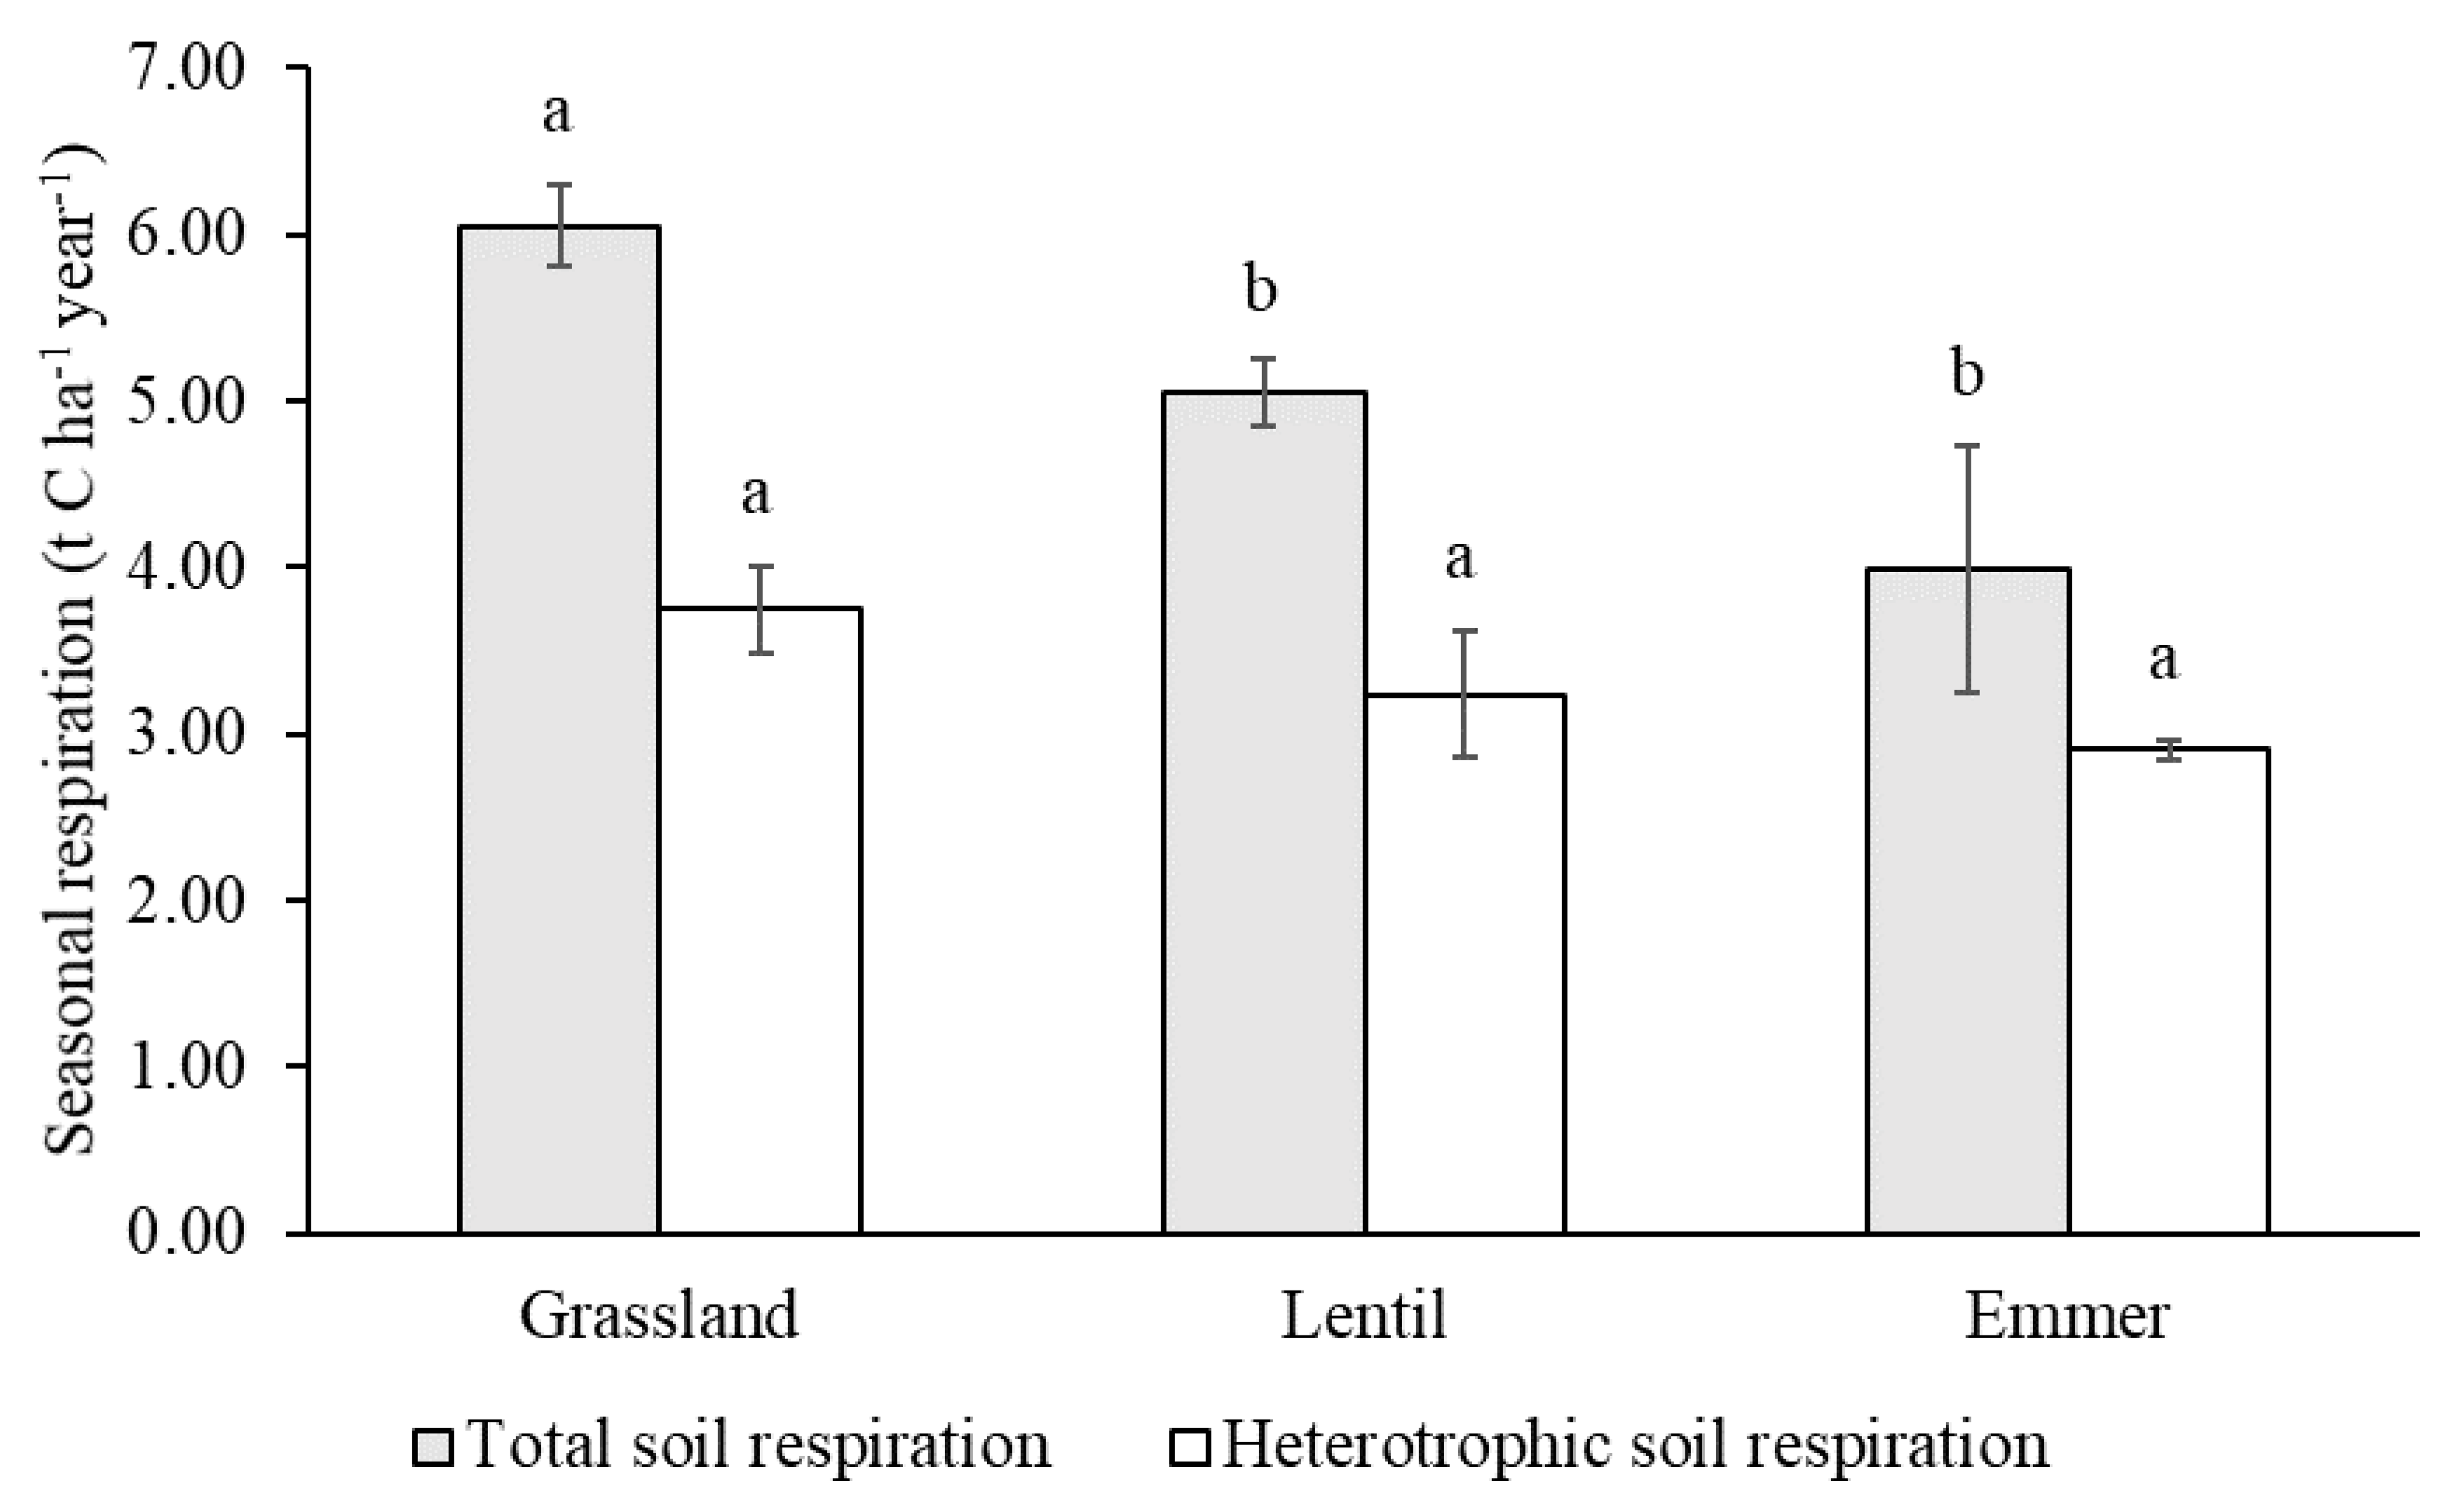
3.3. Seasonal Cumulative Total Respiration and Heterotrophic Respiration Rates

Despite the large and growing number of studies that have dealt with the soil C cycle, some major uncertainties and contrasting data have emerged from the literature (e.g., [13,21,27]). While some studies conducted at global scale have reported that soil respiration rates are primarily controlled by climatic and substrate factors, and secondly by vegetation type (i.e., grassland, cropped soils) [30], other studies have indicated that factors such as management practices (i.e., soil ploughing, harvesting, mowing) have greater control over the total soil respiration rates even under the same pedo-climatic conditions (e.g., [13]).
In the present study, significant differences were seen between the cumulative total soil respiration rates for the grassland (6.05 t C ha−1 year−1) over lentil (5.05 t C ha−1 year−1) and emmer (3.99 t C ha−1 year−1) (Figure 4) supporting the findings of [28], who reported that soil respiration of temperate mountain grasslands is amongst the highest reported for any type of ecosystem.
The contribution of heterotrophic soil respiration to the cumulative total soil respiration was 61.99% for grassland, 64.15% for lentil, and 72.89% for emmer, with no significant differences between the study fields (Figure 4). These data appear to be aligned with the mean annual percentage of 60.4% reported by [12] for the contribution of the heterotrophic soil respiration to the total soil respiration in studies on nonforest vegetation, except for emmer, which was out of this range. Similar differences were seen previously by [13] for forage-based and cereal-based cropping systems, and these were attributed to the lower root CO2 emissions of cereals, which have a shorter growing season.
Such data have suggested that in temperate mountain areas, excluding other any source of soil C loss, the land-use change from grassland to arable lands should not generate any increases in heterotrophic soil respiration. Thus, the differences in total soil respiration are attributable exclusively to the plant roots.

3.4. Soil Carbon Stock

Enhancement of the soil C stock is considered a virtuous practice at the global scale, and there is wide agreement that conversion from arable land to grassland leads to soil C stock increases [4,13,29,35]. However, some recent studies have suggested that a change in short-term land use from permanent grassland (i.e., of >30 years) to arable lands (e.g., 2 years of corn) followed by a return to grassland can actually increase the soil C stock [15], although other studies have suggested that the light fraction of the organic matter of grasslands might be lost soon after the tillage [11].
Although the experimental fields were formerly part of the same grassland, the conversion into arable land that occurred two decades before has resulted in marked differences in the soil physicochemical characteristics. For example, although the three fields are just few meters away from each other, they are at the base of a mountainside with 20° slope, and the grassland has about 61% sand, while lentil and emmer have 43% and 48%, respectively (Table 1). Such differences in these study fields have derived from the repeated soil plowing and from the consequent water soil erosion that has occurred over the years [36,37]. In turn, the soil erosion has led to changes in soil C stock for lentil and emmer. Indeed, the soil C stock at 0.2 m in depth was significantly higher (p < 0.05) for the grassland compared to both lentil and emmer fields, at 93.56, 48.74 and 46.80 t C ha−1, respectively. The reasons behind the soil C depletion are not ascribable to microbial activities, as the heterotrophic soil respiration showed no differences between grassland, lentil and emmer (Figure 4). Nevertheless, similarly to other studies, the conversion of permanent grassland to cropland has indeed been shown to lead to decreased soil C stock [4,11]. The debate on the effects of water soil erosion on the soil C sink/source is still open, as diametrically opposing data emerge from the recent literature (e.g., [23]). Indeed, switching from the field-scale to the catchment-scale perspective, rather than the soil C from the arable lands being lost, they might have been redistributed through lateral fluxes, such as soil detachment and sediment transportation and deposition. These lateral movements might even have resulted in a carbon sink of the system, as the lateral soil C movements might have had positive effects due to the recovery of new vegetation and/or buried eroded sediments [38].
However, regardless of the effects of management practices, the value obtained for the estimation of the soil C stock of the grassland was higher than those reported in other studies on grasslands (e.g., [39]), and the soil C stock values for lentil and emmer were higher than those of other studies conducted on Mollisols (e.g., [40]). This highlights the importance of these cropping systems as sources for the provision of regulation of ecosystem services [1]. Finally, to maximize the impact of specific management practices that are designed to reduce soil greenhouse gases and/or increase soil C stocks, these should be included in any agri-environmental measures undertaken at the landscape scale, to involve more farmers (e.g., [41]).

4. Conclusions

Although the cumulative total soil respiration is different for grassland compared to lentil and emmer, there were no differences for the cumulative heterotrophic soil respiration, which indicates that these differences in CO2 emissions depend on the differences in root respiration. Overall, the seasonal variations of both the total and heterotrophic soil respiration are mainly controlled by the variations in the soil temperature, while the SWC has limited effects that occur only in specific periods. The Q10 shows a wide contrasting range of values, which suggests that future studies need to address this course of action.
As expected, the land-use changes from permanent grassland to arable land lead to depletion in terms of the soil C stock, which, however, was not imputable to heterotrophic soil respiration. Conversely, soil erosion promoted by soil plowing was the main reason behind the soil C stock changes between the permanent grasslands and these arable lands. However, such analysis should also be conducted through a landscape-scale approach that takes into account the actual budget of the soil C for the land-use change, including the soil C lateral fluxes and other ecosystem services (e.g., food provisioning, habitat services, landscape aesthetic value). In this vision, the development of indicators that take into account not only the ecosystem C dynamics (i.e., soil C stock), but also the trade-offs between the ecosystem services at the landscape scale would represent further valid contributions to the community of scientists and other stakeholders, alike.

Author Contributions

Conceptualization, M.F., M.T. and P.D.; methodology, M.F., R.L.; software, M.F. and L.T.; formal analysis, M.F., L.T., M.T., R.L. and P.D.; investigation, M.F. and P.D.; resources, L.T., L.F., K.B., N.B.; data curation, M.F. and L.T.; writing—original draft preparation, M.F., M.T. and P.D.; writing—review and editing, M.F., P.D., M.A., G.T. and A.W.K.M.; supervision, M.T. and P.D.; project administration, M.T. and P.D.; funding acquisition, M.T. and P.D.

Funding

This research received no external funding.

Acknowledgments

The study was carried out with the support of the project MACSUR (D.M. 24064/7303/2015-www.MACSUR.eu), funded for the Italian partnership by the Italian Ministry of Agricultural, Food and Forestry Policies; PACTORES: PAstoral ACTORs, Ecosystem services and Society as key elements of agro-pastoral systems in the Mediterranean, ERANETMED “EURO-MEDITERRANEAN Cooperation through ERANET joint activities and beyond” — Joint Transnational Call 2016 — Environmental challenges and solutions for vulnerable communities (ERANETMED2-72-303); FORESTPAS2000 “Foreste e Pascoli della Rete Natura 2000 — Indirizzi di gestione sostenibile in Italia centrale” (MIPAAF D.M. 29474 28.10.2010).

Conflicts of Interest

The authors declare no conflicts of interest. The funders had no role in the design of the study; in the collection, analysis, or interpretation of the data, in the writing of the manuscript, or in the decision to publish the results.

References

  1. D’Ottavio, P.; Francioni, M.; Trozzo, L.; Sedić, E.; Budimir, K.; Avanzolini, P.; Trombetta, M.F.; Porqueddu, C.; Santilocchi, R.; Toderi, M. Trends and approaches in the analysis of ecosystem services provided by grazing systems: A review. Grass Forage Sci. 2018, 73, 15–25. [Google Scholar] [CrossRef]
  2. Falkowski, P.; Scholes, R.; Boyle, E.; Canadell, J.; Canfield, D.; Elser, J.; Gruber, N.; Hibbard, K.; Högberg, P.; Linder, S.; et al. The Global Carbon Cycle A Test of Our Knowledge of Earth as a System. Science 2000, 290, 291–296. [Google Scholar] [CrossRef] [PubMed]
  3. Schlesinger, W.H.; Andrews, J.A. Soil respiration and the global carbon cycle. Biogeochemistry 2000, 48, 7–20. [Google Scholar] [CrossRef]
  4. Mcgonigle, T.P.; Turner, W.G. Grasslands and Croplands Have Different Microbial Biomass Carbon Levels per Unit of Soil Organic Carbon. Agriculture 2017, 7, 57. [Google Scholar] [CrossRef]
  5. Selecky, T.; Bellingrath-Kimura, S.; Kobata, Y.; Yamada, M.; Guerrini, I.; Umemura, H.; Dos Santos, D. Changes in Carbon Cycling during Development of Successional Agroforestry. Agriculture 2017, 7, 25. [Google Scholar] [CrossRef]
  6. Houghton, R.A.; House, J.I.; Pongratz, J.; Van Der Werf, G.R.; Defries, R.S.; Hansen, M.C.; Le Quéré, C.; Ramankutty, N. Carbon emissions from land use and land-cover change. Biogeosciences 2012, 9, 5125–5142. [Google Scholar] [CrossRef] [Green Version]
  7. Caballero, R.; Molle, G.; Roggero, P.P.; Bagella, S.; D’Ottavio, P.; Papanastasis, V.P.; Fotiadis, G.; Sidiropoulou, A. Grazing systems and biodiversity in Mediterranean areas: Spain, Italy and Greece. Pastos 2009, 39, 9–154. [Google Scholar]
  8. Wang, W.; Fang, J. Soil respiration and human effects on global grasslands. Glob. Planet. Chang. 2009, 67, 20–28. [Google Scholar] [CrossRef]
  9. Xu, L.; Baldocchi, D.D. Seasonal variation in carbon dioxide exchange over a Mediterranean annual grassland in California. Agric. For. Meteorol. 2004, 123, 79–96. [Google Scholar] [CrossRef] [Green Version]
  10. Hoffmann, I.; From, T.; Boerma, D. Ecosystem services provided by livestock species and breeds, with special consideration to the contributions of small-scale livestock keepers and pastoralists. FAO Commission on genetic resources for food and agriculture. Background study paper 66(1). 2014. Available online: http://www.fao.org/3/a-at598e.pdf (accessed on 27 July 2019).
  11. Monaci, E.; Polverigiani, S.; Neri, D.; Bianchelli, M.; Santilocchi, R.; Toderi, M.; Ottavio, P.D.; Vischetti, C. Effect of contrasting crop rotation systems on soil chemical and biochemical properties and plant root growth in organic farming: First results. Ital. J. Agron. 2017, 12, 364–374. [Google Scholar] [CrossRef]
  12. Hanson, P.J.; Edwards, N.T.; Garten, C.T.; Andrews, J.A. Separating Root and Soil Microbial Contributions to Soil Respiration: A Review of Methods and Observations. Biogeochemistry 2000, 48, 115–146. [Google Scholar] [CrossRef]
  13. Francioni, M.; Lai, R.; D’Ottavio, P.; Trozzo, L.; Kishimoto-Mo, A.W.; Budimir, K.; Baldoni, N.; Toderi, M. Soil respiration dynamics in forage-based and cereal-based cropping systems in central Italy. Sci. Agric. 2020, 77, 1–15. [Google Scholar] [CrossRef]
  14. Rong, Y.; Ma, L.; Johnson, D.A.; Yuan, F. Soil respiration patterns for four major land-use types of the agro-pastoral region of northern China. Agric. Ecosyst. Environ. 2015, 213, 142–150. [Google Scholar] [CrossRef]
  15. Mukumbuta, I.; Shimizu, M.; Hatano, R. Short-term land-use change from grassland to cornfield increases soil organic carbon and reduces total soil respiration. Soil Tillage Res. 2019, 186, 1–10. [Google Scholar] [CrossRef]
  16. Kottek, M.; Grieser, J.; Beck, C.; Rudolf, B.; Rubel, F. Updated world map of the Köppen-Geiger climate classification. Meteorol. Z. 2006, 15, 259–263. [Google Scholar] [CrossRef]
  17. Budimir, K.; Trombetta, M.F.; Francioni, M.; Toderi, M.; D’Ottavio, P. Slaughter performance and carcass and meat quality of Bergamasca light lambs according to slaughter age. Small Rumin. Res. 2018, 164, 1–7. [Google Scholar] [CrossRef]
  18. Soil Survey Staff. Keys to soil taxonomy. Soil Conserv. Serv. 2014, 12, 410. [Google Scholar]
  19. Paetz, A.; Wilke, B.M. Soil Sampling and Storage. Monit. Assess. Soil Bioremediat. 2005, 5, 1–45. [Google Scholar]
  20. Alberti, G.; Vedove, G.D.; Zuliani, M.; Peressotti, A.; Castaldi, S.; Zerbi, G. Changes in CO2 emissions after crop conversion from continuous maize to alfalfa. Agric. Ecosyst. Environ. 2010, 136, 139–147. [Google Scholar] [CrossRef]
  21. González-Ubierna, S.; Lai, R. Modelling the effects of climate factors on soil respiration across Mediterranean ecosystems. J. Arid Environ. 2019, 165, 46–54. [Google Scholar] [CrossRef]
  22. Fan, L.C.; Yang, M.Z.; Han, W.Y. Soil Respiration under Different Land Uses in Eastern China. PLoS ONE 2015, 10, e0124198. [Google Scholar] [CrossRef] [PubMed]
  23. Rey, A.; Pegoraro, E.; Tedeschi, V.; De Parri, I.; Jarvis, P.G.; Valentini, R. Annual variation in soil respiration and its components in a coppice oak forest in Central Italy. Glob. Chang Biol. 2002, 8, 851–866. [Google Scholar] [CrossRef]
  24. Davidson, E.A.; Belk, E.; Boone, R.D. Soil water content and temperature as independent or confounded factors controlling soil respiration in a temperate mixed hardwood forest. Glob. Chang. Biol. 1998, 4, 217–227. [Google Scholar] [CrossRef] [Green Version]
  25. Davidson, E.A.; Janssens, I.A.; Lou, Y. On the variability of respiration in terrestrial ecosystems: Moving beyond Q10. Glob. Chang. Biol. 2006, 12, 154–164. [Google Scholar] [CrossRef]
  26. Yuste, J.C.; Janssens, I.A.; Carrara, A.; Meiresonne, L.; Ceulemans, R. Interactive effects of temperature and precipitation on soil respiration in a temperate maritime pine forest. Tree Physiol. 2003, 23, 1263–1270. [Google Scholar] [CrossRef]
  27. Almagro, M.; López, J.; Querejeta, J.I.; Martínez-Mena, M. Temperature dependence of soil CO2 efflux is strongly modulated by seasonal patterns of moisture availability in a Mediterranean ecosystem. Soil Biol. Biochem. 2009, 41, 594–605. [Google Scholar] [CrossRef]
  28. Bahn, M.; Rodeghiero, M.; Anderson-Dunn, M.; Dore, S.; Gimeno, C.; Drösler, M.; Williams, M.; Ammann, C.; Berninger, F.; Flechard, C.; et al. Soil respiration in European grasslands in relation to climate and assimilate supply. Ecosystems 2008, 11, 1352–1367. [Google Scholar] [CrossRef]
  29. Mancinelli, R.; Campiglia, E.; Di Tizio, A.; Marinari, S. Soil carbon dioxide emission and carbon content as affected by conventional and organic cropping systems in Mediterranean environment. Appl. Soil Ecol. 2010, 46, 64–72. [Google Scholar] [CrossRef]
  30. Raich, J.W.; Tufekcioglu, A. Vegetation and soil respiration: Correlations and controls. Biogeochemistry 2000, 48, 71–90. [Google Scholar] [CrossRef]
  31. Zhu, Y.; Pei, J.; Xie, C.; Yu, Y.; Ye, J.; Fang, C.; Yuan, Z.; Gong, Y. Seasonal responses of soil respiration to warming and nitrogen addition in a semi-arid alfalfa-pasture of the Loess Plateau, China. Sci. Total Environ. 2017, 590, 729–738. [Google Scholar]
  32. Bao, X.; Zhu, X.; Chang, X.; Wang, S.; Xu, B.; Luo, C.; Zhang, Z.; Wang, Q.; Rui, Y.; Cui, X. Effects of soil temperature and moisture on soil respiration on the Tibetan plateau. PLoS ONE 2016, 11, 9–15. [Google Scholar] [CrossRef] [PubMed]
  33. Raich, J.W.; Schlesinger, W.H. The global carbon dioxide flux in soil respiration and its relationship to vegetation and climate. Tellus B 1992, 44, 81–99. [Google Scholar] [CrossRef] [Green Version]
  34. Schindlbacher, A.; Zechmeister-Boltenstern, S.; Jandl, R. Carbon losses due to soil warming: Do autotrophic and heterotrophic soil respiration respond equally? Glob. Chang. Biol. 2009, 15, 901–913. [Google Scholar] [CrossRef]
  35. Smith, P. Land use change and soil organic carbon dynamics. Nutr. Cycl. Agroecosyst. 2008, 81, 169–178. [Google Scholar] [CrossRef]
  36. Agnoletti, M. Italian Historical Rural Landscapes. Cultural Values for the Environment and Rural Development; Agnoletti, M., Ed.; Springer: Dordrecht, The Netherlands, 2013. [Google Scholar]
  37. Boix-Fayos, C.; De Vente, J.; Albaladejo, J.; Martínez-Mena, M. Soil carbon erosion and stock as affected by land use changes at the catchment scale in Mediterranean ecosystems. Agric. Ecosyst. Environ. 2009, 133, 75–85. [Google Scholar] [CrossRef]
  38. Nadeu, E.; Van Oost, K.; Boix-Fayos, C.; De Vente, J. Importance of land use patterns for erosion-induced carbon fluxes in a Mediterranean catchment. Agric. Ecosyst. Environ. 2014, 189, 181–189. [Google Scholar] [CrossRef]
  39. Drewnik, M.; Musielok, Ł.; Stolarczyk, M.; Mitka, J.; Gus, M. Effects of exposure and vegetation type on organic matter stock in the soils of subalpine meadows in the Eastern Carpathians. Catena 2016, 147, 167–176. [Google Scholar] [CrossRef]
  40. Novelli, L.E.; Caviglia, O.P.; Piñeiro, G. Increased cropping intensity improves crop residue inputs to the soil and aggregate-associated soil organic carbon stocks. Soil Tillage Res. 2017, 165, 128–136. [Google Scholar] [CrossRef] [Green Version]
  41. Toderi, M.; Francioni, M.; Seddaiu, G.; Roggero, P.P.; Trozzo, L.; D’Ottavio, P. Bottom-up design process of agri-environmental measures at a landscape scale: Evidence from case studies on biodiversity conservation and water protection. Land Use Policy 2017, 68, 295–305. [Google Scholar] [CrossRef]
Figure 1. Precipitation and air temperatures during the experimental period (January to December 2015; source: Regione Marche—Servizio Protezione Civile).
Agriculture 09 00165 g001
Figure 2. Seasonal variations of the soil and heterotrophic respiration, and the soil water content (SWC) and soil temperature (as indicated), for the three cultivation types of permanent grassland (A), lentil (B) and emmer (C). SWC was defined at 20 cm in depth; soil temperature was defined at 10 cm in depth. Vertical bars represent standard errors. Black arrow, sowing date; white arrow, harvesting date, for lentil and emmer cultivation.
Agriculture 09 00165 g002
Figure 3. Relationships between the variations of the total (closed circles, full line) and heterotrophic (open circles, dashed line) respiration and the soil temperature (at 10 cm in depth) for the grassland (A), lentil (B), and emmer (C) experimental fields. Data are means of three plots per field. * p < 0.05.
Agriculture 09 00165 g003
Figure 4. Cumulative total and heterotrophic soil respiration for the grassland, lentil and emmer experimental fields. Different letters indicate significant differences (p < 0.05) between soil uses. Vertical bars indicate standard errors.
Agriculture 09 00165 g004
Table 1. Basic physicochemical characteristics of the soils in the three experimental fields, from the first 0 cm to 20 cm layer. Soil bulk density was determined through tests for gravelly and rocky soils, and total organic carbon by the Springer–Klee method. Data are means ±standard error (n = 5 subsamples per field).
Field CultivationpHSand (%)Silt (%)Clay ( %)Gravel (%)Soil Bulk Density (g cm−3)Wilting Point (%)Field Capacity (%)Total Organic C (%)
Grassland7.6 ± 0.1360.83 ± 1.3635.70 ± 2.653.47 ± 1.3165.33 ± 5.030.92 ± 0.0645.30 ± 4.2356.16 ± 6.5314.68 ± 0.77
Lentil8.0 ± 0.0143.37 ± 2.0845.53 ± 1.4211.10 ± 2.7272.33 ± 4.041.10 ± 0.1124.64 ± 1.9637.21 ± 3.616.80 ± 1.27
Emmer7.9 ± 0.0448.03 ± 1.0044.87 ± 0.467.10 ± 0.6267.67 ± 2.520.80 ± 0.1033.39 ± 1.7844.64 ± 12.910.40 ± 1.38
Table 2. R10 and Q10 values for the grassland, lentil and emmer experimental fields.
Experimental FieldSoil RespirationabR10Q10
GrasslandTotal0.100.080.222.23
Heterotrophic0.060.090.152.46
LentilTotal0.020.150.094.48
Heterotrophic0.070.060.131.82
EmmerTotal0.010.180.066.05
Heterotrophic0.020.140.084.06

