
Abstract
We report the first results of molecular frame photoelectron emission for dissociative photoionization (DPI) of H2 and D2 molecules induced by a spectrally filtered single high harmonic of a few femtosecond duration, using coincident electron–ion velocity vector correlation techniques. For the studied photon energies around 32 eV, where the resonant excitation of the Q1 and Q2 doubly excited states occurs, autoionization and nuclear dynamics are coupled on a few femtosecond timescale, giving rise to quantum interferences. Molecular frame photoelectron angular distributions (MFPADs), traced as a function of the kinetic energy release of the atomic fragments, provide the most sensitive observables for such complex dynamics. These results compare well with recent spectrally resolved experiments using synchrotron radiation which are also reported. As a novel XUV light source running at multi-kHz repetition rate and synchronized with laser pulses, high-order harmonic generation (HHG) opens new possibilities for extending these investigations to time-resolved studies at the femtosecond scale.
Export citation and abstract BibTeX RIS
1. Introduction
Probing ultrafast electronic and nuclear dynamics in excited neutral or ionic molecules in the gas phase is at the core of a vast field which now extends from femto- to atto-science. The ultimate goal is to combine understanding and control of such dynamics to produce a snapshot mapping of the electronic density or wavefunction at the molecular scale with femto to attosecond temporal resolution.
Alternative experimental approaches, taking advantage of remarkable advances in ultrashort light sources and imaging techniques, have been explored in the last few years. In the first approach, the probe is provided by the interaction of the molecule with a strong laser field at the optical cycle timescale. It includes tunnel ionization which reveals the molecular orbital 'shape' and symmetry (Jaron-Becker et al 2003, Alnaser et al 2005, Pavicic et al 2007), and electronic wavepacket recollision in a 'self-probing' scheme, leading to either high-energy electrons in above-threshold ionization and electron diffraction (Meckel et al 2008, Cornaggia 2010, Boguslavskiy et al 2012), or attosecond emission and high harmonic generation (HHG) in the extreme-UV range (XUV) (Itatani et al 2004, Li et al 2008, Wörner et al 2010, Haessler et al 2010, Mairesse et al 2010, Torres et al 2010). In the HHG process, spectral amplitude and phase of the emitted light gives access to the molecular dipole which couples the bound valence wavefunction to a large set of continuum states, providing a basis for the time-resolved tomographic reconstruction of molecular orbitals (Itatani et al 2004, Torres and Marangos 2007, Haessler et al 2010, Vozzi et al 2011, Le et al 2009). The self-probing scheme is especially adapted for studying electronic/nuclear dynamics which is triggered by the strong field itself, therefore, acting simultaneously as pump and probe, e.g., in multi-orbital coherent evolution after tunnel ionization (Mairesse et al 2010, McFarland et al 2008, Smirnova et al 2009, Diveki et al 2012). Accordingly, it intrinsically puts limit to the possibility of exploring field-free dynamics. In the second 'external probing' approach, the excitation and probe of a target molecule are provided by a combination of ultrashort XUV-laser pulses with a controlled delay at the as timescale. Several studies have investigated electronic/nuclear dynamics after photoionization (PI) by high harmonic pulses using laser pulses as a coherent probe or a control field, e.g., in H2 and D2 (Gagnon et al 2008, Sansone et al 2010, Kelkensberg et al 2009, 2011), O2 (Siu et al 2011), or Br2 (Li et al 2010). At even higher intensity and shorter wavelength in the XUV range, coherent dynamics is also investigated in the same type of pump/probe studies using free electron lasers (FELs) (Johnsson et al 2009, Rudenko et al 2010, Cryan et al 2012).
To understand the dynamics at the deepest level in both approaches, it is of particular relevance to follow the electronic motion in the molecular frame. To that purpose, the use of impulsive alignment of the molecular target plays a key role in a number of laser-based experiments. When photoionization is involved, the molecular frame photoelectron angular distribution (MFPAD) is one of the most 'complete' electronic observables which describe photoemission in the presence of nuclear motion (see Reid 2012 for a recent review). MFPADs sensitively depend on the detailed symmetry of the initial bound state and the final ionic state, of the quantum interferences between ionization channels, as on the phase and polarization properties of light. It is therefore highly relevant as a 'probe' observable of ultrafast coherent dynamics in molecules, where multiple pulse excitation and attosecond phase control allow for extensively varying state symmetries and channel interferences. The advantage of molecular alignment for the determination of MFPADs has been demonstrated, e.g., in a strong field ionization of polyatomic molecules such as OCS (Holmegaard et al 2010), time-resolved imaging of electron dynamics during the non-adiabatic photodissociation of CS2 (Bisgaard et al 2009), and most recently for the photoionization of N2, O2 and CO induced by ultrashort XUV–HHG sources (Rouzée et al 2012).
On the other hand, it is well established that dissociative photoionization (DPI) allows one to determine MFPADs by means of electron–ion coincidence momentum spectroscopy, in the axial recoil approximation, primarily for high (MHz) repetition rate light sources such as synchrotron radiation (SR) (e.g., Landers et al 2001, Lafosse et al 2002, Yagishita et al 2005, Liu et al 2008, Reid 2012 and references therein). Although the typical rate for femtosecond lasers (of mJ energy) and HHG XUV sources in the kHz range is more challenging for coincident experiments, time-resolved MFPADs have been obtained using electron–ion vector correlations for DPI of small polyatomic molecules such as NO2 induced by the first harmonics of femtosecond IR lasers (Davies et al 2000, Vredenborg et al 2008). Moreover, in experiments coupling a kHz HHG light source and a COLTRIMS spectrometer, time-resolved electron–ion kinetic energy correlations characterizing, e.g., autoionization of O2 (Sandhu et al 2008, Cao et al 2011), and angular dependence of single-photon ionization of N2 and CO2 into resolved ionic states (Thomann et al 2008) have been reported.
In this paper, we demonstrate the measurement of MFPADs in the dissociative ionization of H2 and D2, after resonant excitation of doubly excited states (DES) belonging to the Q1 and Q2 series, by femtosecond XUV pulses at 31.9 eV produced from HHG, using the electron–ion coincidence vector correlation (VC) method (Lafosse et al 2000) and taking advantage of a complete analytical description of the MFPADs (Lucchese et al 2002, Dowek and Lucchese 2012). We validate the MFPADs measured using the HHG pulses, by comparing them with those measured at the SOLEIL synchrotron, in the same spectral region. This work was first motivated by a recent theoretical description of single-photon DPI in H2 and D2 as a function of the XUV pulse duration between 1 and 10 fs. These calculations predict significant effects of the pulse duration on the kinetic energy release (KER) of the atomic fragments (Sanz-Vicario et al 2006), as well as an evolution of the MFPADs as a function of the KER at the femtosecond scale (Peréz-Torres et al 2009). In a single-photon process, these effects relate to the overall spectral width of the electronic/nuclear wavepacket which is excited in the Q1 and Q2 regions and evolves accordingly in the autoionization/dissociation channels (González-Castrillo et al 2011). In this relatively simple case, it was interesting to parallel the HHG-based experiment performed with 'broadband' XUV pulses at 1 kHz 'low' repetition rate and limited statistics in VC, with the SR-based study serving as a reference. Second, our study on steady-state H2 and D2 has clear objective to prepare dynamical studies using dissociative (or non dissociative) PI as a probe, where time-resolved MFPAD could give detailed and reliable information on the electronic wavepacket evolving in the nuclear field. Photoelectron angular distributions in XUV + IR two-colour PI of atoms, investigated previously using a related experimental setup, have shown to be a sensitive probe of interferences between ionization pathways involving different numbers of photons (Guyétand et al 2008a and 2008b).
As the simplest molecule, hydrogen is often considered as a prototype system in molecular physics. Despite its structural simplicity, the detailed understanding of its dynamics launched by interaction with light is still challenging, both experimentally and theoretically. This is particularly the case after resonant XUV excitation of the Q1 and Q2 series of repulsive DES embedded in the continuum of the H2+(2Σg+) and H2+(2Σu+) ionic states, respectively. Among different possible reactions in these open channels, DPI: H2 + hν → H+ + H(1s) + e−, is especially interesting since electronic autoionization (AI) and nuclear dissociation dynamics are coupled, both occurring within a few femtoseconds (Sanz-Vicario et al 2006, Sansone et al 2010).
Following a vertical excitation in the Franck–Condon region (FC) of the H2 ground state (X 1Σg+) induced by one photon absorption in the 28–35 eV range, DPI involves several pathways describing the evolution of the H2* system as a function of the internuclear distance R. It can be represented semi-classically using potential energy curves, as shown in figure 1: direct ionization (DI) into the dissociative continuum of the molecular ion ground state H2+(X 2Σg+), DI into the first excited molecular ionic state H2+(2Σu+), AI into the H2+(X 2Σg+) ionic ground state via the first DES Q1 1Σu+, which is mostly contributing to AI for the Q1 series, and AI via the second DES Q2 1Πu, which is mostly contributing for the Q2 series, into both the H2+(X 2Σg+) ground state and the H2+(2Σu+) ionic state. All these pathways lead to the only populated first dissociation limit H+ + H(1s) + e−, (see L1 label in figure 1.) and were recognized in pioneering studies (Ito et al 1996, Latimer et al 1995). When they are kinematically indistinguishable, producing a photoelectron and a photoion fragment of comparable energies, it has been shown that quantum mechanical interferences occur, which involve both resonant and non-resonant ionization (Sanchez and Martin 1997a, 1999a) as well as autoionization into ionic states of different u-g symmetry, taking place at different internuclear distances (Martín et al 2007).
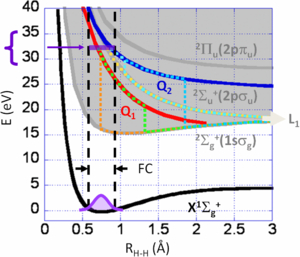
Figure 1. Selected potential energy curves of the H2 and H2+ systems involved in DPI induced at 31.6 eV ≤ hν ≤ 32.7 eV (see text), with the shaded area representing the ionization continuum above the H2+(2Σg+) ground state and the vertical dashed lines the Franck–Condon region from the H2(X 1Σg+ v = 0) ground state. Q1 (1Σu+) (red line) and Q2 (1Πu) (blue line) are the lowest DES of the Q1 and Q2 series converging to the first H2+(2Σu+) and second H2+(2Πu) excited states (grey line), respectively. Five semi-classical pathways for DPI are featured in dotted line: direct ionization (DI) into the H2+(2Σg+) ground state (orange), DI into the H2+(2Σu+) state (yellow), autoionization (AI) of the Q1 (1Σu+) state into the H2+ (2Σg+) ground state (green), AI of the Q2(1Πu) state into the H2+ (2Σg+) (light-blue) and H2+(2Σu+) (turquoise) states, respectively.
Download figure:
Standard imageComplete experiments, relying on coincident electron–ion momentum spectroscopy, have been performed in order to characterize the outcome of such DPI reactions (Lafosse et al 2003, Martín et al 2007). They provide for each (H+, e) DPI event, the (VH+, Ve) velocity VC. Within the axial recoil approximation, they enable one to record molecular-frame (MF) photoemission as a function of the KER transferred to the H+ + H dissociating pair, or the photoelectron energy which is complementary for a given photon excitation energy and dissociation limit. Using linearly polarized SR, the MFPADs revealed symmetry breaking in terms of backward–forward (BW–FW) emission asymmetries, resulting from quantum interferences involving different reactions pathways (Lafosse et al 2003, Martín et al 2007, Fernàndez and Martìn 2009). Quantum interferences also govern the occurrence of strong oscillations of the βe asymmetry parameter characterizing the photoelectron angular distribution relative to the polarization axis as a function of the photoelectron energy, predicted theoretically (Fernàndez and Martìn 2009), and recently demonstrated in the measurements of DPI of H2 and D2 (Reddish et al 2012). Inducing DPI by a circularly polarized SR also revealed remarkable properties of the molecular frame circular dichroism in photoionization of H2 (Dowek et al 2010), a fingerprint of the invoked quantum interferences. A detailed comparison of the circular dichroism measured as a function of the KER with state of the art calculations using the time-dependent Schrödinger equation supports the existence of two autoionization regimes in the femtosecond range (Dowek et al 2010), consistent with previous evaluations of the AI lifetimes of the Q1 and Q2 DES (Sanchez and Martin 1997b, 1999b).
The paper is organized as follows. In section 2, we describe the experimental setup which has been used to perform the experiments at the Saclay Laser-Matter Interaction Center (SLIC, CEA-Saclay) and at the SOLEIL synchrotron, including the VC electron–ion momentum spectrometer. In the description of light sources, more emphasis is put on the XUV HHG beam line, which was combined here for the first time with the VC spectrometer. In section 3, we report the experimental results characterizing the DPI channels populated by the interaction of XUV femtosecond pulses with H2 and D2 targets in terms of the electron–ion kinetic energy correlation diagrams (KECDs). The KECD is the first 2D observable which demonstrates that the acquisition of (H+, e) coincident events is achieved and that the (VH+, Ve) correlation is properly determined. In section 4, these results are compared with reference measurements performed at SOLEIL at six photon excitation energies in the 31.6–32.7 eV range: namely we compare the 1D ion yield spectra displaying the ion yield as a function of the ion fragment kinetic energy, as well as the 1D βH+/D+ ion asymmetry parameter dependence as a function of the ion kinetic energy. Section 5 is dedicated to the discussion of the MFPADs, relying on the determination of four FLN(θe) 1D functions and their expansion in Legendre polynomials, where θe is the polar emission angle of the photoelectron in the MF frame, according to the general analytical expression of the MFPAD developed previously (Lucchese et al 2002). This method is shown to be very helpful to achieve the feasibility of doubly differential measurements relying on electron–ion coincidence momentum spectroscopy, when using a light source of a few kHz repetition rate. Here again, comparing the MFPADs induced by the H21 harmonic femtosecond pulse with reference data measured at SOLEIL provides a support for the data achieved.
2. Experimental setup
In the experiment, an XUV beam of photon energy around 32 eV is crossed with an H2/D2 supersonic beam in the source volume of an electron/ion momentum imaging spectrometer, producing dissociative photoionization through resonant excitation in the Q1 and Q2 DES region. In the first part, DPI is produced by femtosecond XUV pulses from laser-driven high harmonic generation; experiment was installed by the PLFA laser at CEA-SLIC facility. In the second part, DPI is produced by the SR on the XUV DESIRS beamline at SOLEIL (Nahon et al 2012). We describe the VC setup and method common to the two parts, and then focus on the HHG source.
2.1. Electron–ion vector correlation
The electron–ion velocity spectrometer used in this work, described in detail previously (Lafosse et al 2000, Lebech et al 2002), is schematized in figure 2. The interaction region, at the crossing of the supersonic jet of randomly oriented hydrogen or deuterium molecules and the light beam, is located at the centre of the spectrometer. Positive ions and electrons are extracted in opposite directions from the interaction region by a dc uniform electric field of few tens of V cm–1 and guided to two time and position sensitive delay-line anode detectors (PSDs) (RoentDek xxxx) through an intermediate region where two focusing electrostatic lens sets (Λi and Λe) are applied. The extraction field was chosen such that the spectrometer ensures a 4π steradian collection of ion fragments and electrons for the Ee-KER region of interest. Here, typically an extraction field of Eextr = 100 V cm−1 or 150 V cm−1 was used, ensuring both a 4π collection of the ions (H+ or D+) and a 4π collection of the electrons (e−) for Ee < 9 eV and Ee < 14 eV kinetic energy, respectively. The time signals from the ends of the delay lines are encoded as stop signals in an eight-channel time-to-digital converter (TDC) (DTPI xxxx) with an encoding step of 250 ps, where four channels are dedicated to the positive ion detector delay lines and four to the electron detector delay lines. The TDC outgoing signals provide the ion position and time of flight (TOF) for the ion fragment and the electron position, while the use of a time-to-amplitude converter (TAC) is preferred to measure the TOF of the electron with an optimal resolution. The (Vx, Vy and Vz) velocity components are derived from the position coordinates and TOF for each particle of the (H+, e) coincident event leading to the (VH+, Ve) VC.
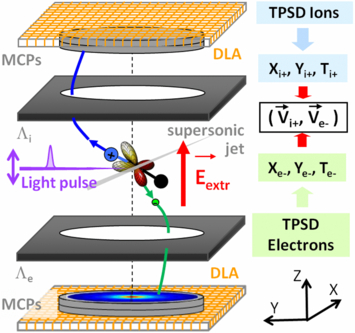
Figure 2. Scheme of the electron–ion 3D velocity spectrometer. Electrons and ions are extracted from the interaction region, at the crossing of the supersonic beam of randomly oriented molecules and the pulsed XUV light beam, by a dc uniform electric field and guided to their respective delay-line anode (DLA) position sensitive detector (PSD) using electrostatic lenses Λe and Λi which focus electron and ion trajectories outside the extraction region. The extraction field (Eextr = 100 or 150 V cm−1 here) ensures a 4π steradian solid angle collection of the ions and the electrons of interest. For each particle, the measured time of flight (T) and impact position (x, y) on the PSD allows us to measure the 3D velocity vector, leading to the (VH+, Ve-) vector correlation for each (H+, e) coincident event. Within the axial recoil approximation, one accesses to molecular frame photoelectron angular distribution (MFPAD), as sketched here for an example of perpendicular transition.
Download figure:
Standard imageOnly the timing of the event acquisition differs depending on whether the 1 kHz XUV light source or the MHz SR is used. In the HHG induced ionization, we use a logical signal synchronous with the 1 kHz laser pulse as the common start for the eight channels of the TDC and the TAC. The stop of the TAC consists of the signal detected on the front micro-channel plate (MCP) of the electron detector. At SOLEIL, it is more efficient to use the signal detected on the front MCP of the electron detector as a common start for the CTN-TDC and the TAC, the logical signal synchronous with the SOLEIL light pulse serving as the stop for the TAC.
Performing coincidence measurements requires the occurrence of a maximum of one event per pulse, which imposes that on average the count rate per pulse must be on the order of a few per cent (Stert et al 1999, Davies et al 2000, Vredenborg et al 2008). When an SR light source is used, the few MHz typical repetition rate enables us to perform coincidence measurements with a ∼10−3 rate of events per pulse, producing adequate acquisition statistics in a limited time. Under the present conditions, of a laser-based source with a repetition rate of 1 kHz, we determined that an acquisition rate of the order of few tens coinc s–1 (or 0.1 event/pulse) ensures a true-coincidence acquisition mode. Therefore the data reported in this paper are of very different statistical quality: an experiment of DPI of H2 or D2 induced by H21 femtosecond pulses kept in stable conditions during few hours corresponds typically to about 200 000 coincident events recorded, among which less than 10 000 pertain to the DPI channels (H+, e) or (D+, e).
The VC spectrometer was mounted onto the CIEL ultrahigh-vacuum (UHV) chamber (Guyétand et al 2008a), working at a standing pressure of 10−9 mbar for the experiments using the PLFA HHG source at SLIC, or installed in the SAPHIRS set-up (Richard-Viard et al 1996) for those using the SR on the DESIRS beamline at SOLEIL. The continuous molecular supersonic expansion (backing pressure about 1.5 bars) produced through a 70 µm continuous nozzle was shaped by two skimmers (ϕ1 = 200 µm, ϕ2 = 300 µm) in CIEL and one skimmer (ϕ = 1 mm) in SAPHIRS, corresponding to a beam diameter at the interaction centre on the order of 1 mm and 2–3 mm, respectively. The ratio achieved between the supersonic and thermalized components of the molecular beam in these measurements was typically of ρ ≈ 2 to 3 for H2 and ρ ≈ 4 for D2. The dimensions of the light beam at the focus point were typically of the order of 200 µm in the horizontal direction (x) and 100 µm in the vertical direction (z) at SOLEIL; the focal spot diameter is ∼250 µm at SLIC (see below). The main instrumental widths contributing to the resolution in the determination of the velocity components, and subsequently energies and angles of the emitted charged particles, are the δy length of the interaction region along the light beam axis, and the δt jitter of the electron TOF estimated here of the order of δt ≈ 170 ps, affecting Vye, Vyi and Vze, respectively.
For the measurements discussed in this paper, the SOLEIL SR facility, delivering 40 ps (FWHM) light pulses, was operated in the single-bunch mode which corresponds to a 0.85 MHz repetition rate. In this mode, one estimates the number of photons to be in the range of 10+5–10+6 photons per pulse, giving around 10+11–10+12 photons per second for the 1000 resolving power used here. With the goal to perform benchmarking reference experiments for the coincidence measurements using the H21 harmonic, the DESIRS undulator based high-resolution beamline was run below the optimal resolution: using a 400 grooves mm–1 grating and entrance and exit slits of 100 µm, resulted into a 30 meV spectral resolution (FWHM). The light beam was linearly polarized (P) parallel to the VC spectrometer axis z as in the experiments performed with the femtosecond XUV source described in section 2.2.
2.2. Femtosecond XUV source
The femtosecond XUV source is schematized in figure 3. The PLFA laser chain is based on chirped pulse amplification (CPA) of a titanium–sapphire (Ti:Sa) oscillator in a three-stage amplifier at 1 kHz repetition rate. It delivers pulses centred at λNIR ≈ 806 nm with a full width at half-maximum (FWHM) of 25 nm, i.e., a pulse duration of ∼45 fs, and a beam quality factor M2PLFA ∼ 1.5. Laser pulses of effective 6–7 mJ energy were focused with a lens of 3 m focal length (f-number ∼100) into a 4 cm long cell, containing argon (Ar) gas at 1–4 mbar pressure. For NIR focal spot of diameter ∼250 µm, the intensity driving HHG was close to ∼10+14 W cm−2, i.e., the saturation intensity in Ar. The generating NIR beam was then removed, first, using a silica plate (not shown in figure 3 for clarity), working at ≈11° grazing incidence angle and reflecting RPlate ∼ 50% of XUV harmonics, and second together with low harmonics (order ≤ 11), using a 200 nm thick aluminium (Al) filter transmitting TFilter ∼ 10% of high XUV harmonics. H21 selection was ensured by a set of B4C/Si plane and spherical multilayer mirrors working near normal incidence at 4°, especially designed to achieve high reflectivity RH21 ≈ 30% for H21 and to reject the lower and higher order harmonics (< 2% for two mirrors), as shown in figure 3(b); the multilayer mirrors have been deposited at the CEMOX platform for x-ray optics (CEMOX xxxx).

Figure 3. (a) Scheme of high-order harmonic generation (HHG) source delivering selected 21st harmonic (H21) femtosecond pulses at 1 kHz repetition rate. The PLFA laser pulses (central wavelength ∼806 nm, energy per pulse ∼6–7 mJ, pulses duration ∼45 fs) are focused by a 3 m focal length lens into a HHG 4 cm long cell filled with 1 to 4 mbar of Ar. Infra-Red generation beam and low harmonics (until 11th) are filtered by an aluminium (Al) filter of 200 nm thickness (see text). H21 is selected from HHG spectrum by a set of two dielectric mirrors. The duration of the pulses around 32 eV (38 nm) is estimated to be 20 ± 5 fs. (b) Illustration of the spectral selectivity of the multilayers mirrors: HHG wavelength spectra measured without mirror (black full line), measured with one mirror (pink full line) and deduced for two mirrors (violet full line). The three H21 peak signals are equalized to illustrate rejection of other harmonics.
Download figure:
Standard imageThe XUV light pulses from HHG have been characterized spectrally, first in the course of the experiment using the electron spectrometer, and second after the experiment (HHG in the same conditions) using an XUV light spectrometer. Both measurements are compatible and determine a central photon energy EH21 = 31.9 ± 0.3 eV (note that it is slightly lower than the expected value 32.27 eV for H21, which may be due to HHG in the 'red wing' of slightly chirped IR pulses, Altucci et al 1998, Tcherbakoff et al 2003), and a spectral width of 0.35 ± 0.05 eV FWHM. In the generating conditions, the XUV pulse duration is estimated to be in the 15–25 fs FWHM range (Mairesse et al 2005, Sola et al 2006); it is larger than the Fourier limit (∼7 fs) because of the harmonic chirp introduced by the intensity-dependent phase of the harmonic emission (Salières et al 1999). Note that, in order to prepare pump/probe studies with XUV pulses of adjustable duration, the XUV pulse duration has been tentatively varied using the polarization gating technique (Tcherbakoff et al 2003, Sola et al 2006). However, in this work we only monitored the variation of H21 spectral profile between the with/without gate configurations, i.e., a variation of the spectral width by ∼200 meV; this is not sufficient to characterize the pulse duration. Actually, under our experimental conditions, the intensity temporal gradient was lower in the gate than without, leading to a reduced harmonic chirp; temporal confinement and reduced chirp in the gate partially compensate and result in the limited variation of the spectral profile which is measured. Finally, under our experimental conditions of limited statistics, we found that the DPI measurements did not significantly vary between the with/without gate configurations.
The number of photons was estimated to a few 10+8 photons per pulse, thus giving around 10+11 photons per second. The XUV beam was focused in the interaction chamber by means of two multilayer mirrors (plane and spherical with 50 cm focal length at ∼normal incidence) for spectral selection and focusing of H21. This leads to an XUV focal spot of diameter ∼250 µm, corresponding to the size of the harmonic source after imaging by the XUV optics, and confocal parameter in the milimetre range.
3. Electron–ion kinetic energy correlations in DPI of H2 and D2 induced by H21 femtosecond pulses
The measurements of DPI of H2 or D2 induced by H21 femtosecond pulses could be performed in stable conditions for few hours: in the first series reported, they correspond typically to an acquisition of about 200 000 coincident events. Examination of the ion TOF spectra, not presented here, shows that the dominant contribution arises from non-dissociative photoionization of H2 or D2 with typically 20 coinc s–1 (≈96%), DPI of the parent molecule amounts to about 0.6 coinc s–1 (≈ 3%) and the residual gas component (mainly H2O+, OH+ and H+) could be kept below 0.2 coinc s–1 (≈1%). These numbers reflect the respective photoionization cross sections and target densities, taking into account the effective collection efficiency for each molecular target. The coincidence rate of the order of 20 coinc s–1 corresponds typically to a rate of 0.1 event per pulse.
The electron–ion kinetic energy correlation diagram (KECD) is the first 2D observable which demonstrates that the acquisition of (H+, e) coincident events is achieved and that the (VH+, Ve) correlation is properly determined. The KECDs derived from the (VH+, Ve) and (VD+, Ve) vector correlations are displayed in figures 4(a) and (b), respectively. They represent 2D histograms of the (H+/D+, e) coincident events as a function of the ion fragment kinetic energy EH+ or ED+ (half of the KER of the (H+ + H)/(D+ + D) fragments) in abscissa and the electron energy Ee in ordinate. Their general structure has been observed and discussed earlier for SR excitation energies inducing resonant DPI of the Q1 and Q2 DES (Lafosse et al 2003, Martín et al 2007, Elkharrat et al 2009). For H21 incident light, the (H+/D+, e) coincident events are distributed along the only populated dissociation limit L1 (H(1s) + H+) at EDiss ≈18.076 eV, with a major contribution of direct ionization into the dissociative component of the H2+(2Σg+) ground state, where most of the excess energy is released to the photoelectron, and to a lower extent into the H2+(2Σu+) dissociative first excited state of the molecular ion, where most of the excess energy is released to the atomic fragments. These structures correspond to the (12.8 eV ≤ Ee ≤ 13.8 eV, 0 eV ≤ EH+/D+ ≤ 0.5 eV, peak D) and (0 eV ≤ Ee ≤ 1.3 eV, 6.2 eV ≤ EH+/D+ ≤ 6.9 eV, peak E) range, not including the broadening due to the instrumental resolution. The structures identified at intermediate Ee and EH+ energies (band A) are the signature of AI processes involving mainly the Q1(1Σu) and Q2(1Πu) lowest DES in each series. These states contribute differently to the ionization process as a function of the KER for the H2 and D2 isotopes, which are identical in terms of electronic properties but dissociate at different nuclei velocity (Elkharrat et al 2009). Other structures contribute to the KECD: on the one hand, weak peaks are seen along the E+ = 0 eV axis which correspond to DI of the H2/D2 molecule induced by the lower harmonics significantly attenuated by the multilayer mirrors in the incident light beam (see figure 3), harmonic H13 providing the largest contribution for Ee ≈ 1.5 eV due to its lower attenuation (peak d). On the other hand, the KECD in figure 4(a) also shows a weak contribution of (H+, e) events produced by DPI of H2O absent in the KECD of the (D+, e) events. In any case, selecting the coincident events along the L1 diagonal filters the events coming from DPI of H2 and D2.
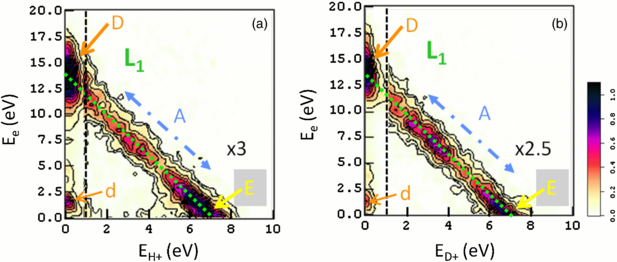
Figure 4. Kinetic energy correlation diagram (KECD) of the (H+, e) (a) and (D+, e) (b) coincident events produced in DPI of H2 and D2 by H21 fs pulses. The green dotted line represents the H+ + H(1s) L1 dissociation limit. The event dispersion about the dotted line illustrates the energy resolution resulting from the instrumental widths (see section 2.1). The dominant peak D corresponds to DI into the dissociative continuum of the H2+(2Σg+)/D2+(2Σg+) ground state, resp., whereas peak E is assigned to DI into the repulsive H2+(2Σu+)/D2+(2Σu+) state. The elongated structure A (blue dotted–dashed line) is the signature of the populated autoionization channels: its intensity distribution along the L1 diagonal is significantly different for the H2 to D2 isotopes (see the text). Peak d corresponds to DI into the H2+(2Σg+)/D2+(2Σg+) ground state, induced by harmonic H13, less strongly attenuated than the H19-H15 series. Colour scale in arbitrary units going from white (zero) to black (maxima) as shown, with 3× and 2.5× amplification factors of the right part of the KECDs (1 ⩽ EH +/D + ⩽ 10 eV) relative to the left part (0 ⩽ EH +/D + ⩽ 1 eV) delimited by the vertical dashed line in (a) and (b), respectively. Contour lines feature 10% gaps of the maximum value.
Download figure:
Standard image4. Spectral dependence of ion fragment yields and angular distributions as a function of the ion fragment kinetic energy
In order to qualify the DPI measurements performed by irradiation with the broadband H21 femtosecond pulses, we compare these results with similar data recorded at the SR SOLEIL, mapping the 31.6–32.7 eV photon excitation energy region at six discrete energies.
4.1. Spectral dependence of the H+/D+ ion fragment energy spectra
For a quantitative comparison of the electron–ion kinetic energy distributions, it is convenient to plot the 1D ion yield as a function of the EH+/ED+ ion energy, as shown in figure 5. We select the 2–8 eV E+ ion energy range where the most interesting dynamical features occur, for which a 4π collection of both (H+/D+, e) particles is achieved, and normalize the set of spectra in this energy region. The 1D histogram is obtained after selection of the (H+/D+, e) coincident events along the L1 diagonal and projection onto the EH+/D+ axis.

Figure 5. IH+ (a) and ID+ (b) ion yield spectra as a function of the E+ ion kinetic energy measured for DPI of H2 (resp. D2) induced by H21 (purple dots) compared to those induced by SR at 31.98 eV (red-up triangles, also included in (c) and (d)); IH+ (c) and ID+ (d) ion yield spectra measured for DPI of H2 (resp. D2) induced by the SR at six photon excitation energies: 31.68 eV (blue dots), 31.98 eV (red up-triangles), 32.18 eV (green squares), 32.28 eV (black circles), 32.50 eV (pink down-triangles) and 32.68 eV (light-blue diamonds). Here, each data point corresponds to an integration band of ΔE+ = 1 eV and ΔE+ = 0.5 eV for the H21 and the SR experiments, respectively. The spectra are normalized to the integral cross section in this energy region. Error bars of the SR measurements have a size comparable to the symbols in the graph.
Download figure:
Standard imageAlthough the statistical quality of the two sets of measurements is quite different, with about 3000 events in each set for the H21 data, compared to 150 000 events for the SR data acquired in a comparable time, the comparison is very consistent. The two maxima at EH/D+ ≈ 3.5 eV and EH/D+ ≈ 6 eV in the I(EH+) or and I(ED+) spectra, with a relative importance specific of the H2 or D2 isotope, are well identified in the H21 fs experiment. Furthermore, the clear evolution of the ion yield spectra with photon energy at SOLEIL, in particular for the D2 target, supports the excitation energy assigned to the H21 harmonic as ranging between 31.68 and 31.98 eV.
4.2. Spectral dependence of the angular distribution of the H+/D+ ion fragments
The second step of comparison between the outcome of the H21 induced DPI reactions and the set of reference measurements performed at SOLEIL is presented in figure 6. It displays the H+/D+ ion fragment angular distribution relative to the polarization axis in terms of the 1D βH+/D+ ion asymmetry parameter dependence as a function of the ion kinetic energy, where −1 ≤ β ≤ 2. Here again, the evolution of the βH+ and βD+ asymmetry parameters for DPI induced by the H21 fs pulses is quite similar to that measured for an SR excitation energy hν ≈ 31.9 eV. The positive β values characterize the overall dominant role of the parallel transition at this excitation energy in the EH+ ⩾ 3.5 eV range for H2 and 2 eV ≤ ED+ ⩽ 5.5 eV for D2, involving primarily the resonant excitation and subsequent AI of the Q1(1Σu+) state, as discussed in section 5. The minimum observed for βH+ and βD+ around ED+ ≈ 6 eV, more pronounced for D2, indicates the contribution of the perpendicular transition assigned to AI of the Q2(1Πu) state. The different evolution of βH+ and βD+ as a function of the KER for the H2 and D2 isotopes is consistent with the fact that AI of the Q1(1Σu+) state dominates at lower KER values for D2 than for H2. The significant spectral dependence of the βH+/D+ curves, which decrease with increasing photon energy, illustrates the increasing contribution of resonant excitation and subsequent AI of the Q2(1Πu) state when the photon excitation energy gets higher.
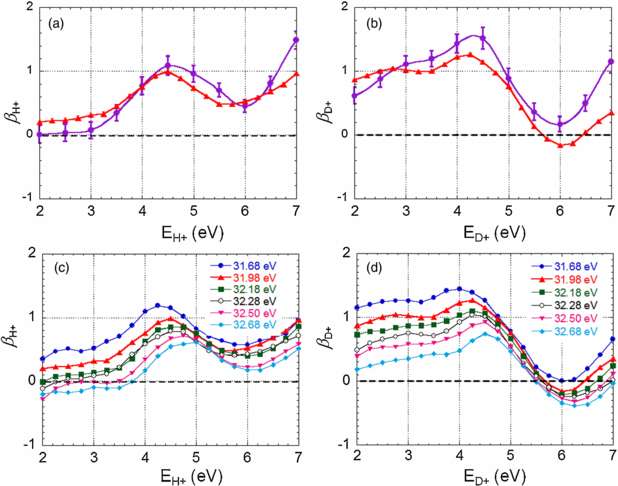
Figure 6. βH+ (a) and βD+ (b) ion fragment asymmetry parameters as a function of the E+ ion kinetic energy measured for DPI of H2 (resp. D2) induced by H21 (purple dots) compared to those induced by SR at 31.98 eV (red-up triangles, also included in (c) and (d)); βH+ (c) and βD+ (d) asymmetry parameters measured for DPI of H2 (resp. D2) induced by the SR at six photon excitation energies: 31.68 (blue dots), 31.98 (red up-triangles), 32.18 (green squares), 32.28 (black circles), 32.50 (pink down-triangles) and 32.68 eV (light-blue diamonds). Error bars of the SR measurements have a size comparable to the symbols in the graph.
Download figure:
Standard image5. Molecular frame photoemission
Within the axial recoil approximation (Zare 1967) which applies for the studied fast dissociation of the H2 /D2 and H2+ /D2+ repulsive states, the angular analysis of the measured (VH+, Ve) and (VD+, Ve) vector correlations for a given selection of coincident events gives access to the MFPADs, for any orientation of the molecular axis with respect to the polarization axis. The generalized MFPAD  is a function of the polar angle χ which refers to the molecular orientation relative to the polarization axis and the electron emission direction (θe, ϕe) characterized by a polar and an azimuthal angles in the MF frame. The polar angle θe is relative to the molecular axis zMF and ϕe accounts for the MF angular dependence relative to the polarization. The evolution of these observables as a function of the ion fragment energy, or KER, provides the most sensitive probe of the photoionization dynamics and its coupling with the nuclear motion. Using the formalism developed previously, gathering the dynamical information in terms of four FLN(θe) functions, with L = (0, 2) and N = (0,1, 2) when PI is induced by linearly polarized light, is an efficient mean to describe MF photoemission (Lucchese et al 2002, Dowek and Lucchese 2012). The FLN(θe) functions are partial-wave expanded as follows:

where the  coefficients express directly in terms of the photoionization dipole matrix elements (Lucchese et al 2002). In this study, the FLN quantities are a function of both the electron emission polar angle with respect to the molecular axis and the EH+/D+ (E+) ion kinetic energy. The general expression of the MFPAD writes in the simple form:

where the χ and ϕe dependence is in terms of the four PLN(cosχ) associated Legendre polynomials and the simple cos(ϕe) and cos(2ϕe) functions, respectively. The FLN functions are derived from a fit of the measured I(χ, θe, ϕe, E+) angular distribution according to equation (1), using the whole statistics of the measurement in the KER region of interest. Here again we focus on the 2–8 eV EH+/D+ energy range where the most interesting dynamical features occur. Once the FLN functions are determined, the MFPADs I(χ, θe, ϕe, E+) are obtained using equation (2) with the same statistical quality for any given orientation χ of the molecular axis. This method is therefore particularly appropriate for the present experimental conditions, when DPI is induced by the 1 kHz HHG light source.
For the data reported in this paper, where photoionization was induced by linearly polarized light P, we select MFPADs for the χ = 0° and χ = 90° molecular orientations relative to P, which represent the parallel and perpendicular components of the PI transition. The  MFPAD has a cylindrical symmetry, and the
  is characterized by a cos(2ϕe) azimuthal dependence. Together with the 3D MFPADs for the χ = 0° and χ = 90° molecular orientations, it is convenient to display the cuts of the two MFPADs in the plane ϕe = 0°/ϕe = 180° defined by the molecular and polarization axes, for a quantitative evaluation of the statistical quality of the data, according to

and
5.1. FLN functions and MFPADs for DPI of H2 and D2 for E+ ≈ 5.5 eV ion kinetic energy
Figure 7 displays linear plots of the F00(θe), F20(θe), F21(θe) and F22(θe) functions measured for DPI of H2 induced by H21 fs pulses, selecting coincident events corresponding to a central ion kinetic energy EH+ = 5.5 eV (5 ≤ EH+ ≤ 6 eV). We select this E+ ion fragment energy as an example to illustrate the MFPADs, on the one hand because it is close to a maximum in the ion yield spectra for both targets, and on the other hand because the βH+ and βD+ asymmetry parameters display a minimum in this energy range, which corresponds to a rather balanced contribution of parallel and perpendicular transitions. The characteristic oscillatory behaviour of the FLN(θe) functions displayed in figure 7 are well identified, with fingerprints quite similar, within the statistical error bars, to those measured for the same EH+ energy selection after excitation by a photon of hν = 31.98 eV at the SR, also shown in figure 7. F22(θe) is of positive sign for the studied processes corresponding to a PI transition from a Σ+ neutral state into an ionic state of same Σ+ symmetry (Lucchese et al 2002). We recall that, due to the spectral width of the H21 pulses mentioned earlier, the angular results in figure 7(a) correspond to the integration over a broader excitation energy bandwidth for the H21 fs source (≈350 meV) than for the SR even when broadened to a 30 meV bandwidth.
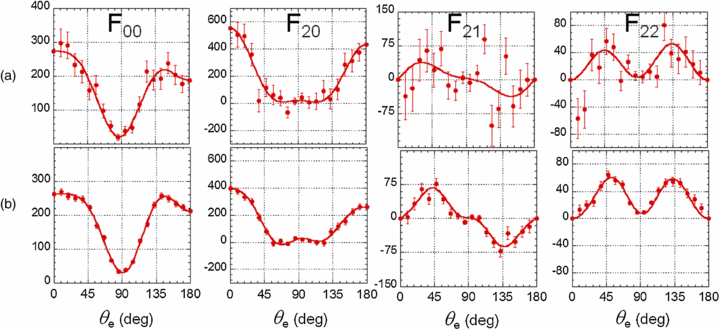
Figure 7. Linear plots of the F00(θe), F20(θe), F21(θe), and F22(θe) functions at the ion kinetic energy EH+ = 5.5 eV measured for DPI of H2 induced by H21 (a) and by synchrotron radiation for a photon energy hν = 31.98 eV (b). Data are represented by red points with the corresponding statistical error bars, and red thin lines are Legendre polynomial fits of the FLNs (see equation (1)). The two sets of functions are normalized to a common value of the photoionization cross section (here in arbitrary units), i.e., such that the integral of F00(θe)*sin(θe) from 0 to π is identical.
Download figure:
Standard imageThe MFPADs derived from these FLN functions using equations (2)–(4) for DPI of H2 induced by H21 and SR are plotted in figures 8(a), (b) and (c), (d) for a molecule aligned parallel and perpendicular to the polarization axis, respectively, with the H+ emission velocity being oriented in the upper direction. The 3D MFPADs are presented for the H21 induced DPI in (a) and (c). The minor differences observed in the FLN functions in figures 7(a) and (b) lead to some differences in the MFPADs for H21 fs pulses and SR excitation modes as plotted in figure 8; however, the general features are quite comparable. The corresponding MFPADs for DPI of D2 are displayed in figures 9(a), (b) and (c), (d) for the same ED+ ≈ 5.5 eV kinetic energy.
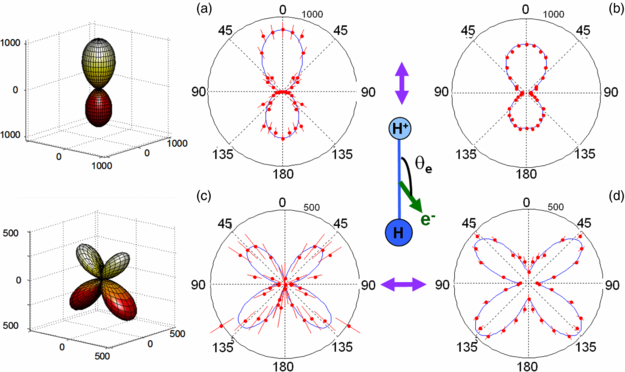
Figure 8. 3D emission diagrams and polar plots representing the molecular-frame photoelectron angular distributions (MFPADs) for DPI of H2 according to equation (1), (3) and (4) for an ion kinetic energy EH+ = 5.5 eV. DPI induced by linearly polarized light parallel to the molecular axis for H21 fs pulses (a) and for SR at a photon energy hν = 31.98 eV (b); DPI induced by linearly polarized light perpendicular to the molecular axis for H21 fs pulses (c) and for SR at a photon energy hν = 31.98 eV (d). The normalization of the plots is consistent with that of the FLN(θe) in figure 7. The 3D plots and the blue line in the 2D plots represent a Legendre polynomial fit of the MFPADs.
Download figure:
Standard image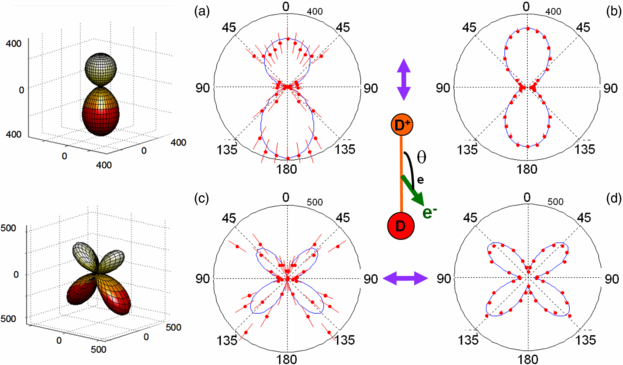
Figure 9. 3D emission diagrams and polar plots representing the MFPADs for DPI of D2 according to equations (1), (3) and (4) for an ion kinetic energy ED+ = 5.5 eV. DPI induced by linearly polarized light parallel to the molecular axis for H21 fs pulses (a) and for the SR at a photon energy hν = 31.98 eV (b); DPI induced by linearly polarized light perpendicular to the molecular axis for H21 fs pulses (c) and for SR at a photon energy hν = 31.98 eV (d). The 3D plots and the blue line in the 2D plots represent a Legendre polynomial fit of the MFPADs.
Download figure:
Standard imageFor H2, the MFPAD induced by H21 for a parallel transition (χ = 0°) (figure 8(a)) displays the typical pattern illustrating the dominant contribution of a scattering p-partial wave, with a notable backward–forward (BW–FW) asymmetry favouring electron emission in the direction of the emitted H+ ionic fragment. Such anisotropies previously observed at neighbour photon excitation energies (Lafosse et al 2003) are assigned to quantum interferences between undistinguishable reaction pathways, here between direct ionization through the H2+(2Σu+) ionic state and AI from the Q1 (1Σu+) state through the H2+(2Σg+) ground state (Fernàndez and Martìn 2009). These emission anisotropies are known to vary significantly as a function of the KER of the atomic fragments and photon energy. For a perpendicular transition (χ = 90°) (figure 8(c)), the MFPAD is characterized by the dominant contribution of a d-partial wave and also displays a strong emission asymmetry as identified previously (Martín et al 2007). In this case, it is due to the interference between two channels of H2+(2Σg+) and H2+(2Σu+) ionic core, respectively, resulting from AI of the Q2 (1Πu) state (Martín et al 2007, Fernàndez and Martín 2009). Consistent with the similarity between the FLN functions measured for DPI induced by H21 and SR shown in figure 7, the MFPADs for the (χ = 0°) and (χ = 90°) at an SR photon energy hν = 31.98 eV reported in figures 8(b) and (d) display the similar features as those induced by H21.
Considering the MFPADs for DPI of D2 for ED+ = 5.5 eV in figure 9, the main difference with the H2 target is observed for the parallel transition where the measured distribution displays an inverse BW–FW emission asymmetry, favouring now the emission of the photoelectron in the direction opposite to that of the D+ ion fragment. It is notable that the measured emission anisotropies discussed in figures 8 and 9 appear larger for the reported H21 data than for those obtained using SR, although the histogramming integration bands are broader (1 eV) for H21 than for SR (0.5 eV). These effects possibly related to the spectral broadband of harmonic light could be explored in further detail, e.g., using a 'narrow' polarization gate to significantly vary the pulse duration and its spectral width. As mentioned in section 2.2, the operation of a polarization gate to control the H21 spectral profile has not been fully conclusive in our conditions, and will be repeated in a further campaign; we therefore do not discuss extensively the possible effects of the XUV spectral width on MFPAD in the present results.
Due to the low statistics for DPI of H2 and D2 induced by the 1 kHz H21 light source, we discuss in the following section an appropriate method to visualize the main features of the MFPADs evolution with the ion fragment kinetic energy, as well as their comparison with the results of the spectrally resolved investigation performed at SOLEIL.
5.2. Evolution of the MFPADs as a function of the ion kinetic energy using Legendre polynomial expansion
An efficient way to synthesize the evolution of the MFPADs as a function of the E+ ion kinetic energy is to take advantage of the partial-wave expansion of the FLN(θe) functions as described in equation (1), and plot the evolution of the CL'LN dynamical coefficients. Consistent with the presentation of the MFPADs for the χ = 0° and χ = 90° molecular orientations in section 4.1, we present here the coefficients of the Legendre polynomial expansion of the Iχ = 0° (θe) and Iχ = 90° (θe) MFPADs. For simplicity, Iχ = 90° (θe, E+) is reduced in this section to its main contribution:

which corresponds to the expression of  averaged over ϕe.
Under such conditions, both Iχ = 0° (θe) and Iχ = 90° (θe) expand in terms of  Legendre polynomials involving then a set of DL' single index dynamical parameters, according to

where lmax is the maximum angular momentum considered in the partial wave expansion. Here lmax = 3 corresponds to the inclusion of up to f partial waves. The evolution of the DL' coefficients, where L' is even, characterizes the outcome of the dominant partial waves as a function of the KER, whereas those with odd L' values, of smaller amplitude, describe the BW–FW emission anisotropies. In this paper, we focus on the presentation of the DL' coefficients, for even L' values, which are the most robust in particular for DPI induced by the H21 fs pulses. BW–FW asymmetries derived for the DPI processes induced by the SR will be discussed separately. Figure 10 displays the evolution of the DL'(0°) and DL'(90°) coefficients, with L' = 0, 2,4,6, for DPI of H2 (a), (b) and D2 (c), (d) recorded at SOLEIL at a photon excitation energy hν = 31.98 eV. As discussed above, the isotope effect when moving from H2 to D2 is most clearly observed for the parallel transition, where the maximum of the D0(0°) cross section is reached for a higher E+ kinetic energy for H2 (EH+ ≈ 6 eV) than for D2 (ED+ ≈ 3.5 eV), with a dominant contribution of a pσ partial wave in both cases. The D0(90°) cross sections are quite similar for H2 and D2: they both display two maxima, the strongest around E+ ≈ 6 eV, with a large contribution of a dπ partial wave reflected here by a negative D4(90°) parameter.
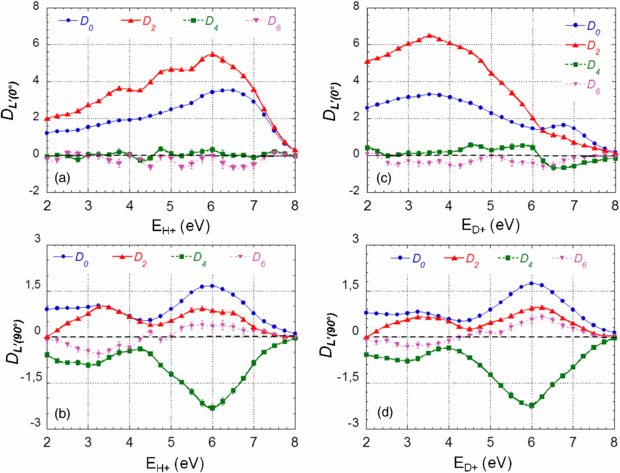
Figure 10. Evolution of the DL'(0°) and DL'(90°) Legendre polynomial expansion coefficients (see equation (6), with even L') for the parallel and perpendicular transitions, resp., as a function of E+ ion kinetic energy, for DPI of H2 (a), (b) and D2 (c), (d) induced by an SR photon at hν = 31.98 eV. The normalization of the data is consistent with that of figure 5. Error bars have a size comparable to the symbols in the graph.
Download figure:
Standard imageThese characteristic features are quite well identified at the same level of the analysis for the DPI reactions induced by H21 fs pulses. This is illustrated in figure 11 for the major DL'(0°) and DL'(90°) coefficients, where they are compared with those measured at the closest photon excitation energy hν = 31.98 eV at SOLEIL.
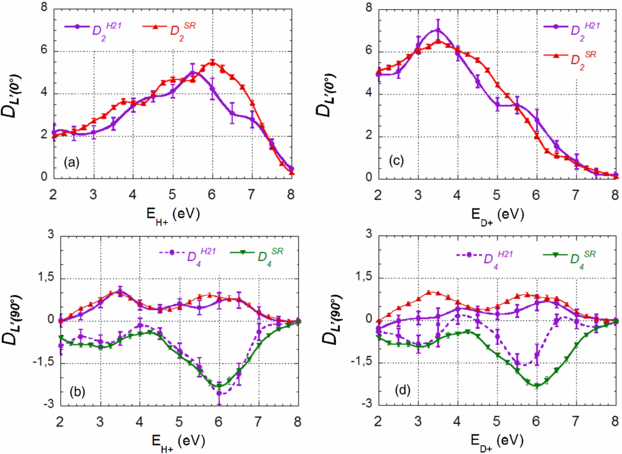
Figure 11. Comparison of the dominant DL'(0°) and DL'(90°) coefficients identified in figure 10 obtained for DPI of H2 (a), (b) and D2(c), (d) induced by H21 (dots, purple) and SR photon at hν = 31.98 eV (triangles): D2(0°) (a), (c), D2(90°) and D4(90°) (b), (d). The same legends are used for the D2(0°) coefficients in (a), (c) and the D2(90°) coefficients in (b), (d).
Download figure:
Standard image6. Conclusion
We have presented a comparative study, in a VC experiment, of DPI in H2 and D2 after single photon excitation in the Q1 and Q2 DES region by XUV pulses around 32 eV, provided either by a femtosecond HHG source at a 1 kHz repetition rate, or by synchrotron radiation at SOLEIL (ps pulses at MHz repetition rate) which mainly serves as a reference. In the two experimental configurations, we measure a series of laboratory frame and molecular frame observables, such as the kinetic energy distribution of the ion/electron, asymmetry parameters, the molecular frame PADs which are analysed in terms of the FLN(θe) functions and Legendre polynomials, and their evolution with ion kinetic energy. Despite a significantly lower statistics, detailed consistency between HHG and SR results demonstrates the feasibility of MFPAD determination in DPI using the femtosecond XUV harmonic source.
This study has clear objective to establish MFPAD as a highly sensitive and reliable photoionization-based probe of electronic/nuclear dynamics induced by a combination of as to fs XUV and laser pulses (Kelkensberg et al 2011, Tzallas et al 2011, Wörner et al 2010). These multiple pulse studies can still be referred to as pump/probe, although the complex sequence of coherent excitation in various ionization/fragmentation channels somewhat mixes the pump/probe distinction. It is the strength of time-resolved VC and MFPAD to reveal and monitor the details of this rich dynamics, with an fs to sub-fs time resolution. While VC in ground state molecules already requires long acquisition time for sufficient statistics at kHz repetition rate, it is even more demanding in multiple pulse experiment. This will be notably and straightforwardly improved using now available high repetition rate lasers–-tens of kHz to MHz-–delivering up to mJ femtosecond pulses to drive HHG (Boullet et al 2009, Rothhardt et al 2012, Heyl et al 2012), as well as using long-term actively stabilized optical arrangement for pulse superposition (Böttcher et al 2008).
Other improvements of VC studies in the XUV/fs range will come from impulsive laser alignment of the target molecules in the e−/ion spectrometer, so that non-dissociative PI can be explored (Thomann et al 2008). Moreover, circularly polarized XUV pulses (Vodungbo et al 2011) of 10 fs duration with enough photons per pulse to pump the molecular system, combined with ∼1 fs probe will allow studying the time evolution of circular dichroism in H2 (Dowek et al 2010) and D2.
Among the several cases where MFPAD constitutes a unique probe observable, it is worth noting that it can support a tomographic reconstruction of molecular orbitals from molecular dipole measurements over a large continuum space (Santra 2006). Actually, it will be of high interest in future works to perform and compare time-resolved imaging of molecular orbitals by the two routes which have been proposed, on the one hand, the HHG-based 'self-probing' which is still debated (Itatani et al 2004, Haessler et al 2010, Vozzi et al 2011), on the other hand, the PI-based 'external probing' which has still to be demonstrated. Finally, either on HHG or at FEL sources, XUV/XUV pump–probe experiment where VC are measured will soon open a completely new field on nonlinear processes in the extreme-UV range.
Aknowledgments
We gratefully acknowledge fruitful discussions with P Salières, and A Palacios, H Bachau, F Martin and coworkers. We are very grateful to JC Houver for the development of data analysis software for this research program. We acknowledge the SPAM Laser team members for their help in operating the PLFA laser and M Billon for his technical assistance for the femtosecond experiment. We are very grateful to L Nahon responsible for DESIRS beamline, G Garcia coordinator of SAPHIRS setup and their co-workers for their cooperation. We acknowledge the staff of synchrotron SOLEIL for operating the machine. We are grateful to E Bouisset, S Damoy, C Lacan from ISMO for their technical support. We acknowledge the support of C Elkharrat during the PLFA experiments, and the contribution of M Morand in a studentship training period. This work was supported by the Réseau Thématique de Recherche Avancée 'Triangle de la Physique' under contract «Dynelec» number 2008-046T, the Agence Nationale pour la Recherche under contract «AttoWave» number ANR-09-BLAN-0031-01, the LASERLAB-II transnational access network through ALADIN-JRA under contract RII3-CT-2003-506350. PB acknowledges the Centre National de la Recherche Scientifique for a delegation position.