
Abstract
We have investigated the growth of ultrathin titanium oxide (TiOx) films on a Pt3Ti(111) single crystal surface as a function of oxidation temperature (300–1000 K) and oxygen exposure (up to 4500 l) by means of Auger electron spectroscopy, low-energy electron diffraction, ultraviolet photoelectron spectroscopy and high-resolution electron energy loss spectroscopy (HREELS). Both the surface composition and the surface structure of the resulting TiOx films exhibit a strong dependence on the preparation conditions. Loss of the chemical order and Ti segregation are observed at the Pt3Ti(111) surface upon oxygen exposures of more than 135 l at 1000 K. Increasing oxygen exposure enhances Ti segregation and oxide growth. At a threshold of ≈220 l (at 1000 K) a transition in the oxide structure occurs, namely from a (6 × 3√3) rectangular structure (a = 16.6 Å, b = 14.4 Å) below 220 l to a (7 × 7)R21.8° hexagonal structure (a = b = 19.3 Å) above 220 l. Two additional incommensurate rectangular metastable structures are observed for the highest oxygen exposures (above 900 l) at intermediate oxidation temperatures (800–900 K). In all cases the changes in the valence band spectra and the work function with respect to the clean Pt3Ti(111) surface are independent of the chosen oxidation parameters. Based on their HREELS spectra we identify the (6 × 3√3) and (7 × 7)R21.8° structures grown at 1000 K with a stoichiometric TiO phase, while the other and less stable oxide phases grown at 800–900 K exhibit more complex phonon structures that could not simply be associated with any of the stoichiometric phases TiO, Ti2O3 or TiO2. Our results are rather similar to those found by Granozzi et al for the deposition of Ti onto a Pt(111) surface in an oxygen atmosphere, except a few interesting deviations as a consequence of the different preparation conditions.
Export citation and abstract BibTeX RIS
1. Introduction
Since the early work of Tauster et al on the adsorption of CO and hydrogen on platinum clusters supported on reduced TiO2 [1], it has been well established that the chemical interaction between a metal and its oxide support can result in new adsorptive properties. This so-called strong metal support interaction (SMSI) effect can be used to tailor the activity of catalysts for specific chemical reactions. Although several attempts have been made to elucidate the origin of the SMSI effect, still no definite explanation has been found. The migration of TiOx moieties onto the supported metal clusters, thereby simply blocking different kinds of adsorption sites, is the most accepted interpretation [2, 3]. However, electronic charge transfer effects between the metal clusters and the support may also play an important role [4–6] as well as the formation of Pt–Ti bonds [7]. Since surface science model studies on the interaction of metal clusters with bulk oxide surfaces using charged particle beams, i.e. electrons or ions, are often hampered by the limited conductivity of the oxide, it has become customary to mimic the support by ultrathin oxide films on a metallic substrate. Accordingly, ultrathin metal oxide films have been grown on surfaces of the respective metals [8, 9], by post-oxidizing a thin film of the respective metal on a dissimilar material [10, 11], or by depositing the metal in an oxygen atmosphere [10, 12–17]. Yet, another interesting approach is the controlled oxidation of an alloy containing the respective metal as the constituent with the highest heat of oxide formation. This approach has proved to be very successful, for instance, in the formation of well defined aluminum oxide films on NiAl(110) [18] and Ni3Al(111) [19, 20], and was also reported for the formation of titanium oxide films on a Pt3Ti(111) surface [7, 21–33] prior to the present study. The driving force for the formation of the TiOx overlayers originates from the respective heats of formation, which are much more negative than those of platinum oxides (TiO: −123.9 kcal mol−1, TiO2: −224.9 kcal mol−1, Ti2O3: −363.0 kcal mol−1, Ti3O5: −586.7 kcal mol−1, compared to, e.g., PtO: −17.0 kcal mol−1, PtO2: −32.0 kcal mol−1 [34]) and also more negative than the heat of formation of the Pt3Ti alloy itself (−81.7 kcal mol−1 [35]). The actual oxidation process, however, requires the activation barrier to be overcome for titanium segregation out of the alloy, i.e. high temperatures.
Despite numerous existing studies, which were dedicated to the properties of the Pt3Ti(111) alloy surface and its oxidation [7, 21–33] as well as to other closely related systems [36–39], several questions are still unanswered. Especially, the oxidation state of titanium in the oxide films formed on the alloy surface under different oxidation conditions is a subject of controversy. Bardi et al suggested the formation of TiO2 only at oxidation temperatures above 1000 K and extremely high oxygen partial pressures near atmospheric pressure [22], whereas Chen et al found indications for titanium oxide formation already at temperatures below 673 K and much lower oxygen partial pressure [23]. These fundamental differences call for further elucidation and, thus, motivated our investigations presented here.
In a previous paper we have already described the interaction of CO with a bare as well as successively oxidized Pt3Ti(111) surface [40]. On the one hand these measurements served as a mere titration of the remaining oxide free area of the alloy surface after different oxidation steps. On the other hand, however, they showed that both the bare Pt3Ti(111) surface as well as the remaining bare patches of the partially oxidized surface are of mixed termination, i.e. both constituents, Pt and Ti, are present at the surface, in contrast to earlier experimental x-ray photoelectron spectroscopy (XPS) and ion scattering spectroscopy (ISS) data [29] and theoretical simulations [41], which found strong and even full enrichment of platinum in the first alloy layer, respectively. Only a fully TiOx covered surface proved to be inert towards CO adsorption [40].
In contrast, in the present work we concentrate on the properties of the grown TiOx phases themselves. Using Auger electron spectroscopy (AES), low-energy electron diffraction (LEED) and ultraviolet photoelectron spectroscopy (UPS) we have studied the surface composition and the crystallographic structure of the oxidized Pt3Ti(111) surface for selected oxidation temperatures and oxygen exposures. Additional high-resolution electron energy loss spectroscopy (HREELS) measurements served to discriminate between the different observed oxide phases using their phonon spectra as fingerprints.
2. Experimental details
The experiments were performed in two ultrahigh vacuum (UHV) chambers operated at a base pressure of ≈10−10 mbar. Details about the experimental setups have been previously described [42]. In brief, the first UHV chamber was equipped with a CMA Auger electron spectrometer, a three-grid LEED optics, a quadrupole mass spectrometer, a sputter gun, and a gas inlet system. In addition He(I) and He(II) excited UV photoelectron spectra could be registered by means of a helium resonance lamp together with a hemispherical electron energy analyzer. The incidence angle of the photons was 45° with respect to the surface normal. The sample holder enabled tilting of the sample around an axis parallel to the sample surface as well as direct heating to 1200 K and cooling by a closed cycle two-stage helium cryostat down to 60 K. The second UHV chamber was also equipped with facilities for AES, LEED and thermal desorption spectroscopy (TDS) as well as sputtering and gas inlet. Moreover, this system included a HREELS spectrometer operated at a primary electron energy of 5 eV and a typical resolution of 3.5–4 meV. All HREELS spectra were recorded in specular geometry. In this second chamber the sample could be heated up to 1200 K by electron bombardment from a rear hot filament, while sample cooling down to 100 K was achieved by using liquid nitrogen. In both UHV chambers the sample temperature was measured by a NiCr–Ni thermocouple.
The (111) oriented surface of a commercial Pt3Ti single crystal from Mateck (Jülich, Germany) was cleaned by repeated cycles of sputtering with 3 keV Argon ions at a sample temperature of 900 K for 10 min and subsequent annealing at 1100 K for an additional 10 min. The cleanliness of the surface was checked by AES and LEED. The preparation of the oxide films was done by dosing oxygen between 5 and ≥4500 l at a partial pressure between 10−8 and 10−5 mbar at selected sample temperatures between 300 and 1000 K. The sample was always cooled down or, if applicable, annealed at a certain temperature after the oxygen was pumped away. While the base pressure in both chambers after bake out reached 1.0 × 10⁻¹⁰ mbar, the working pressure after oxygen dosing remained at 1.0 × 10⁻⁹ mbar.
3. Results
3.1. Surface composition (AES)
First of all, we conducted AES measurements on the composition of the differently oxidized Pt3Ti(111) surface. Oxidation could only be observed at temperatures above 500 K. As an example figure 1 shows overview Auger spectra obtained from the clean surface (a) and after two different oxygen exposures, namely 9 l (b) and 180 l (c) at 1000 K. One can easily identify the Auger peaks attributed to platinum, titanium and oxygen as well as their relative intensity change as a function of oxygen exposure. In figure 2(a) a plot of the corresponding ratio of the two most intense titanium and platinum AES transitions at 387 eV and 237 eV, respectively, is shown, which demonstrates the relative surface enrichment of titanium as a function of oxygen exposure. Additionally, we used the O(503 eV)/Ti(387 eV) ratio as an indicator for the oxygen uptake (figure 2(b)). The increase of both ratios as a function of oxygen exposure indicates an oxidation induced segregation of titanium to the surface as well as a changing stoichiometry of the formed TiOx overlayer, because the oxygen concentration increases stronger than that of titanium. We also found that the observed Ti/Pt and O/Ti AES ratios depended only on the oxygen dosage but not on the oxygen partial pressure during exposure, at least not within the investigated pressure range between 10−8 and 10−5 mbar. Above 220 l a saturation regime is reached for both the Ti/Pt and the O/Ti ratio, indicating that no further change in the thickness or the composition of the oxide film takes place under these oxidation conditions at 1000 K. Figure 3 shows the influence of the oxidation temperature on the relative titanium concentration after an exposure of 270 l (i.e. in the saturation regime in figures 2(a) and (b)). The graph in figure 3(a) clearly shows that the titanium segregation is enhanced with increasing temperature. A similar series of experiments in which the bare alloy surface was annealed at temperatures ranging from 300 to 900 K without oxygen did not result in any increase of the Ti/Pt AES ratio. This indicates that the titanium segregation observed during surface oxidation is due to the interaction with oxygen, i.e. chemisorption and oxidation driven, which is in agreement with previous studies by Bardi et al [21]. Moreover, higher sample temperatures in the presence of oxygen favor a higher oxygen uptake, i.e. a higher oxidation state of the titanium (see figure 3(b)).

Figure 1. AES spectra of (a) the clean Pt3Ti(111) surface obtained after several cycles of ion sputtering and annealing, (b) the oxidized surface obtained after exposure of 9 l O2 (p(O2) = 10−8 mbar) at 1000 K, and (c) the oxidized surface obtained after exposure of 180 l O2 (p(O2) = 10−7 mbar) at 1000 K.
Download figure:
Standard image
Figure 2. Effect of the oxygen dose on (a) the Ti(387 eV)/Pt(237 eV) AES ratio and (b) the O(503 eV)/Ti(387 eV) AES ratio by exposure at 1000 K. A and B are related to the ranges of oxygen exposure within which the LEED patterns presented in table 1 have been obtained.
Download figure:
Standard image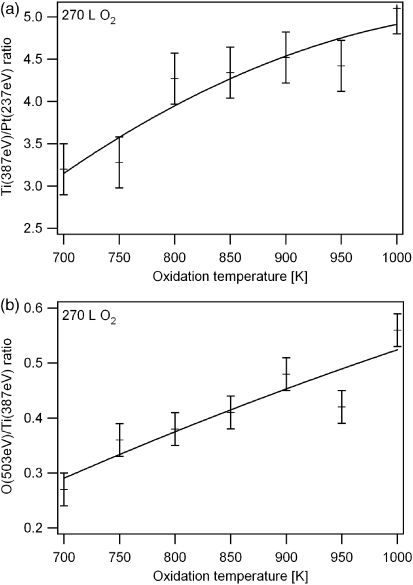
Figure 3. Effect of the oxidation temperature on (a) the Ti(387 eV)/Pt(237 eV) AES ratio and (b) the O(503 eV)/Ti(387 eV) AES ratio in the saturation regime, namely at 270 l. The solid lines are polynomial fits through the data points.
Download figure:
Standard imageAs a remark, it has previously been reported that a detailed analysis of the fine structure of the Ti Auger spectrum yields information about the oxidation state of Ti in the titanium oxide. The Ti AES peaks are associated with transitions including the valence band, and their shape is, thus, sensitive to the occupation of the Ti 3d states, i.e. variations in the chemical environment. Titanium compounds with partly occupied 3d states such as TiO and metallic Ti are characterized by a small additional feature at about 382 eV, which is absent in the higher oxides such as Ti2O3 and TiO2 [43]. Owing to insufficient resolution of our Auger spectra, however, we were not able to achieve such a distinction. Hence, we were not able to determine the valence state of Ti in our thin TiOx films grown on Pt3Ti(111) unlike Granozzi et al using XPS (see below). However, our phonon spectra of the differently prepared TiOx films as determined by HREELS provide, at least for the most stable oxide phases, clear indications on their chemical nature (see section 3.4).
3.2. Crystallographic structure (LEED)
In figure 4(e) the LEED pattern of the clean Pt3Ti(111) surface is shown. Pt3Ti is a face centered cubic crystal (L12 type), which is chemically ordered up to its high melting temperature of 2213 K with a lattice parameter a (Pt3Ti) = 3.906 Å. All the (111) planes are equivalent and have the bulk composition, namely 75% Pt and 25% Ti. Pt3Ti and pure platinum have the same crystallographic structure and their lattice constants differ only by 0.4%. Therefore, the alloy structure can be obtained from the Pt structure by periodic substitution of Pt atoms by Ti atoms. Hence, the LEED pattern of the clean Pt3Ti(111) surface can be indexed as a p(2 × 2) superstructure (solid line in figure 4(e)) with respect to the p(1 × 1) pattern if it were a pure Pt(111) surface (dashed line in figure 4(e)). From now on all the obtained oxide structures are indexed in relation to this p(1 × 1) unit cell. As shown below, this notation is essential to describe the loss of the chemical order in the interface region between alloy and oxide.
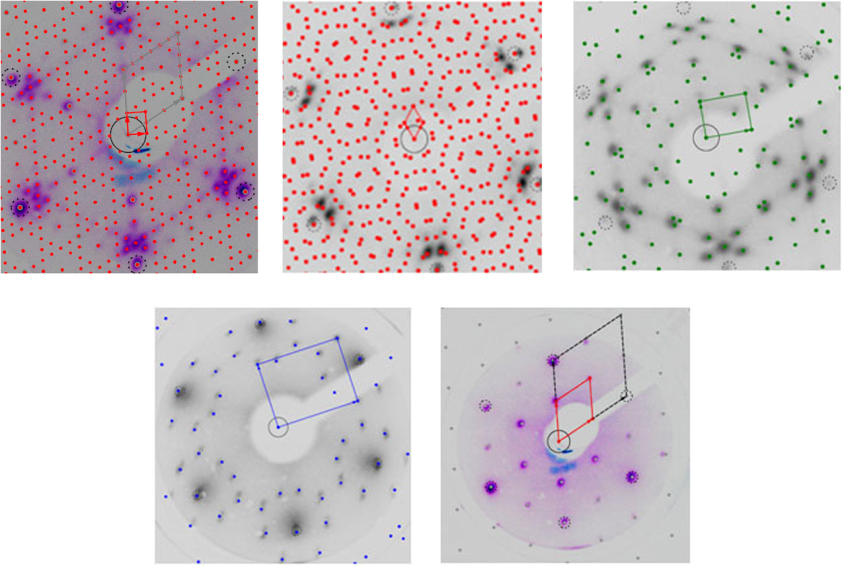
Figure 4. LEED pattern (primary energy: 70 eV) of (a) the rectangular (6 × 3√3) oxide phase, (b) the hexagonal (7 × 7)R21.8° oxide phase, (c) the incommensurate rectangular oxide phase, (d) the incommensurate rotated rectangular oxide phase and (e) the clean Pt3Ti(111) surface. All experimental pictures are overlain by simulated LEED patterns. The clean Pt3Ti(111) surface displays a p(2 × 2) pattern presented by solid lines with respect to the p(1 × 1) pattern of pure Pt(111) shown by dashed lines.
Download figure:
Standard imageTable 1 summarizes the parameters of the LEED patterns of the ultrathin TiOx films on Pt3Ti(111) obtained after oxidation with oxygen exposures ranging from 5 to 4500 l at temperatures of 800, 900 and 1000 K. In figures 4(a)–(d) a simulation of each LEED pattern is superimposed on the corresponding experimental picture and leads to the identification of the structure data given in the second column of table 1. Two different LEED patterns of the oxidized Pt3Ti(111) surface are observed for the highest oxidation temperature (1000 K) depending on the oxygen exposure. For exposures below 220 l, which corresponds to the range A in the AES ratio curves in figure 2, a rectangular (6 × 3√3) structure with lattice parameters a = 16.6 Å and b = 14.4 Å is identified (figure 4(a)). Remarkably, after saturation of the O/Ti AES ratio (range B in figure 2(b)) a new oxide structure is observed, namely a hexagonal (7 × 7)R21.8° structure with lattice parameters a = b = 19.3 Å (figure 4(b)). Thus, both structures are commensurate with the substrate. Interestingly, the original p(2 × 2) structure attributed to the chemically ordered Pt3Ti(111) surface is still visible up to oxygen exposures of 135 l, indicating that some areas of the substrate remain unoxidized after this low exposure. This was actually verified by CO titration experiments [40]. Above 135 l only the spots of the p(1 × 1) structure are observed, indicating the loss of the chemical order in the interface region. This result is consistent with titanium segregation to the surface, in agreement with the above-mentioned AES measurements. These two oxide phases obtained for the highest oxidation temperature are found to be the most stable ones.
Table 1. Preparation conditions (oxidation temperature Tox, oxygen exposure) and structural characteristics (commensurability, symmetry and lattice parameters of the oxide unit cell) deduced from LEED patterns obtained for TiOx on Pt3Ti(111).
| Oxidation conditions TiOx/Pt3Ti(111) | Identified oxide structure |
|---|---|
| Tox = 1000 K < 220 l O2 | Commensurate rectangular: (6 × 3√3) a = 16.6 Å,b = 14.4 Å |
| Tox = 1000 K ≥ 220 l O2 | Commensurate hexagonal: (7 × 7)R = 21.8° a = b = 19.3 Å |
| Tox = 900 K ≥ 900 l O2 | Incommensurate rectangular: a = 6.8 Å,b = 8.6 Å |
| Tox = 800 K ≥ 4500 l O2 | Incommensurate rotated rectangular: a = 3.0 Å,b = 3.8 Å,R = 8.3° |
At 700 K only diffuse or nonordered patterns are observed, while at intermediate oxidation temperatures (800–900 K) incommensurate rectangular phases develop after oxygen exposures higher than 900 l. Namely, oxidation at 800 K leads to the formation of an incommensurate rectangular structure with lattice parameters a = 3.0 Å and b = 3.8 Å, rotated by 8.3° with respect to the main crystallographic directions of the substrate (figure 4(d)). After oxidation at 900 K another incommensurate rectangular structure with lattice parameters a = 6.8 Å and b = 8.6 Å is observed (figure 4(c)). However, annealing both these incommensurate rectangular structures at 1000 K in UHV yields again the hexagonal (7 × 7)R21.8° structure, which corroborates the metastable character of the former two structures.
3.3. Photoelectron emission (UPS)
Besides AES and LEED we also performed UPS measurements for the same oxidation states described above. Figure 5 shows He(I) excited UPS spectra (h⋅ν = 21.21 eV) of (a) the clean Pt(111), (b) the clean Pt3Ti(111) and (c) the Pt3Ti(111) surface oxidized with 900 l O2 at 1000 K, respectively. Comparing the pure alloy spectrum with that of pure platinum reveals (a) a significant change in the Pt valence band related intensity between 1 and 4 eV, (b) the appearance of an intense Ti related signal around 5.7 eV (even though not suggested by AES and LEED in figures 1 and 4 a small oxygen contamination can probably not be excluded), and (c) a significantly lower work function of the alloy (see below). Upon oxidation of the Pt3Ti(111) surface additional intensity shows up at binding energies of 4.5 and 7.8 eV. Figure 6 shows a He(II) excited UPS spectrum (h⋅ν = 40.8 eV) of the clean Pt3Ti(111) surface as well as He(II) difference spectra of the alloy surface after oxidation at 1000 K with different oxygen exposures up to 900 l at 10−6 mbar O2. Due to the higher surface sensitivity of He(II) excited spectra and the subtraction of the weighted spectrum of the clean surface in each case the two new features centered at 4.5 and 7.8 eV in the spectra of the oxidized surfaces are clearly accentuated. Despite the different resulting oxide phases under these preparation conditions (table 1) no significant differences in the shape of the valence band spectra of the differently oxidized surface can be detected. However, the value of the oxygen induced work function change determined from the low energy cutoff of He(I) excited UPS spectra as exemplified in figure 5 depends on both the oxidation temperature and the oxygen exposure. The work function of the clean Pt3Ti(111) surface is Φ = 5.02 eV, i.e. 1 eV lower than that of clean Pt(111) previously reported in the literature [44, 45]. The change of the work function (ΔΦ) of the oxidized surfaces with respect to the clean alloy surface is presented in table 3 for different oxidation conditions. At constant temperature ΔΦ increases with growing oxygen exposure indicating an increasing oxygen amount on the surface. The influence of the oxidation temperature at constant exposure is less obvious. Nevertheless, it is clear that at least after the highest oxygen exposure ΔΦ gradually decreases with increasing oxidation temperature. This may be due to a thermally induced oxide reduction, as will be discussed later.

Figure 5. He(I) excited UPS spectra (h⋅ν = 21.21 eV) of (a) clean Pt(111), (b) clean Pt3Ti(111) and (c) TiOx on Pt3Ti(111) obtained after exposure of 900 l O2 (p(O2) = 10−6 mbar) at 1000 K. Dashed lines, see text; the solid vertical lines accentuate the work function difference between the three surfaces.
Download figure:
Standard image
Figure 6. He(II) excited UPS spectra (h⋅ν = 40.8 eV) of the clean Pt3Ti(111) surface and of the surface after oxidation with the given oxygen exposures (l) at p(O2) = 10−6 mbar and 1000 K. The spectra of the oxidized surface are presented after subtraction of the weighted clean surface spectrum.
Download figure:
Standard image3.4. Phonon spectra (HREELS)
In order to gain further insight into the chemical nature of the different oxide phases we have also conducted HREELS measurements on all four observed oxide phases, i.e. the most stable (6 × 3√3) and (7 × 7)R21.8° phases obtained upon oxidation at 1000 K as well as the metastable incommensurate rectangular phases obtained at 800 and 900 K and much higher oxygen doses.
Probably the most striking feature in figure 7 is the similarity between the HREELS spectra of both commensurate phases, both consisting of a single peak at 525 cm−1. In turn, both incommensurate phases are characterized by a multiplicity of phonon modes, namely the incommensurate rectangular phase with peaks at 510 cm−1,595 cm−1,764 cm−1, and 1066 cm−1, and the incommensurate rotated rectangular phase with peaks at 595 cm−1,713 cm−1, and 818 cm−1. This distinction in the multiplicity of the phonon spectra is a clear fingerprint for the deviating stoichiometry of the formed oxide phases, as will be discussed below.
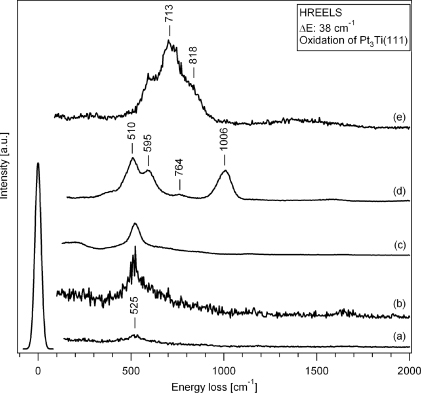
Figure 7. HREELS spectra for the Pt3Ti(111) surface after exposure of (a) 5 l O2 at 1000 K, (b) 55 l O2 at 1000 K, (c) 200 l O2 at 1000 K, (d) 900 l O2 at 900 K and (e) 4500 l O2 at 800 K. The spectra (a) and (b) correspond to the (6 × 3√3), (c) to the (7 × 7)R21.8°, (d) to the incommensurate rectangular, and (e) to the incommensurate rotated rectangular structures, respectively.
Download figure:
Standard image4. Discussion
As shown in the previous sections the oxidation of the Pt3Ti(111) is rather complex. The AES data showed an oxygen induced Ti segregation as well as a changing stoichiometry of the oxide overgrowth, both being a function of temperature and oxygen exposure, but not of the oxygen pressure. From the latter it may be concluded that the oxidation kinetics is dominated by the titanium segregation towards the surface.
Despite this complexity, it is very interesting that all four LEED structures, which we found upon oxidation of the Pt3Ti(111) alloy surface (see table 1), were also observed by Granozzi et al [10, 46–49] for ultrathin TiOx films grown by depositing Ti onto a Pt(111) surface in an oxygen atmosphere under the oxygen pressure and temperature/annealing conditions summarized in table 2. Since these authors also performed scanning tunneling microscopy (STM) measurements with their oxide films and, based on the appearance of the obtained STM images [10], introduced the nomenclature given in the last column of table 2, we will henceforth adopt the same nomenclature when referring to the respective oxide phase.
Table 2. Comparison between the preparation conditions of the TiOx phases found on Pt3Ti(111) and the related oxide phases grown on Pt(111) as previously reported by Granozzi et al [10, 46–49].
| TiOx on Pt3Ti(111) (This work) | TiOx on Pt(111) [10, 46–49] | ||||
|---|---|---|---|---|---|
| Identified oxide structure | Oxidation conditions | Preparation conditions | Total oxygen dosage (l) | Phase description | |
| Ti deposition (p(O2) = 10−6 mbar) | Post-annealing | ||||
| Commensurate rectangular (6 × 3√3) | Tox = 1000 K < 220 l O2 | 0.8 ml Ti Tdep = 300 K | Tann = 673 K in UHV | 180 | z'-TiOx |
| Commensurate hexagonal (7 × 7)R = 21.8° | Tox = 1000 K ≥ 220 l O2 | 1.2 ml Ti Tdep = 300 K | Tann = 723 K in UHV | 270 | w'-TiOx |
| Incommensurate rectangular | Tox = 900 K ≥ 900 l O2 | 0.8 ml Ti Tdep = 300 K | Tann = 823 K in p(O2) = 10−7 mbar | 225 | z-TiOx |
| Incommensurate rotated rectangular | Tox = 800 K ≥ 4500 l O2 | ≈1 ml Ti Tdep = 300 K | Tann = 973 K in p(O2) = 10−6 mbar | 775 | rect-TiO2 |
Table 3. Difference (ΔΦ) between the work function of the oxidized (Φoxidized) and the clean (Φclean) surface for different oxidation parameters (oxidation temperature Tox, oxygen dose, oxygen partial pressure p(O2)).
| ΔΦ = Φoxidized–Φclean (eV) | O2 dose (l)/p(O2) (mbar) | ||||
|---|---|---|---|---|---|
| 45/10−8 | 220/10−7 | 900/10−6 | 4500/10−5 | ||
| Tox (K) | 700 | +0.22 | +0.20 | +0.31 | +0.59 |
| 800 | +0.20 | +0.23 | +0.31 | +0.47 | |
| 900 | +0.19 | +0.18 | +0.25 | +0.44 | |
| 1000 | +0.15 | +0.18 | +0.31 | +0.41 | |
Our rectangular (6 × 3√3) structure is consistent with the z'-TiOx phase (z stands for zigzag), which Granozzi et al found after a 'reductive' post-annealing at 673 K in UHV (p(O2) < 10−10 mbar). Based on their Ti evaporation rate of 0.2 ml min−1, the quoted Ti coverages and the oxygen pressures (during Ti deposition and, if applicable, during post-annealing) we have also estimated the total oxygen exposures for the different preparation procedures listed in column 5 of table 2. Thus, the z'-TiOx phase is formed on both the Pt3Ti(111) and the Pt(111) surface covered with 0.8 ml Ti with the lowest oxygen exposure, i.e. the least 'oxidative' procedure. The higher temperature during the oxidation of the alloy surface is required in order to activate the Ti segregation. The z'-TiOx phase may be described by a bilayer model in which the Ti atoms occupy two different sites, one at the metal interface and one in the outermost layer together with the oxygen atoms, as suggested by a model based on density functional theory (DFT) calculations by Jennison et al [50]. This interpretation is in line with XPS data by Granozzi et al, which also suggest Ti atoms in the two different chemical environments [10].
Our hexagonal (7 × 7)R21.8° structure corresponds to the w'-TiOx phase (w stands for wagon wheel) formed by deposition of 1.2 ml of Ti onto Pt(111) in the oxygen atmosphere at room temperature followed by annealing at 723 K in UHV. Furthermore, such a (7 × 7)R21.8° superstructure was also observed by Schoiswohl et al for a VOx-phase on Rh(111) [12]. The model proposed by the latter authors based on DFT calculations suggests a V–O bilayer with the V atoms at the Rh interface, an oxygen termination and a VO stoichiometry. The same atomic arrangement is suggested by Granozzi et al on the basis of their XPS and XPD data for the w'-TiOx phase on Pt(111) [10]. Therefore, we also adopt this model and propose that our (7 × 7)R21.8° TiOx structure formed on the Pt3Ti(111) alloy surface consists of a bilayer with Ti at the interface and the oxygen atoms in the terminating outer layer. Our CO titration experiments proved that this film, formed with ≥220 l O2, completely covers the surface [40]. Likewise the total oxygen exposure in Granozzi's work is also higher than ≈220 l (see table 2) for obtaining the w'-TiOx phase. Simulations by these authors suggest that the long range periodicity of the (7 × 7)R21.8° w'-TiOx phase corresponds to a Moiré structure resulting from a superposition of the oxide film with a 3.18 Å lattice constant rotated by 3.5° with respect to the Pt(111) substrate lattice. Since the lattice constants of Pt(111) and Pt3Ti(111) are practically identical (see above) the same interpretation appears to be most logical here.
Despite the fact that both the z'- and the w'-phase produce different LEED patterns with either rectangular or hexagonal symmetry they show the same phonon structure, namely only one mode at 525 cm−1 (figure 7). This value agrees quite well with the fundamental phonon excitation energies of 560 cm−1 for CoO [51, 52], 569 cm−1 for NiO [53], and 572 cm−1 for MnO [54]. Therefore, we suggest that both the z'- and the w'-structure represent stoichiometric TiO, in agreement with the XPS and XPD data of TiOx on Pt(111) [10], and the adopted DFT based models for the z'- and w'-phase as discussed above. In turn, it remains to be explained why two distinct structures, i.e. z' and w', are formed on Pt3Ti(111) and Pt(111) despite their chemical similarity.
The z'-phase is only observed after oxidation with less than 220 l O2. Up to 135 l O2 the LEED pattern continues to show the p(2 × 2) diffraction spots from the chemically ordered Pt3Ti(111) alloy surface. For oxygen exposures between 135 and 220 l O2 these p(2 × 2) spots are no longer visible. However, CO adsorption ('titration') experiments using TDS and HREELS clearly show that CO still adsorbs on the surface as long as the oxidation is carried out with less than 220 l O2 at 1000 K, i.e. within the regime of the z'-TiOx formation [40]. Only once the substrate has been exposed to higher oxygen doses than 220 l O2 at 1000 K is the oxide film closed, with a w'-structure, and no further CO adsorbs. In other words, the transition from the z'- to the w'-phase occurring at 1000 K after oxygen exposures around 220 l O2 is associated with the closing of the oxide film. In the following we give a tentative explanation for this phase transition.
Both the z'- and the w'-phase are found to be stable (against annealing up to 1100 K) and commensurate with the underlying Pt3Ti(111) substrate. The rectangular z'-phase is obviously more favored as long as oxide islands coexist with free alloy regions. This suggests that the z'-phase may be stabilized by lateral relaxation at its island boundaries, which is excluded once the film becomes closed. Once the film becomes closed (or the z'-islands very large, because a transition regime in which z'- and w'-structured regions coexist cannot be excluded on the basis of the LEED patterns) the buildup of internal stress is avoided by the transition to the hexagonal w'-phase, which may provide a more favorable match with the hexagonal lattice of the substrate. This explanation rests on a subtle interplay between the lateral forces within the oxide film and the interaction between the oxide film and the underlying metal substrate, respectively.
Exposure to much more oxygen leads to the formation of two new oxide phases on Pt3Ti(111) as well as Pt(111) covered with approximately 1 ml of Ti. Both these phases are incommensurate. Our incommensurate rectangular structure (a = 6.8 Å,b = 8.6 Å), which we found after high oxygen exposures at 900 K, is consistent with the z-TiOx phase formed by deposition of 0.8 ml Ti onto Pt(111) in an oxygen atmosphere of p(O2) = 10−6 mbar at room temperature followed by annealing at 823 K, still under an O2 atmosphere of p(O2) = 10−7 mbar. Although the same rectangular unit cell of (6.9 × 8.7) Å2 was found for the systems TiOx/Pd(111) and VOx/Rh(111) [12], Granozzi at al. emphasize distinct differences between TiOx and VOx on Pd(111) on the one hand and TiOx on Pt(111) on the other hand [10]. While for the former two structures models with an O–V–O/Pd and Ti–O/Pd stacking, respectively, were proposed [13, 16], the XPS and XPD data are not consistent with a Ti–O/Pt stacking, but rather an O–Ti bilayer on Pt(111) with O termination. An O termination is consistent with the work function increase which we always find (see table 3 and figure 5). It appears most rational to identify our incommensurate rectangular phase with the z-phase on Pt(111). The layer stacking of the z-phase is, thus, the same as that of the w'-phase, however, their different structures and stoichiometries are reflected in their deviating phonon spectra.
Finally, our incommensurate rotated rectangular structure (a = 3.0 Å,b = 3.8 Å,R8.3°) is to be identified with the rect-TiO2 phase on Pt(111) [10]. Both structures are formed with the highest oxygen exposures, in our case on the Pt3Ti(111) surface with >4500 l O2 at 800 K, on the Pt(111) surface covered with ∼1 ml Ti in an oxygen atmosphere of p(O2) = 10−6 mbar during both the Ti deposition onto the Pt(111) surface held at 300 or 600 K and the subsequent annealing at 973 K. It is natural to assume that this phase will represent the highest Ti oxidation state. Indeed, Granozzi et al, by analogy to a very similar LEED structure reported by Surnev et al [14–16] for VO2 on Pd(111), identify their rect-structure with a triple layer O–Ti–O on Pt(111) of TiO2 stoichiometry. This stacking sequence is in agreement with their XPS and XPD data, which show only one component of the Ti 2p3/2 core level at high binding energy [10]. This is consistent with Ti atoms in one crystallographic site and fully surrounded by oxygen and also in accord with the DFT calculations for the analogous VO2/Pd(111) system [55]. The different structure in terms of stoichiometry and stacking of this rect-structure compared to the above discussed bilayer structure of the z'-, w'-, and z-phases is also reflected in the strong difference in our phonon spectra (see figure 7). While the single mode spectra of the z'- and w'-phase in figure 7 are indicative of a TiO stoichiometry (see above), the multiplicity of phonon modes in the two other HREELS spectra, in turn, excludes that the z- and rect-phase are stoichiometric TiO. However, it is also noteworthy that none of the peaks in the HREELS spectra of the z- and rect-phase can unambiguously be identified with phonon modes known from the literature neither for bulk Ti2O3 (379 and 709 cm−1 [56]) nor for TiO2 (rutile: 365,445 and 755 cm−1 [57, 58]; anatase: 355 and 790 cm−1 [59]). This underlines, not surprisingly, that ultrathin oxide films have different properties from the corresponding bulk materials, a fact which should always be kept in mind when replacing nonconducting bulk oxide supports by corresponding ultrathin oxide films on a conducting substrate in catalytic studies.
One major difference between the rect-phase on Pt(111) and our rect-phase on Pt3Ti(111), however, has to be emphasized. STM images show that the rect-phase on Pt(111) exists only in islands leaving large areas of the Pt surface uncovered [10]. While, on the other hand, this allows one to measure the thickness of the rect-phase to be approximately 2.5 Å, i.e. significantly thicker than a bilayer phase in agreement with the O–Ti–O-stacking, this on the other hand is different from our rect-phase on Pt3Ti(111). Our experimental data do not provide any evidence for uncovered regions of the alloy surface. Neither do we see the p(2 × 2) diffraction spots from the alloy nor does CO continue to adsorb on the surface after O2 exposures higher than 220 l. This points to a different growth mechanism on Pt(111) versus Pt3Ti(111), which will be discussed shortly below.
Unlike Granozzi et al we have also annealed both of our incommensurate rectangular phases, obtained after very high oxygen exposures at 1000 K, in the absence of oxygen, i.e. in UHV. As a result both phases turn out to be unstable under these conditions and transform into the w'-TiOx-phase. Figure 8 schematically summarizes the growth conditions, under which the different ordered oxide phases were obtained in our study on Pt3Ti(111). Only the rectangular z'- and the hexagonal w'-phase seem to be thermodynamically stable, whereas the other two rectangular phases undergo a fast and irreversible transition into the w'-phase upon post-annealing in UHV at only slightly higher than the preparation temperature. These only metastable phases obtained at high oxygen doses, obviously correspond to higher oxidation states of titanium than the two stable ones, which both have a TiO stoichiometry, as discussed above.
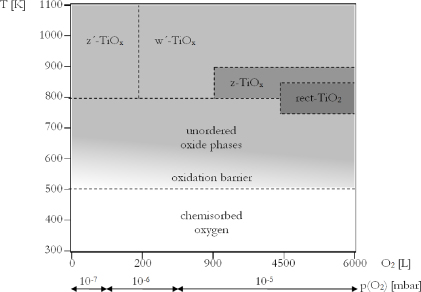
Figure 8. Experimental phase diagram of the system O2/Pt3Ti(111). Note that the abscissa is not linear.
Download figure:
Standard imageFinally, it should be mentioned that under our oxidation conditions we neither found a k-TiOx(kagomé) nor a w-phase as described by Granozzi et al [10] on Pt(111). The k-TiOx phase corresponds to an incommensurate hexagonal superstructure, which is formed when depositing 0.4 ml Ti onto the Pt(111) surface in an oxygen atmosphere of p(O2) = 10−6 mbar at 673 K followed by annealing in p(O2) = 10−7 mbar at the same temperature. The commensurate hexagonal w-phase forms when 1.2 ml Ti is evaporated onto Pt(111) at 873 K in an oxygen pressure of p(O2) = 10−6 mbar, again followed by annealing at the same temperature in p(O2) = 10−7 mbar.
Summarizing the main differences between our results on the oxidation of the Pt3Ti(111) alloy surface and the deposition of Ti in an oxygen atmosphere onto a Pt(111) surface performed by Granozzi et al [10]:
- (1)We find no ordered structures below ≈700 K.
- (2)Our rect-phase completely covers the Pt3Ti(111) alloy surface.
- (3)Our annealing experiments with the z- and rect-phase at 1000 K in UHV demonstrate the metastability of these phases on the alloy surface.
Points (1) and (3) are immediately consistent with the absence of the k- and w-phase after our oxidation procedures with the alloy. Temperatures below 700 K are too low to activate sufficient Ti segregation, and at 1000 K in UHV the w-phase is not stable against decomposition. Thus, a common explanation for the different oxidation behavior of the alloy surface compared to the co-deposition of Ti and O2 onto the Pt(111) surface [10, 46–49] can be found in the following two coupled equilibria, namely the segregation of titanium in the presence of oxygen on the Pt3Ti(111) alloy surface,
which is of course not occurring on pure Pt(111), and the formation/decomposition of the various TiOx phases as a function of the oxygen pressure.
At low temperature (≤700 K) oxidation of the alloy titanium segregation is the rate determining step. High temperatures and low oxygen pressures prevent the formation of TiOx with x > 1. Moreover, with the alloy the supply of titanium is most uniformly distributed across the surface, which, given sufficient oxygen, leads to very homogeneous and closed films (see point 2 above).
5. Summary
In this study the growth of ultrathin titanium oxide films on a chemically ordered Pt3Ti(111) surface has been investigated at selected temperatures between 300 and 1000 K with oxygen exposures between 5 and ≥4500 l O2 by means of AES, LEED, UPS and HREELS. Both the surface composition and the structure of the resulting TiOx films exhibit a strong dependence on the preparation conditions. AES spectra show an increase of both the Ti(387 eV)/Pt(237 eV) and the O(503 eV)/Ti(387 eV) intensity ratio with increasing oxygen exposure and oxidation temperature until they saturate at ≈220 l O2 and 1000 K. These observations indicate titanium segregation from the alloy as well as a changing stoichiometry of the formed oxide phases. Remarkably, once the saturation state has been reached, a transition in the film structure occurs. Below 220 l O2 a commensurate rectangular (6 × 3√3) structure (a = 16.6 Å,b = 14.4 Å) exists, which up to 135 l O2 even coexists with free p(2 × 2) patches of the ordered alloy surface. Above 220 l O2 a film with commensurate hexagonal (7 × 7)R21.8° structure (a = b = 19.3 Å) starts to exist, which is completely closed. These two structures are identical to the z'- and w'-phase found by Granozzi et al after depositing 0.8 ml and 1.2 ml Ti, respectively, onto a Pt(111) surface at 300 K in an oxygen atmosphere followed by annealing at ≈700 K in UHV [10]. Following their interpretation and in agreement with our work function measurements and HREELS data these two phases correspond to stoichiometric Ti–O bilayers with oxygen termination. After higher oxygen exposures (>900 l O2) at intermediate oxidation temperatures (800–900 K) two additional incommensurate oxide phases are found, namely with rectangular structure (a = 6.8 Å,b = 8.6 Å) and rotated rectangular structure (a = 3.0 Å,b = 3.8 Å,R = 8.3°), respectively. These two structures agree with the z- and rect-structure found by Granozzi et al after depositing and annealing ≈1 ml Ti on Pt(111) in an oxygen atmosphere.
All four oxide phases found on Pt3Ti(111) are characterized by additional peaks at 4.5 and 7.8 eV in the corresponding UPS valence band spectra, largely independent in position and intensity from the oxidation parameters. Only the work function of the oxidized surface is on average about 0.3 eV higher than that of the clean Pt3Ti(111) surface, with some weak dependence on the oxidation conditions consistent with the O termination of all oxide phases.
The incommensurate rectangular phases grown with high oxygen exposures at 800 and 900 K are identified with the z- and rect-phase described in Granozzi's work and exhibit much more complex multimode phonon spectra, which cannot simply be associated with any of the stoichiometric TiO-, Ti2O3- and TiO2-phases. Both these incommensurate rectangular phases formed with high oxygen doses at 800 or 900 K are metastable, both undergo a transition to the hexagonal (7 × 7)R21.8° (or w'-) phase upon annealing at 1000 K. Thus, only the commensurate structures formed with low O2 exposures are stable at 1000 K, the (6 × 3√3) (or z'-) phase as long as the oxide film is not yet closed and the (7 × 7)R21.8° (or w'-) phase once the film completely covers the surface (i.e. ≥220 l O2). It is suggested that the phase transition between these two commensurate TiO phases is driven by stress relaxation. Finally, distinct differences between the oxidation behavior of the Pt3Ti(111) surface compared to that of Ti deposited on Pt(111) is traced back to the segregation behavior of Ti from the alloy bulk.