Barriers to Eastern Oyster Aquaculture Expansion in Virginia
 Jennifer Beckensteiner
 David M. Kaplan
 Andrew M. Scheld
- 1Department of Fisheries Science, Virginia Institute of Marine Science (VIMS), William & Mary, Gloucester Point, VA, United States
- 2MARBEC, Univ. Montpellier, CNRS, IFREMER, IRD, Séte, France
- 3Institut de Recherche pour le Développement, UMR MARBEC, Avenue Jean Monnet, Séte, France
The eastern oyster once provided major societal and ecosystem benefits, but these benefits have been threatened in recent decades by large declines in oyster harvests. In many areas, recovery of oyster aquaculture faces significant societal opposition and spatial constraints limiting its ability to meet expectations regarding future food needs and provision of ecosystem services. In Virginia, oyster aquaculture has begun to expand, concurrent with an increase in subaqueous leased areas (over 130,000 acres of grounds are currently leased). Though private leases must in theory be used for oyster production, in practice, they can be held for other reasons, such as speculation or intentional exclusion of others. These factors have led to large variation over time and space in the use of leases in lower Chesapeake Bay; and privately leased grounds are now thought to be underutilized for oyster production. This research examined potential barriers to expansion of oyster aquaculture in Virginia. We first evaluated if a lack of space was limiting industry expansion and quantified temporal and spatial trends in the use and productivity of leases. Then, differences in used and non-used leases were investigated in relation to variables thought to be related to “not in my backyard” attitudes, congestion, speculation, local economic and environmental conditions. Finally, the performance of the Virginia leasing system was compared with those in other states along the U.S. East and Gulf Coasts. We found limited evidence for spatial constraints on aquaculture leasing, but strong evidence for social and regulatory inefficiencies. Although rates of lease use increased from 2006 to 2016, only 33% of leases were ever used for oyster production and about 63% of leaseholders reported no commercial harvests. Non-used leases tended to be smaller, and were found in more populated, high-income regions, consistent with both speculative and exclusionary uses. Virginia had the second lowest level of total production of cultured oysters per leased acre among the states on the East and Gulf Coasts of the United States. These results indicate that there is room for oyster aquaculture expansion in Virginia if societal, regulatory, and economic barriers can be reduced or if existing leased areas are used more efficiently.
Introduction
As of 2018, aquaculture continues to be the fastest growing food production method worldwide and now represents more than half of global human seafood consumption (Duarte et al., 2009; FAO, 2018). Though not all forms of aquaculture are beneficial for the environment (Naylor et al., 1998), marine bivalve aquaculture, especially oysters, has been recognized as a win–win for society and marine ecosystems as it provides ecosystem services such as water filtration and provision of habitat while also producing low greenhouse gas emissions and efficiently utilizing primary production (Coen et al., 2007; Grabowski and Peterson, 2007; Duarte et al., 2009; Alleway et al., 2019; Ray et al., 2019). As delicacies, marine bivalves constitute today about 60% of marine and coastal aquaculture production (Science Advice for Policy by European Academies [SAPEA], 2017; FAO, 2018). However, increases in seafood demand and improvements in technology used for shellfish aquaculture are expected to further intensify pressure on already crowded near-shore coastal environments in coming years (Halpern et al., 2008; Shumway, 2011). Although the Food and Agriculture Organization (FAO) identifies the United States as one of the most prominent nations for marine aquaculture development in terms of coastline length and exclusive economic zone area (Kapetsky et al., 2013), its contribution to domestic demand is believed to be far below its potential (Knapp and Rubino, 2016). One identified reason is that coastal aquaculture faces significant social opposition and competition for space (Knapp, 2012; Froehlich et al., 2017). Aquaculture intensification in crowded areas may be perceived as a threat to recreational and amenity services (Gibbs, 2009) and exacerbate spatial conflicts between stakeholders (Whitmarsh and Palmieri, 2008). Gibbs (2009) suggests that social carrying capacity, which refers to the space dedicated to aquaculture that the local community is willing to accept (Inglis et al., 2000), may become the main constraint to aquaculture industry growth in industrialized countries such as the United States. This paper looks at recent trends and drivers of growth in oyster aquaculture to identify possible societal, management, or spatial limits to expansion of the sector in Virginia, as well as more broadly.
Commercial fisheries for the eastern oyster (Crassostrea virginica) have existed in the United States since the 1600s (Ingersoll, 1881), and have historically played a major cultural and economic role in communities bordering coastal estuaries of the U.S. seaboard (Kirby, 2004; Keiner, 2009; Kennedy, 2018). Nowhere is this more apparent than in Chesapeake Bay, where oyster production from private leases in Virginia in the 1950s averaged ∼16 million lbs/year (Haven et al., 1978; Figure 1). Nevertheless, oyster production in the Chesapeake and elsewhere has experienced a dramatic decline over the last several decades due to a combination of overfishing, habitat destruction, and disease (Rothschild et al., 1994; Kirby, 2004; Beck et al., 2011). Harvests in Virginia during the early 2000s represented only ∼2.5% of the 1950s average (maximum of 0.4 million lbs/year from 1995 to 2005) (Figure 1). The consequences of this decline on local watermen (colloquial term for fishers) and fishing communities have been severe, and growth in oyster production has the potential to yield substantial economic, environmental, and cultural benefits (Keiner, 2009; Paolisso and Dery, 2010). Oyster production has begun to rebound since the mid-2000s, reaching ∼2.5 million lbs in 2016. This growth is due to an increased demand on newly developed, disease-resistant, hatchery-raised oyster strains, and the expansion of intensive oyster aquaculture (Bosch et al., 2010; Frank-Lawale et al., 2014; Murray and Hudson, 2015). In Virginia, oyster harvests are divided between two types of grounds: (1) public Baylor grounds, consisting of the most productive oyster beds evaluated by the Baylor survey in 1896 and designated for the public use (242,905 ac1 or 983 km2 statewide), and (2) private grounds, where leased areas are granted to an individual or a company for their exclusive use for shellfish collection and propagation, for a period of at least 10 years (Santopietro and Shabman, 1992). Though both areas are defined and permitted by the Virginia Marine Resource Commission (VMRC), that agency only carries out significant resource management in public grounds. Private leases have long been advocated as an effective tool for increasing oyster yields (Alford, 1973; Agnello and Donnelley, 1975) while also incentivizing sustainable practices (Beck et al., 2004). There has been a considerable increase in privately leased area from 81,545 ac (330 km2) in the 2000s (Mason, 2008) to 139,120 ac (563 km2) in 2017 (Figure 2). Despite the large amount of area leased to date, production remains historically low.
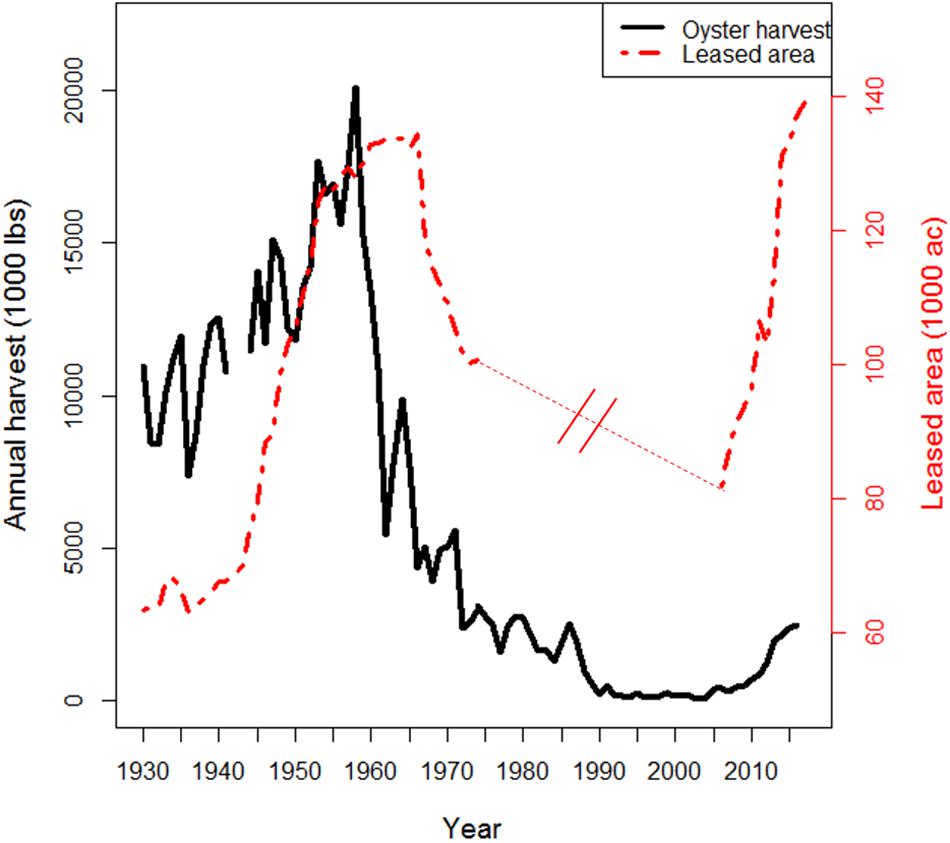
Figure 1. Commercial oyster production on private leases (plain dark line) and area held in private leases (red dashed line) in Virginia. Data from 1930 to 1974 were extracted from Haven et al. (1978); data from 1974 to 2016 were provided by VMRC. Data for total leased area are not readily available for the period 1975–2006, but values are known to be low due to high disease prevalence and low harvests in the region.
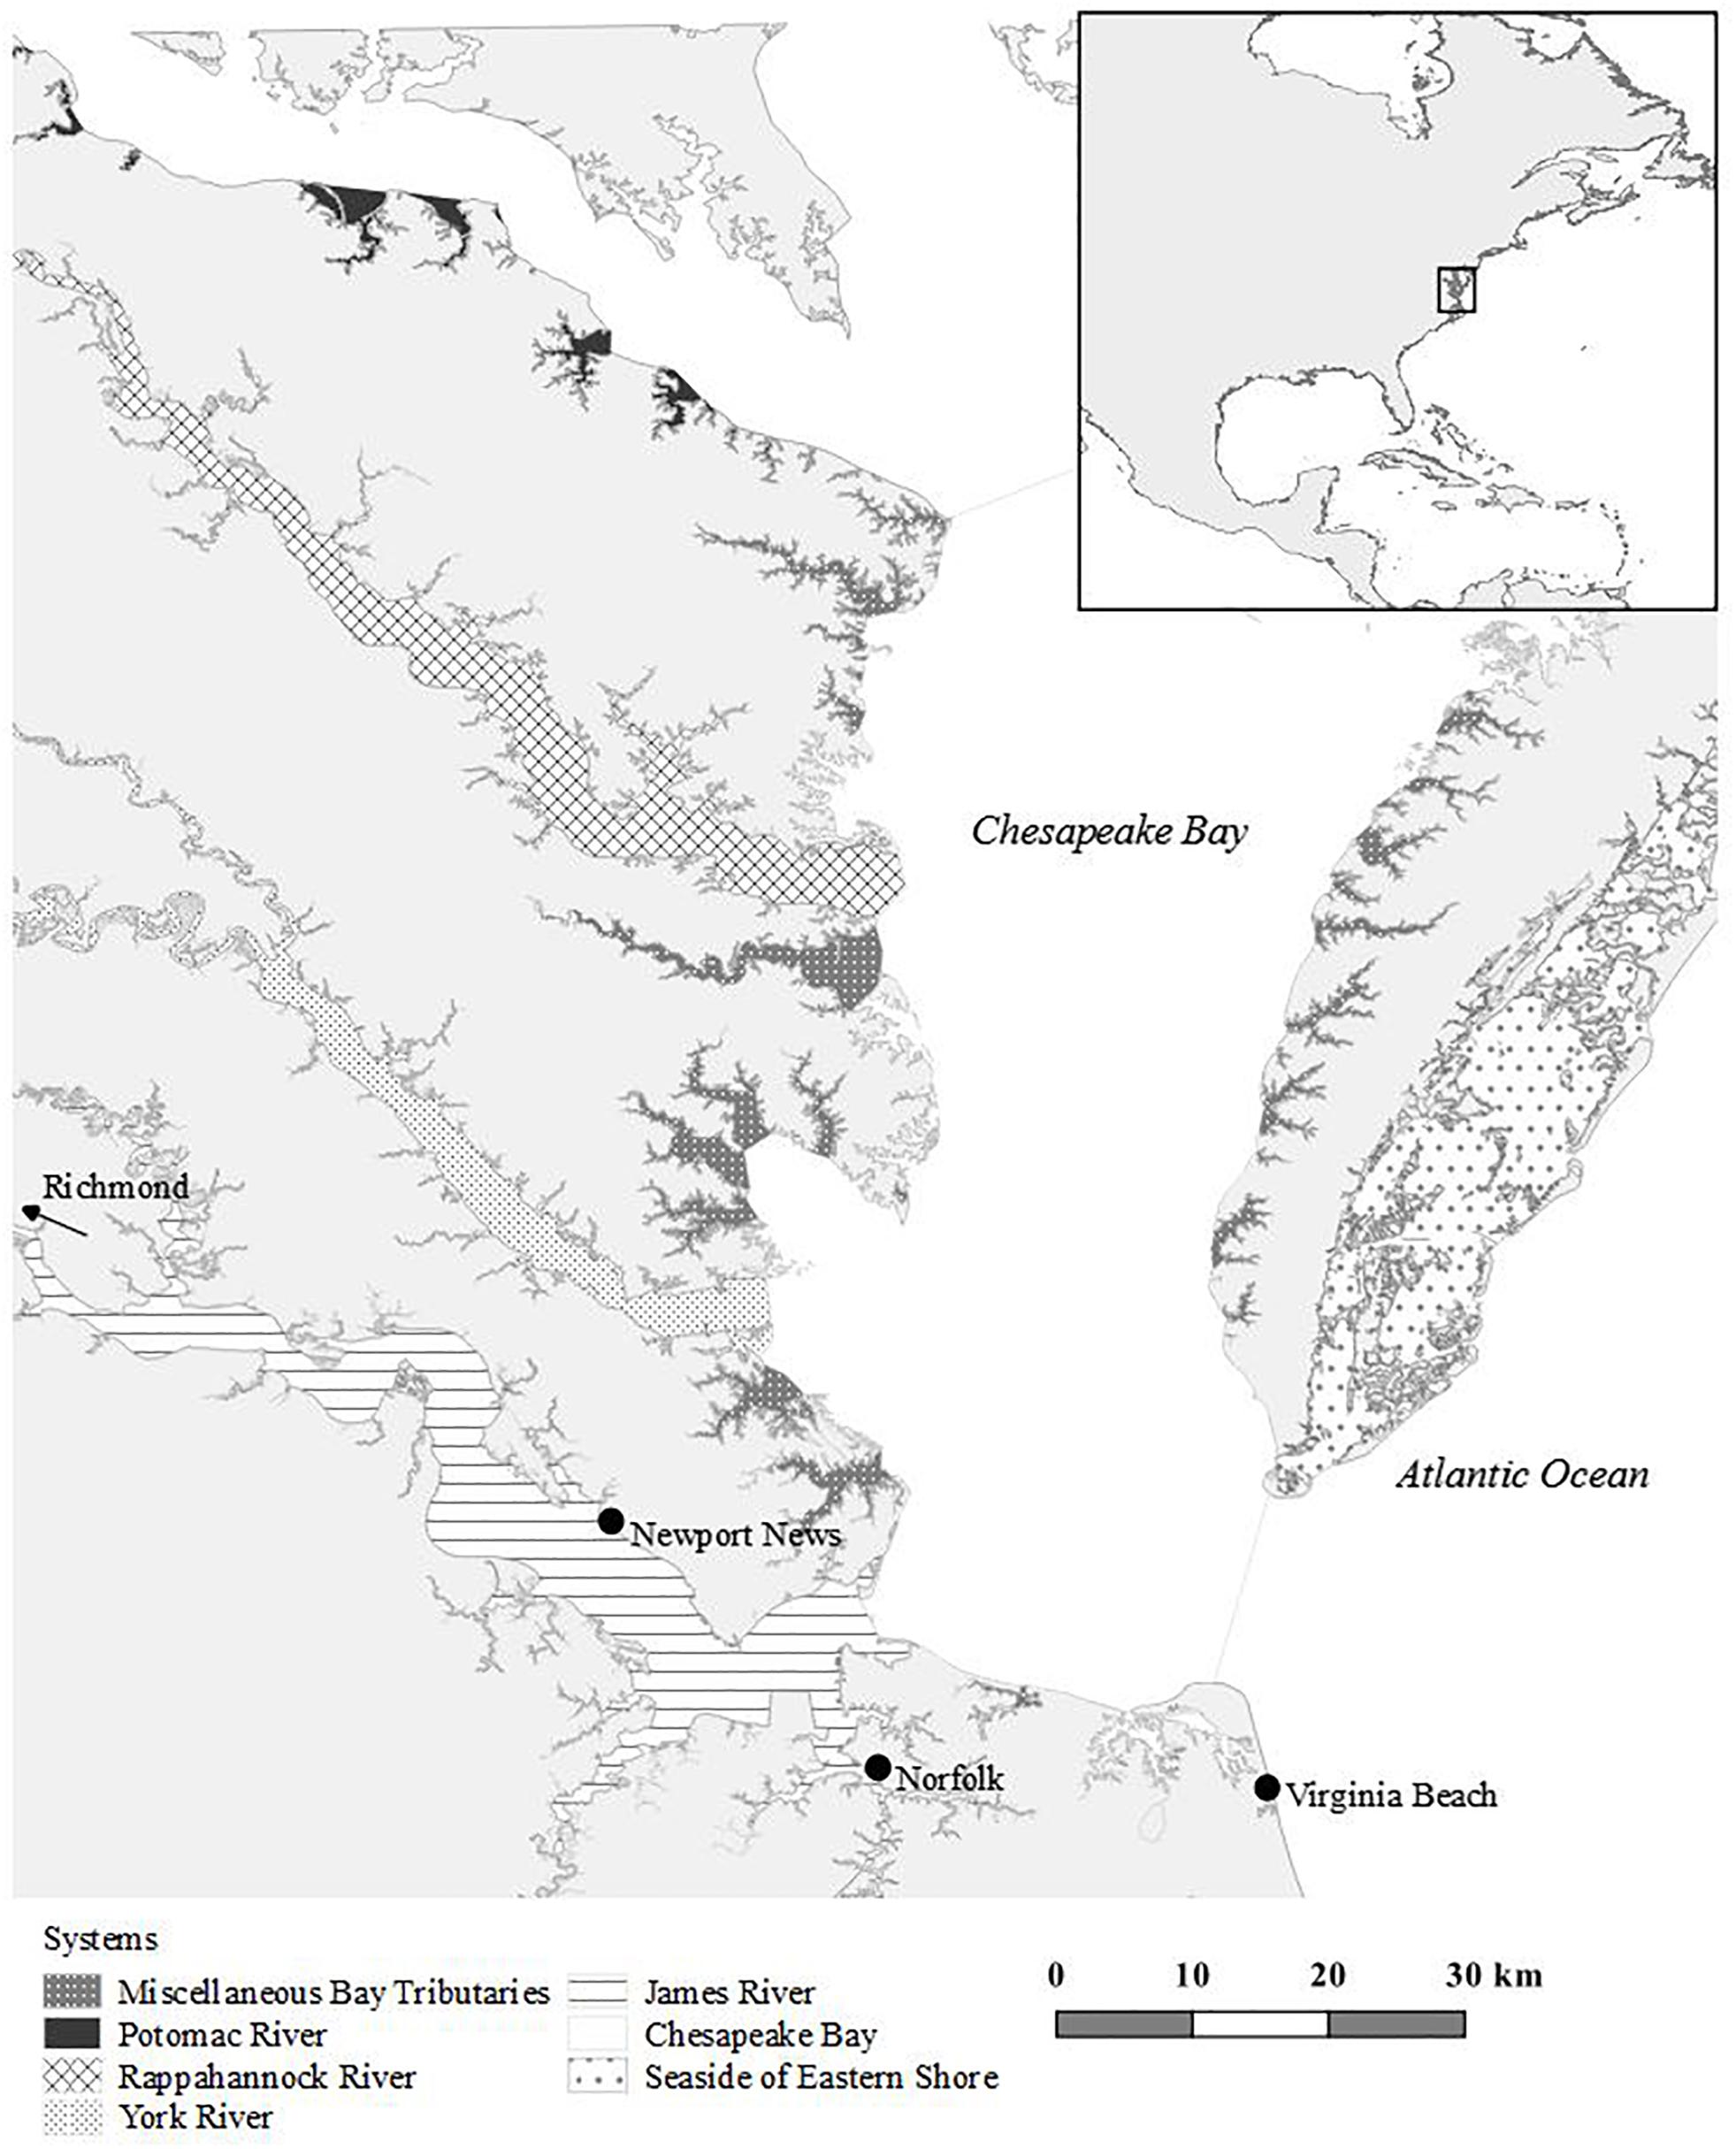
Figure 2. Study area with each system in the lower Chesapeake Bay indicated. Only the Virginia waters of the Potomac River are shown (in dark gray). Private leases on the Atlantic coast of Eastern Shore (dotted pattern) were excluded from analyses.
Chesapeake Bay (Figure 2) is the largest estuary in the United States and is used by a diverse group of stakeholders for recreational, commercial, and government activities (e.g., boating, fishing, swimming, military training, and security). About 18 million people live within the Bay’s watershed and the population is expected to reach 20 million by 2030 (Chesapeake Bay Program, 2017). The Hampton Roads region of Virginia, which boarders the southern extent of Chesapeake Bay, is particularly densely populated, with a population of 1.7 million that includes the cities of Virginia Beach, Norfolk, Hampton, Newport News, and Portsmouth. Conflict with oyster aquaculturists is common in heavily populated areas in the region such as in the Lynnhaven River, where aquaculture infrastructure (e.g., cages) has been argued to be unsightly and potentially dangerous for recreational activities. Other coastal property owners worry about the industry’s effect on property access and value (Knapp and Rubino, 2016; Evans et al., 2017). Many think that availability for lease space now constrains the expansion of oyster aquaculture in lower Chesapeake Bay (Mason, 2008; B. Stagg, VMRC, pers. comm.).
Although privately leased areas in Virginia waters of Chesapeake Bay represent an important part of overall oyster harvests (60%), there are a number of reasons to believe that harvests could potentially be far greater. In theory, commercial leases larger than 1/2 acre must be used for “planting or propagating [of] oysters” as stated in the Virginia Code, Chapter 6, 28.2-603. However, privately leased grounds are now thought to be significantly underutilized for oyster production (Mason, 2008; Bosch et al., 2010). It is widely hypothesized—but poorly demonstrated—that factors other than potential oyster production are important drivers of the recent increase in leased area. With the lowest annual lease rate in the United States ($1.50/acre/year), there is little cost to holding a lease and individuals may apply for a lease without the intention of using it for oyster culture in the immediate future (Mason, 2008). Lease acquisition in Virginia may be driven by the desire of waterfront landowners for esthetic purposes or to impede development of oyster farming “in their backyard” (“Not in my backyard” attitude is hereafter referred to as NIMBY after Dear, 1992). Speculative leasing of areas with the intent of future resale at a profit, without productive use, is also suspected to contribute to the increase in leases (Mason, 2008). Increased aquaculture development in Virginia might therefore face limitations related to social factors rather than the biophysical environment. Despite the positive trend in production recently observed, these challenges could be key constraints to further industry expansion, and although considered to be underutilized, the scope, spatial scale, and temporal trends in recent oyster lease use and productivity have not been investigated.
The primary goals of this study were to quantify temporal and spatial trends in the use and productivity of private oyster ground leases in the lower Chesapeake Bay and explore potential impacts of environmental, social, and management contexts. Specifically, we first examined if lack of space was limiting industry expansion. To do so, we analyzed temporal and spatial saturation levels with respect to leased grounds in the main river systems of the Chesapeake Bay. Second, temporal and spatial trends of lease productivity (i.e., pounds of oysters per leased acreage) and lease use were examined. Then, we investigated how used and non-used leases differed across variables thought to be related to NIMBY attitudes, spatial congestion, speculation, local economic and environmental conditions. Finally, we compared average productivity of leased grounds for 2017 across states on the East Coast and Gulf Coast of the United States. This comprehensive analysis of temporal and spatial trends in oyster lease use, drivers behind this use, and leasing system performance, is needed to fully understand current trends, predict future patterns, and identify impediments to growth in oyster production in the Chesapeake Bay as well as more broadly.
Materials and Methods
Study Area
Virginia waters of the Chesapeake Bay have a total surface area of 1,976,843 ac (8,000 km2) and are classified by VMRC into seven systems: the James River, York River, Rappahannock River, Potomac River, the main bay, miscellaneous tributaries (i.e., smaller tributaries found along the bay), and the Atlantic coast of Eastern Shore (Figure 2).
Available Data
Statistical analyses of spatial saturation, trends and drivers of lease use and productivity, and comparisons of used and non-used leases were carried out using a combination of data from VIMS, VMRC, Virginia Department of Health (VDH), NOAA/NOS estuarine bathymetry digital elevation model, and the Internal Revenue Service (IRS) (Table 1). Data on oyster leases, harvests, environmental conditions, and surrounding socio-economic conditions were stored in a spatially-explicit PostgreSQL/PostGIS database (PostgreSQL10.9, PostGIS 2.4.4).
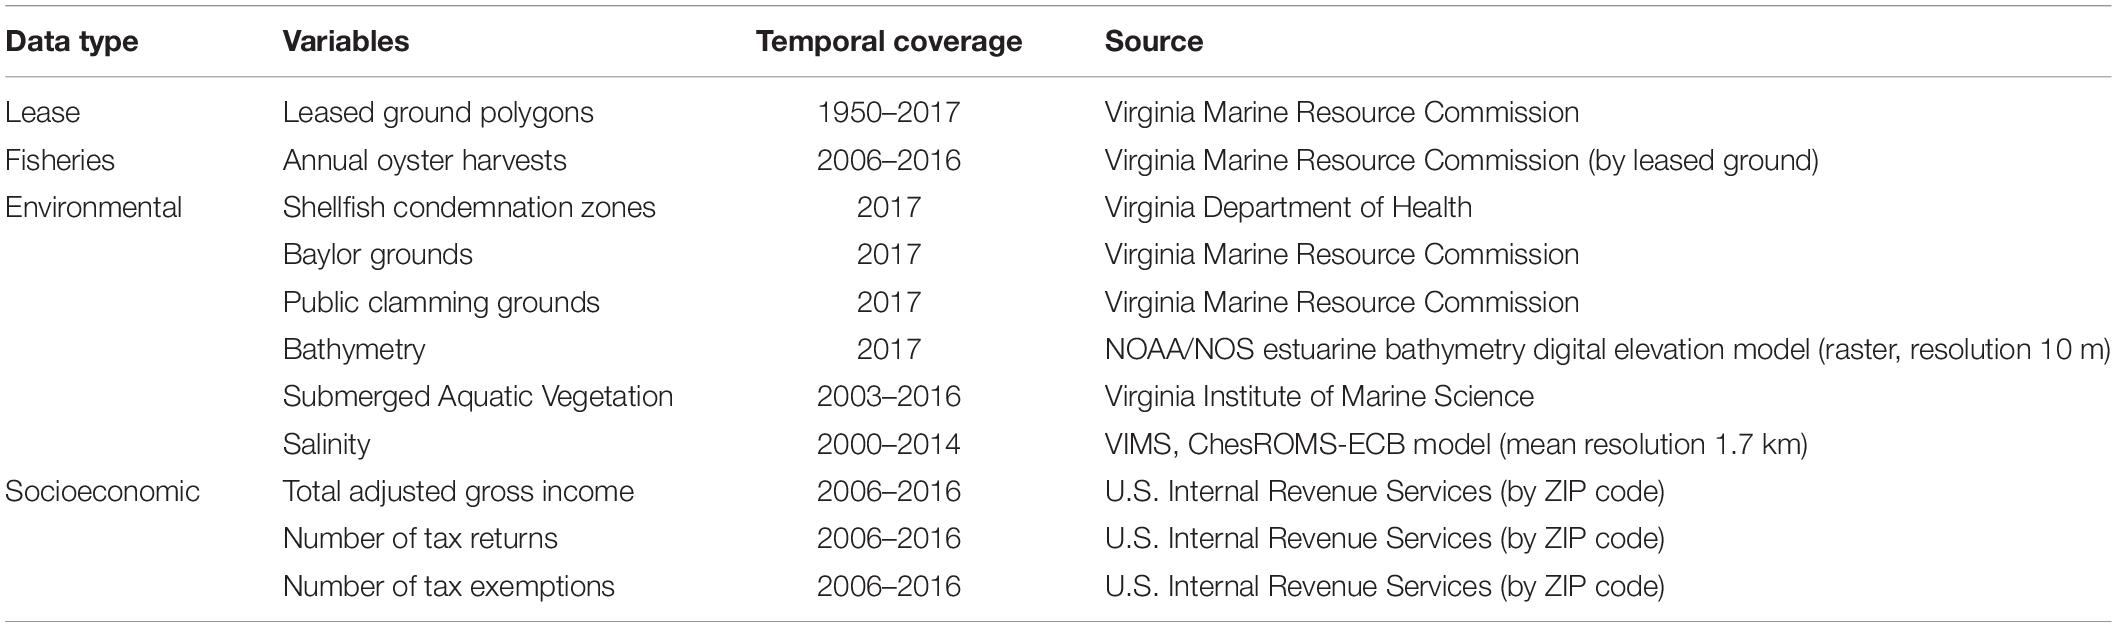
Table 1. Variables used in the analysis, their spatial and temporal coverage, and data sources by type.
Leases and Corresponding Harvest Data
Polygons of leased grounds in Virginia existing during the period 2006–2016 (Figure 3) were available publicly through the VMRC’s Chesapeake Bay Map (accessed on 2017/06/30; archived maps also available)2. Information on individual leases includes the type of lease (e.g., commercial or not), its assignment and termination dates, and the leaseholder’s name and mailing address (i.e., physical address or PO Box). Leaseholders are required to submit annual reports on commercial harvest. Time series of annual oyster harvest per lease from 2006 to 2016 were provided by VMRC, which collects these data for management and monitoring purposes. Harvest data were separated by lease identification number, gear, and year.
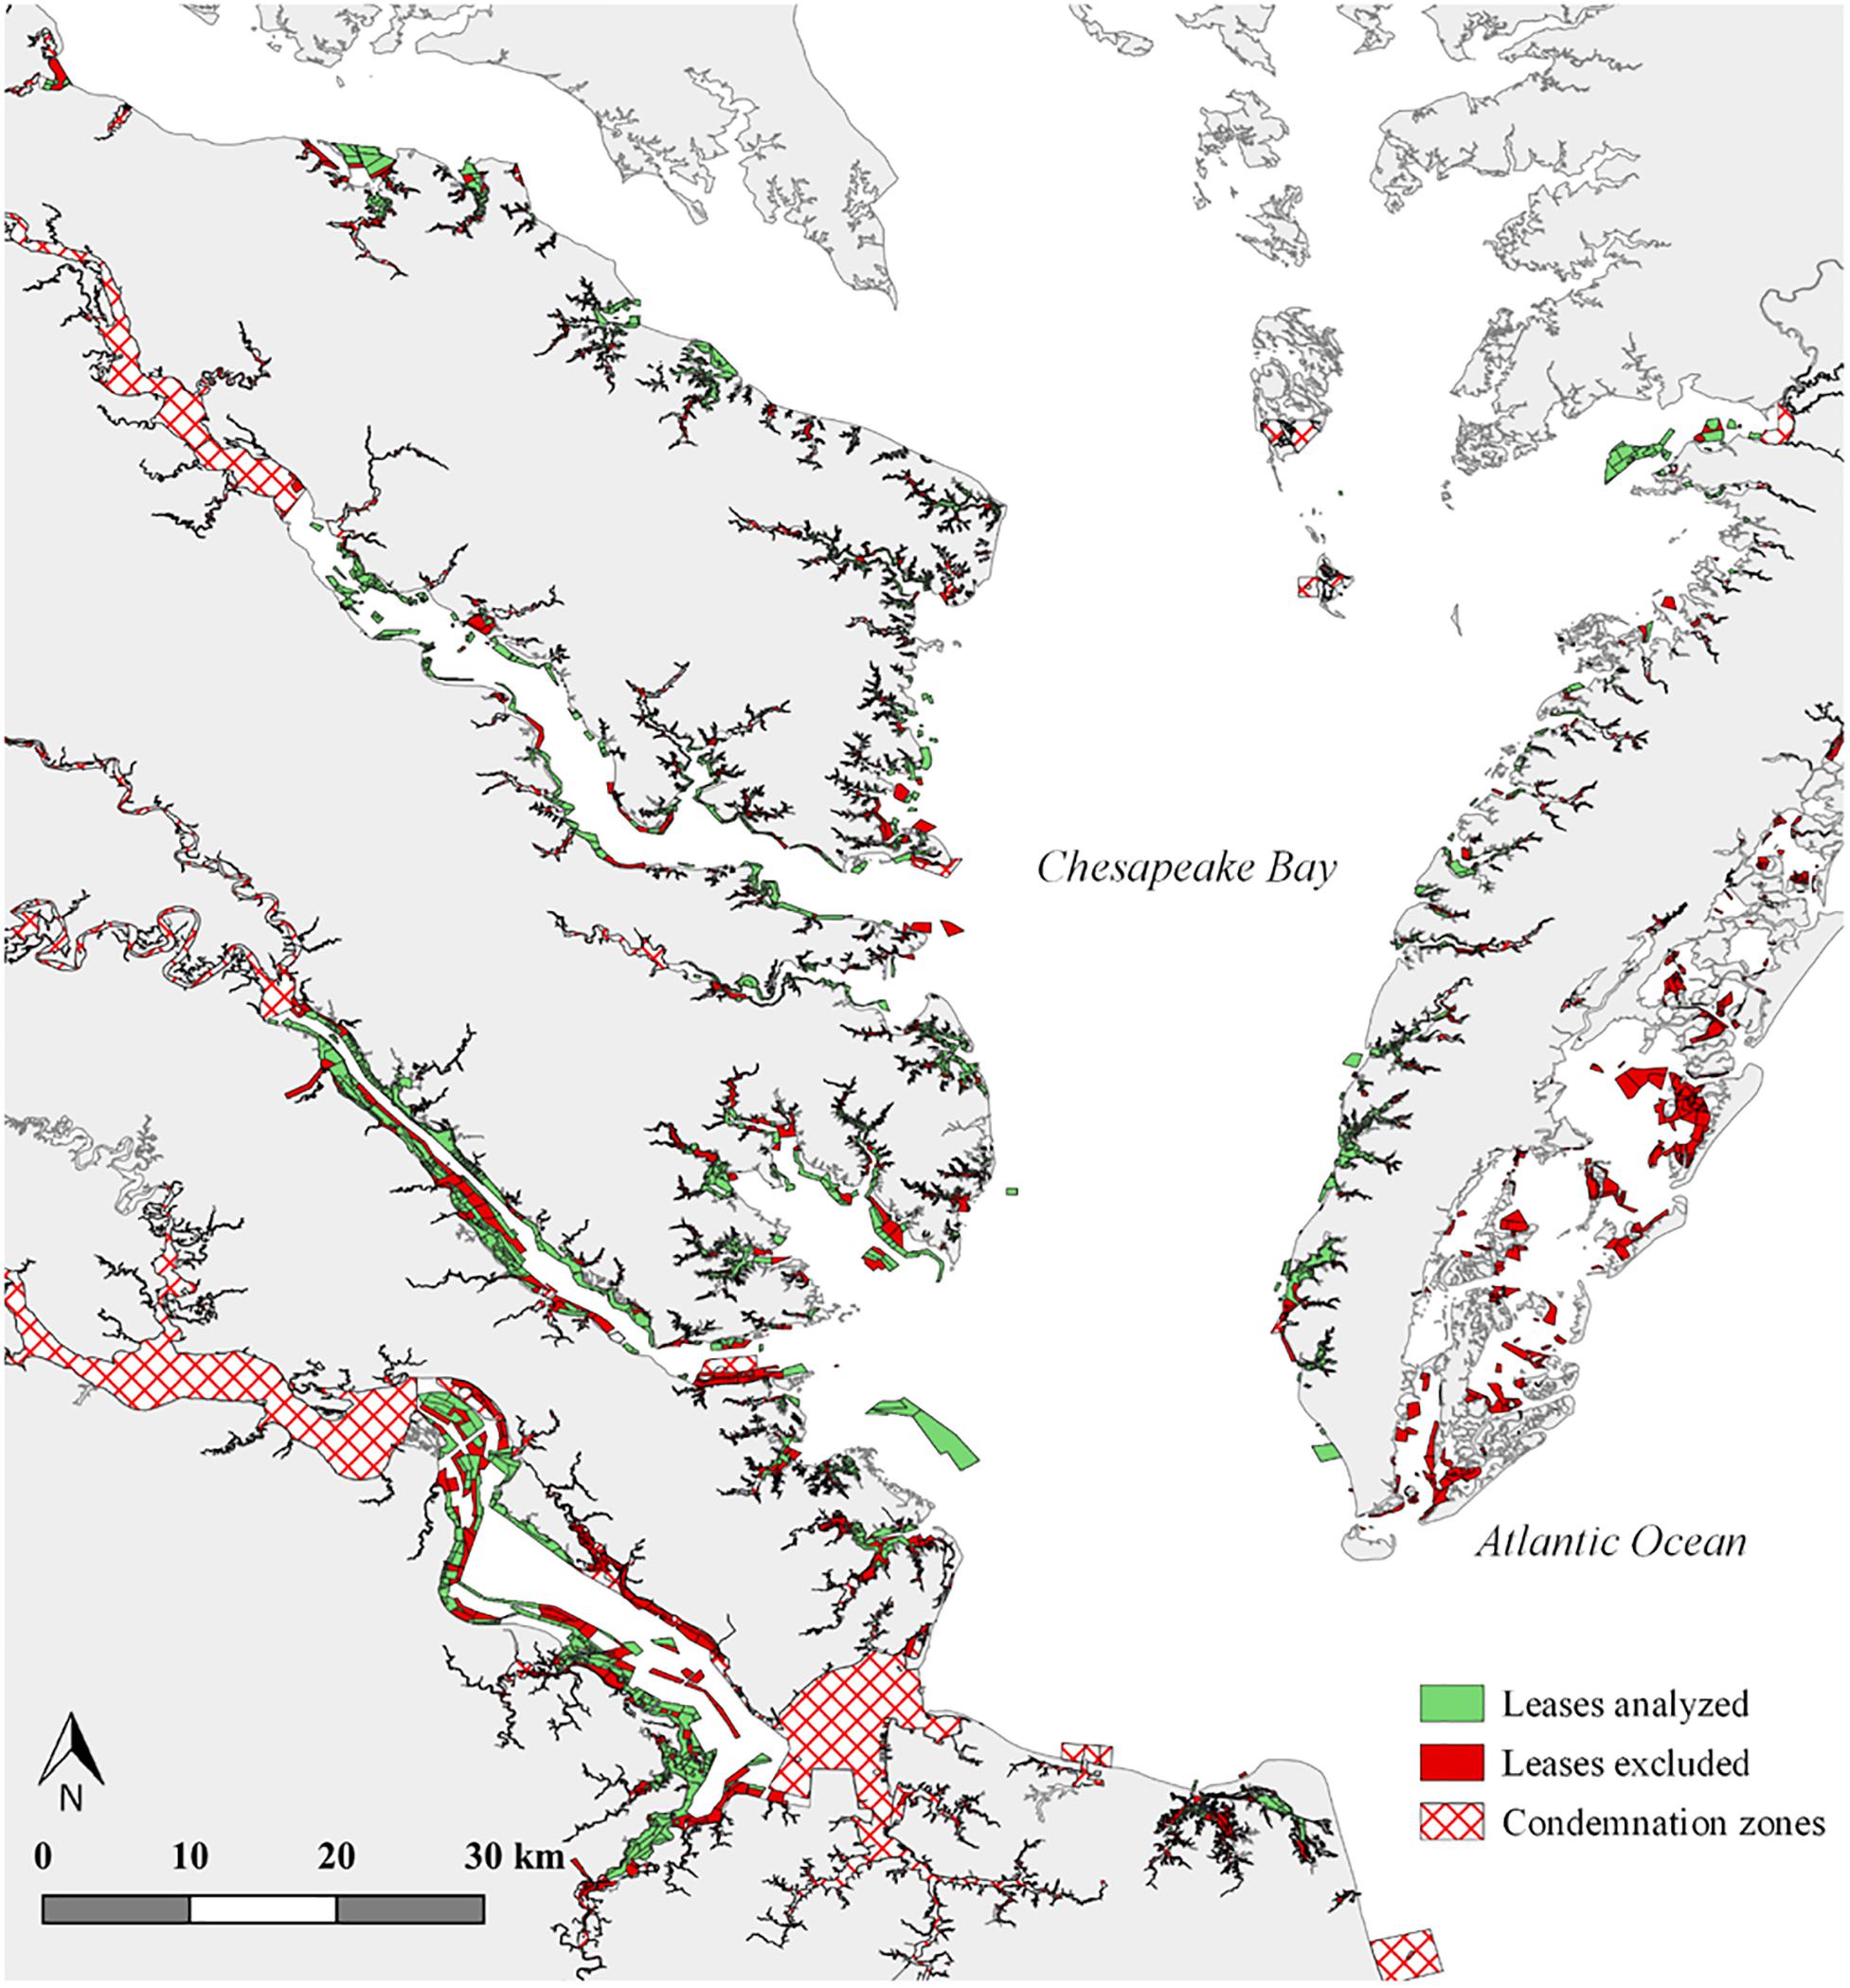
Figure 3. Leases analyzed during the period 2006–2016 (in green). Other leases excluded from the dataset (in red) included riparian leases, leases on the Atlantic coast of the Eastern Shore, those in condemned zones (hatched red areas), and those that were never more than 2 years old.
Environmental Data
In order to assess the availability by major river system and year of remaining areas that could potentially be leased, several habitat, environmental, and management variables were combined to define suitable and not-suitable areas for oyster production. Not-suitable areas included Baylor grounds, i.e., natural oyster beds reserved for the public use, and public clamming grounds, for which GIS polygons were available publicly through the VMRC’s Chesapeake Bay Map. Shellfish condemnation zones not-suitable for oyster growth, nor for human consumption, were provided by VDH for 2017 and comprised zones where no harvesting at any time is allowed, zones where harvest is restricted from April to October (marina-based restriction), and zones corresponding to upstream tidal waters where salinities are too low to sustain continuous annual oyster growth. Deep waters were also considered not-suitable areas for oyster production because deeper waters can have low dissolved oxygen concentrations in the summer (Theuerkauf and Lipcius, 2016) and involve higher risk, access, and technical costs for oyster culture. Bathymetric data of the Chesapeake Bay were obtained from a NOAA/NOS estuarine bathymetry digital elevation model, with a resolution of 10 m (National Centers for Environmental Information, 2017). VMRC does not allow leasing of grounds covered by submerged aquatic vegetation (SAV beds) and typically considers the past five years of SAV distribution when reviewing lease applications. SAV beds provide important ecological services for the Bay, such as structured habitat and food, improvements to water quality, and stabilization of bottom sediments (Thayer et al., 1975); however, SAV competes for shallow habitat with cultured oysters (Wagner et al., 2012). The GIS polygons of all densities of SAV coverage (i.e., very sparse to dense coverage) from 2003 to 2016 were provided by VIMS (D. Wilcox, VIMS, pers. comm.).
Because salinity can affect oyster growth, spring bottom salinity from 2003 to 20143 (March to June) were derived from an estuarine biogeochemical model, ChesROMS-ECB, developed for the Chesapeake Bay and having an average grid resolution of 1.7 km (Feng et al., 2015). We compared lease use according to salinity: higher salinity allows higher oyster growth and reproductive rates, but is also a surrogate for increased disease prevalence (Shumway, 2011).
Socio-Economic Data
Previous studies in British Columbia found that those opposed to aquaculture industry expansion tended to be wealthy and lived near the waterfront (Shafer et al., 2010; D’Anna and Murray, 2015). Therefore, we expected leases in more populated areas with higher incomes to be used less, plausibly obtained to exclude oyster aquaculture. Total adjusted gross income, number of personal tax returns, and number of personal tax exemptions were used to create proxies for per household income, household and local population size. These data were available by ZIP code from individual income tax statistics provided by the U.S. IRS4.
Data Processing
Not-Suitable Areas for Leasing and Saturation Index
Not-suitable areas for leasing comprised Baylor grounds, clam grounds, condemned zones, and deep waters. A cutoff of 8 m was used from the bathymetric data to exclude deeper water areas (i.e., 99th percentile of maximum depth observed per lease, consistent with Carlozo, 2014 for which a depth of 7.62 m was used). Not-suitable areas were removed from each system to calculate a constant leasable area per system, leasable_areasys (Figure 4). SAV grounds for the four years preceding and up to a given year were considered as not leasable for the given year per system and were defined as SAV_areay,sys. An annual saturation rate per system, sy,sys, was calculated as the union of all leased areas (including all leases, i.e., riparian5 leases and commercial leases), leased_areay,sys, and all SAV grounds for a given year divided by leasable area (i.e., Chesapeake Bay area excluding Baylor grounds, clams grounds, shellfish condemnation zones, and deep waters):
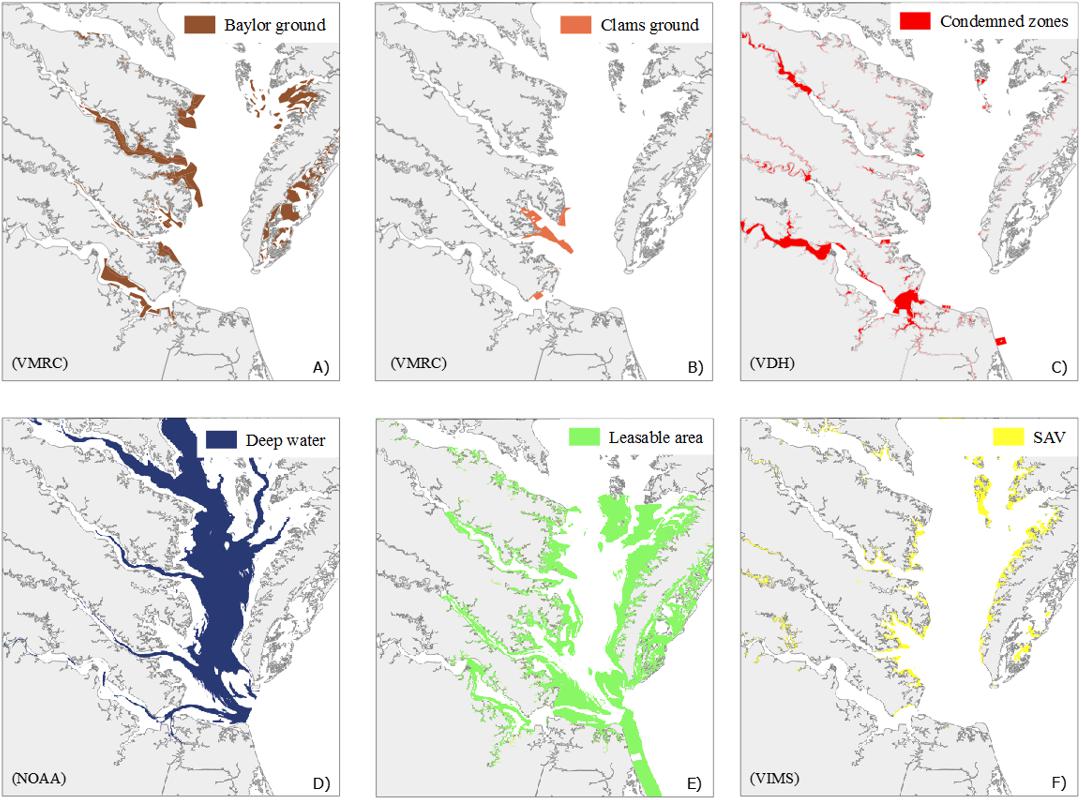
Figure 4. Areas that were not suitable for oyster production were comprised of Baylor grounds (A), clams grounds (B), shellfish condemnation zones (C), and deep waters (D). These were subtracted from the mainstem area of Chesapeake Bay to produce leasable area (E). Leasable area was considered constant from 2006 to 2016 while SAV grounds (F) changed over time, but all years’ beds are plotted here. Data sources for each area are indicated in bottom left corner in parentheses.
This saturation index, bounded between 0 and 1, was used to examine space limitation for oyster industry expansion as a function of time.
Lease Exploitation Indices
We categorized oyster harvests into intensive or extensive aquaculture based on the utilized gear. Extensive, on-bottom, aquaculture refers to the deposition, or planting, of oyster shells or live seed oysters (spat on shell, or cultch) on the bottom for later harvest. Extensive aquaculture gear includes scrapes, patent tongs, dredges, picks, and bull rakes6. Intensive, off-bottom, aquaculture refers to the production of high density, high value, cultch-free oysters over a small area. Intensive aquaculture gear includes bottom cages, implanted racks, bags, water column cages, net pens, and floats. The harvest dataset was combined with the lease dataset to create two indices of lease exploitation: (1) use, ui,y, which was a binary variable, equal to 1 if any harvest was reported on lease i in year y and equal to 0 otherwise, and (2) productivity, prodi,y,t, which was the oyster harvest reported for a lease i in year y and aquaculture type t (extensive or intensive), divided by lease i’s area (in acres).
Selection of Lease Areas for Analysis
As further analyses were focused on lease use and productivity, certain zones or leases were not considered to be available for production, such as shellfish condemnation zones and riparian leases. As commercial oyster production in these areas is either banned, unlikely, or highly variable, they were eliminated before carrying out further analyses (Figure 3). Furthermore, since oysters may require 2–3 years to reach market size (76 mm shell length) (Harding, 2007) and leaseholders often need time to build financial capital and production infrastructure (B. Stagg, VMRC, pers. comm.), lease use and production might not be expected during the initial years of a lease. Therefore, all data from the initial three years after a lease was granted were removed from analyses on use and productivity (e.g., data from a lease created in 2005 were excluded for analyses for the years 2006 and 2007). Finally, leases on the Atlantic coast of the Eastern Shore, typically used for clam aquaculture (Figure 1), were excluded from our dataset.
Indexes for Comparisons of Used and Non-used Leases
Differences in used and non-used leases, defined here as used (or not) once over 2006 to 2016, were investigated in relation to variables thought to be related to “NIMBY” attitudes, congestion, speculation, local economic and environmental conditions. Variables were aggregated or averaged per lease for the full study period of 2006–2016. Mean bathymetry of each lease was calculated from the NOAA bathymetry layer, and mean salinity was derived from the ChesROMS model. If a lease was not covered by the ChesROMS grid (i.e., in upstream areas of small tributaries), we extrapolated the salinity value from the nearest ChesROMS grid cell within 1.7 km of that lease (size of one grid cell). If a lease overlapped with several grid cells, we assigned the weighted sum of the value of those grid cells to the lease. Finally, mean distance to the nearest SAV grounds from 2003 to 2016 was calculated for each lease. As indicated above, the VMRC does not allow leasing of grounds with SAV beds considering the past five years of SAV distribution. Higher salinity and shallower bathymetry were expected to be key factors in the use of a lease. Proximity to SAV grounds was expected to have a negative impact on the use of a lease. SAV beds are thought to be expanding in leasable areas and VMRC requires growers to remove intensive gears from areas covered by SAV, though the lease is not revoked (Wagner et al., 2012; Patrick and Weller, 2015; B. Stagg, VMRC, pers. comm.).
Proxies for NIMBY attitudes were assessed using IRS socio-economic data as well as proximities of leases to leaseholder addresses (Dear, 1992) and to the shore. Population density was calculated as the population for a given ZIP code (number of personal tax exemptions) divided by its area. Per household income was calculated as total adjusted gross income divided by number of returns and was adjusted for inflation. Average income, household, and population density by ZIP code were averaged for the 2006–2016 period (Supplementary Figure S1). We then assigned to each lease the value from the nearest ZIP code area. Only 52% of leaseholder addresses in our dataset corresponded to an identifiable physical address as determined by a geolocation rating score less than or equal to 10 (recommended cutoff value7). Unidentifiable addresses were mostly PO Boxes. Therefore, distances to leaseholder ZIP code area centroids were calculated for every lease as a proxy for proximity to leaseholder’s home (i.e., we assumed that the ZIP code of PO Boxes corresponded to the ZIP code of the leaseholder’s physical address). We expected leases in more populated and higher-income areas, nearby leaseholder homes (i.e., smaller distances), and closer to the shore to be less intensively used due to some leases being kept to impede oyster aquaculture activities (i.e., resulting from NIMBY behaviors). A binary variable named “only_one_lease” was created and equal to 1 if a leaseholder had only one lease in the studied period, or equal to 0 if she/he had more than one lease. Leaseholders owning only one small lease were thought to potentially be those obtaining leases to exclude others.
Speculation, i.e., acquisition of a lease for future use or future resale at a higher price, has been suggested as another social behavior that could affect oyster lease use and result in lower efficiency of the leasing system (Mason, 2008). Given the observed increase in leased area in recent years (indicative of increased demand for leases), one might expect that leaseholders would buy more leases than needed, with those obtained later being more likely to be bought for investment purposes instead of immediate use in oyster production. We assessed this possibility with two variables. First, leases owned by a leaseholder from 2006 to 2016 were ranked according to their date of acquisition. Rank of purchase was then divided by the total number of leases owned. Second, leased areas held by a leaseholder were cumulatively summed according to their establishment date, and this sum was divided by the total leased area owned by the leaseholder. Both variables were therefore bounded between 0 and 1, with lower values representing leases or leased area obtained earlier on and higher values representing leases or leased area bought later.
Finally, an additional local feature, congestion of the area around a lease, was developed to potentially observe differences between used and non-used leases. One might think that multiple leases surrounding a productive lease, all owned by a single leaseholder, could be utilized as a buffer against poachers or other aquaculturists (B. Stagg, VMRC, pers. comm.); this central lease would then be more likely to be used. Furthermore, if a lease is surrounded by leases from different leaseholders, it might be expected that this lease will be more intensively used (e.g., due to peer pressure, fear of encroachment, network effects). Potential congestion or agglomeration effects were examined through four variables: within a 1 km buffer around each examined lease, we counted per year the number of other leases and fraction of leased acreage owned by the same leaseholder, and the number of other leases and fraction of leased acreage owned by different leaseholders. Those four variables were then averaged for the full study period of 2006–2016.
Statistical Analyses
Beta Regression for Saturation Analysis
A beta regression model (Ferrari and Cribari-Neto, 2004) was used to evaluate the saturation of Virginia waters of the Chesapeake Bay by leased areas over time and systems:
In (Eq. 2), the response variable was saturation, ssys,y, defined in the Section “Not-Suitable Areas for Leasing and Saturation Index” as the proportion of a given system’s leasable area occupied by leased areas or SAV, for year y. The dependent variable was continuous, restricted to the unit interval (0,1), and beta-distributed, ssys,y ∼B (μsys,y,Φ) with μsys,y its mean and Φ, a constant precision parameter; the link function used, g(.), was logit. X1 was a (k × 1) vector of observations on k covariates consisting of: year, year2 (its quadratic transformation to test for non-linear trends), system intercepts, and the interaction terms year × system and year2 × system. β1 was a (1 × k) vector of regression coefficients to be estimated and εsys,y was the error term. Parameter estimation was performed by maximum likelihood in R (R Core Team, 2018) with the betareg package (Cribari-Neto and Zeileis, 2010). Beta regression parameter estimates correspond to the change in log-odds of the response variable, which here was system saturation. Differences between consecutive year predictions were used in the text to inform percent changes in saturation rate for a given year.
Hurdle-Style Model for Trends in Lease Use and Productivity
A two-part regression model, similar to a Hurdle model (Mullahy, 1986), was used to estimate temporal and spatial trends of lease use and productivity, the impact of lease age on use and productivity, and the impact of aquaculture practices (extensive, intensive) on productivity:
In (Eq. 3), we specified the probability lease i would be used in year y to be a function of X2, a (m × 1) vector of observations on m covariates: year, lease age, system intercepts, and interactions between year and system. β2 was a (1 × m) vector of unknown regression coefficients. In (Eq. 4), the dependent variable was the log-transformed productivity per lease i with non-zero harvest, observed for year y, with gear from aquaculture type t. The set of covariates for (Eq. 4) was the same as for (Eq. 3) with the addition of the covariate aquaculture type, specifying whether the harvest was from intensive or extensive aquaculture. We controlled for heterogeneity across leases in the estimations of (Eq. 3) and (Eq. 4) by including a random effect for lease i, δu,i, and δprod,i in (Eq. 3) and (Eq. 4), respectively. εi,y and εi,y,t were the error terms. We also ran these two models with random effects for leases nested within leaseholder to evaluate the amount of unexplained variance in lease use and productivity attributable to individual leaseholders. Coefficient estimation was performed by restricted maximum likelihood with the lme4 package (functions glmer and lmer, Bates et al., 2015). Marginal coefficient of determination, R2m, and conditional coefficient of determination, R2c, describing the proportion of variance explained by fixed factors only and by the entire model, including random factors, respectively, were estimated for the mixed effects models with the MuMIn package (Nakagawa and Schielzeth, 2013). Coefficients were transformed in the text into percent changes in use probability for a given change in the predictor variable using the following formula: ; or into percent changes in productivity for a given change in the predictor variable using the following formula: %Δy = 100⋅(eβ⋅Δx−1).
Comparisons of Used and Non-used Leases
Comparisons of used and non-used leases’ characteristics (i.e., proxy variables related to either NIMBY, congestion, speculation, economic or environmental conditions) over the period 2006–2016 were performed with the non-parametric Wilcoxon rank-sum test (Mann and Whitney, 1947) and the Ansari–Bradley dispersion test (Ansari and Bradley, 1960). The Wilcoxon rank-sum test is used for comparing the central tendencies of two independent samples, whereas the Ansari–Bradley test evaluates equivalence of dispersions. A Pearson’s chi-square test was used to assess the independence between lease use and the binary variable “Only_one_lease” to determine if non-used leases were most often observed for leaseholders who had only one lease.
Lease Productivity Across U.S. East and Gulf Coast States
As oyster aquaculture management and historical contexts differ along the Eastern and Gulf Coasts of the United States, private leasing systems and aquaculture production were examined across states to evaluate the performance of Virginia’s lease system. Data on total aquaculture production for oysters, farm gate value, leased acreage, and number of leases for 2017 from U.S. East and Gulf Coast states with significant oyster aquaculture industries were obtained from a variety state agency administrators and industry annual reports (detailed source data found in Table 5). Lease productivity for 2017 was calculated as total production in oyster pieces divided by total leased area. These data were not differentiated by production method. When production was provided in bushels or sacks, we used the following conversions: 300 oysters per bushel for Maryland and North Carolina; 400 oysters per bushel for Virginia; and 250 oysters per sack for Texas (see Table 5, conversions provided by the individual state management authorities).
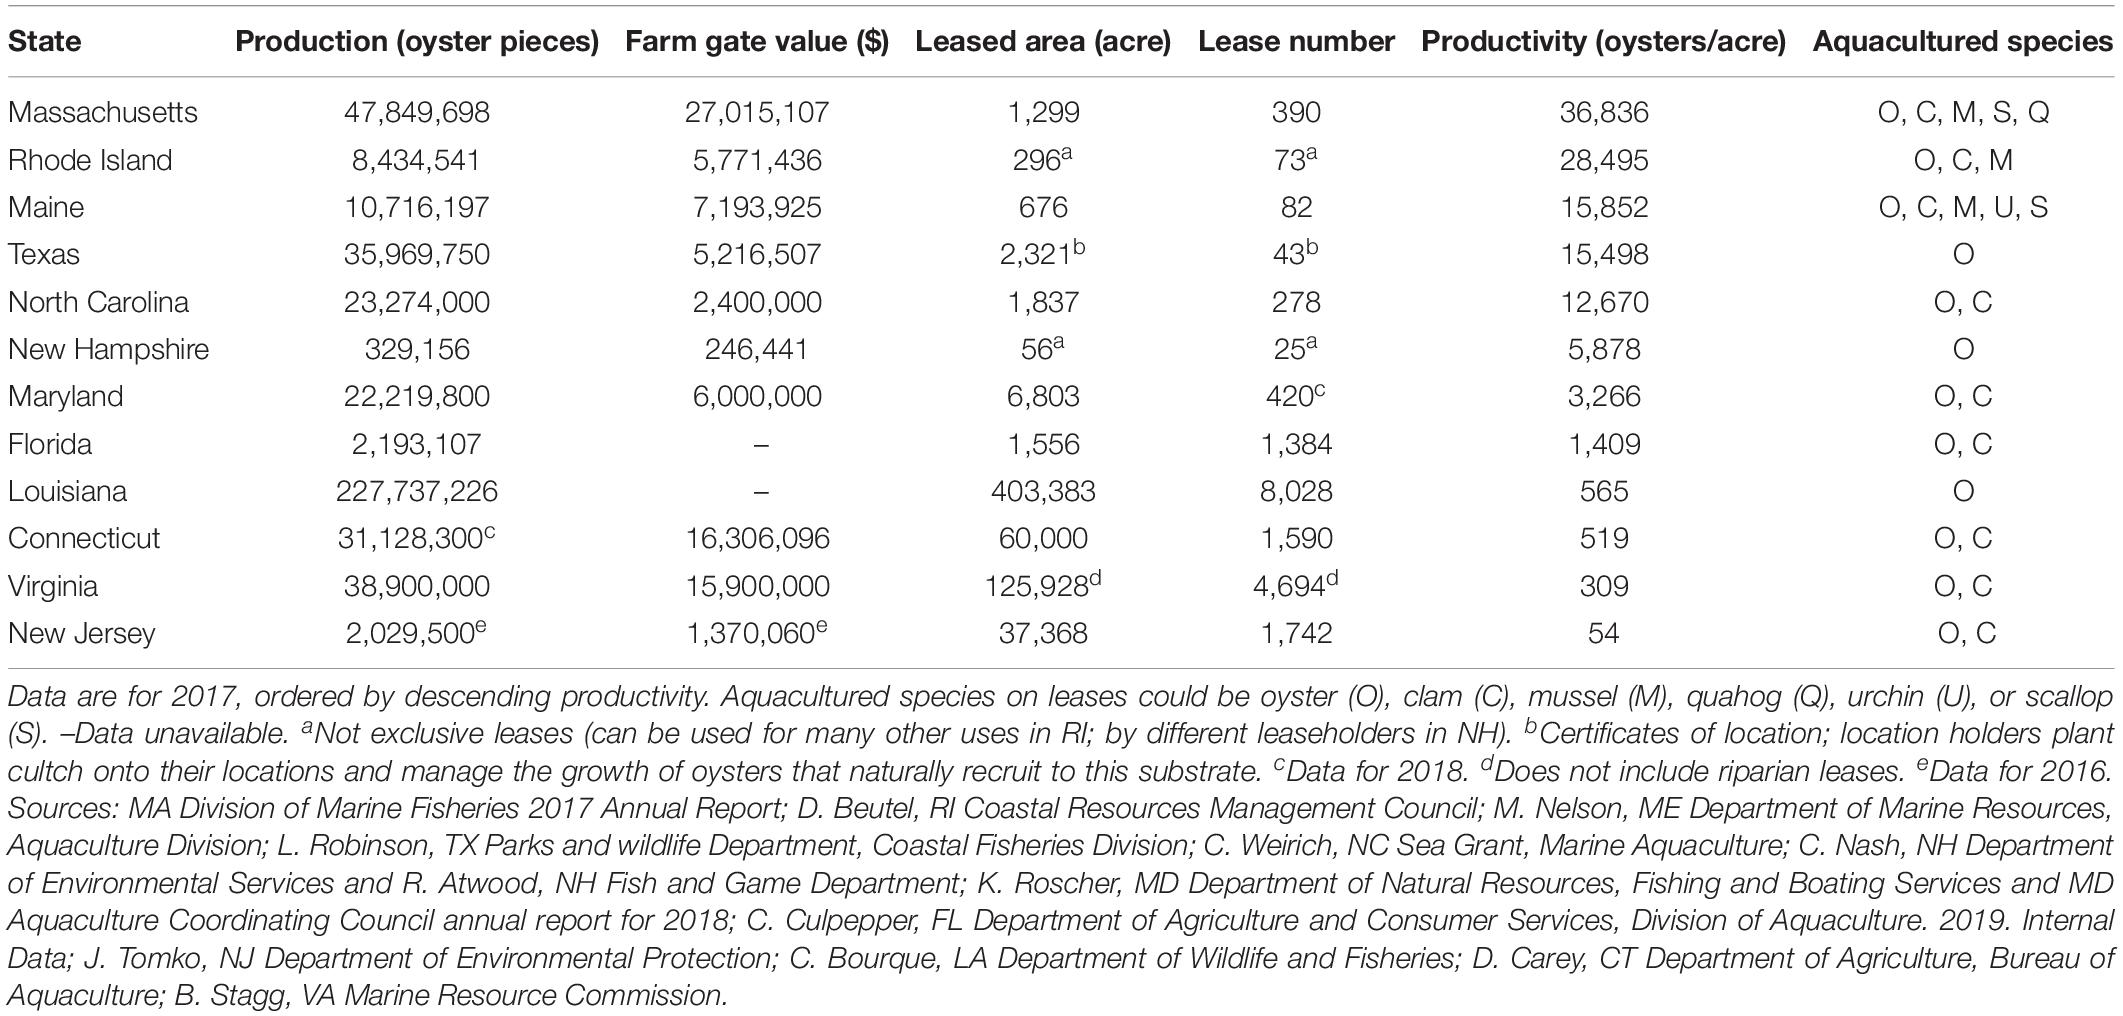
Table 5. Oyster production, farm gate value, leased area, and number of leases for U.S. East and Gulf coast states with significant oyster aquaculture industries.
Results
Private Oyster Leases in Virginia
In the last decade, Virginia has seen a significant increase in subaqueous leased area of ∼70%, leading to what is currently the largest amount of area leased since the system began more than 100 years ago. The total number of leases (including riparian leases) in 2017 was 5,592 with a total acreage of 139,120 ac (563 km2, held by 2,523 leaseholders), exceeding the previous historical maximum of 133,931 ac (542 km2) achieved in 1966 (Figure 1). The number of leases analyzed in our study from 2006 to 2016 is, however, lower since we have excluded leases in shellfish condemnation zones and from the Atlantic coast system, riparian leases, and leases less than three years old, as oyster production in these areas was unlikely (Figure 3). We therefore analyzed 3,340 leases covering 68,942 ac (279 km2), which were held by 1,276 leaseholders. Average lease size was 24.7 ac (0.1 km2), ranging from 0.1 ac (397 m2) to 1,927 ac (7.8 km2). Over the studied decade, ∼40% of leaseholders had only one lease, while 17% had more than five leases.
System Saturation Analysis
The annual saturation of Chesapeake Bay’s leasable systems by leased areas was analyzed over time (Figure 5) and assessed with a beta regression (Table 2). In 2016, 40–67% of leasable space was occupied by either oyster leases or SAV (with the exception of the mainstem of the Chesapeake Bay, in which only 10% of the leasable area was leased) (Figure 5). Changes in leased area drove changes in saturation rates as SAV occupied a relatively small and constant fraction of non-leased but leasable ground (7.0 ± 0.4%). High values for the pseudo-R2 (0.98) and precision parameter Φ (463.4) of the model indicated that the fit to the data was strong (Table 2; Cribari-Neto and Zeileis, 2010). Every system had an increasing saturation rate over time but rates differed by system. Leased area in the miscellaneous tributaries (base level), the Rappahannock River, and the Chesapeake Bay increased at similar rates of approximately 3.5% per year [estimated as 100 ⋅ as interactions between year and system were not significant, p > 0.05]. Significant quadratic interaction terms indicated that the rate of increase in saturation was itself increasing over the time period of the study in the more populated James River (ranging from 1.3% from 2006 to 2007, to 5.8% from 2015 to 2016) and York River (from 0.7% to 3.9%). However, saturation was increasing at a decreasing rate in the Potomac River, ranging from 5.6% to −2.9% for 2006 and 2016, respectively.
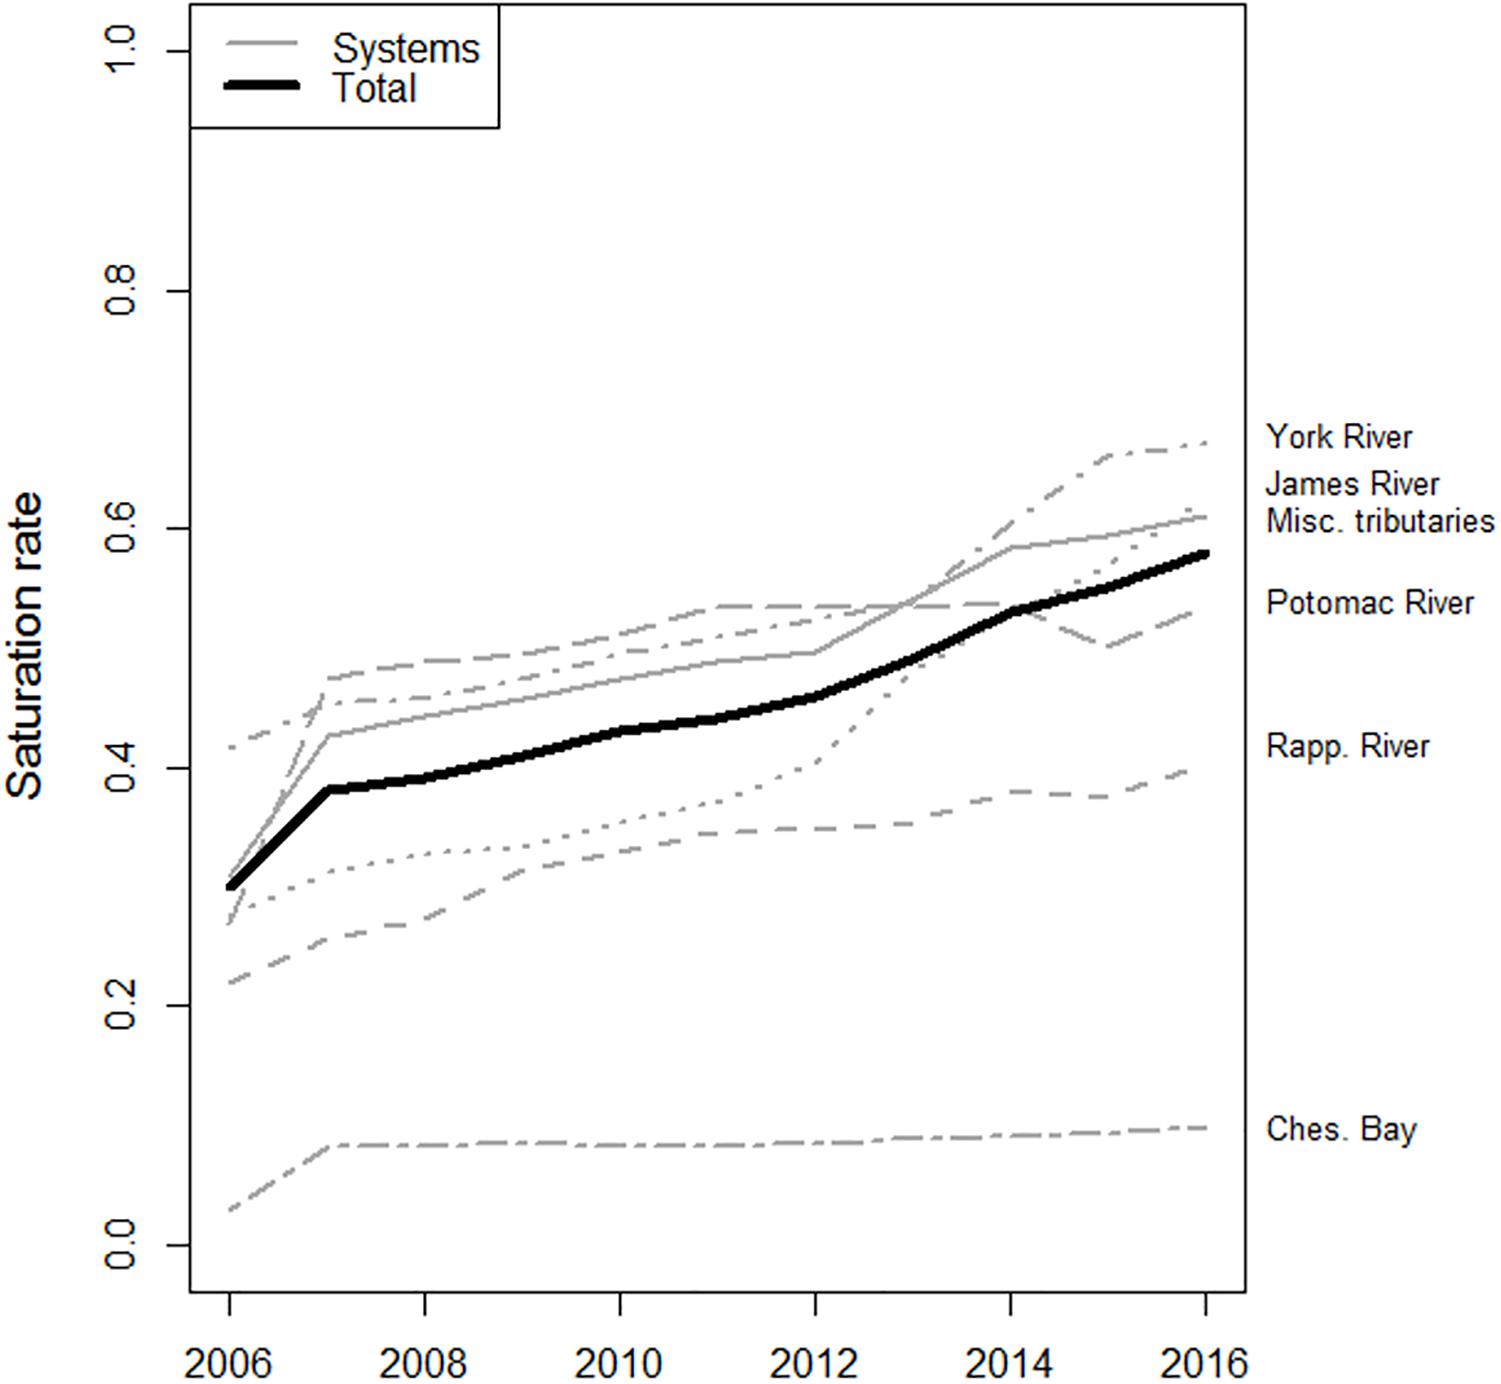
Figure 5. Saturation of systems’ waters by leased areas over year (gray lines) and overall saturation (bold line). Saturation for the mainstem of Chesapeake Bay was removed from total calculation as this area is distinctly dissimilar to other systems considered.
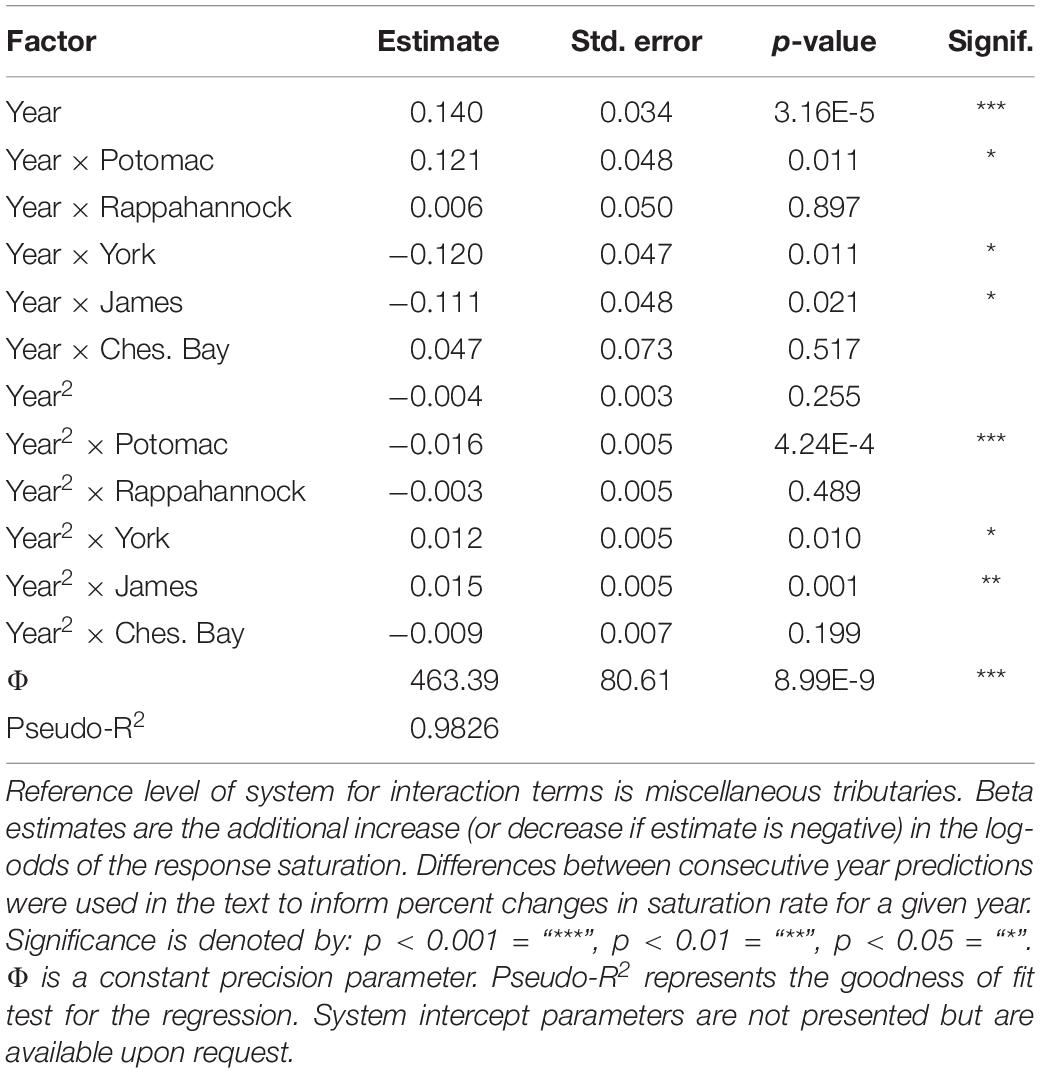
Table 2. Results of the beta regression model estimating saturation rates per year and system.
Lease Use Analysis
Actively used private leases were defined as those leases with any reported oyster harvest for a given year. Active leaseholders were defined as those leaseholders with an actively used lease in a given year. Percentages of active leases, leased areas, and leaseholders were calculated per year over all systems (Figure 6). In 2006, only 3.5% of individual leases, 9.7% of all leased areas, and 4.7% of leaseholders were active. Active lease proportions increased over time but were still low in 2016, when 19.1% of leases, 31.9% of leased areas, and 26.9% of leaseholders were active (Figure 6). Over the entire decade, 33.4% of leases, 44.3% of leased area, and 36.8% of leaseholders were active for at least one year.
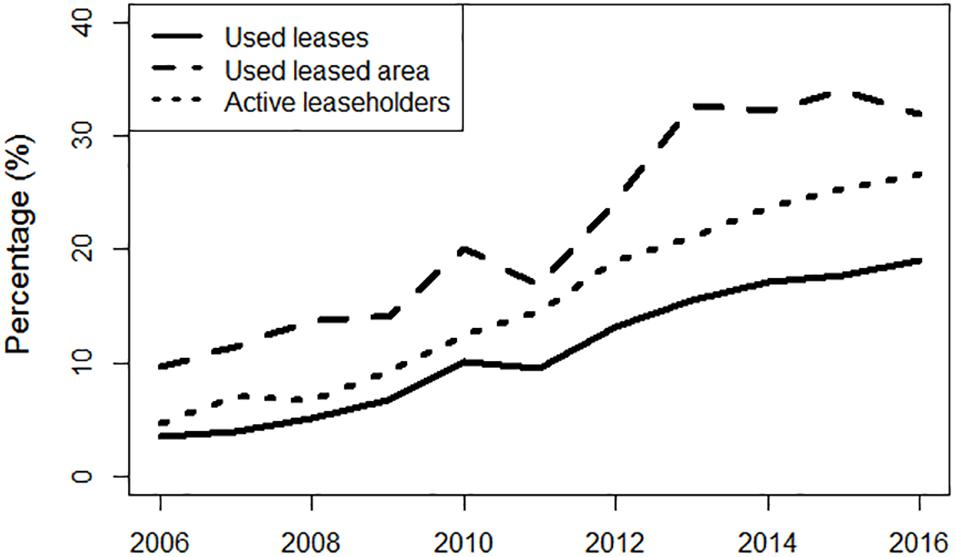
Figure 6. Percentages of used leases, used leased area, and active leaseholders per year over all systems.
Hurdle-Style Model for Use and Productivity
Results from the linear mixed effects model of lease use indicated that system, year, and some interactions between system and year had significant effects on the probability of a lease being actively used. There was an overall increase of use over time in every system (Table 3). The probability of a lease being actively used increased on average by 8.42% per year in the Potomac River (p < 0.05), by 6.76% in the Rappahannock River, York River, miscellaneous tributaries, and Chesapeake Bay (interactions were not significant, p > 0.05), and by 3.15% in the James River (p < 0.05, Table 3). Though the rate of increasing lease use in the James River was less than half that in other systems, use rates in this system were initially higher in 2006 as indicated by its intercept value (coefficient −2.89, the highest of all systems; Supplementary Figure S2A). Interestingly, recent leases were more likely to be used and the probability of a lease being used decreased by 0.5% per additional year of lease age (note the small magnitude for this estimate compared to that for year, suggesting its minor effect).
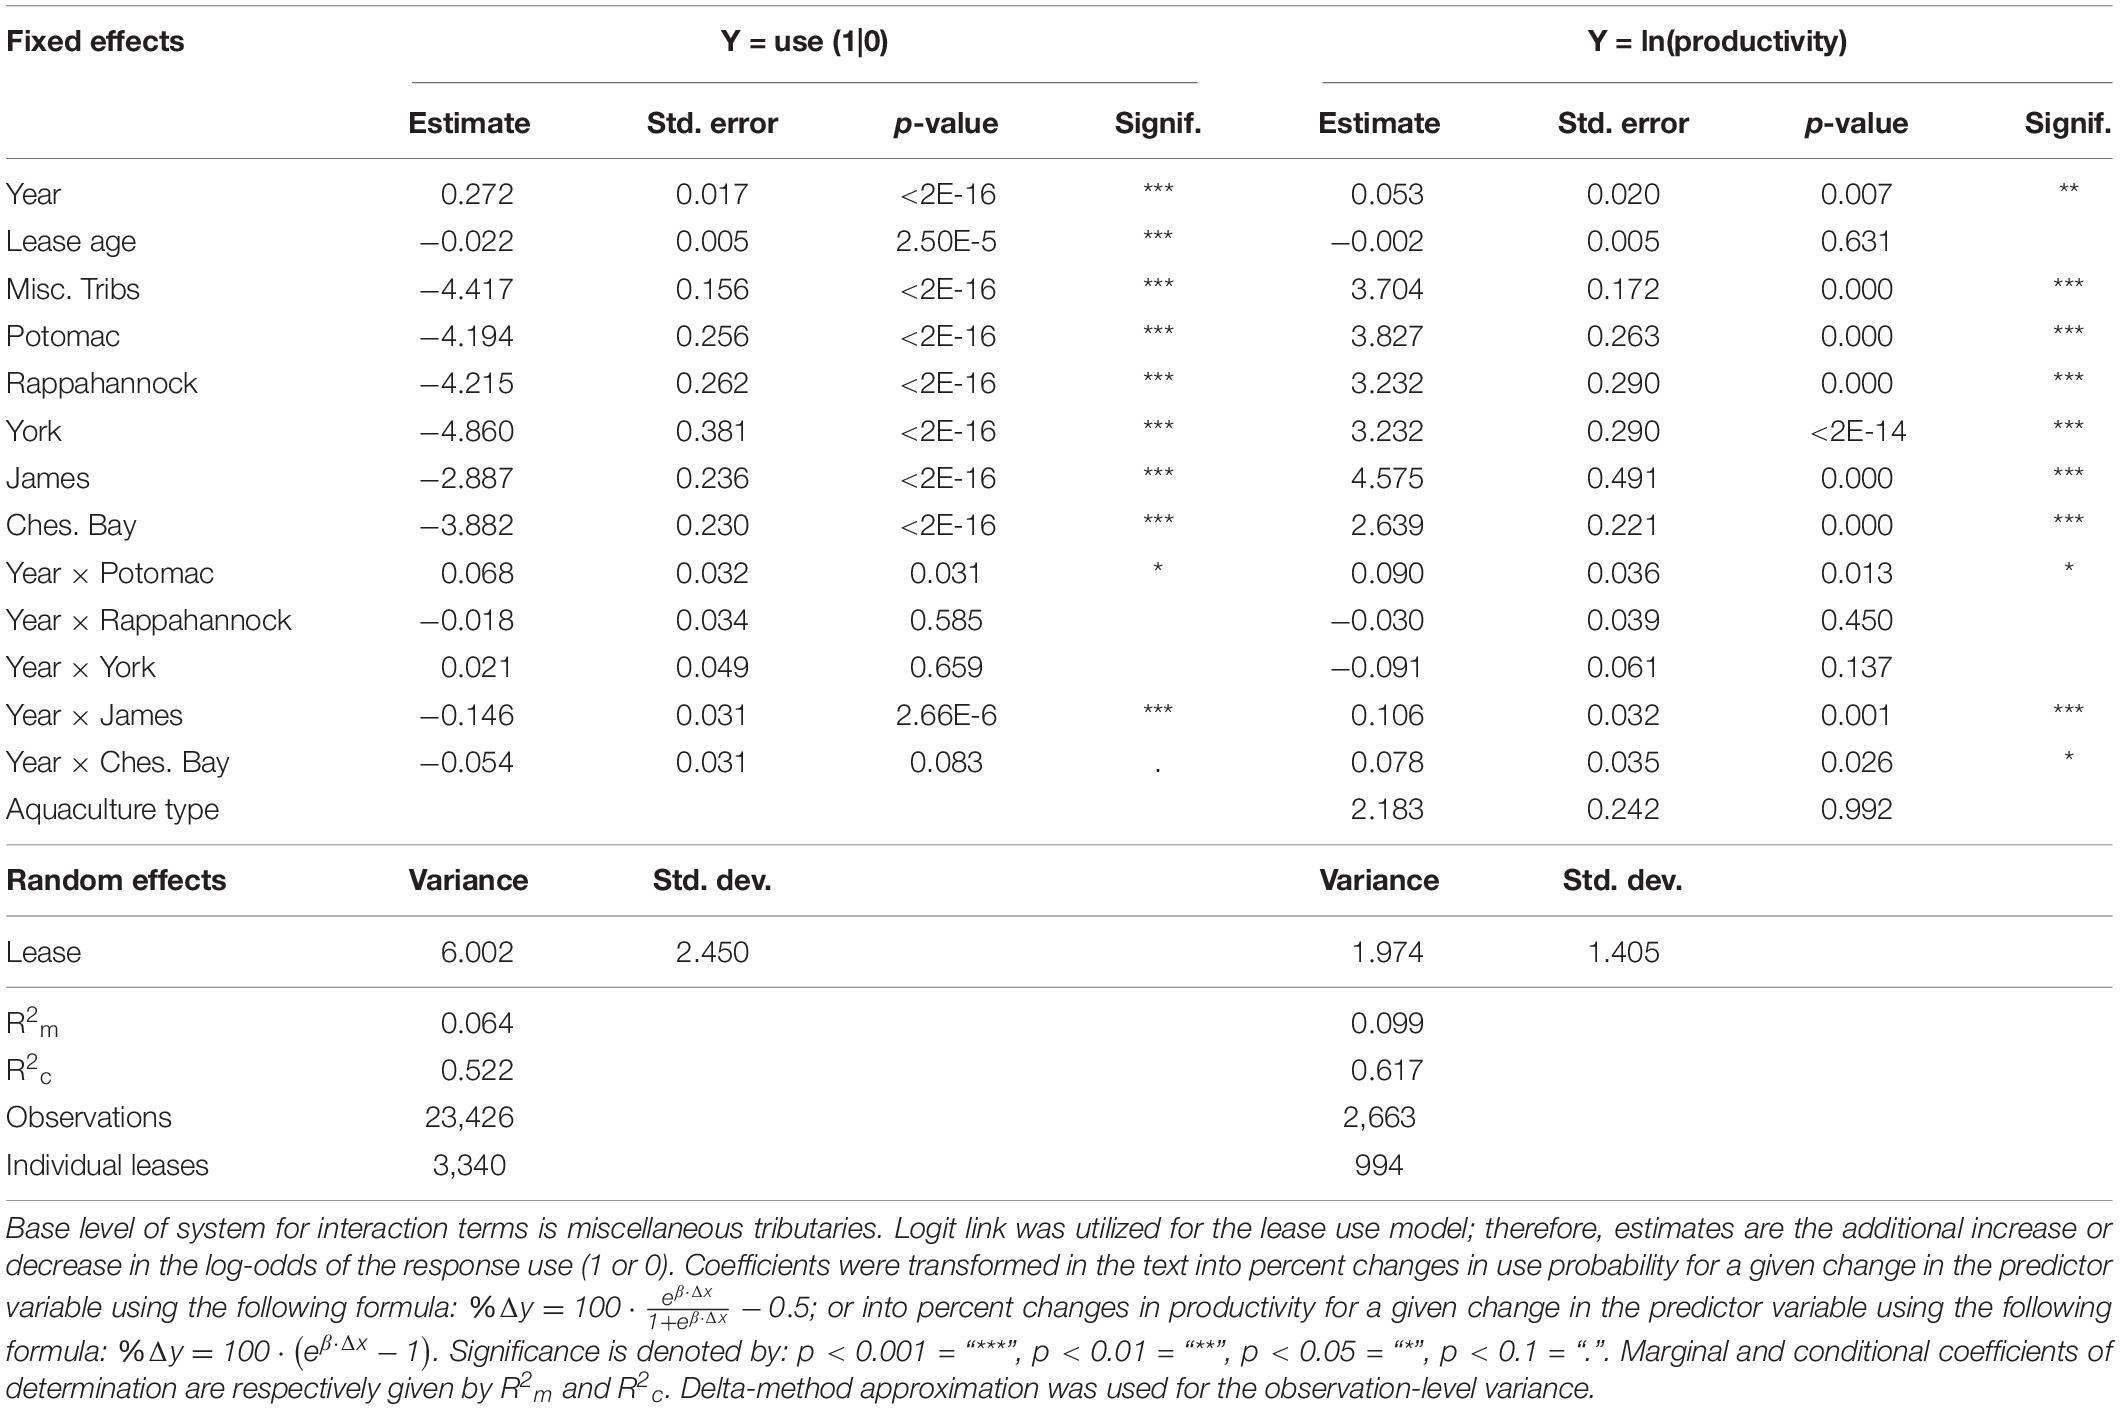
Table 3. Annual lease use and productivity per systems with leases as a random effect in a mixed effects model.
Average productivity per year, defined as the sum of oyster pounds harvested per unit area, fluctuated over time between 143.9 and 295.2 lbs/ac (Supplementary Figure S2B). Results from the linear mixed effects model of lease productivity indicated that system, year, and some interactions between year and system had significant effects on productivity in used leases. There was an increase of productivity of 5.44% per year in miscellaneous tributaries as well as the Rappahannock and York rivers (interactions between system and year were not significant, p > 0.05; Table 3). The Potomac and James rivers, as well as the mainstem of the Bay, had increases of productivity per year at rates threefold higher (∼15.37%, 17.23%, 14.00%, respectively, p < 0.05; note the large range of starting productivity values, Supplementary Figure S2B). Counterintuitively, lease age did not significantly affect productivity, nor did the type of aquaculture utilized for the harvest (Table 3).
Differences between conditional R2c and marginal R2m showed that 46% of variability in lease use, and 52% of variability in productivity, resulted from heterogeneity across leases (Table 3). When the same models were run with random effects for leases nested within leaseholders, similar results were observed in terms of coefficient estimates and their significance (results from this supplementary model are available upon request). The difference between R2c and R2m was slightly higher (e.g., 53.8% of variability in lease use, Supplementary Table S1), indicating that adding a leaseholder random effect only had a minor impact on unexplained variance (not particularly surprising as 40% of leaseholders only had one lease).
Comparison of Used and Non-used Leases
We investigated how several proxies for local economic, social, and environmental conditions differed between used and non-used leases (over the entire period 2006–2016). Interestingly, non-used leases tended to be smaller (Table 4 and Figure 7) and leaseholders with non-used leases tended to have fewer, or only one, lease (p-values < 0.05). Surprisingly, there was no difference in the distance to shore for used and non-used leases, though there was a significant difference between the variances of each group (variance was lower for non-used leases) (Table 4). Used leases tended to be slightly closer to leaseholder ZIP code (though the effect was not highly significant; p-value = 0.09) but there was greater variance in ZIP code distance for non-used leases. Non-used leases were more common, however, in more populated, high-income regions (p-values < 0.05; Table 4 and Figure 7). Variables related to speculation behavior exhibited significant and expected negative relationships with lease use; i.e., non-used leases tended to be obtained later or contributed to a higher cumulative leased area (p-values < 0.05, Table 4 and Figure 7). Thus, in light of this result, non-used leases tended to be younger (p-value < 0.05). Used leases were observed more in congested waters, or closer to Baylor grounds. Finally, environmental variables were also significantly different between used and non-used leases (e.g., median salinity in used leases was 12.52 ppt whereas it was 14.56 ppt in non-used leases). Surprisingly, lower salinities and greater depths were associated with higher rates of lease use. Lastly, non-used leases were found in close proximity to SAV. In summary, non-used leases were smaller, in less congested areas, obtained later on, in more populated, high-income regions, and in shallower and more saline waters.
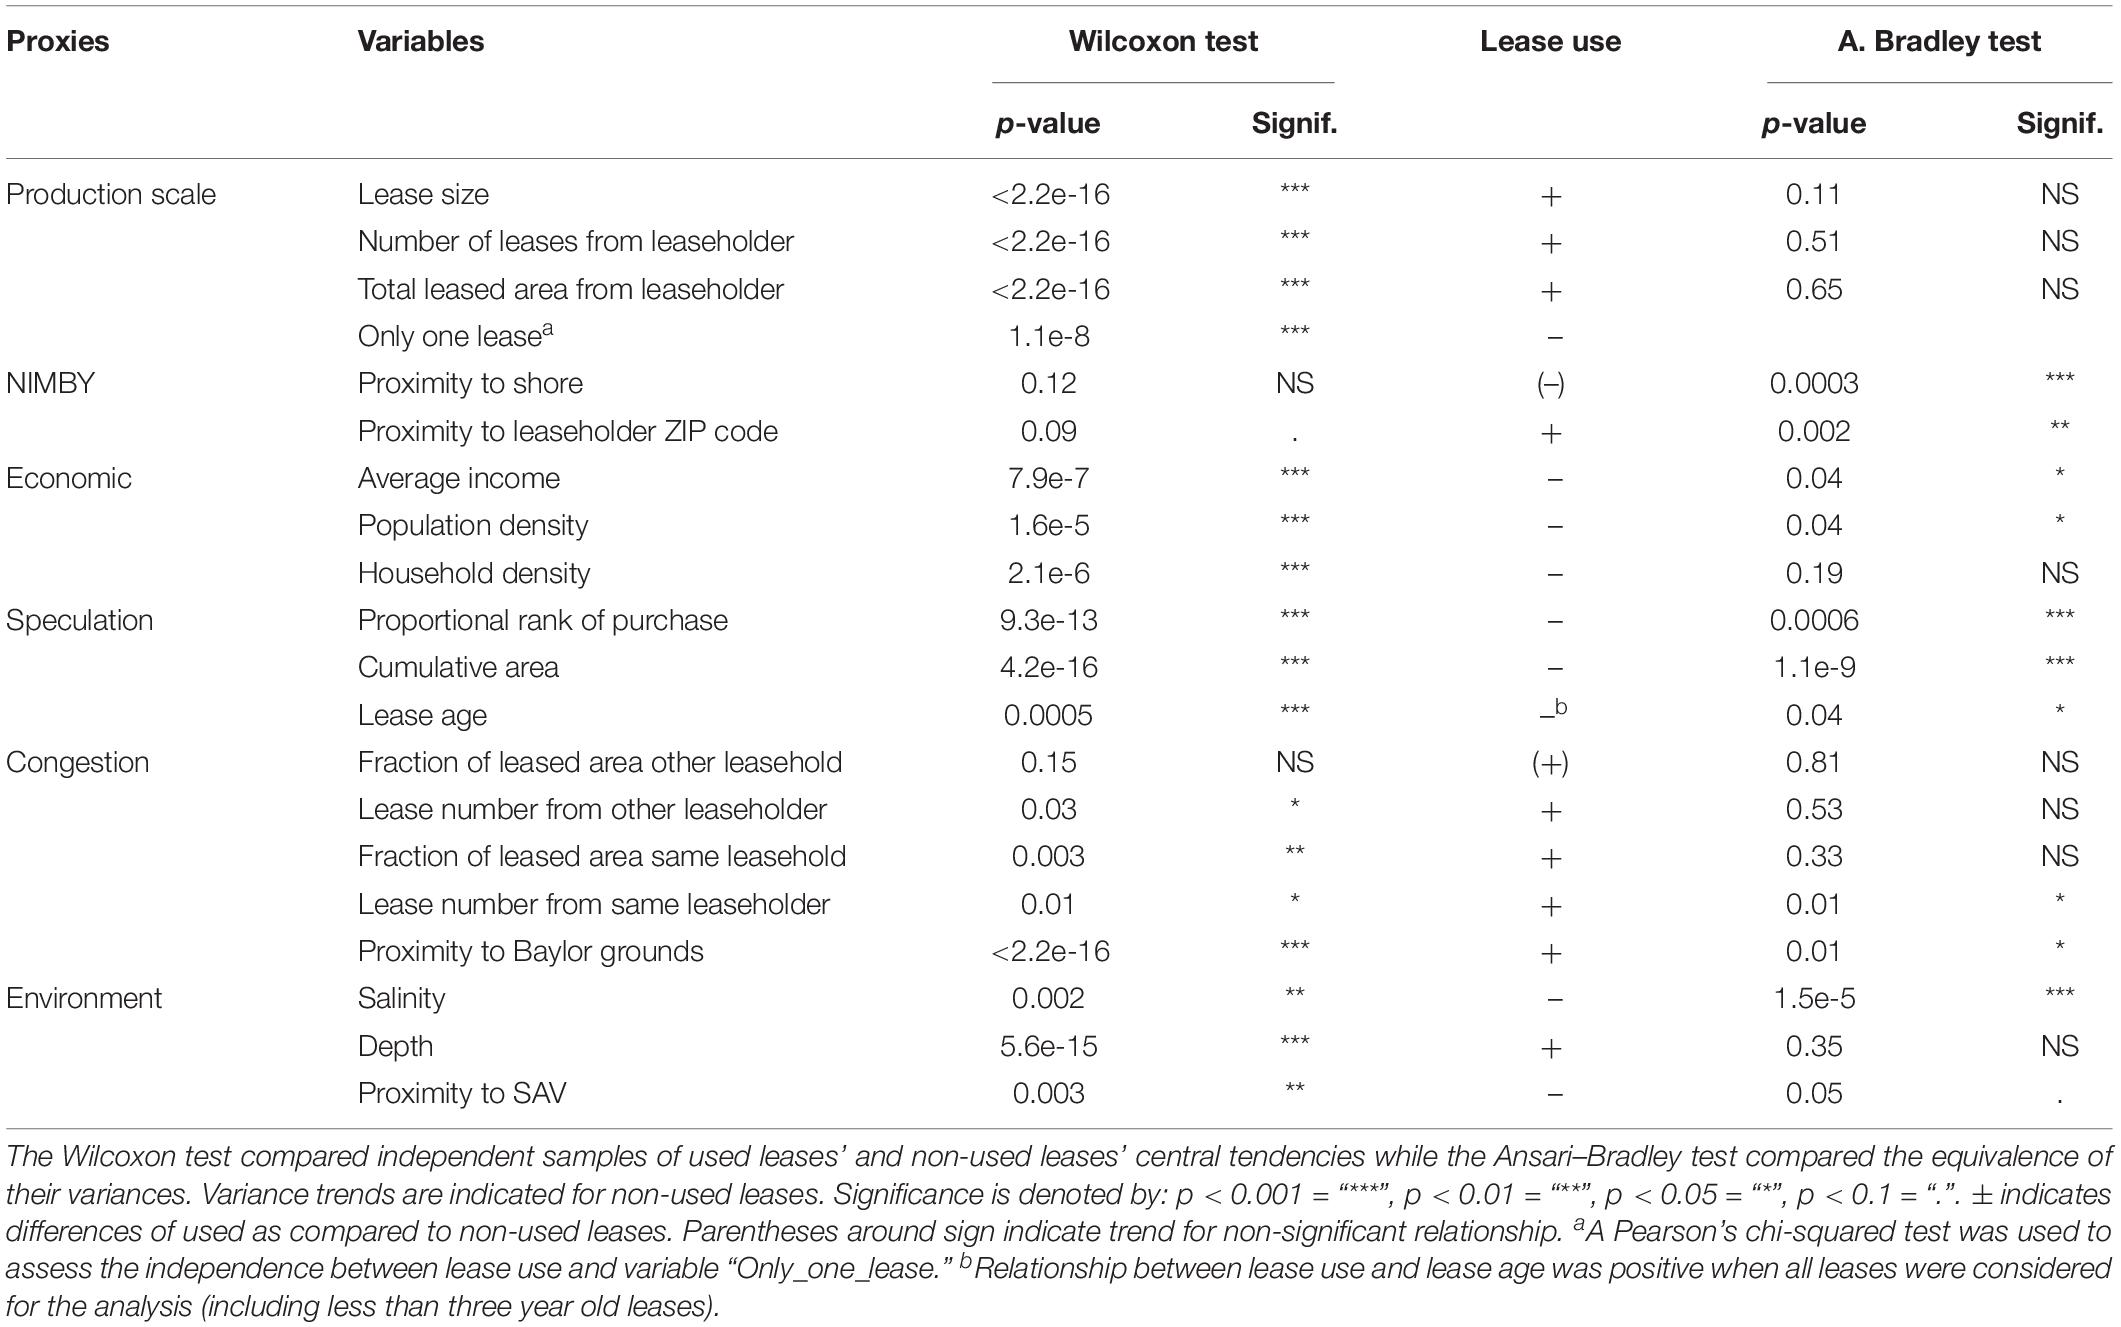
Table 4. Comparisons between used and non-used leases according to proxy variables related to either “Not in my backyard” attitude (NIMBY), economic, speculation, congestion, or environment conditions.
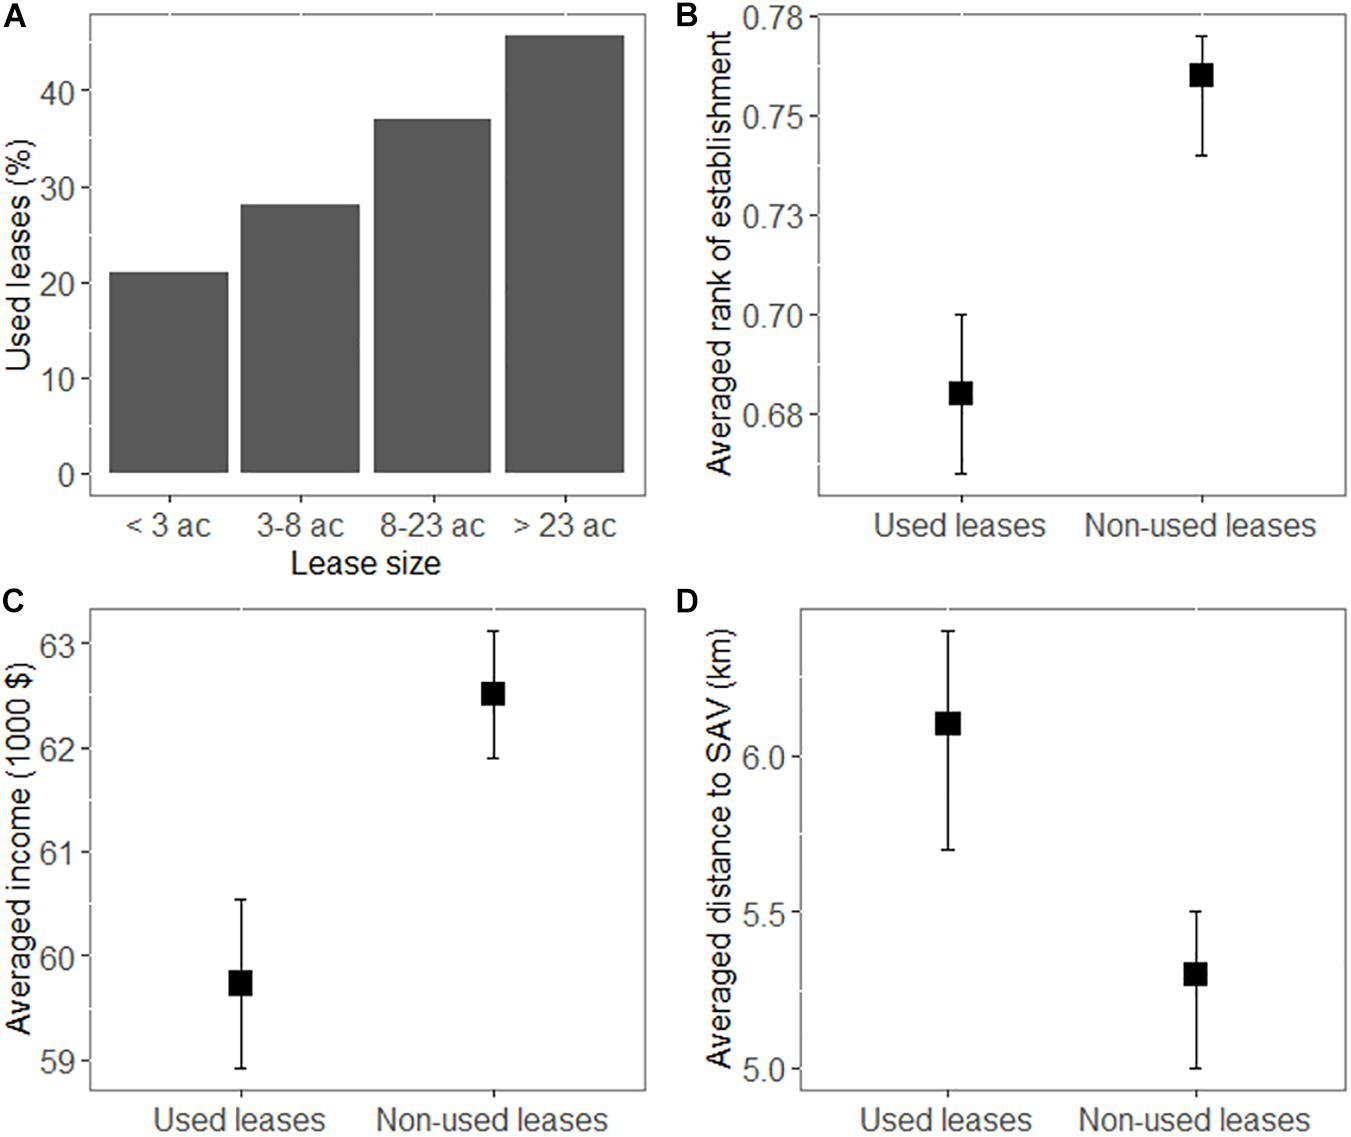
Figure 7. Used lease percentages according to lease size bins (A); differences between used leases and non-used leases in averaged proportional rank of purchase (B), per household income (C), and proximity to SAV (D). Proportional rank of purchase was calculated as the ratio of the rank of lease acquisition divided by the number of leases owned by the same leaseholder in a given year. Average household income was estimated as the total adjusted gross income for a ZIP code divided by the number of tax returns. Proximity to SAV was calculated as the distance between the nearest SAV bed polygon and a lease.
Lease Productivity Across U.S. East and Gulf Coast States
The number of leases and productivity (oysters pieces/acre) were highly variable between states of the U.S. East Coast and Gulf of Mexico (i.e., spanning two orders of magnitude, Table 5). Virginia was the third largest producer of oysters from private leases in 2017 (38,900,000 oysters) and had the second largest leased area (125,928 ac). However, the state recorded the second lowest productivity (309 oysters/ac, incorporating non-used leases; Table 5). Massachusetts had the highest production (47,849,698 oysters) and productivity (36,836 oysters/ac) while Louisiana and Connecticut, similarly to Virginia, were characterized by high production levels but low productivity per acre. The top-three states that recorded the highest level of productivity per acre had on average smaller leases (mean lease size of 5 ac) than the remaining states with lower productivities per acre (mean lease size of 24 ac).
Discussion
This research analyzed the trends and drivers in the burgeoning oyster aquaculture industry in Virginia on privately leased grounds of Chesapeake Bay. We sought to identify possible societal, regulatory, and spatial constraints on harvests of cultured oyster. The major contributions of this study are to examine spatial saturation levels with respect to leased oyster grounds in the lower Chesapeake Bay, analyze recent trends in lease use and productivity, contrast used and non-used leases, compare coast-wide lease productivity, and compile a unique dataset combining lease information, oyster production, socio-economic, and environment variables.
Despite the significant increase in leased area observed since the mid-2000s, we found weak evidence of spatial constraints on industry growth. Saturation of leasable areas with leases was not a major limitation, because leased areas continue to increase in most regions of the bay, with the notable exception of the relatively small portion of Virginia waters in the Potomac River. In 2016, 40–67% of theoretically leasable areas per system were occupied by oyster leases, which was 58% of overall leasable area across systems (when excluding the mainstem of the Chesapeake Bay). These estimates are likely conservative as some areas may not be optimal for certain types of aquaculture according to bottom type and current velocity. For example, though large areas of the mainstem of the Chesapeake Bay theoretically remain available for leasing (only about 10% of leasable areas in the mainstem are occupied by leases), those areas are generally far from shore, relatively deep, and heavily used for boat traffic, making them less attractive for leasing due to the added costs of dealing with these factors. This suggests that economic, as opposed to spatial, factors may be the primary limitation for expansion of oyster aquaculture into the mainstem of the bay. If this is the case, then reductions in costs associated with oyster aquaculture practices or increases in market demand could lead industry to expand into areas that are currently not economically viable.
From 2006 to 2016, only 33.4% of leases ever reported oyster production. Leaseholders owning multiple leases often operate in a rotational manner. This could partially explain low annual utilization rates, though this is unlikely to explain why a majority of leases remained not-used for the entire 11-year study period. Furthermore, we found only 36.8% of individual leaseholders were active during the same time period, indicating that other factors primarily drive lease non-use. It is possible that our estimate of the number of unique leaseholders is high given that multiple individual leaseholders may be associated with the same business entity, but it is difficult to imagine this would explain the > 60% of leases not reporting any harvest over an entire decade. Some leases that are not used for commercial production may be actively managed and yield benefits for oyster propagation or Bay conservation. Such beneficial use could include planting of shell for restoration purposes, water quality improvements, and shoreline protection. Our estimates did not consider these types of beneficial uses; however, state resource managers are currently working to refine their definition of use to include non-commercial activities (Office of the Secretary of Natural Resources, 2018).
Although the numbers of used leases per year were low, the probability of lease use and productivity per lease increased over years. The increased rate of use in the James River was lower than in other systems, likely due to higher use rates in earlier years of the analysis (∼21% of leases were used in the James in 2006, whereas less than 4% of leases were used in all other systems, Supplementary Figure S2A). The James River has historically supported, and continues to support, large public and private oyster fisheries, including public “seed beds” for collection of seed by private planters (Haven et al., 1981; Schulte, 2017). In the Potomac River, results from the saturation model suggest viable space for leasing has become scarce, which might have incentivized increased use of existing leases (which are smaller in this system, ∼16.8 ac, compared to ∼40 ac in the James or York Rivers). Interestingly, lease age significantly negatively affected the probability of lease use (older leases tended to be used slightly less) but did not affect lease productivity. The majority of variance explained in the mixed effects models of lease use and productivity was not related to broad spatial or temporal variables, but rather indicates considerable heterogeneity across leases and leaseholders. Therefore, lease use decisions and productivity appeared to be driven by local conditions that might vary across leases or leaseholders, but for which specific covariates were not included in the model.
The type of aquaculture (intensive or extensive) did not significantly affect productivity. Intensive aquaculture practices (cages, rack and bags, and floats) are used to raise a high density of oysters in a small area, and so it was expected that this type of aquaculture would exhibit higher productivity (lbs/ac) when compared to extensive, on-bottom practices. Conversely, productivity differences observed across states corresponded to typical aquaculture practices used in those states; e.g., it was generally lower in states with extensive culture (LA) and higher in states with more intensive culture (MA) (sources in Table 5). This difference was less evident in VA which has substantial levels of both practices. Negligible differences in productivity across aquaculture type in VA may be due to smaller portions of leases being used for intensive oyster production in an effort to reduce competition via a buffer zone.
There were clear differences between used and non-used leases in the central tendencies of nearly all economic, social, and environmental variables, though variances were generally similar. Variables related to speculation behavior, such as proportional rank of purchase, were found to differ significantly between used and non-used leases. This is consistent with leaseholders frequently buying more leased area than needed, perhaps due to the low cost of holding a lease. Leaseholders with only one small lease tended not to use it; these may be speculators or property owners. With the present data, the relationship between the age of a lease and its use was not obvious. Contrary to expectations, and similarly to what was found in the mixed model on lease use, non-used leases tended to be older. We further explored this effect by adding a dummy variable to the model that was 1 if the lease had any extensive harvest when the lease was younger than three years old. This variable had a negative impact on use (Supplementary Table S2), suggesting that some leaseholders may harvest those oysters present on the bottom at the time of lease establishment, only to later abandon production when these resources have been fully exploited. When a lease was surrounded by multiple leases from different leaseholders and/or closer to Baylor (public) grounds, they tended to be used more, suggesting that peer pressure, fear of encroachment, positive agglomeration effects, or possibly theft (from nearby leased or public grounds) could drive lease use. Alternatively, this could be an indication of good growing areas for oysters (e.g., high productivity, suitable substrate). Together, these findings indicate that differences were systematic and that individual motivations and interactions could affect lease use.
Though evidence supporting potential impacts of NIMBY attitudes was limited at the lease scale, it was more obvious at the community scale. Proximity to the shore and proximity to leaseholder home ZIP code were not significantly different between used and non-used leases. We used centroids of leaseholder ZIP codes as a proxy for distance, due to the high frequency of PO boxes in leaseholder addresses, which may have limited our ability to detect differences between used and non-used leases. There may also be compounding factors that prevented us from seeing the NIMBY effect occurring at small scales, such as the desire of harvesters to be close to their leases to facilitate surveillance against poaching and harvesting itself. Non-used leases were found to be in shallower areas, or nearby to SAV, possibly indicating close proximity to the shore (even though this variable was not significantly different between used and non-used leases). Despite limited evidence of NIMBY at the lease scale, non-used leases were found in more populated, high-income regions. We demonstrated weak evidence of possible NIMBY behavior, as correlated with factors others have suggested influence these attitudes (primarily income; Dear, 1992). NIMBY attitudes, or public opposition, has been often associated with fish farming that can cause negative impacts on the environment (e.g., fish waste products, water eutrophication, Katranidis et al., 2003; Whitmarsh and Palmieri, 2009). A few studies have documented public opposition toward shellfish aquaculture development through perception surveys of coastal homeowners (Shafer et al., 2010; D’Anna and Murray, 2015; Knapp and Rubino, 2016; Ryan et al., 2017). Negative esthetic features such as buoys, cages and lease boundary markers, pollution with gear debris, noise nuisance, hazards for recreational uses, and restriction of public access have all been recurring perceptions of shellfish aquaculture that could explain potential NIMBY attitudes in Virginia. One may fear that shellfish aquaculture externalities would diminish property values; however, such negative impacts are not evident (Evans et al., 2017; Ryan et al., 2017).
Community and stakeholder preferences could be evaluated in Virginia to better understand speculation and NIMBY attitudes (see D’Anna and Murray, 2015; Dalton et al., 2017; Ryan et al., 2017 for studies of preferences in other systems) and the positive benefits from shellfish aquaculture should be effectively communicated to increase social acceptance (Bricknell and Langston, 2013). Acceptance of sea-bream and sea bass aquaculture activities in Greece was greater when socioeconomic benefits were perceived by the community (Katranidis et al., 2003). Thus, it may be necessary to better communicate to Virginia’s local communities the annual economic impacts from oyster aquaculture, such as the creation of hundreds of jobs, and the farm gate value of $15.9 million generated in 2017 (Hudson, 2018). Additionally, by diminishing excess anthropogenic nutrients, shellfish aquaculture can reduce eutrophication and it was found that the total nitrogen load in the Potomac River would be removed if 40% of the river was used for oyster production (Bricker et al., 2014). For this blue economy8 sector to grow, environmental and socio-economic benefits need to be better communicated to local communities through, for example, the extension of local farmer markets (D’Anna and Murray, 2015) or the recently created Virginia Oyster Trail9. Acceptance can also be greater if stakeholders are more involved and their preferences incorporated in decision-making (Byron et al., 2011).
Virginia has the lowest lease rate in the country at $1.50/acre/year, unchanged since 1960. As of 2017, Virginia was the third largest producer of aquacultured oysters from private grounds on the East and Gulf Coast and had the largest total leased area on the East Coast. Nonetheless, when comparing across states, Virginia exhibited the second lowest spatial productivity. The larger leased area compared to other states possibly leads to increased conflicts and inefficiencies. Tensions between the industry and the public have increased substantially over the last few years, resulting in increased rates of lease protest (a lease may be protested during the application phase) (B. Stagg, VMRC, pers. comm.). Significant effects of NIMBY variables at the community level are concordant with recent public discussions of oyster leasing in Virginia. These disputes were perhaps most pronounced in the Lynnhaven River, where high-end real estate lines the shores of historically fertile oyster grounds. This conflict led a state senator from Lynnhaven to put forth a bill to increase the leasing rate from $1.50/acre/year to $5,000/acre/year. Though this proposal was ultimately withdrawn, it led to ongoing discussions between managers, industry, and the public regarding potential reforms to the leasing system to decrease underutilization by strengthening lease use enforcement or increasing leasing fees (e.g., by making it too costly to hold leases purely for speculation or esthetic reasons).
Half of the states compared in our study (CT, MA, ME, MS, NJ, VA) have subjective use, or substantial use, requirements (e.g., “State requires substantial use” in MA) for oyster production, while three (NC, MD, FL) have quantitative use requirements either in terms of annual planting or production (e.g., “Plant 25 bushels seed or 50 bushels cultch per acre; produce 10 bushels per acre” in NC, B. Stagg, VMRC, pers. comm.). In Virginia, the leaseholder has to provide an Oyster Lease Use Plan when applying for a new lease, then report monthly harvest to the Commission (Chapter 4 VAC 20-610-60). Although Virginia’s leases are technically “use it or lose it,” with a subjective use requirement, in practice fairly minimal evidence is required to demonstrate use, and enforcement mechanisms are largely absent (Beck et al., 2004). Historically, use has been hard to verify (Mason, 2008), especially given that leaseholders can claim the prevalence of the pathogens MSX and Dermo on their sites, impeding production, without having to provide proof of their presence. Maryland has, in recent years, implemented a strict “use it or lose it” policy that returned unproductive leases to the state, some of which were later leased by productive growers (Green and Tracy, 2013). Shellfish production in Maryland has since increased from about 5,000 bushels/year in 2009 to about 75,000 bushels/year by 2017. Virginia would likely benefit from a stricter “use it or lose it” policy or by setting annual quantitative production or investment requirements, such as a minimum number of bushels per leased acre or evidence of seed purchase by leaseholders. A newly formed sub-committee at VMRC, the Aquaculture Management Advisory Committee, is currently discussing stricter use requirements, while VMRC staff have begun using a standard of 1 bushel/acre/year as a minimum requirement. The Commission has also recently (2019) established a renewal fee ($150 per lease per 10 years, Chapter 4 VAC 20-1350-10 ET SEQ.), increased application and transfer fees (from $300 to $1,000 per lease, depending on lease size), and now has the authority to deny a transfer. These changes in fees should help ensure that leaseholders are committed to fully utilizing leased acreage. The commission also requested that oyster leases and active work areas be better defined and marked (Chapter 4 VAC 20-290-10 ET SEQ., 2016).
There is an urgent need for coastal spatial planning to ensure sustainable aquaculture development in the region (Sanchez-Jerez et al., 2016). Given evidence for the continuing expansion of leased areas, in combination with the finding that only ∼33% of leases being used for oyster production, and indications of NIMBY behavior at the community level, better zoning would balance working waterfronts, recreational areas, places of residence, and aquaculture spaces, thereby minimizing conflicting interactions between users and avoiding negative externalities (Aguilar-Manjarrez et al., 2017; Lombard et al., 2019). As part of this process, physical, ecological, and socio-economic criteria should be considered (Sanchez-Jerez et al., 2016; Evans et al., 2017). Despite the development of tools evaluating environmental and production carrying capacity, the use of these models combined with social-economic variables has been modest (Smaal and van Duren, 2019). In New Zealand, aquaculture can only be developed in Aquaculture Management Areas (AMAs; Shafer et al., 2010). There, Longdill et al. (2008) suggested, among many other suitability criteria, a 5 km buffer from the coast to reduce the potential for coastal homeowners to view aquaculture structures. The Aquaculture Vulnerability Model (AVM; Center for Coastal Resources Management [CCRM], 2015) was developed to assist shellfish growers in identifying locations where current conditions could support aquaculture operations in Virginia. However, this model uses only physical, biological, and landscape (dominant land use) attributes to evaluate area suitability and does not presently include socio-economic criteria. The model could be extended to accommodate potential social interactions and user conflicts (e.g., based on local population, lease congestion, and length of coastline adjacent to aquaculture activities). Coastal spatial planning processes in Virginia could follow a participatory approach to include local communities in addition to industry representatives, and could be supported by hearings to consider potential reforms to the leasing system (Byron et al., 2011; Sanchez-Jerez et al., 2016). The existing AVM is a unique tool used to assess biological suitability that was developed in a relatively data-rich environment. Use of aquaculture siting tools that incorporate both biological and socio-economic information should be considered in Virginia as well as other areas with expanding aquaculture sectors, especially where such data are readily available.
Conclusion
Given increasing populations, increasing seafood consumption per capita, and limited ability of wild stocks to produce substantially more, aquaculture production is expected to continue expanding (Duarte et al., 2009; Science Advice for Policy by European Academies [SAPEA], 2017; Wijsman et al., 2019). Demographic shifts leading to increased wealthy non-working (retired) individuals or vacationers in already crowded coastal regions will heighten barriers for coastal aquaculture development in the United States and elsewhere (Halpern et al., 2008; Gibbs, 2009). In Virginia, it is apparent from this study that there are numerous social inefficiencies and spatial conflicts regarding oyster private lease use. Whether they are due to NIMBY attitudes, speculation, or creation of buffer zones, these social attitudes and economic conditions appear to be associated with inefficiencies and non-use in the oyster aquaculture sector. Nevertheless, the precise mechanisms by which these socio-economic factors lead to lower productivity require further exploration in future research. Use rates and lease productivity are low in Virginia, both in absolute terms and relative to other states. With the lowest lease rates in the country, lengthy leasing periods, and poor enforcement, there is little cost to holding a lease and it is not surprising that 67% of leases went unused over the entire decade. This study is the first to quantitatively evaluate recent lease use and underutilization, including potential modulators of this behavior. Our findings recognize that social and institutional constraints may slow growth and exacerbate stakeholder conflicts while confirming that incentives matter in lease use decisions. There is potential room for growth in the oyster aquaculture industry if social constraints are reduced, existing leased areas are used more efficiently, and production expands into regions with low conflict and higher operational costs; e.g., the mainstem of Chesapeake Bay. To achieve this, utilization requirements should be enforced and strictly monitored, and zoning for aquaculture activity should be developed. Virginia’s long history of oyster production and mature leasing system may provide useful guidance to states in more nascent stages of development. For example, Rhode Island’s system is relatively new and Maryland has made several changes to its leasing system based on Virginia’s program (Green and Tracy, 2013). It is important that lessons are learnt from this system so that similar challenges and conflicts are reduced in Virginia and avoided in other regions.
Data Availability Statement
Non-confidential data aggregated by system will be made available by the authors, upon request. Currently leased grounds in Virginia are available publicly through the VMRC’s Chesapeake Bay Map (https://webapps.mrc.virginia.gov/public/maps/chesapeakebay_map.php) with information on type of lease, its assignment and termination dates, and the leaseholder’s name and mailing address.
Author Contributions
All authors developed research idea and models conception and revised and approved the final version. JB drafted the first version of the manuscript and analyzed the data. DK created and maintained the database.
Funding
This work was supported by the Virginia Sea Grant Graduate Research Fellowship (NA14OAR4170093 to JB), the Virginia Institute of Marine Science Foundation, the Tidewater Oyster Gardeners Association, and the Chateaubriand Fellowship of the Office for Science and Technology of the Embassy of France in the United States.
Conflict of Interest
The authors declare that the research was conducted in the absence of any commercial or financial relationships that could be construed as a potential conflict of interest.
Acknowledgments
The authors thank Ben Stagg (VMRC) and Karen Hudson (VIMS Marine Advisory services) for valuable conversations about the industry and help as outreach mentors. The authors are also grateful to Stephanie Iverson (VMRC) for providing fisheries data, Daniel Powel (VDH) for providing shellfish condemnation zones, and Marjy Friedrichs, Pierre St-Laurent, and Dave Wilcox (VIMS) for providing environmental data. The authors also thank J. Shields, the editor, and two reviewers for constructive criticisms on preliminary versions of the article. This is contribution No. 3874 of the Virginia Institute of Marine Science, William & Mary.
Supplementary Material
The Supplementary Material for this article can be found online at: https://www.frontiersin.org/articles/10.3389/fmars.2020.00053/full#supplementary-material
Footnotes
- ^ The authors chose to primarily use acres instead of squared kilometers given the ubiquity of this unit of measure in U.S. aquaculture management and industry.
- ^ https://webapps.mrc.virginia.gov/public/maps/chesapeakebay_map.php
- ^ ChesROMS-ECB data was only available for the 2003–2014 period.
- ^ https://www.irs.gov/statistics/soi-tax-stats-individual-income-tax-statistics-zip-code-data-soi
- ^ Leases less than 1/2 acre for non-commercial oyster gardening.
- ^ Oysters collected by hand were also considered extensive aquaculture.
- ^ https://postgis.net/docs/Geocode.html
- ^ Blue economy is “the sustainable use of the ocean resources for economic growth, improved livelihoods, and jobs while preserving health of ocean ecosystem” (Silver et al., 2015).
- ^ http://virginiaoystertrail.com
References
Agnello, R. J., and Donnelley, L. P. (1975). Property rights and efficiency in the oyster industry. J. Law Econ. 18, 521–533. doi: 10.1086/466821
Aguilar-Manjarrez, J., Soto, D., and Brummett, R. (2017). Aquaculture Zoning, Site Selection and Area Management Under the Ecosystem Approach to Aquaculture. A Handbook. Report ACS18071. Rome: FAO.
Alford, J. J. (1973). The role of management in Chesapeake oyster production. Geograph. Rev. 63, 44–54.
Alleway, H. K., Gillies, C. L., Bishop, M. J., Gentry, R. R., Theuerkauf, S. J., and Jones, R. (2019). The ecosystem services of marine aquaculture: valuing benefits to people and nature. Bioscience 69, 59–68. doi: 10.1093/biosci/biy137
Ansari, A. R., and Bradley, R. A. (1960). Rank-sum tests for dispersions. Annof Math. Statist. 31, 1174–1189. doi: 10.1214/aoms/1177705688
Bates, D., Mächler, M., Bolker, B., and Walker, S. (2015). Fitting linear mixed-effects models using lme4. J. Statist. Softw. 67, 1–48.
Beck, M. W., Brumbaugh, R. D., Airoldi, L., Carranza, A., Coen, L. D., Crawford, C., et al. (2011). Oyster reefs at risk and recommendations for conservation, restoration, and management. Bioscience 61, 107–116. doi: 10.1525/bio.2011.61.2.5
Beck, M. W., Marsh, T. D., Reisewitz, S. E., and Bortman, M. L. (2004). New tools for marine conservation: the leasing and ownership of submerged lands. Conserv. Biol. 18, 1214–1223. doi: 10.1111/j.1523-1739.2004.00230.x
Bosch, D., Kuminoff, N., Stephenson, K., Miller, A., Pope, J., and Harris, A. (2010). Evaluation of policy options for expanding oyster aquaculture in Virginia. Aquacult. Econ. Manag. 14, 145–163. doi: 10.1080/13657301003776698
Bricker, S. B., Rice, K. C., and Bricker, O. P. (2014). From headwaters to coast: influence of human activities on water quality of the Potomac River estuary. Aquat. Geochem. 20, 291–323. doi: 10.1007/s10498-014-9226-y
Bricknell, I., and Langston, A. (2013). Aquaculture: it is not all about Atlantic salmon. J. Fish. Livestock Product. 1:e103.
Byron, C., Bengtson, D., Costa-Pierce, B., and Calanni, J. (2011). Integrating science into management: ecological carrying capacity of bivalve shellfish aquaculture. Marine Policy 35, 363–370. doi: 10.1016/j.marpol.2010.10.016
Carlozo, N. (2014). Integrating Water Quality and Coastal Resources Into Marine Spatial Planning in the Chesapeake and Atlantic Coastal Bays. Report no. 8192014–724 Annapolis, MD: Maryland Department of Natural Resources.
Center for Coastal Resources Management [CCRM], (2015). Aquaculture Vulnerability Model, V3. Gloucester Point, VA: Virginia Institute of Marine Science.
Chesapeake Bay Program, (2017). Population Growth. Available at https://www.chesapeakebay.net/issues/population_growth (accessed September 02, 2019).
Coen, L. D., Brumbaugh, R. D., Bushek, D., Grizzle, R., Luckenbach, M. W., Posey, M. H., et al. (2007). Ecosystem services related to oyster restoration. Mar. Ecol. Prog. Ser. 341, 303–307. doi: 10.3354/meps341303
Dalton, T., Jin, D., Thompson, R., and Katzanek, A. (2017). Using normative evaluations to plan for and manage shellfish aquaculture development in Rhode Island coastal waters. Mar. Policy 83, 194–203. doi: 10.1016/j.marpol.2017.06.010
D’Anna, L., and Murray, G. (2015). Perceptions of shellfish aquaculture in British Columbia and implications for well-being in marine social-ecological systems. Ecol. Soc. 20:57. doi: 10.5751/ES-07319-200157
Dear, M. (1992). Understanding and overcoming the NIMBY syndrome. J. Am. Plan. Assoc. 58, 288–300. doi: 10.1080/01944369208975808
Duarte, C. M., Holmer, M., Olsen, Y., Soto, D., Marbà, N., Guiu, J., et al. (2009). Will the oceans help feed humanity? Bioscience 59, 967–976. doi: 10.1525/bio.2009.59.11.8
Evans, K. S., Chen, X., and Robichaud, C. A. (2017). A hedonic analysis of the impact of marine aquaculture on coastal housing prices in Maine. Agric. Resour. Econ. Rev. 46, 242–267. doi: 10.1017/age.2017.19
FAO (2018). The State of World Fisheries and Aquaculture 2018 - Meeting the Sustainable Development Goals. Rome: FAO, 227. Available at: http://www.fao.org/3/i9540en/i9540en.pdf
Feng, Y., Friedrichs, M. A. M., Wilkin, J., Tian, H., Yang, Q., Hofmann, E. E., et al. (2015). Chesapeake Bay nitrogen fluxes derived from a land-estuarine ocean biogeochemical modeling system: model description, evaluation, and nitrogen budgets. J. Geophys. Res.Biogeosci. 120:2015JG002931.
Ferrari, S., and Cribari-Neto, F. (2004). Beta regression for modelling rates and proportions. J. Appl. Statist. 31, 799–815. doi: 10.1080/0266476042000214501
Frank-Lawale, A. Jr., Allen, S. K., and Dégremont, L. (2014). Breeding and domestication of eastern oyster (Crassostrea virginica) lines for culture in the mid-Atlantic, USA: line development and mass selection for disease resistance. J. Shellfish Res. 33, 153–165. doi: 10.2983/035.033.0115
Froehlich, H. E., Gentry, R. R., Rust, M. B., Grimm, D., and Halpern, B. S. (2017). Public perceptions of aquaculture: evaluating spatiotemporal patterns of sentiment around the world. PLoS One 12:e0169281. doi: 10.1371/journal.pone.0169281
Gibbs, M. T. (2009). Implementation barriers to establishing a sustainable coastal aquaculture sector. Mar. Policy 33, 83–89. doi: 10.1016/j.marpol.2008.04.004
Grabowski, J. H., and Peterson, C. H. (2007). “Restoring oyster reefs to recover ecosystem services,” in Ecosystem Engineers: Plants to Protists, eds K. Cuddington, J. E. Byers, W. G. Wilson, and A. Hastings (Cambridge, MA: Academic Press), 281–298. doi: 10.1016/s1875-306x(07)80017-7
Green, C. M., and Tracy, T. P. (2013). Fostering Shellfish Aquaculture Production in Maryland and Other States. Annapolis, MD: Department Of Legislative Services.
Halpern, B. S., Walbridge, S., Selkoe, K. A., Kappel, C. V., Micheli, F., D’Agrosa, C., et al. (2008). A Global map of human impact on marine ecosystems. Science 319, 948–952.
Harding, J. M. (2007). Comparison of growth rates between diploid DEBY eastern oysters (Crassostrea virginica, Gmelin 1791), triploid eastern oysters, and triploid Suminoe oysters (C. Ariakensis, Fugita 1913). J. Shellfish Res. 26, 961–972. doi: 10.2983/0730-8000(2007)26%5B961:cogrbd%5D2.0.co;2
Haven, D. S., Hargis, W. J. Jr., and Kendall, P. C. (1978). The Oyster Industry of Virginia: Its Status, Problems, and Promise. Special Papers in Marine Science, No. 4. Virginia Institute of Marine Science. Available at: http://www.vims.edu/GreyLit/VIMS/spms004.pdf
Haven, D. S., Whitcomb, J. P., and Kendall, P. (1981). The present and potential productivity of the baylor grounds in virginia volume I: rappahannock, corrotoman, great wicomico, piankatank, york and poquoson rivers, and mobjack bay and its tributaries. Appl. Mar. Sci. Ocean Eng. 243:154.
Hudson, K. (2018). Virginia Shellfish Aquaculture Situation and Outlook Report - Results of the 2017 Virginia Shellfish Aquaculture Crop Reporting Survey. Available at: https://www.vims.edu/research/units/centerspartners/map/aquaculture/docs_aqua/vims_mrr_2018-9.pdf (accessed February 21, 2018).
Ingersoll, E. (1881). The History and Present Conditions of the Fisheries Industries: The Oyster Industry. Washington, D.C: US Commission of Fish and Fisheries.
Inglis, G. J., Hayden, B. J., and Ross, A. H. (2000). An Overview of Factors Affecting the Carrying Capacity of Coastal Embayments for Mussel Culture. Auckland: National Institute of Water & Atmospheric Research.
Kapetsky, J. M., Aguilar-Manjarrez, J., and Jenness, J. (2013). A Global Assessment of Offshore Mariculture Potential From a Spatial Perspective. Rome: FAO.
Katranidis, S., Nitsi, E., and Vakrou, A. (2003). Social acceptability of aquaculture development in coastal areas: the case of two Greek islands. Coast. Manag. 31, 37–53. doi: 10.1080/08920750390168291
Keiner, C. (2009). The Oyster Question: Scientists, Watermen, and the Maryland Chesapeake Bay since 1880. Athens: University of Georgia Press.
Kennedy, V. S. (2018). Shifting Baselines in the Chesapeake Bay: an Environmental History. Baltimore, MA: Johns Hopkins University Press.
Kirby, M. X. (2004). Fishing down the coast: historical expansion and collapse of oyster fisheries along continental margins. Proc. Natl. Acad. Sci. U.S.A. 101, 13096–13099. doi: 10.1073/pnas.0405150101
Knapp, G. (2012). The political economics of United States marine aquaculture. Bull. Fish. Res. Agency 35, 51–63.
Knapp, G., and Rubino, M. C. (2016). The political economics of marine aquaculture in the United States. Rev. Fish. Sci. Aquacul. 24, 213–229. doi: 10.1080/23308249.2015.1121202
Lombard, A. T., Ban, N. C., Smith, J. L., Lester, S. E., Sink, K. J., Wood, S. A., et al. (2019). Practical approaches and advances in spatial tools to achieve multi-objective marine spatial planning. Front. Mar. Sci. 6:166. doi: 10.3389/fmars.2019.00166
Longdill, P. C., Healy, T. R., and Black, K. P. (2008). An integrated GIS approach for sustainable aquaculture management area site selection. Ocean Coast. Manag. 51, 612–624. doi: 10.1016/j.ocecoaman.2008.06.010
Mann, H. B., and Whitney, D. R. (1947). On a test of whether one of two random variables is stochastically larger than the other. Ann. Math. Statist. 18, 50–60. doi: 10.1214/aoms/1177730491
Mason, P. (2008). Identification of Management Strategies for Promoting Aquaculture in Virginia. Report to the Virginia Coastal Zone Management Program. Gloucester Point, VA: Virginia Institute of Marine Sciences.
Mullahy, J. (1986). Specification and testing of some modified count data models. J. Econ. 33, 341–365. doi: 10.1016/0304-4076(86)90002-3
Murray, T. J., and Hudson, K. (2015). Virginia Shellfish Aquaculture Situation And Outlook Report: Results of the 2014 Virginia Shellfish Aquaculture Crop Reporting Survey. VIMS Marine Resource Report No. 2013-02. Gloucester Point, VA: Virginia Institute of Marine Science.
Nakagawa, S., and Schielzeth, H. (2013). A general and simple method for obtaining R2 from generalized linear mixed-effects models. Methods Ecol. Evol. 4, 133–142. doi: 10.1093/sysbio/syy060
National Centers for Environmental Information, (2017). NOAA NOS Estuarine Bathymetry Chesapeake Bay (M130). National Centers for Environmental Information. Silver Spring, MA: NOAA.
Naylor, R. L., Goldburg, R. J., Mooney, H., Beveridge, M., Clay, J., Folke, C., et al. (1998). Nature’s subsidies to shrimp and salmon farming. Science 282, 883–884. doi: 10.1126/science.282.5390.883
Office of the Secretary of Natural Resources, (2018). Clam and Oyster Aquaculture Work Group - Report of the Work Group’s Deliberations and Recommendations to Address Aquaculture use Conflicts. Richmond, VA: Office of the Secretary of Natural Resources.
Paolisso, M., and Dery, N. (2010). A cultural model assessment of oyster restoration alternatives for the Chesapeake Bay. Hum. Organ. 69, 169–179. doi: 10.17730/humo.69.2.k1p4770551884604
Patrick, C., and Weller, D. (2015). Inter-annual variation in submerged aquatic vegetation and its relationship to water quality in sub-estuaries of Chesapeake Bay. Mar. Ecol. Prog. Ser. 537, 121–135. doi: 10.3354/meps11412
R Core Team, (2018). R: A Language and Environment for Statistical Computing. Vienna: R Foundation for Statistical Computing.
Ray, N. E., Maguire, T. J., Al-Haj, A. N., Henning, M. C., and Fulweiler, R. W. (2019). Low greenhouse gas emissions from oyster aquaculture. Environ. Sci. Technol. 53, 9118–9127. doi: 10.1021/acs.est.9b02965
Rothschild, B., Ault, J., Goulletquer, P., and Héral, M. (1994). Decline of the chesapeake bay oyster population: a century of habitat destruction and overfishing. Mar. Ecol. Prog. Ser. 111, 29–39. doi: 10.3354/meps111029
Ryan, C. M., McDonald, P. S., Feinberg, D. S., Hall, L. W., Hamerly, J. G., and Wright, C. W. (2017). Digging deep: managing social and policy dimensions of geoduck aquaculture conflict in Puget Sound, Washington. Coast. Manag. 45, 73–89. doi: 10.1080/08920753.2017.1252628
Sanchez-Jerez, P., Karakassis, I., Massa, F., Fezzardi, D., Aguilar-Manjarrez, J., Soto, D., et al. (2016). Aquaculture’s struggle for space: the need for coastal spatial planning and the potential benefits of Allocated Zones for Aquaculture (AZAs) to avoid conflict and promote sustainability. Aquacult. Environ. Inter. 8, 41–54. doi: 10.3354/aei00161
Santopietro, G. D., and Shabman, L. A. (1992). Can privatization be inefficient? The case of the Chesapeake Bay oyster fishery. J. Econ. Issues 26, 407–419. doi: 10.1080/00213624.1992.11505300
Schulte, D. M. (2017). History of the Virginia oyster fishery, Chesapeake Bay, USA. Front. Mar. Sci. 4:127. doi: 10.3389/fmars.2017.00127
Science Advice for Policy by European Academies [SAPEA] (2017). Food From the Oceans: How Can More Food and Biomass be Obtained From the Oceans in a Way that Does not Deprive Future Generations of Their Benefits? Berlin: SAPEA.
Shafer, C. S., Inglis, G. J., and Martin, V. (2010). Examining residents’ proximity, recreational use, and perceptions regarding proposed aquaculture development. Coast. Manag. 38, 559–574. doi: 10.1080/08920753.2010.511700
Shumway, S. E. (2011). Shellfish Aquaculture and the Environment. Hoboken, NJ: John Wiley & Sons, Inc.
Silver, J. J., Gray, N. J., Campbell, L. M., Fairbanks, L. W., and Gruby, R. L. (2015). Blue economy and competing discourses in international oceans governance. J. Environ. Dev. 24, 135–160. doi: 10.1177/1070496515580797
Smaal, A. C., and van Duren, L. A. (2019). “Bivalve aquaculture carrying capacity: concepts and assessment tools,” in Goods and Services Of Marine Bivalves, eds A. C. Smaal, J. G. Ferreira, J. Grant, J. K. Petersen, and O. Strand (Cham: Springer International Publishing), 451–483. doi: 10.1007/978-3-319-96776-9_23
Thayer, G. W., Wolfe, D. A., and Williams, R. B. (1975). The impact of man on seagrass systems: seagrasses must be considered in terms of their interaction with the other sources of primary production that support the estuarine trophic structure before their significance can be fully appreciated. Am. Sci. 63, 288–296.
Theuerkauf, S. J., and Lipcius, R. N. (2016). Quantitative validation of a habitat suitability index for oyster restoration. Front. Mar. Sci. 3:64. doi: 10.3389/fmars.2016.00064
Wagner, E., Dumbauld, B., Hacker, S., Trimble, A., Wisehart, L., and Ruesink, J. (2012). Density-dependent effects of an introduced oyster, Crassostrea gigas, on a native intertidal seagrass, Zostera marina. Mar. Ecol. Prog. Ser. 468, 149–160. doi: 10.3354/meps09952
Whitmarsh, D., and Palmieri, M. G. (2008). “Aquaculture in the coastal zone: pressures, interactions and externalities,” in Aquaculture in the Ecosystem, eds M. Holmer, K. Black, C. M. Duarte, N. Marbà, and I. Karakassis (Dordrecht: Springer).
Whitmarsh, D., and Palmieri, M. G. (2009). Social acceptability of marine aquaculture: the use of survey-based methods for eliciting public and stakeholder preferences. Mar. Policy 33, 452–457. doi: 10.1016/j.marpol.2008.10.003
Wijsman, J. W. M., Troost, K., Fang, J., and Roncarati, A. (2019). “Global production of marine bivalves. trends and challenges,” in Goods and services of marine bivalves, eds A. C. Smaal, J. G. Ferreira, J. Grant, J. K. Petersen, and O. Strand (Cham: Springer International Publishing), 7–26. doi: 10.1007/978-3-319-96776-9_2
Keywords: Crassostrea virginica, oyster aquaculture, Chesapeake Bay, spatial management, user conflicts
Citation: Beckensteiner J, Kaplan DM and Scheld AM (2020) Barriers to Eastern Oyster Aquaculture Expansion in Virginia. Front. Mar. Sci. 7:53. doi: 10.3389/fmars.2020.00053
Received: 17 October 2019; Accepted: 27 January 2020;
Published: 03 March 2020.
Edited by:
Richard Burroughs, The University of Rhode Island, United StatesReviewed by:
Christian T. K.-H. Stadtlander, Independent Researcher, Saint Paul, United StatesJulie Rose, Northeast Fisheries Science Center (NOAA), United States
Copyright © 2020 Beckensteiner, Kaplan and Scheld. This is an open-access article distributed under the terms of the Creative Commons Attribution License (CC BY). The use, distribution or reproduction in other forums is permitted, provided the original author(s) and the copyright owner(s) are credited and that the original publication in this journal is cited, in accordance with accepted academic practice. No use, distribution or reproduction is permitted which does not comply with these terms.
*Correspondence: Jennifer Beckensteiner, jennifer.beckensteiner@gmail.com