Mechanistic Morphogenesis of Organo-Sedimentary Structures Growing Under Geochemically Stressed Conditions: Keystone to Proving the Biogenicity of Some Archaean Stromatolites?

 ,
, 
Abstract
:1. Introduction
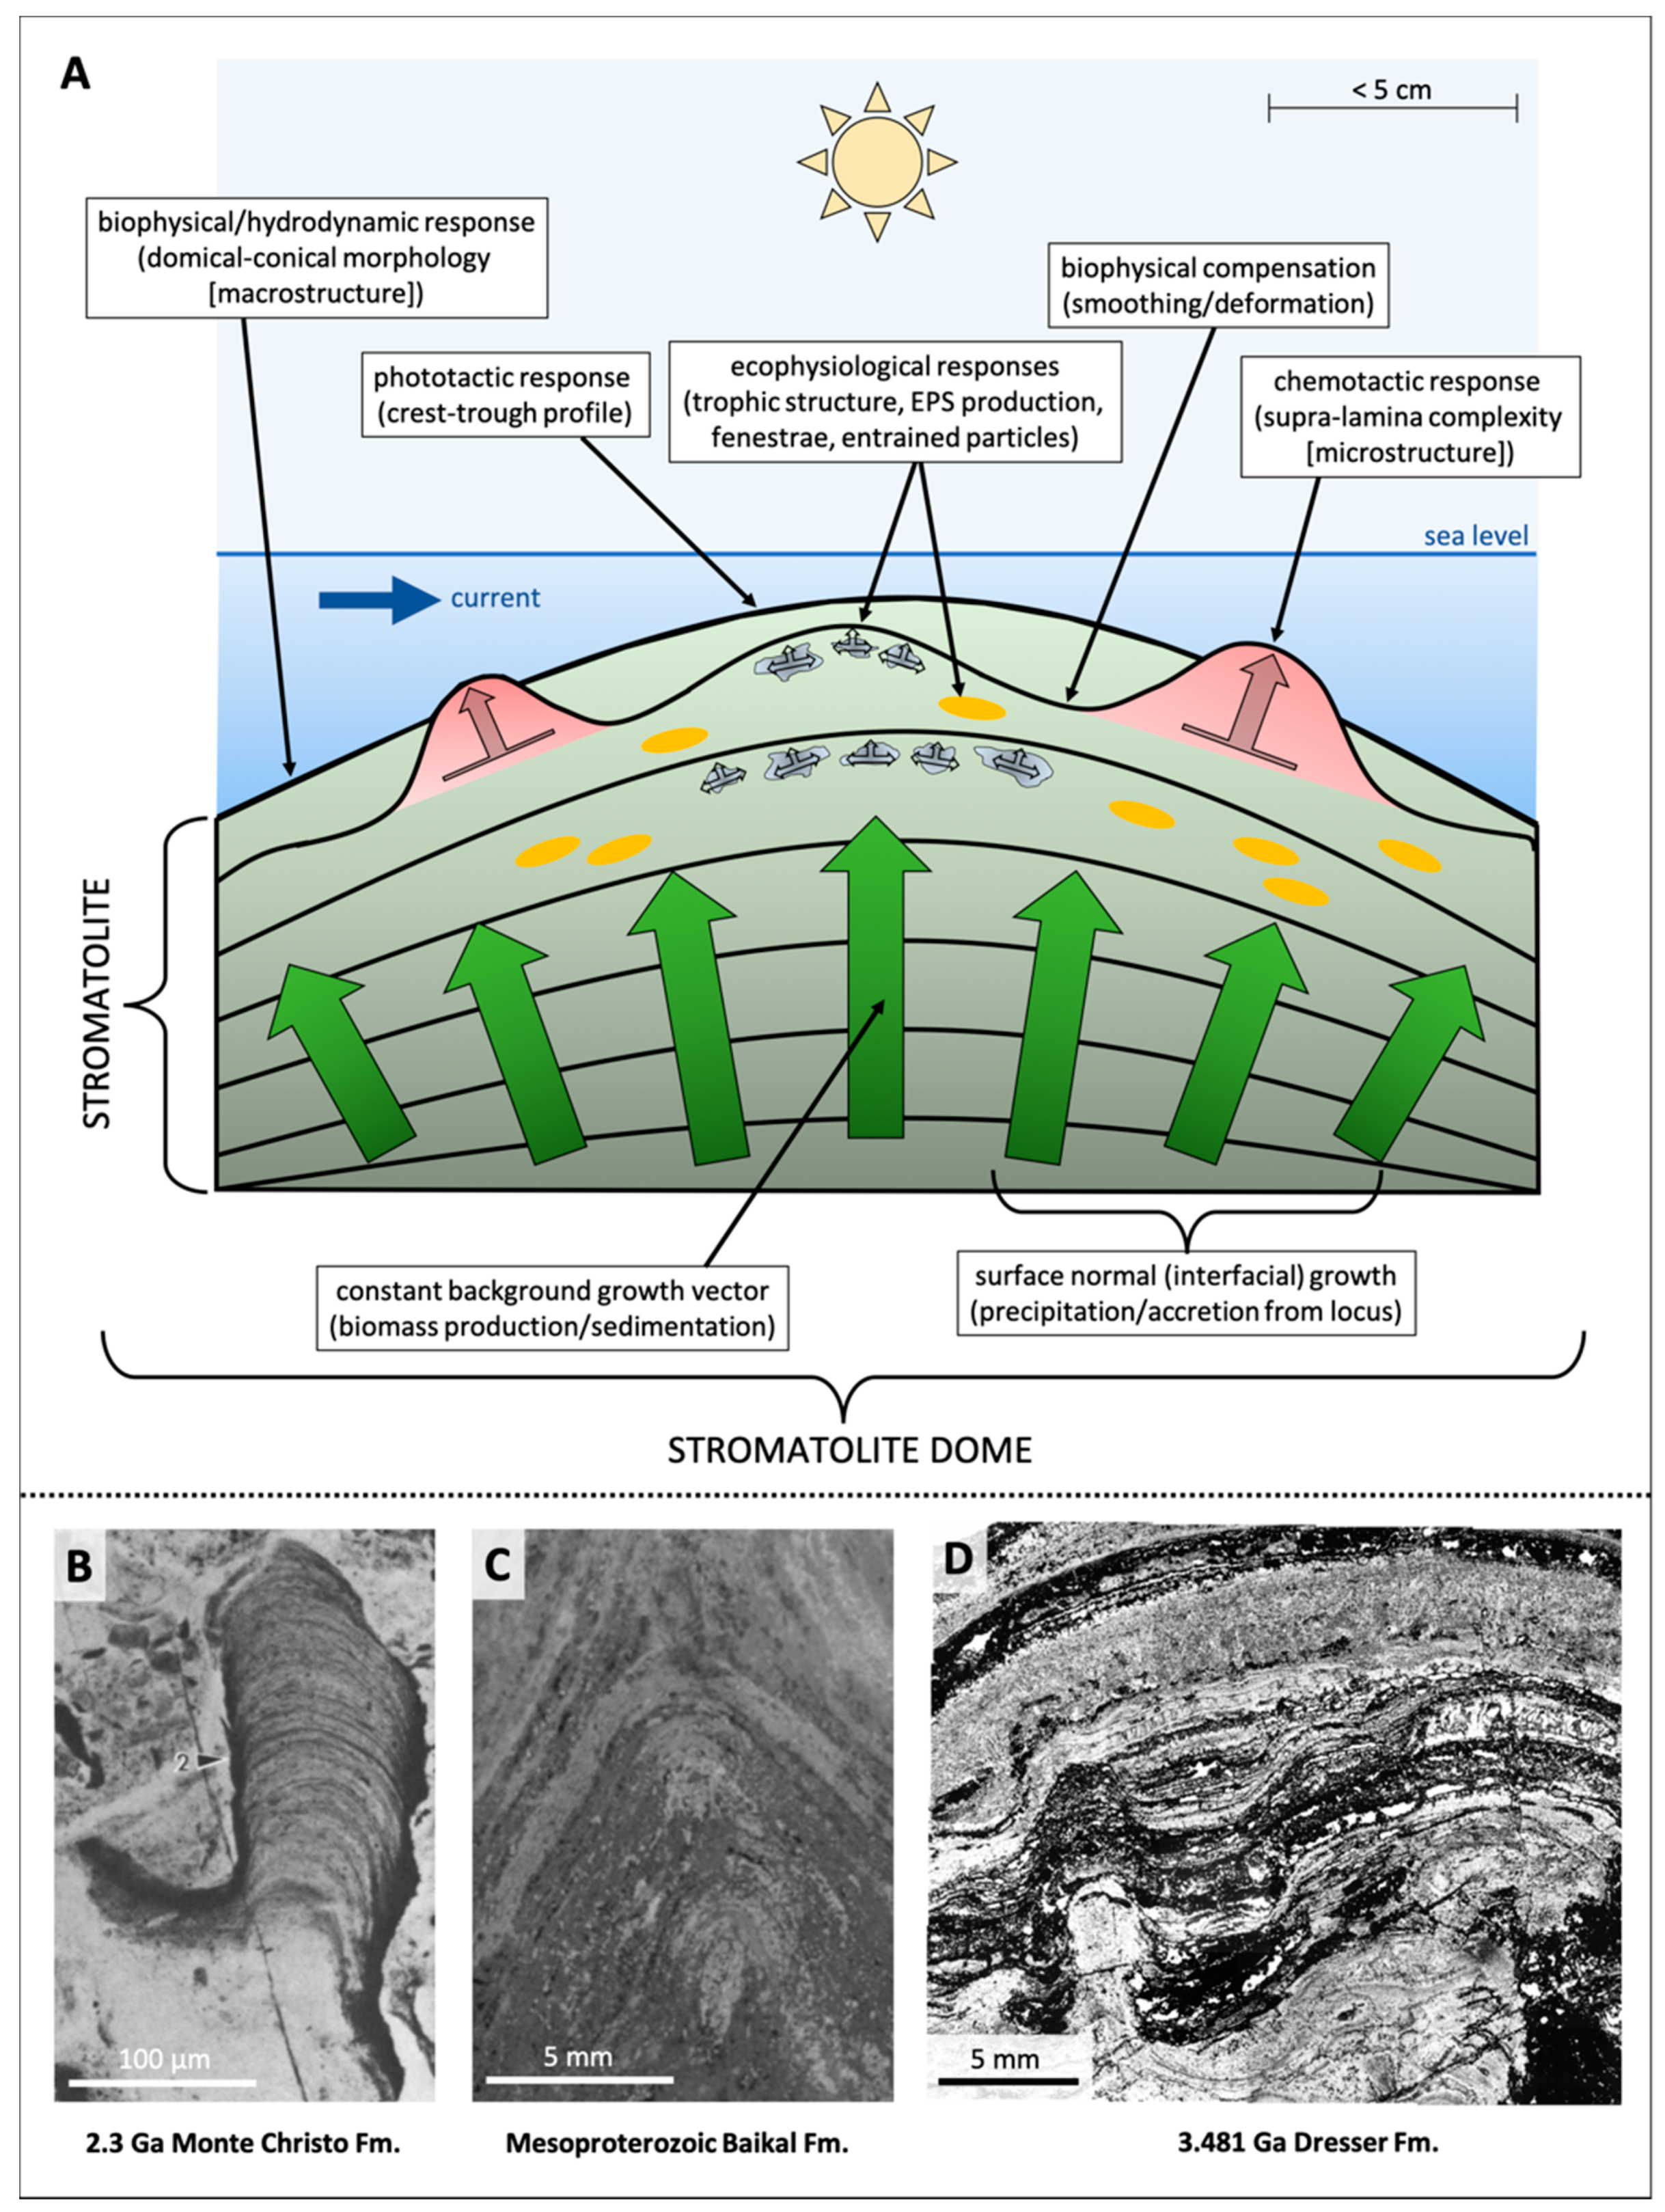
Morphogenesis of Organo-Sedimentary Structures
2. Materials and Methods
2.1. Geomicrobiology and Geochemistry (Modern Samples)
2.2. Microbial Palaeontology (Precambrian Samples)
2.3. Raman Spectroscopy (Precambrian Samples)
2.4. Micro-Scale X-ray Computed Tomography (Modern and Precambrian Samples)
3. Results
3.1. Modern Samples
3.1.1. Macrophotography, Optical Light Microscopy, SEM, and FIRe Photochemistry
3.1.2. PIXE
3.1.3. X-ray µCT
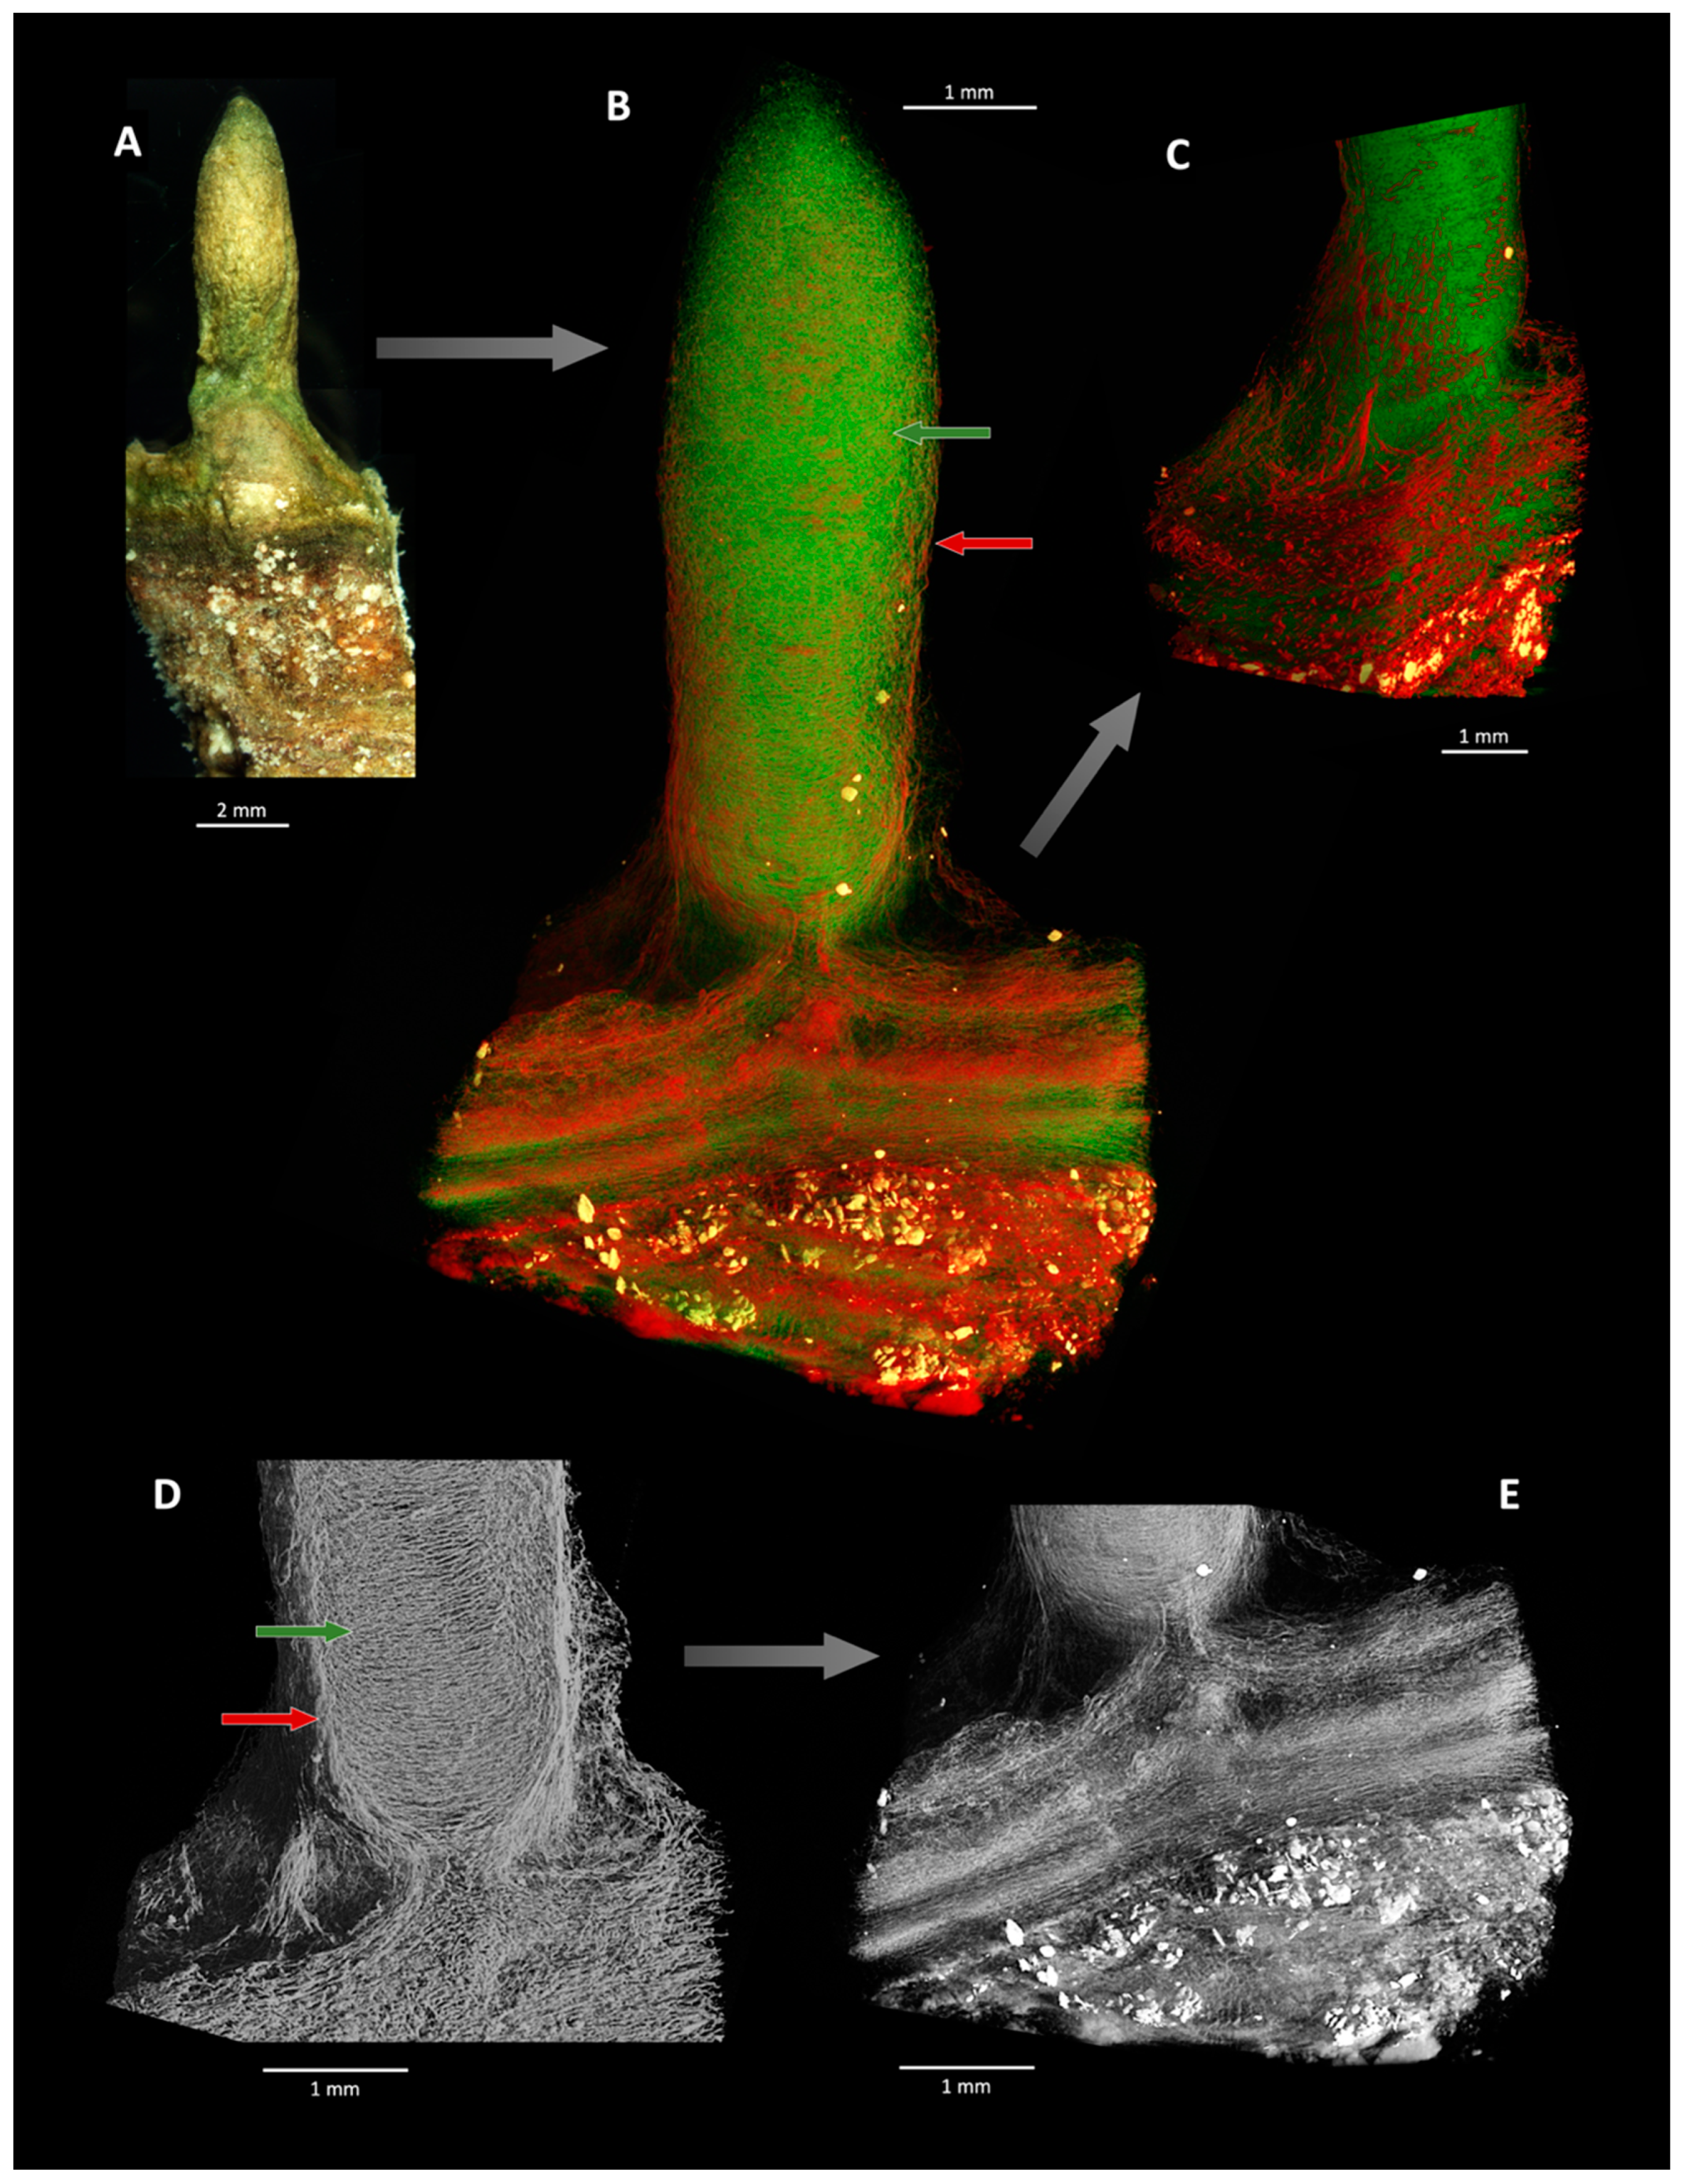
- An interior fabric with domains of both horizontally laminated and randomly oriented filaments of homogeneous size, wherein the degree of randomness in orientation increases with height; and
- An exterior revetment of mostly vertically oriented filaments with a bimodal size distribution (some very fine, some thick).
3.2. Precambrian Samples
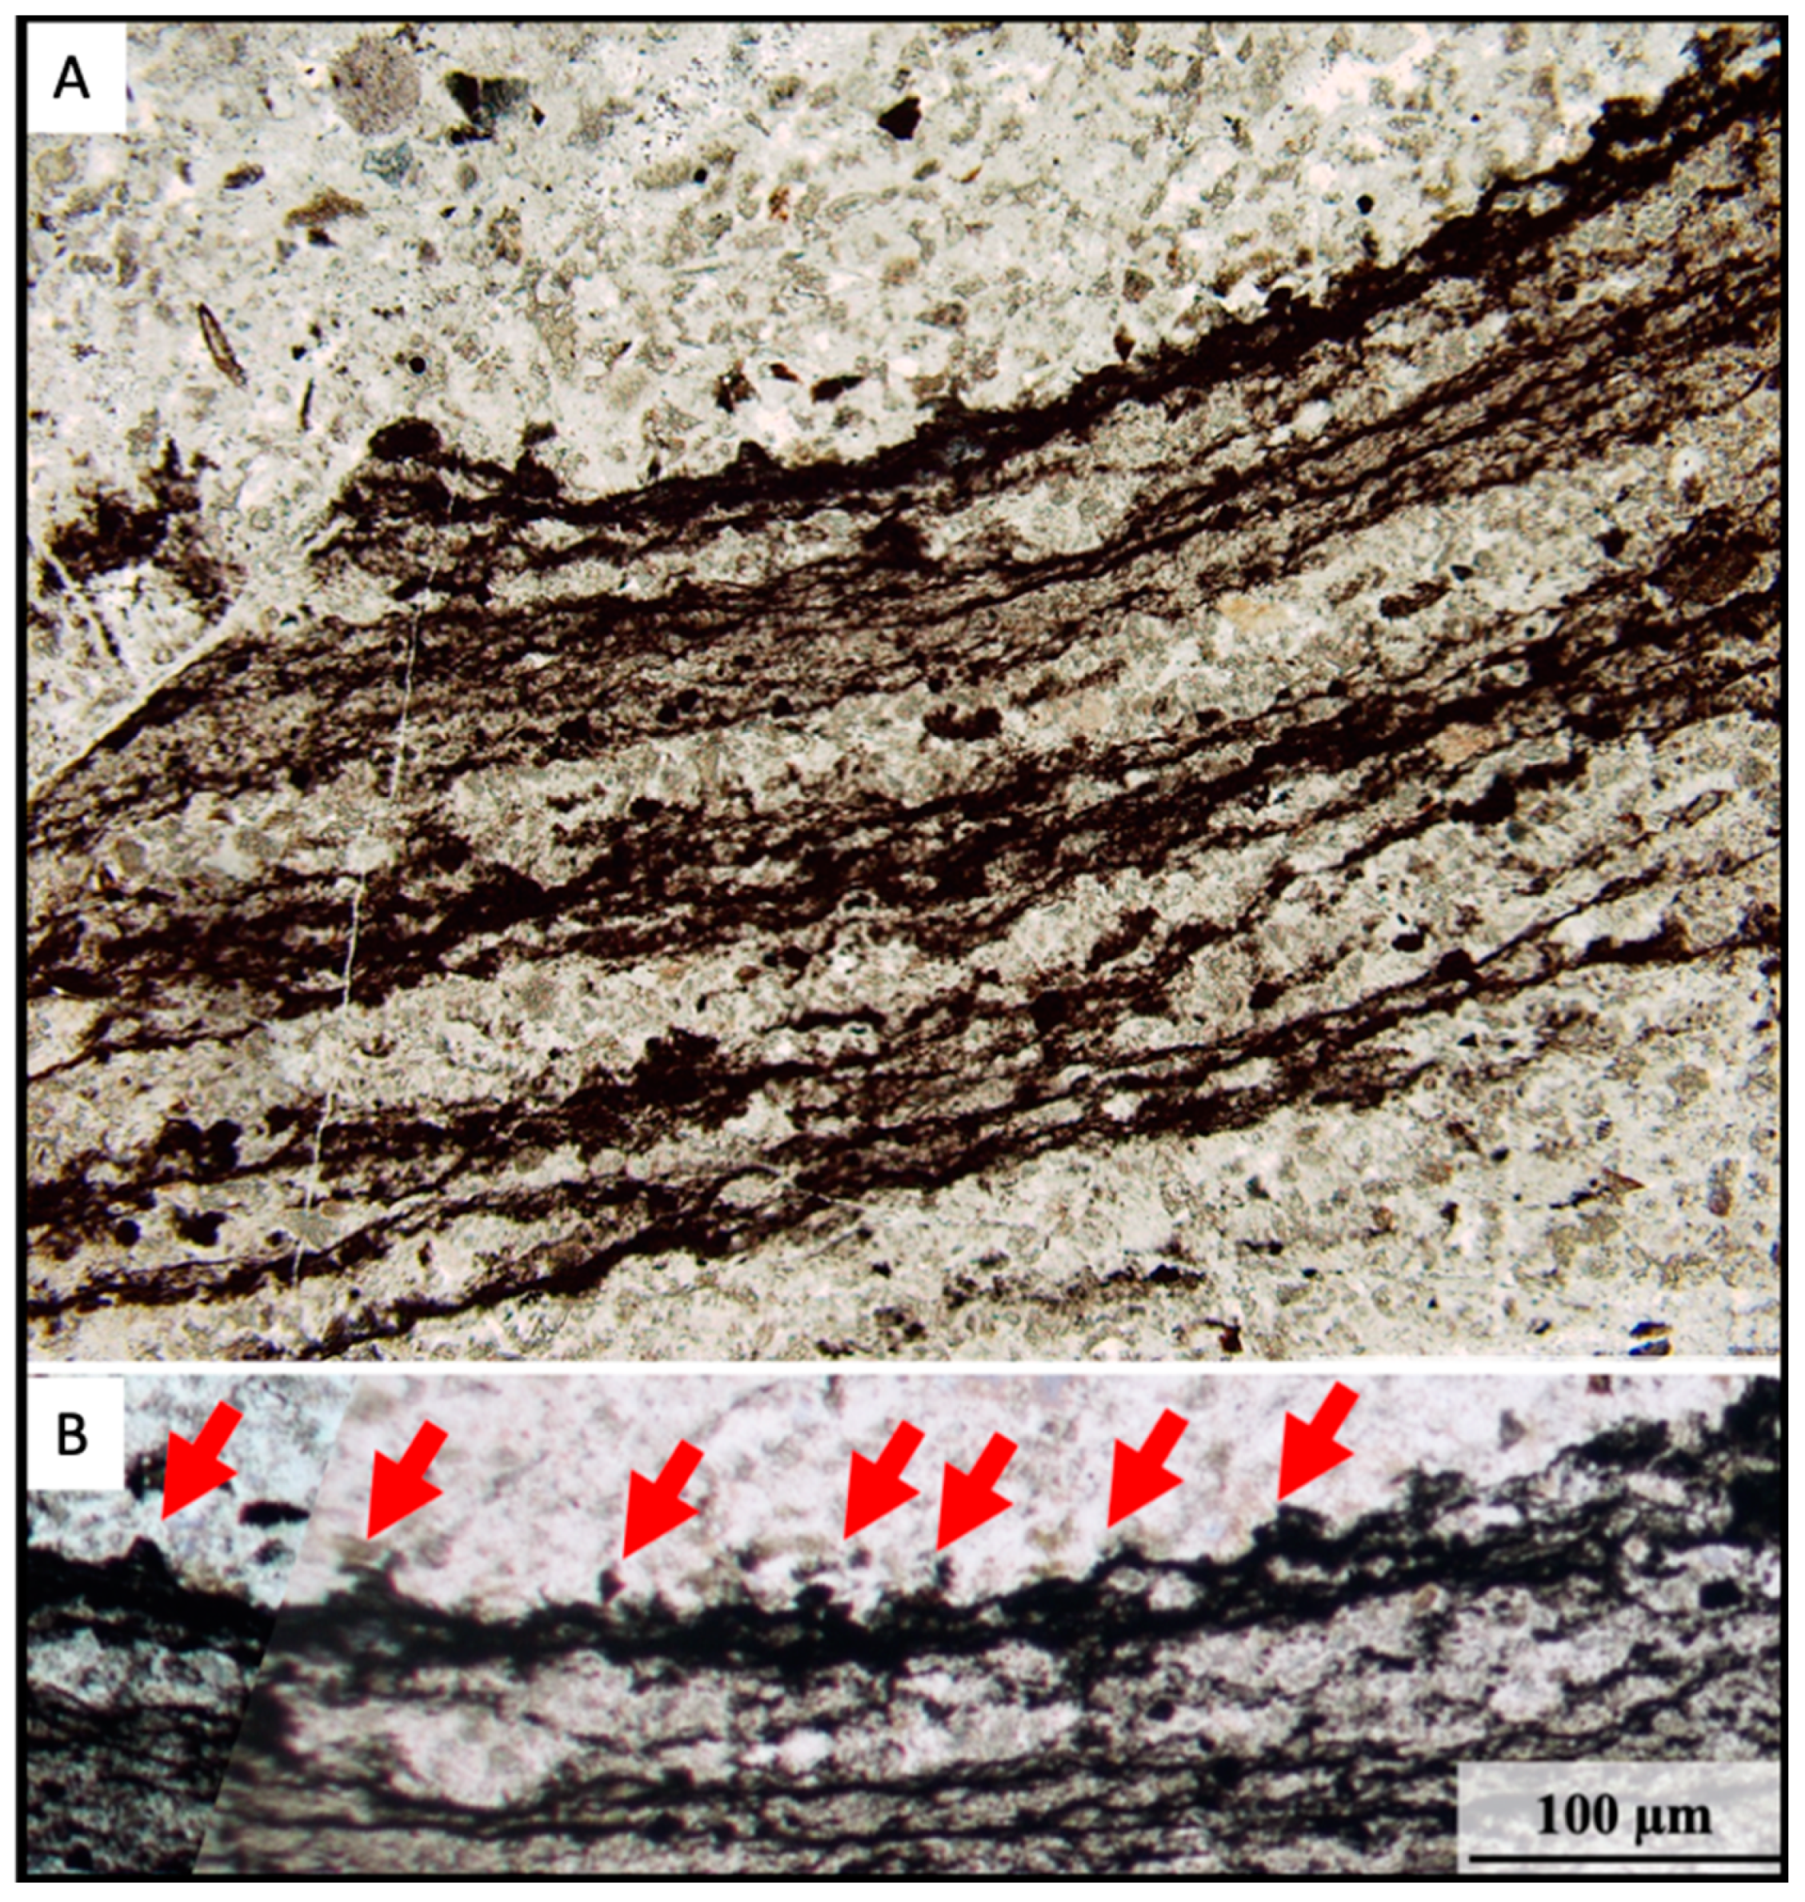
3.2.1. Petrographic Characterisation
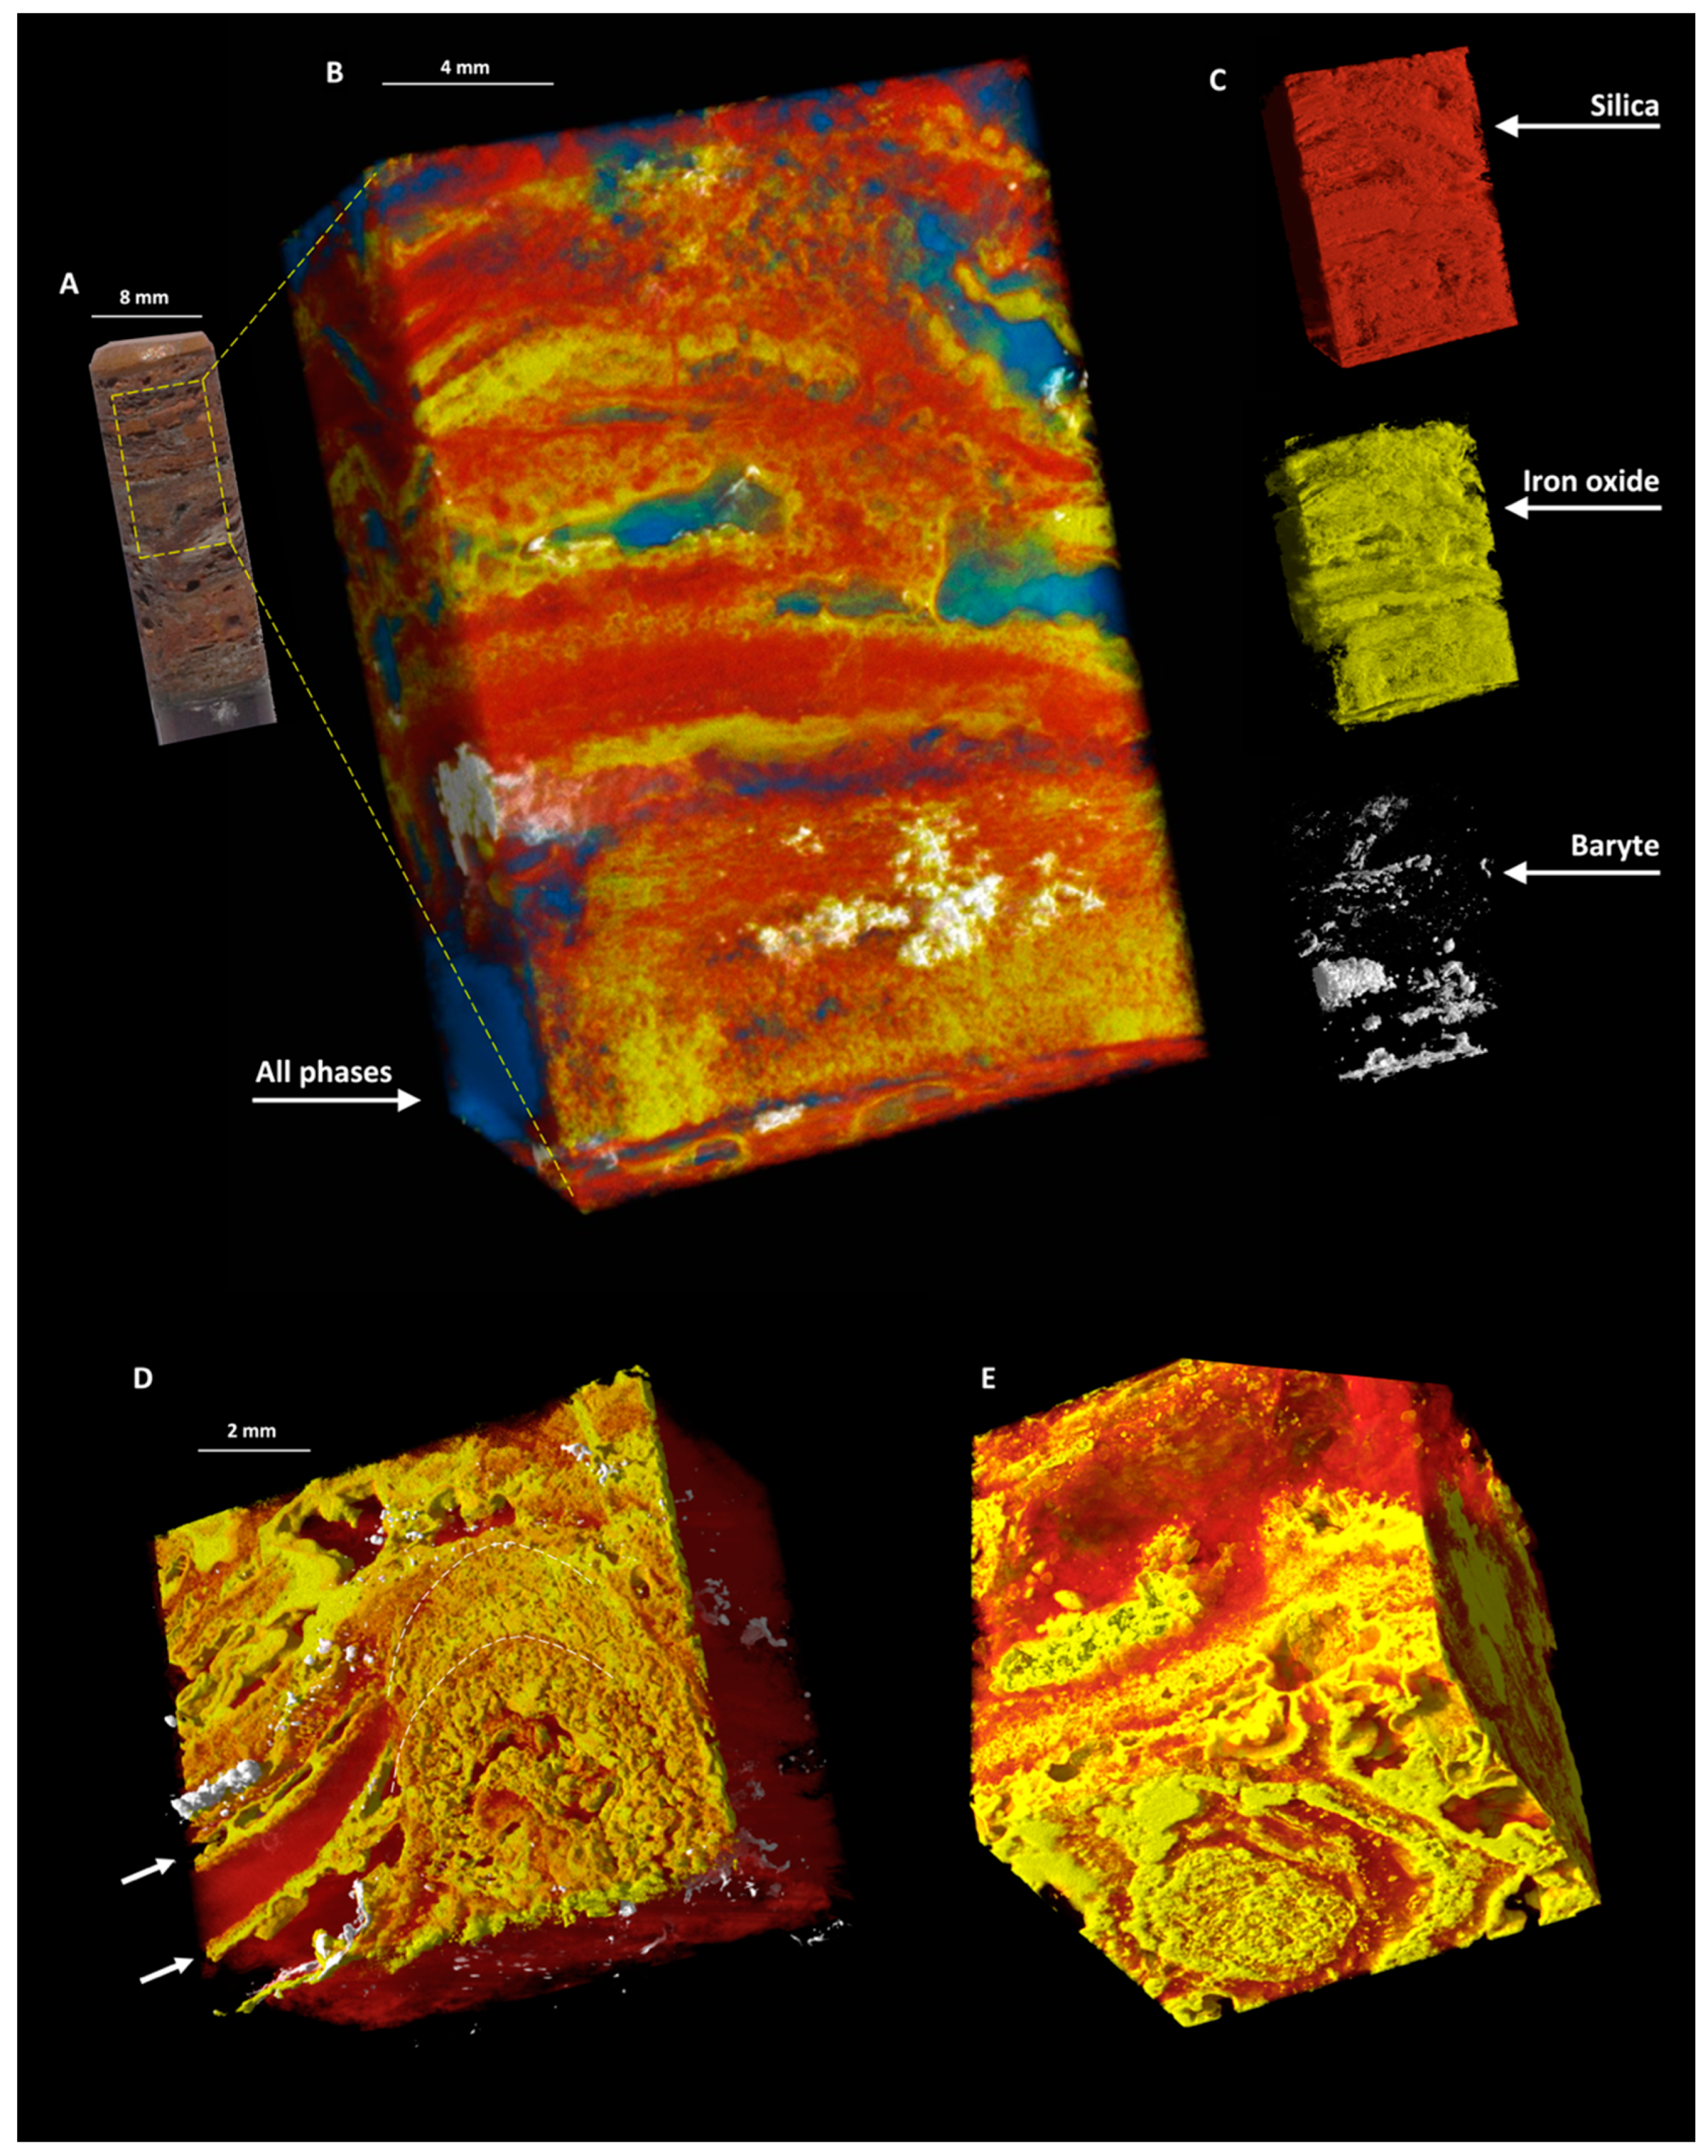
3.2.2. X-ray µCT
- An exterior fabric of thicker laminations overlying the interior fabric, producing a revetment of slightly higher density (yellow–red, i.e., mostly haematite; arrowed in Figure 10D).
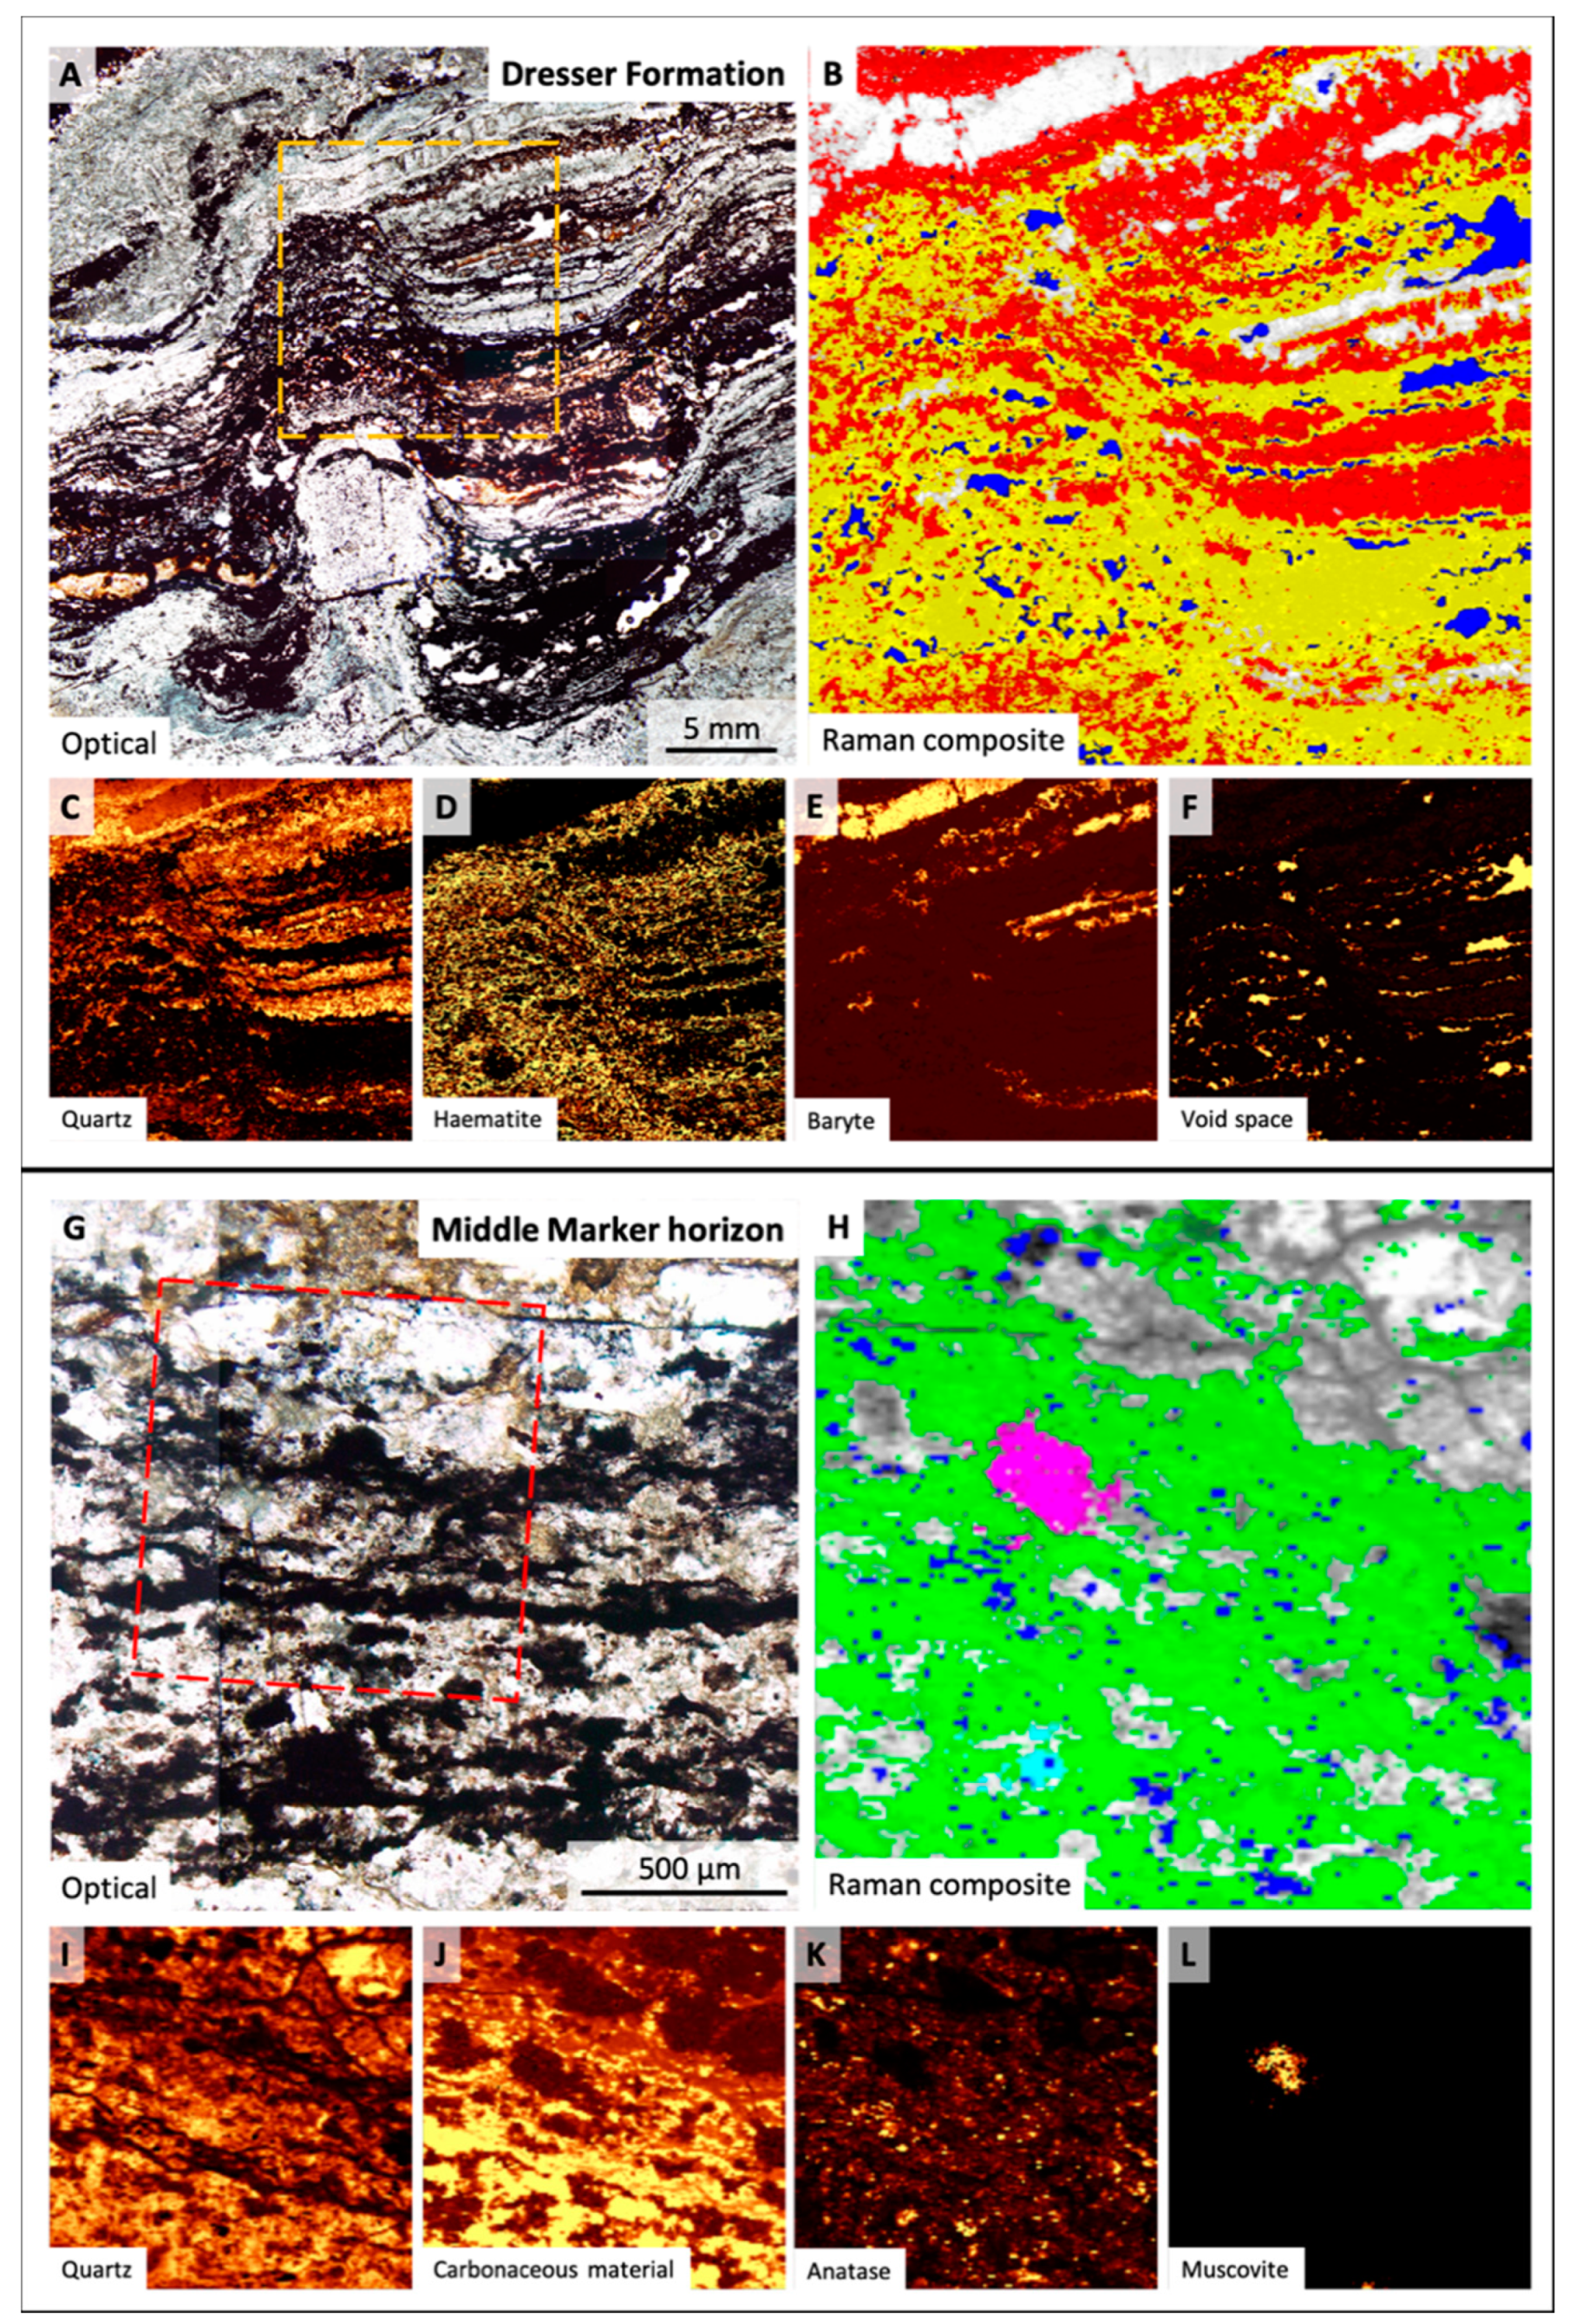
- The silica matrix (grey in Figure 12), which is present throughout the entire sample volume;
- Carbonaceous material (green in Figure 12), enriched in microbial laminations; and
- Denser phases (red in Figure 12) corresponding to anatase associated with the microbial laminations and altered volcanic particles and unsilicified particles, both entrained within the laminations and scattered throughout the matrix. Dense particles are sometimes surrounded by filament-like carbonaceous material (arrowed in Figure 12).
4. Discussion
4.1. Comparative Morphogenesis in Modern and Ancient Microbialites
- (i)
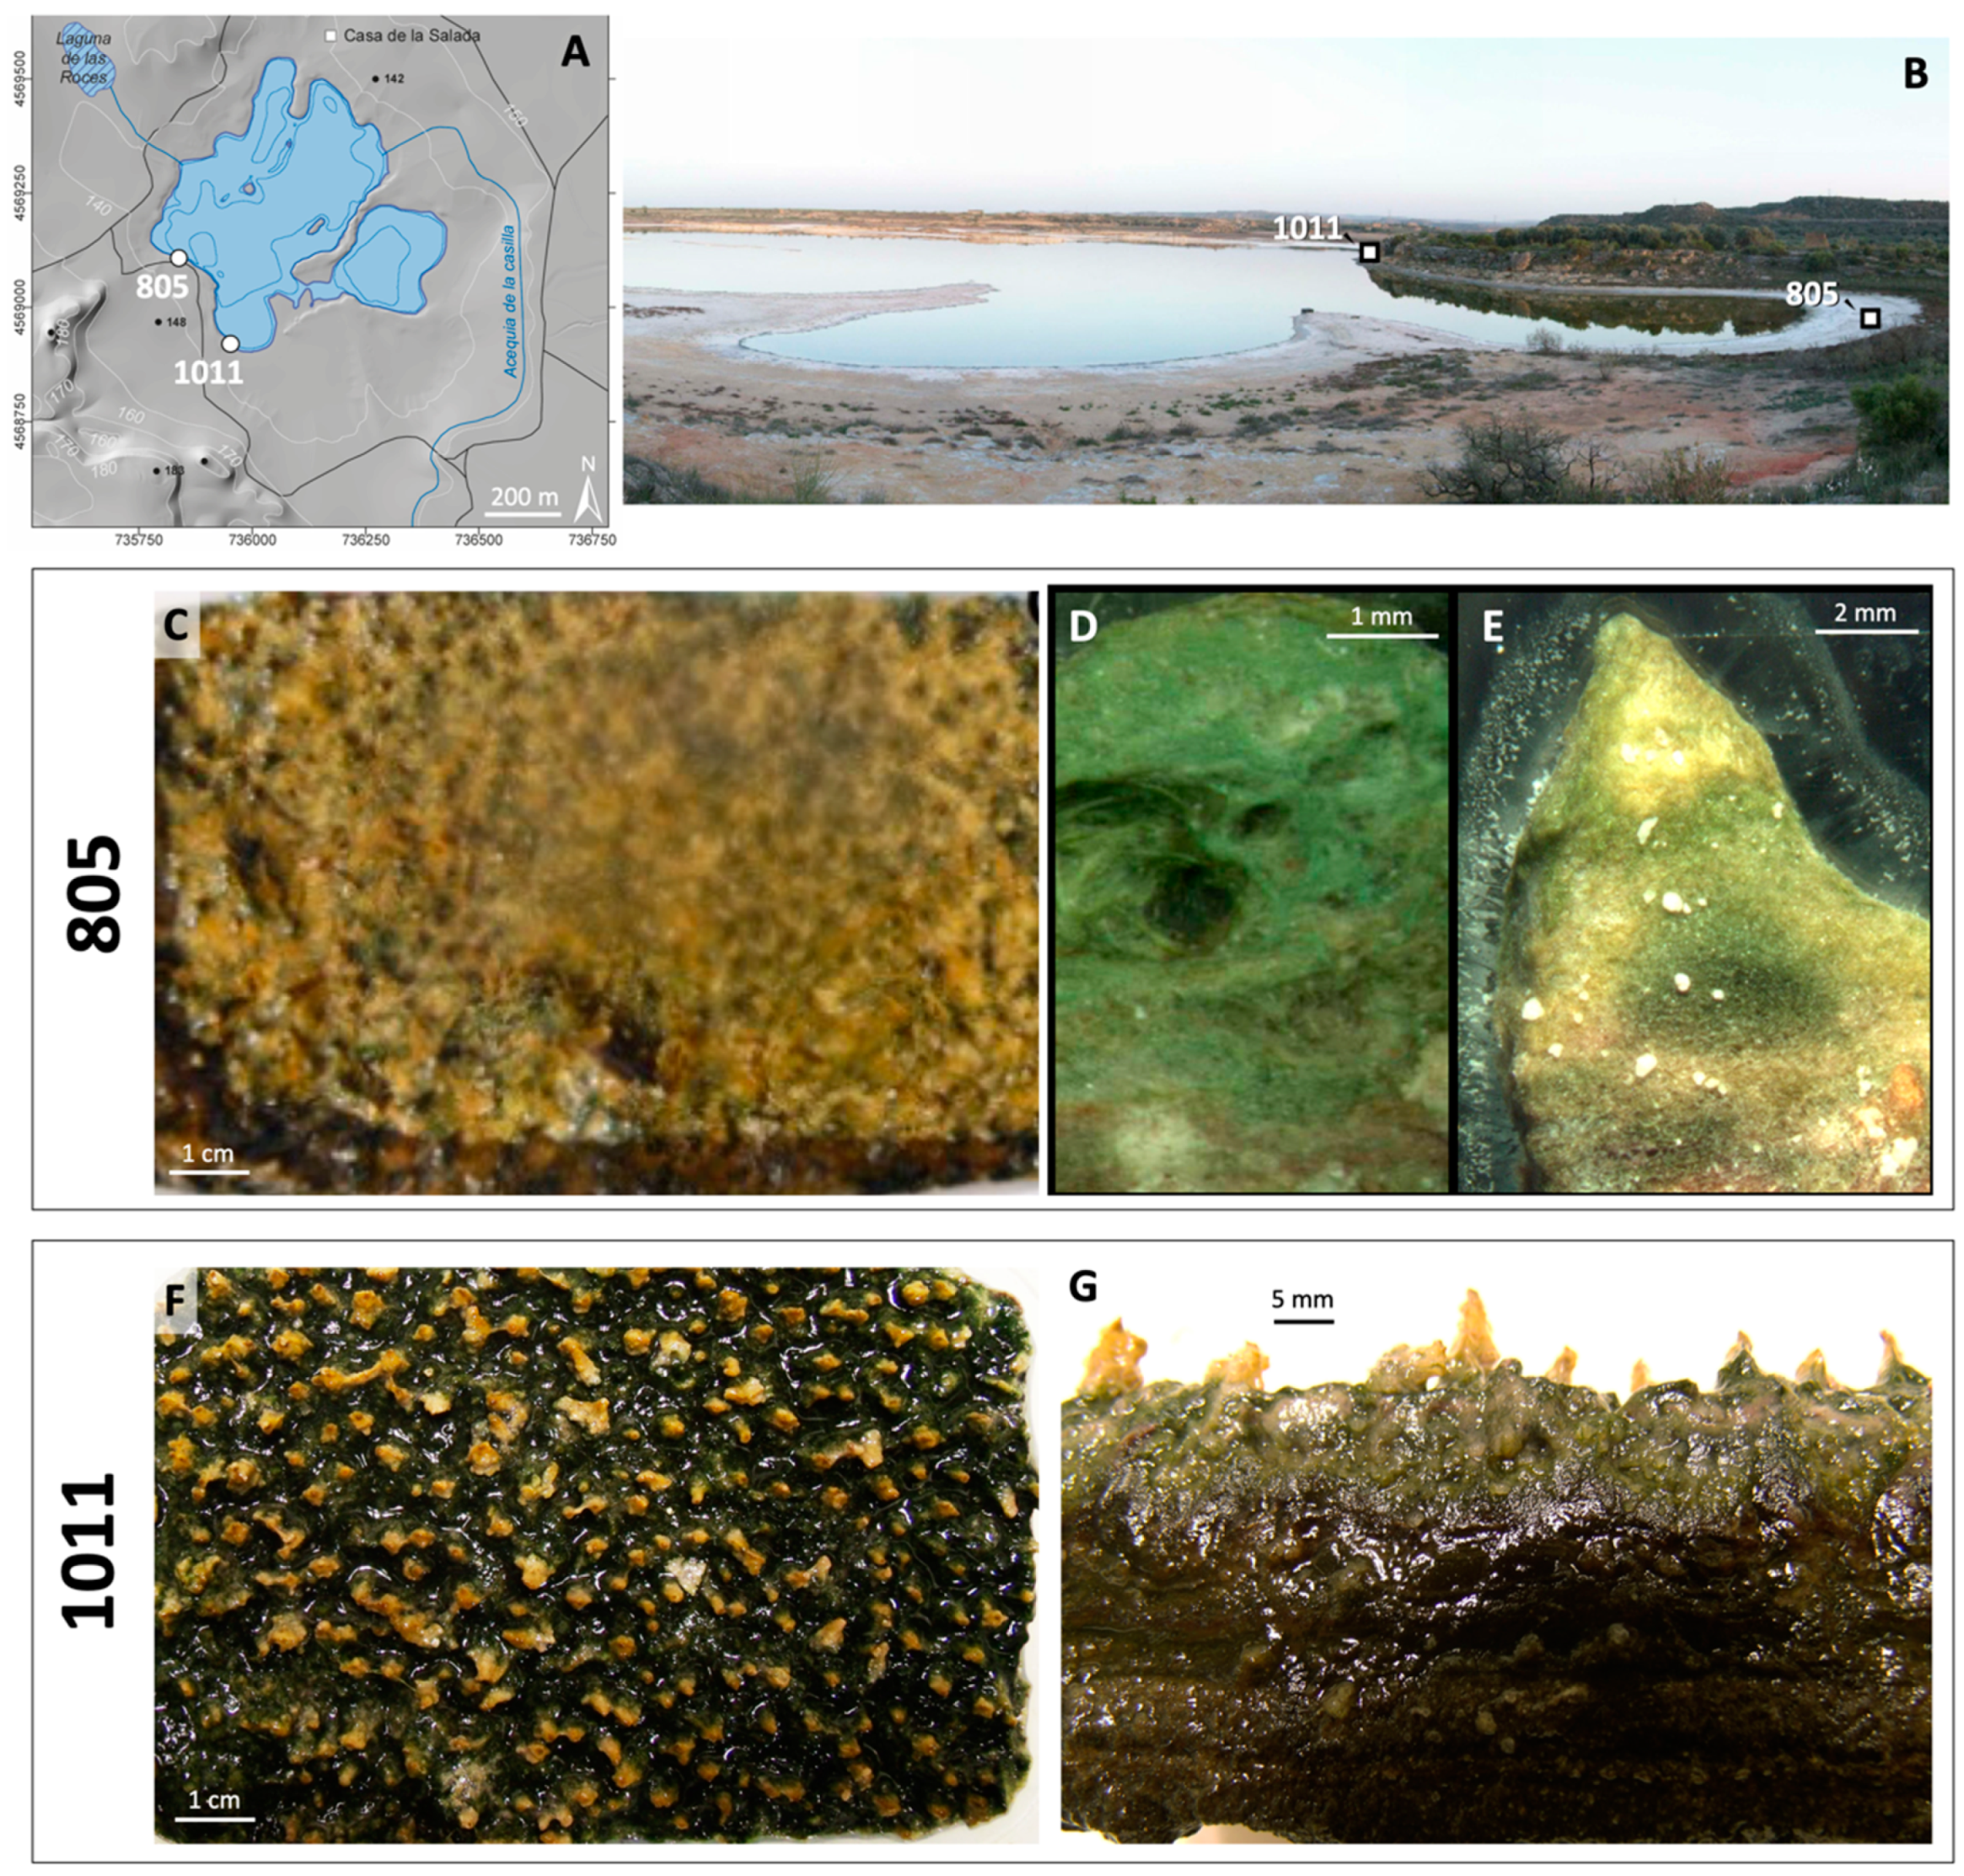
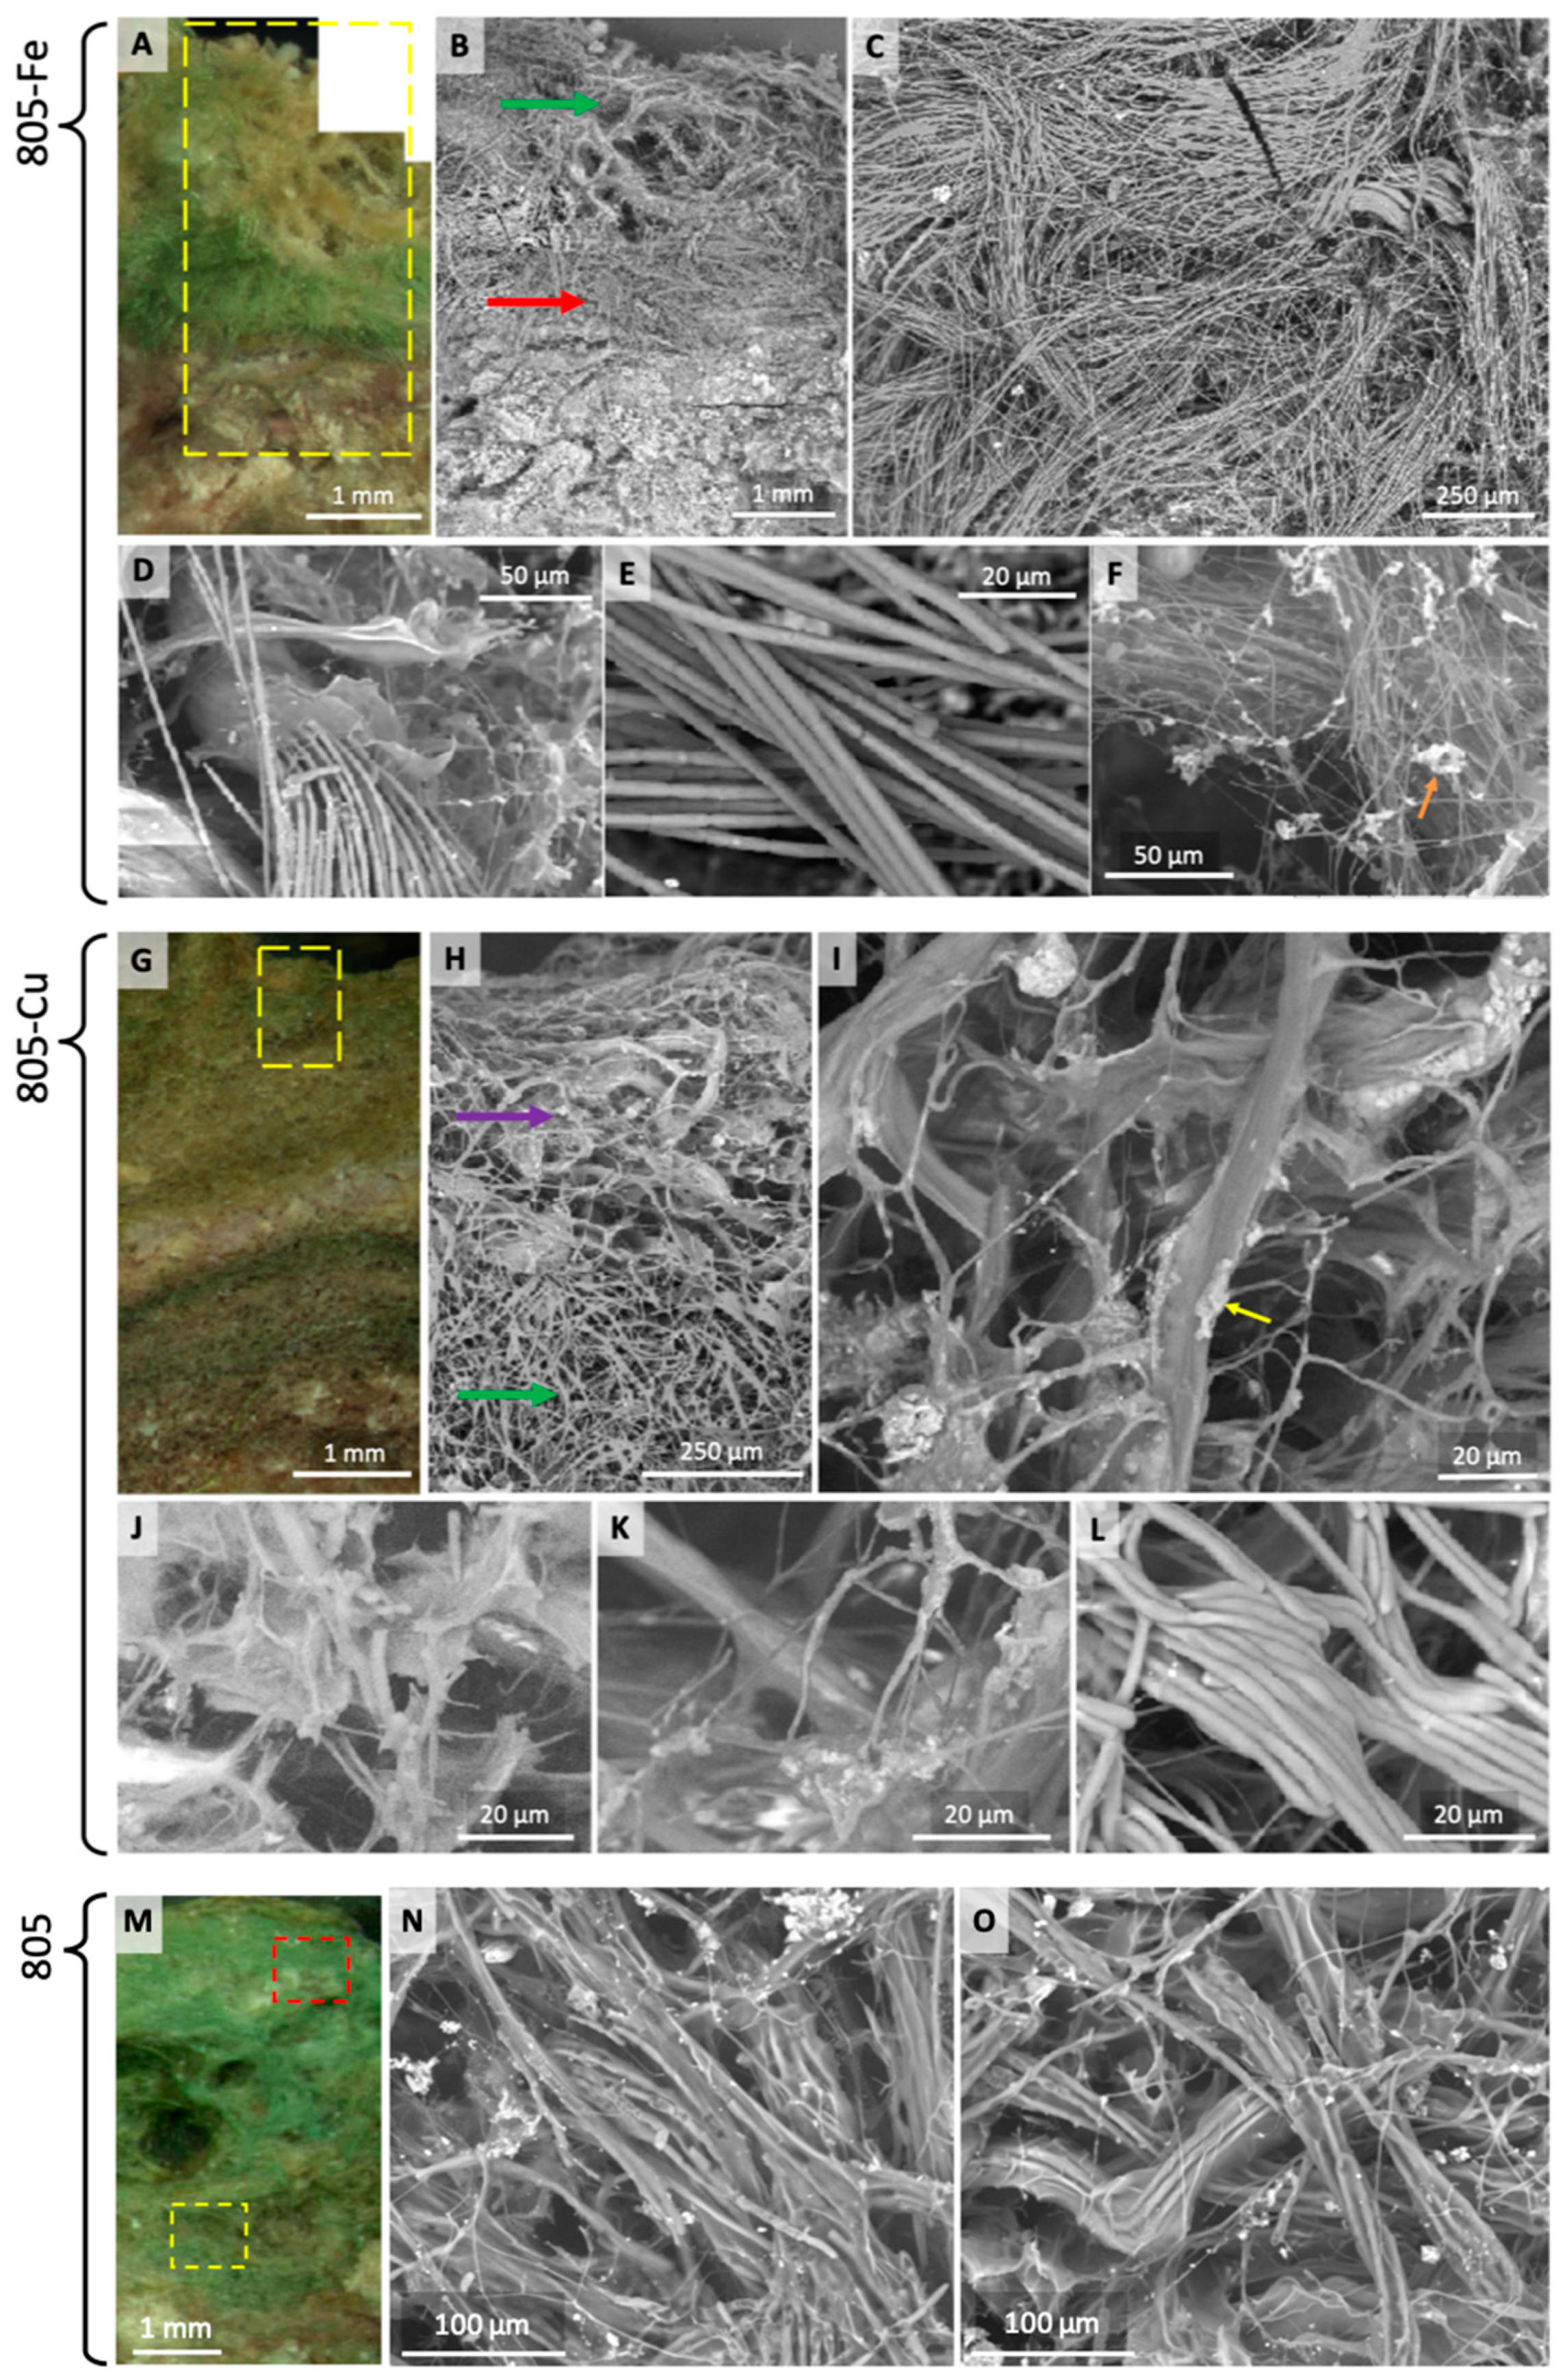
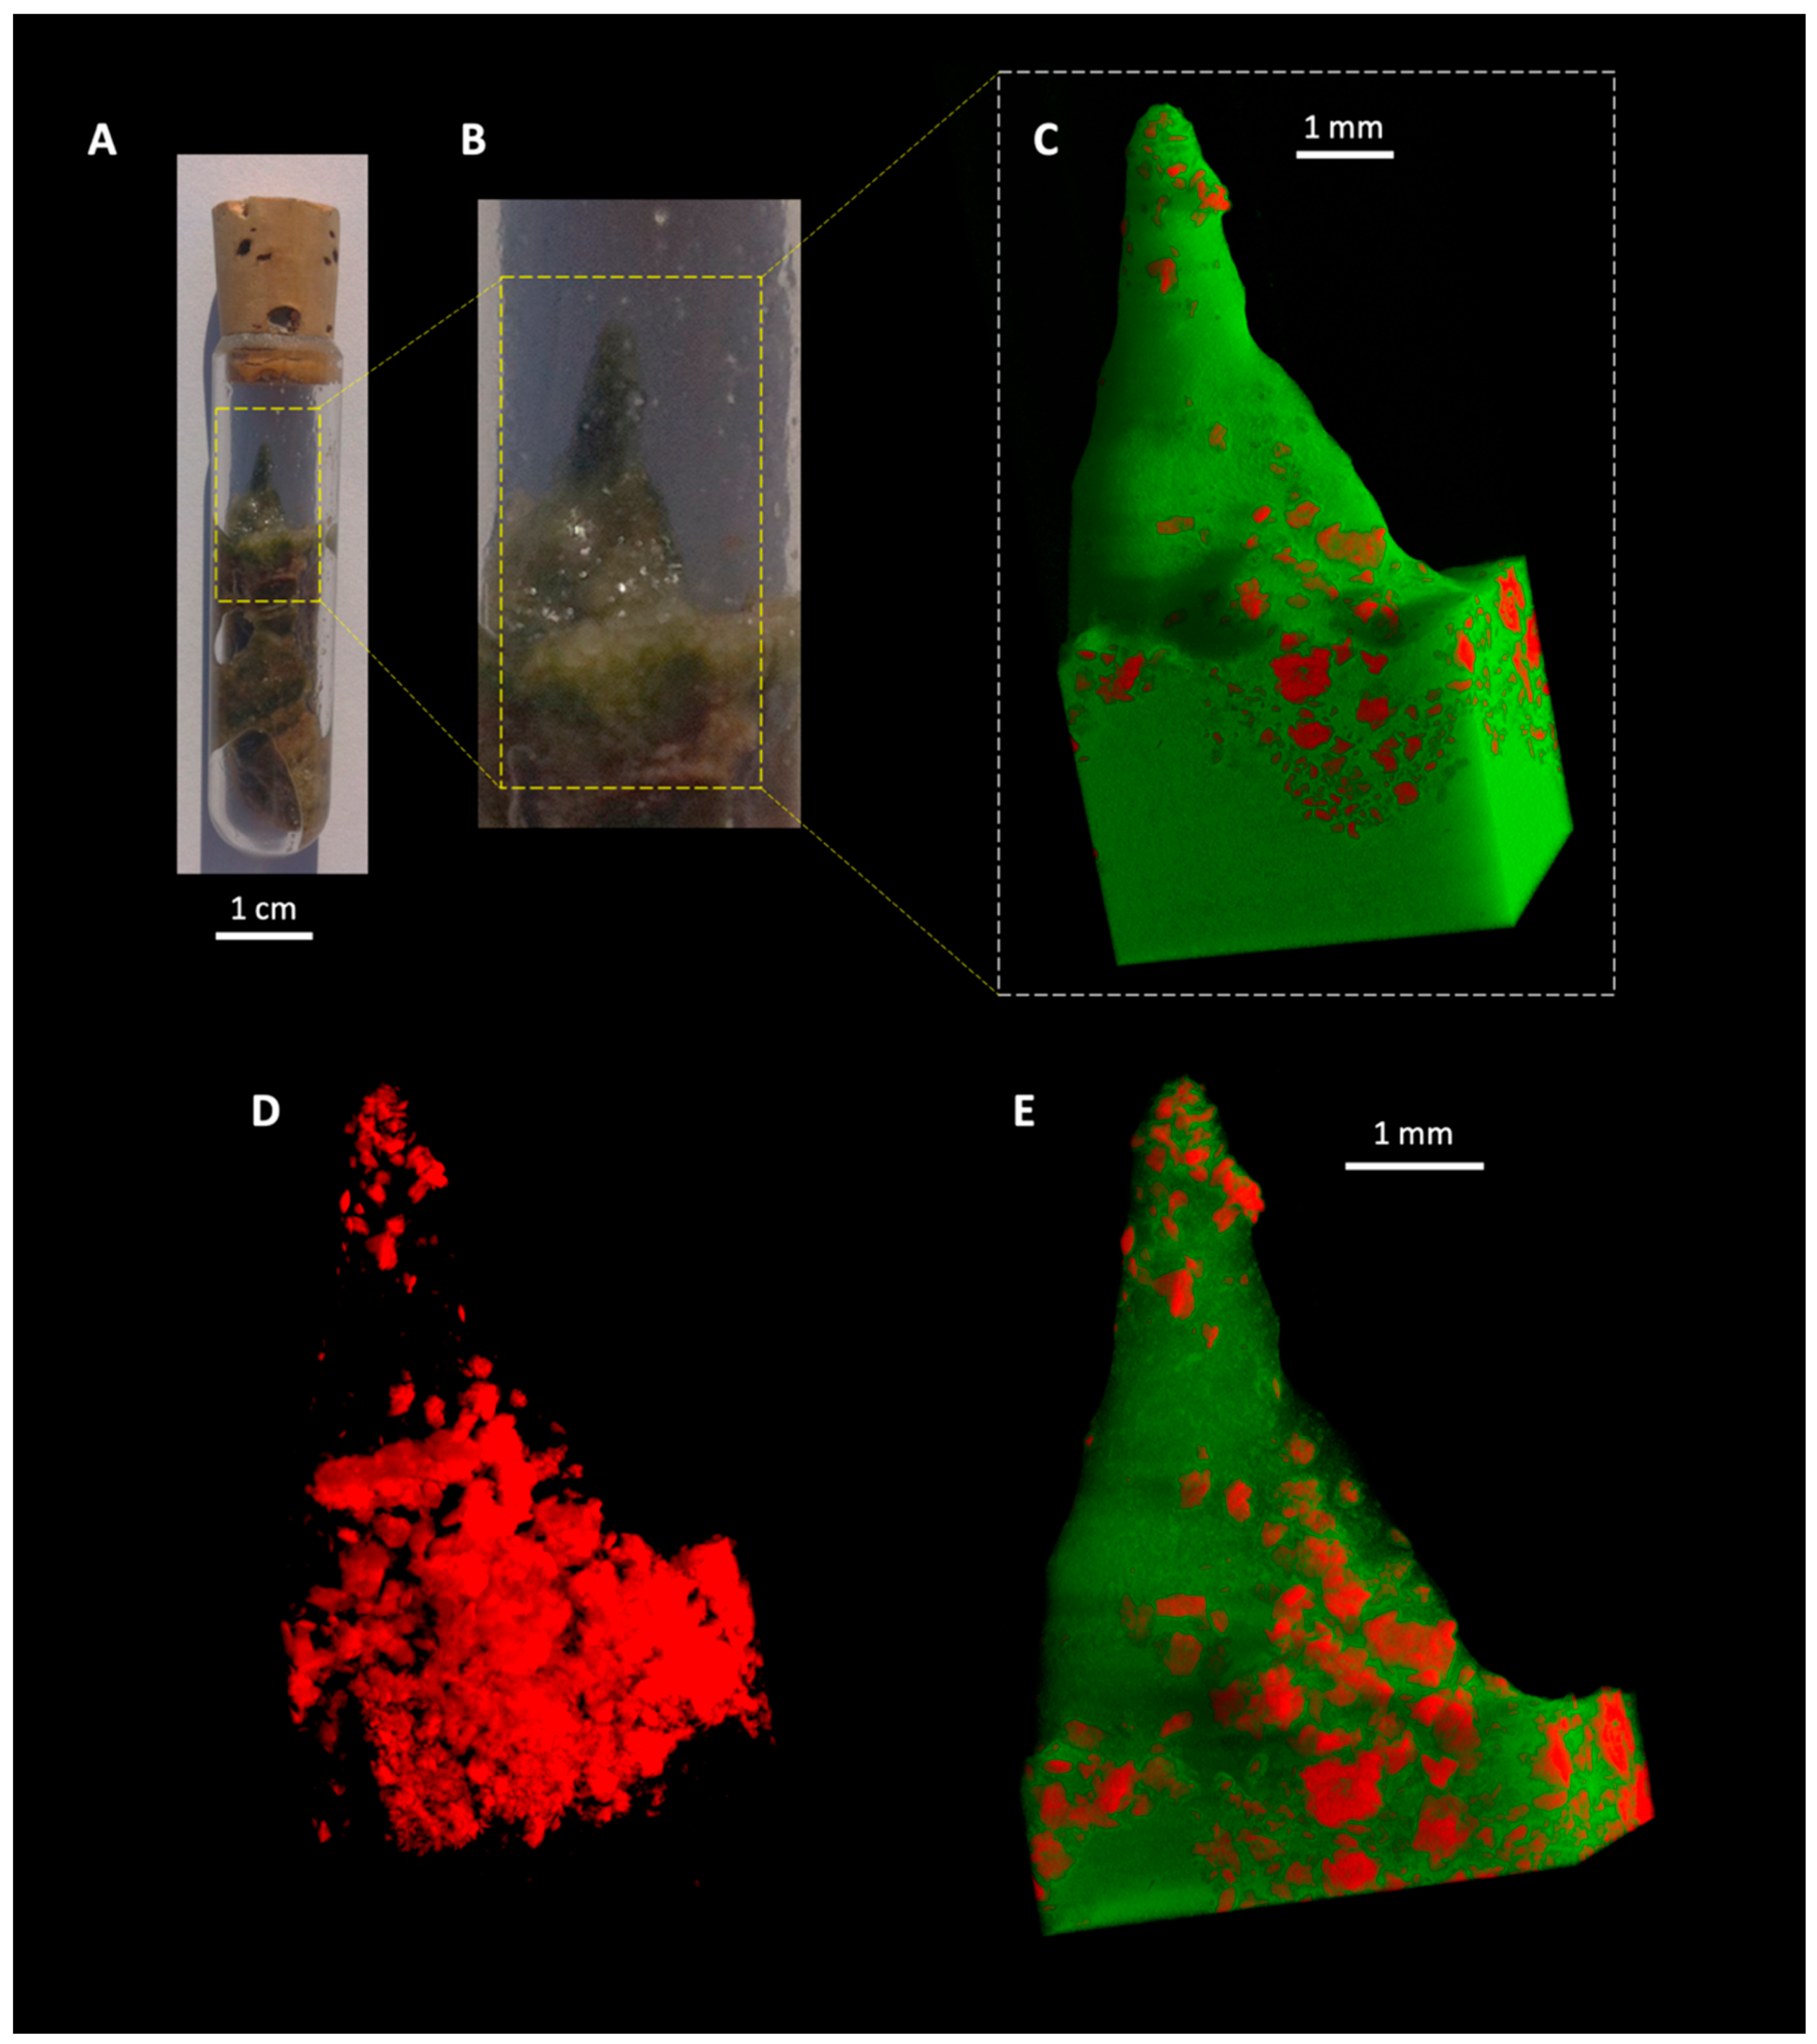
- Microbial mat communities grown in the presence of enriched concentrations of toxic Cu (sample 805-Cu) formed surface convexities (microstructures), termed pinnacles, atop their macrostructure (Figure 1 and Figure 3). Pinnacles did not develop in the presence of other metal enrichments (Fe, Ni, Mn, and Sr were tested; Fe results shown (sample 805-Fe) in Figure 4A). We thus infer a cause and response relationship between elevated Cu concentrations and the development of surface convexities. Phototaxis can be excluded as the driver of pinnacle growth, as the light intensity at the surface of the mats was homogeneous.
- (ii)
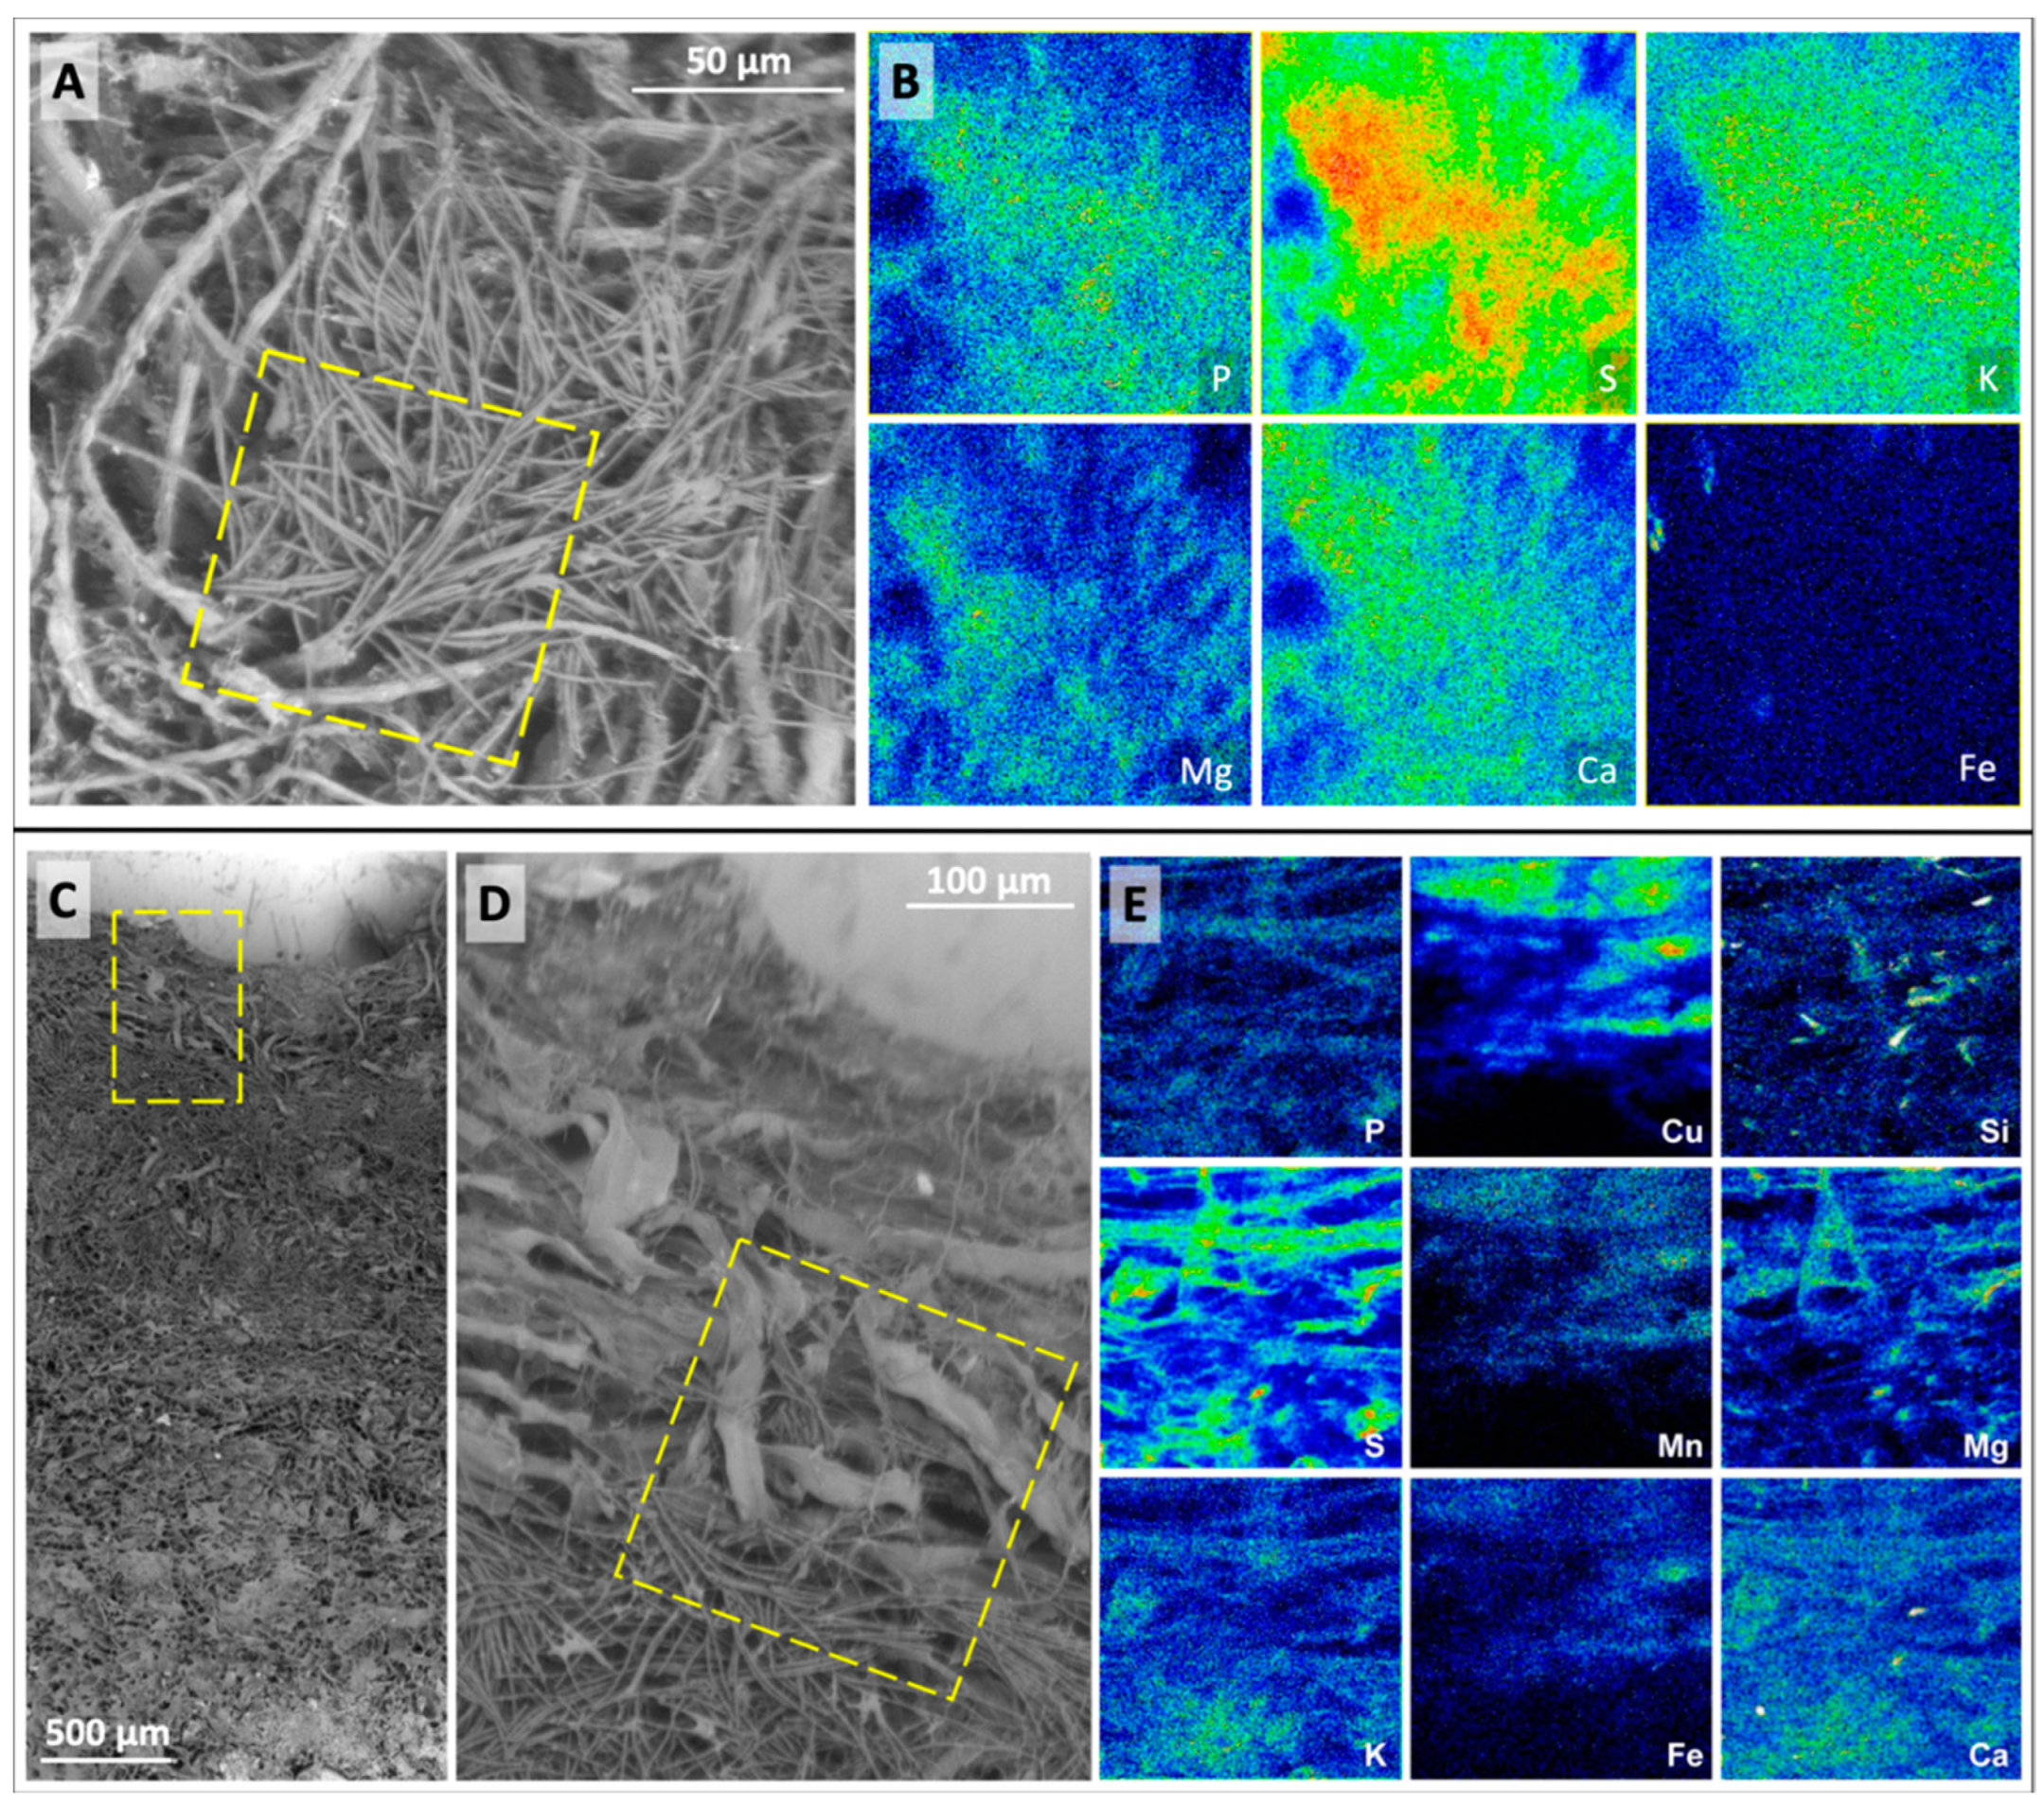
- SEM imaging (Figure 2 and Figure 3) and µPIXE elemental mapping (Figure 4) demonstrate that the community forming both the mat and pinnacles (Coleofasciculus–Chloroflexus) appears to stratify into two distinct layers in the presence of Cu (Figure 5D). The first is an inner Coleofasciculus-rich layer which exhibits some laminated micromorphology, and the second is a thin sheath-EPS-Chloroflexus layer (Figure 2 and Figure 3) forming a sparse revetment on and between the pinnacles (Figure 5). This spatial segregation (the inverse of that in the 805 field sample) occurs as a function of organismal tolerance to Cu, i.e., Chloroflexus is Cu-tolerant, whereas Coleofasciculus is intolerant to Cu and retreats to the interior, producing EPS and discarding sheaths in the outer layer (Figure 2H,I).
- (iii)
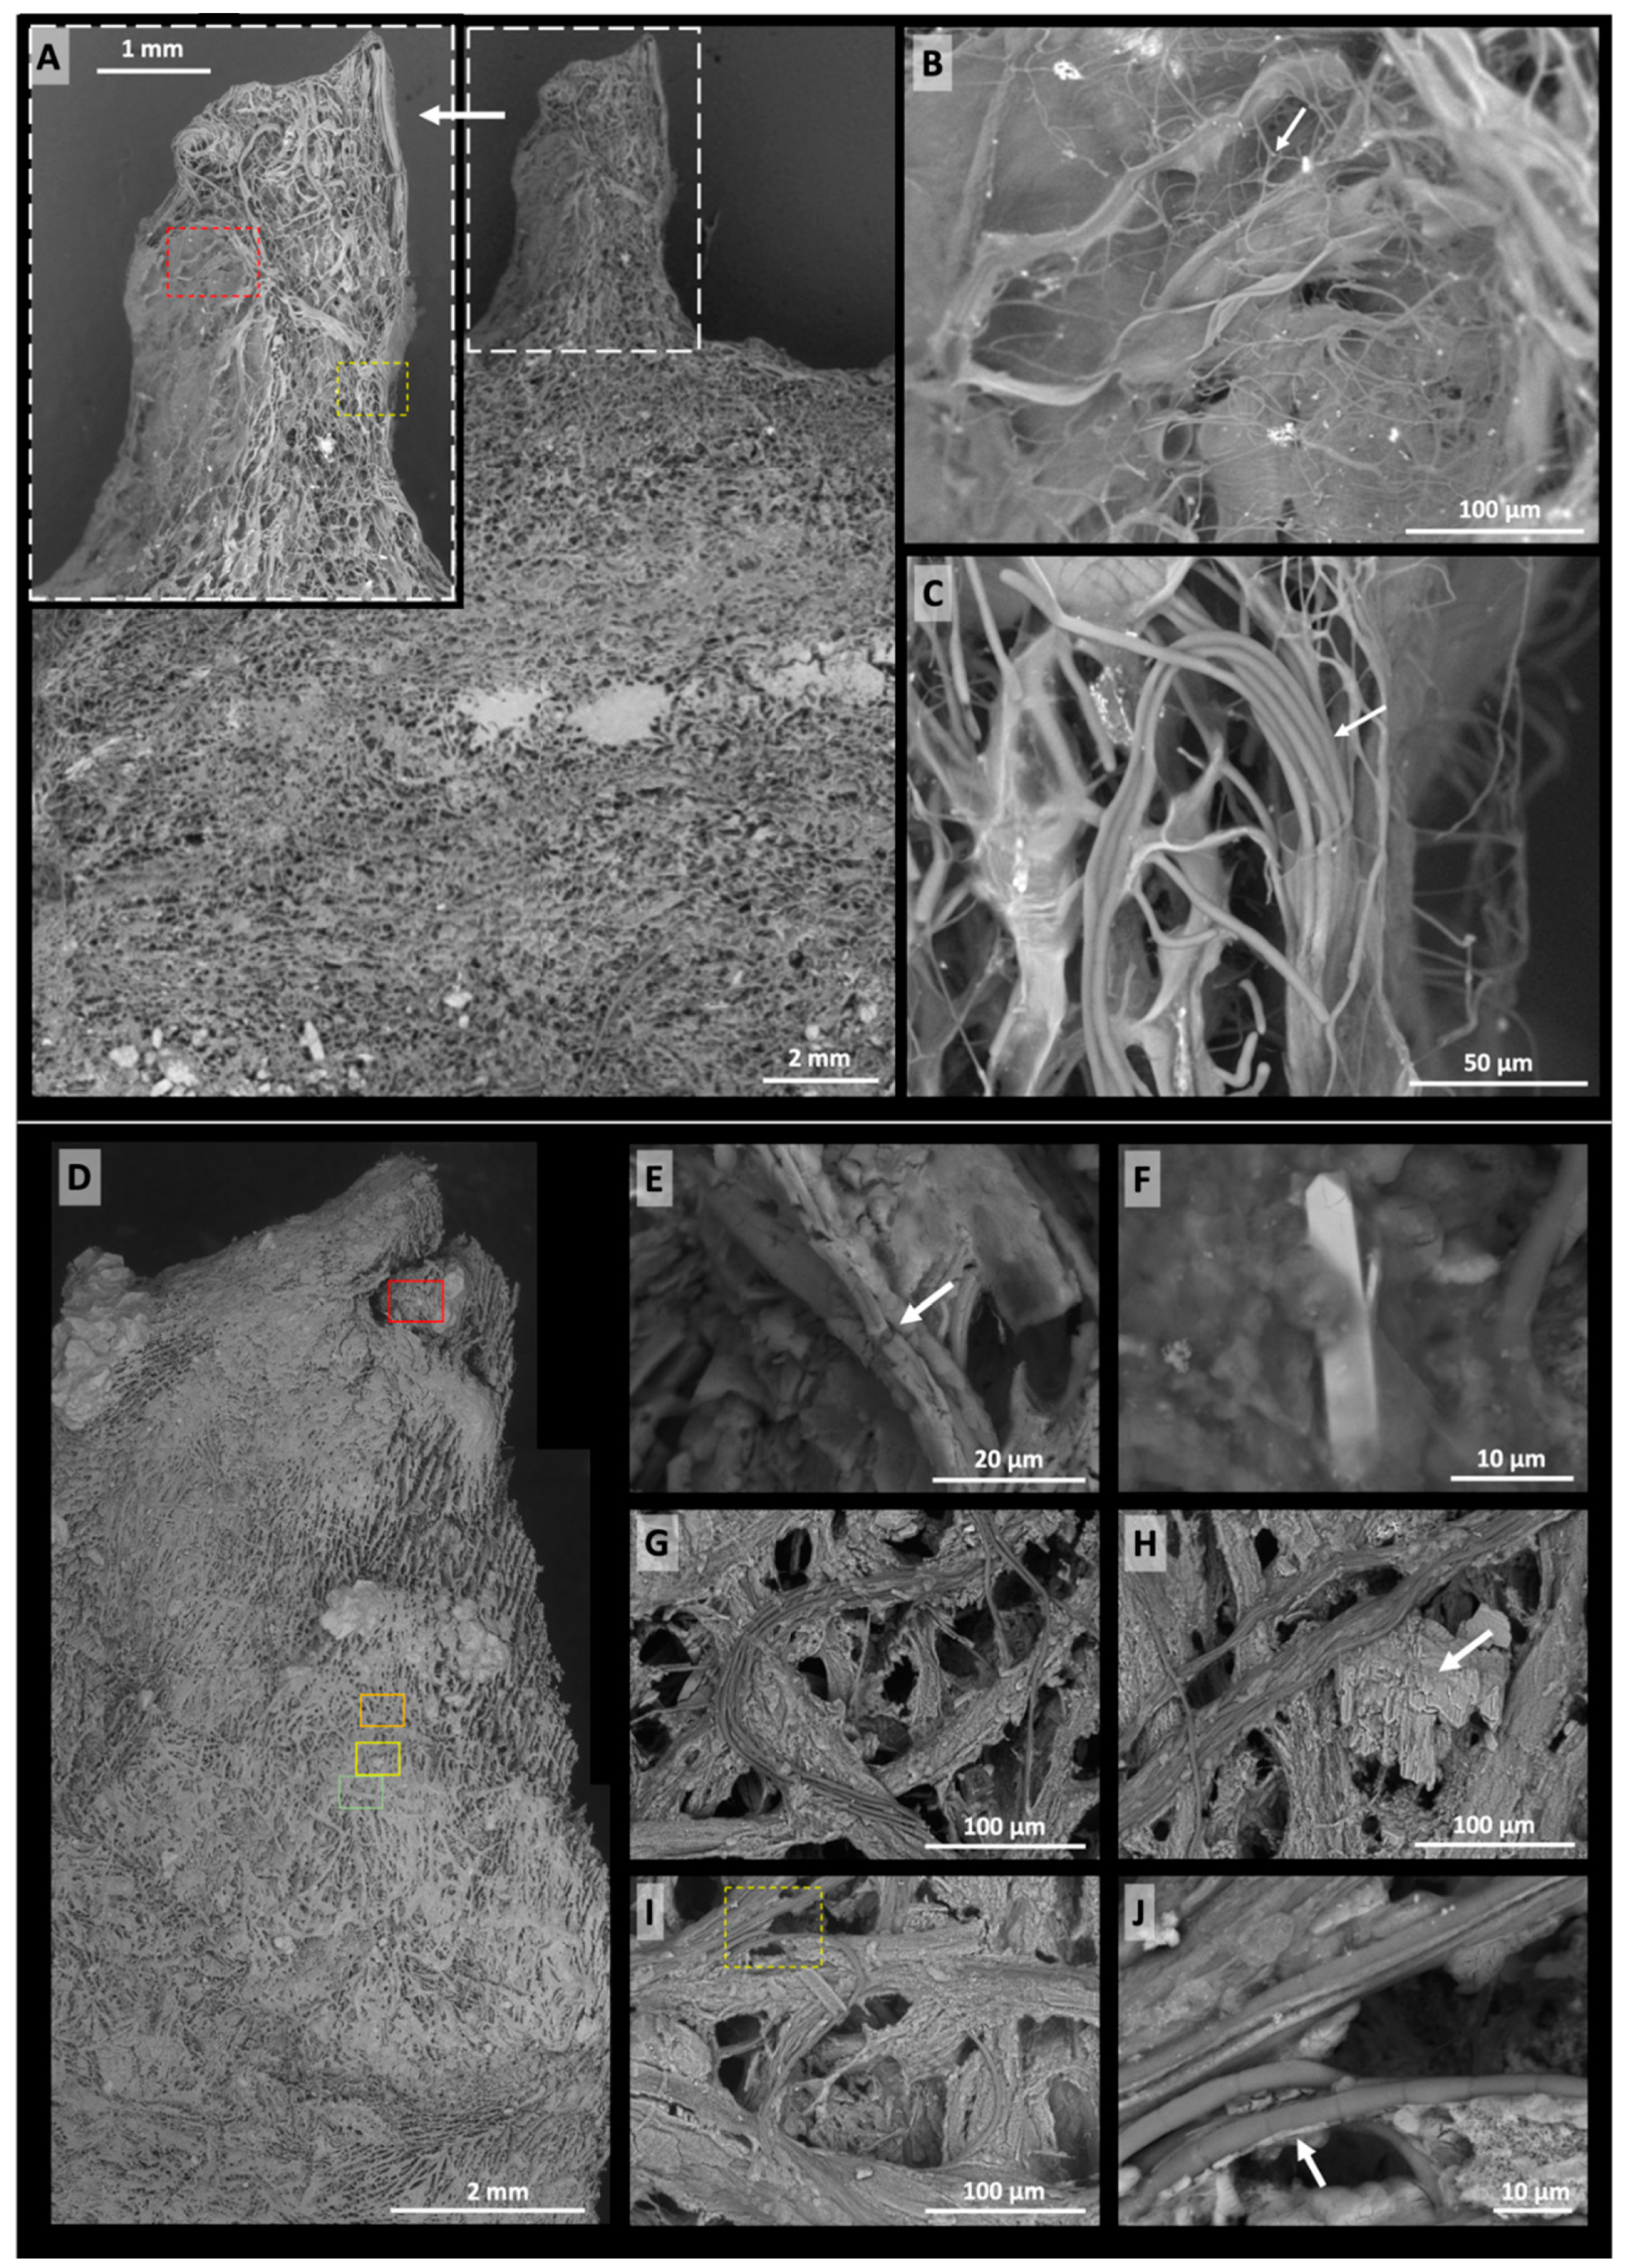
- Since heavy metal enrichments (Cu, Fe, Mn) give rise to density contrasts, X-ray µCT can corroborate this morphogenetic process, detecting the slight density differences between the denser sheath-EPS-Chloroflexus layer and the less dense Coleofasciculus layer (Figure 5), consistent with the binding of heavy elements in the former. Although only Cu is toxic, its sequestration co-locates with Mn and Fe, suggesting that the exuded EPS is non-specific in its capacity for metal binding (see [14,46]). (Figure 4E). Fe and Mn are not toxic to either of these organisms, but their downward diffusion is nonetheless limited by the ecophysiology of the microbial consortium. µCT shows that Coleofasciculus is the architect of the pinnacles, which grew out of the Coleofasciculus layer beneath (Figure 5B,E), consistent with its enhanced response to Cu toxicity. Pinnacle formation is thus a mitigation of toxicity stress. X-ray µCT also discerns the textures of density-distinct layers: horizontally and randomly oriented filaments in the inner region and vertically oriented filaments in the revetment (Figure 5).
- (iv)
- Although microbial mats from the same sampling locality and with the same initial community composition can develop superficially similar pinnacle or tuft-like morphologies in the presence of different geochemical stressors (i.e., toxic elements for samples 805-Cu and increased salinity for sample 1011), not all forcings create micromorphological features that can be distinguished by tomography and used as interpretative tools for fossil OSS morphogenesis. X-ray µCT cannot resolve density contrasts where no such contrasts exist, as in sample 1011 (Figure 6C) which, despite having experienced salinity stress, has not segregated its community (Figure 3D–J). Ergo, reactions to geochemical stresses may or may not bestow upon the geological record a detectable 3D morphology from which the causal stressor in a fossil example could be determined. Unlike many conical OSS, the supra-lamina complexities studied herein are not exclusively biophysical responses, but result from interactions with the environment over small temporal and spatial scales [25,30].
- (v)
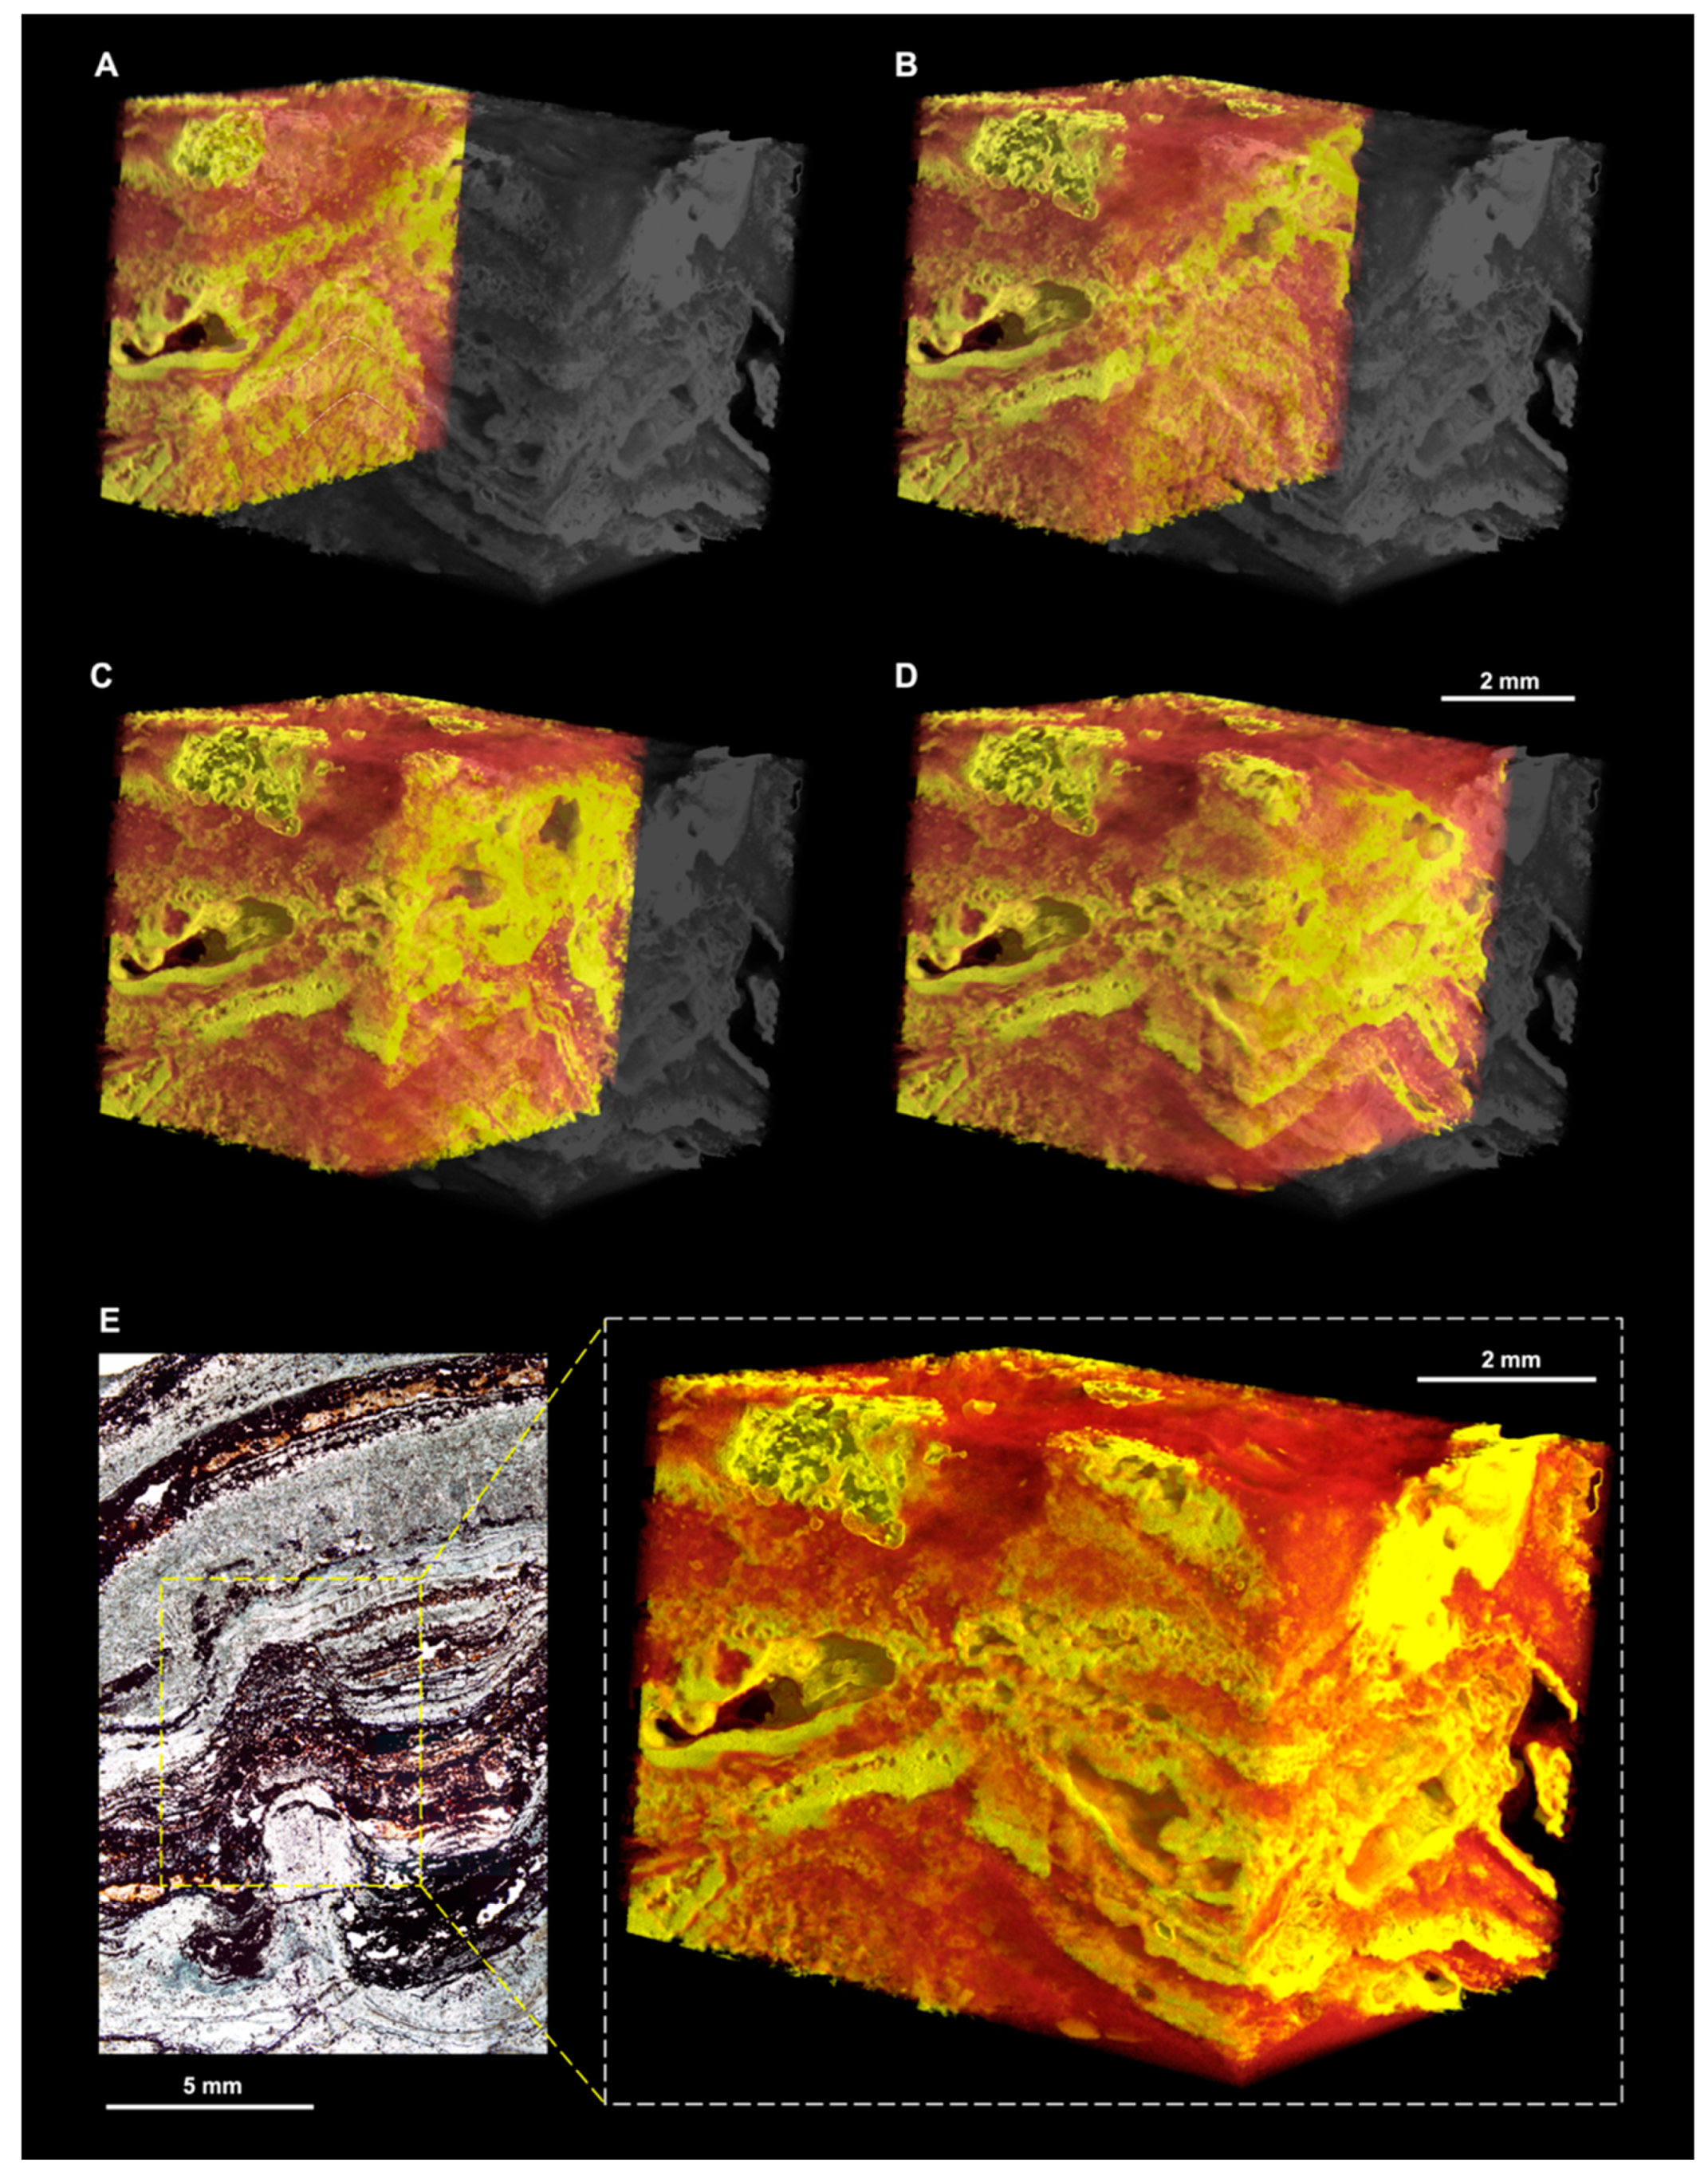
- X-ray µCT scans of two Precambrian OSS—samples DF1 and MM1—show that these ancient microbialites exhibit 3D characteristics that echo those in samples 805 and 1011. The comparison is particularly close, despite some recrystallisation, in the case of the Dresser Formation domical–conical stromatolites (DF1) and sample 805-Cu. Both feature two-layer microstructures consisting of a poorly laminated central region (the cone/pinnacle) surrounded by a revetment. The Middle Marker mats (MM1), contrastingly, can be compared qualitatively to sample 1011, but it is difficult to make conclusive statements concerning their morphogenesis, since the modern process analogue sample 1011 did not exhibit induced micromorphologies resulting directly from salinity stress.
- (vi)
- Both modern and Precambrian OSS exhibit multi-scale topographic complexities, e.g., pinnacles and cones atop flat-lying, undulating, or domical macrostructure. Morphologies in modern samples studied by µCT (pinnacles, cones and tufts) are supra-lamina complexities resulting from geochemical stresses over short timescales. These millimetric features, superimposed upon the macrostructure, may reflect either what Petroff et al. [30] called “growth in a randomly fluctuating environment” or intrinsically stochastic processes resulting from biofilm-scale complexities, for example, biofilm roughness, surface fractal dimension, biofilm compactness, and interior transport potential [47]. Similar structures in ancient OSS may be interpreted as having an equivalent morphogenesis.
4.2. Three-Dimensional Morphogenetic Biosignatures
4.3. Morphogenesis Reflecting Evolutionary Strategies Through Time
5. Conclusions
Author Contributions
Funding
Acknowledgments
Conflicts of Interest
References
- Walsh, M.M. Microfossils and possible microfossils from the Early Archean Onverwacht Group, Barberton Mountain Land, South Africa. Precambrian Res. 1992, 54, 271–293. [Google Scholar] [CrossRef]
- Hofmann, H.J.; Grey, K.; Hickman, A.H.; Thorpe, R.I. Origin of 3.45 Ga coniform stromatolites in Warrawoona Group, Western Australia. GSA Bull. 1999, 111, 1256–1262. [Google Scholar] [CrossRef]
- Noffke, N. Geobiology: Microbial Mats in Sandy Deposits from the Archaean Era to Today; Springer: Berlin/Heidelberg, Germany, 2010; p. 2010. [Google Scholar]
- Bosak, T.; Knoll, A.H.; Petroff, A.P. The meaning of stromatolites. Annu. Rev. Earth Planet. Sci. 2013, 41, 21–44. [Google Scholar] [CrossRef]
- Westall, F.; Campbell, K.A.; Bréhéret, J.G.; Foucher, F.; Gautret, P.; Hubert, A.; Sorieul, S.; Grassineau, N.; Guido, D.M. Archean (3.33 Ga) microbe-sediment systems were diverse and flourished in a hydrothermal context. Geology 2015, 43, 615–618. [Google Scholar] [CrossRef] [Green Version]
- Hickman-Lewis, K.; Garwood, R.J.; Brasier, M.D.; Goral, T.; Jiang, H.; McLoughlin, N.; Wacey, D. Carbonaceous microstructures of the 3.46 Ga stratiform ‘Apex chert’, Chinaman Creek locality, Pilbara, Western Australia. Precambrian Res. 2016, 278, 161–178. [Google Scholar] [CrossRef]
- Hickman-Lewis, K.; Cavalazzi, B.; Foucher, F.; Westall, F. Most Ancient Evidence for Life in the Barberton Greenstone Belt: Microbial Mats and Biofabrics of the ~3.47 Ga Middle Marker Horizon. Precambrian Res. 2018, 312, 45–67. [Google Scholar] [CrossRef]
- Gerdes, G.; Krumbein, W.E.; Reineck, H.E. Biolaminations – Ecological Versus Depositional Dynamics. In Cycles and Events in Stratigraphy; Einsele, G., Ricken, W., Seilacher, A., Eds.; Springer: Berlin, Germany, 1991; pp. 592–607. [Google Scholar]
- Gerdes, G.; Klenke, T. States of biogenic bedding as records of the interplay of ecologic time and environment (a case study of modern siliciclastic sediments, Mellum Island, southern North Sea). Senckenberg. Marit. 2007, 37, 129–144. [Google Scholar] [CrossRef]
- Awramik, S.M.; Grey, K. Stromatolites: Biogenicity, biosignatures, and bioconfusion. In Proceedings of SPIE, 5906, Astrobiology and Planetary Missions; International Society for Optics and Photonics: Bellingham, WA, USA, 2005; p. 5906. [Google Scholar]
- Nisbet, E.G.; Fowler, C.M.R. Archaean metabolic evolution of microbial mats. Proc. R. Soc. Lond. B 1999, 266, 2375–2382. [Google Scholar] [CrossRef] [Green Version]
- Lowe, D.R.; Tice, M.M. Tectonic controls on atmospheric, climatic, and biological evolution 3.5–2.4 Ga. Precambrian Res. 2007, 158, 177–197. [Google Scholar] [CrossRef]
- Knoll, A.H.; Bergmann, K.D.; Strauss, J.V. Life: The first two billion years. Philos. Trans. R. Soc. Lond. B 2016, 371. [Google Scholar] [CrossRef]
- Decho, A.W. Microbial biofilms in intertidal systems: An overview. Cont. Shelf Res. 2000, 20, 1257–1273. [Google Scholar] [CrossRef]
- Gautret, P.; De Wit, R.; Camoin, G.; Golubic, S. Are environmental conditions recorded by the organic matrices associated with precipitated calcium carbonate in cyanobacterial microbialites? Geobiology 2006, 4, 93–107. [Google Scholar] [CrossRef] [Green Version]
- Doemel, W.N.; Brock, T.D. Structure, growth and decomposition of laminated algal-bacterial mats in alkaline hot springs. Appl. Environ. Microbiol. 1977, 34, 433–452. [Google Scholar]
- Tice, M.M.; Lowe, D.R. The origin of carbonaceous matter in pre-3.0 Ga greenstone terrains: A review and new evidence from the 3.42 Ga Buck Reef Chert. Earth-Sci. Rev. 2006, 76, 259–300. [Google Scholar] [CrossRef]
- Homann, M.; Heubeck, C.; Airo, A.; Tice, M.M. Morphological adaptations of 3.22 Ga tufted microbial mats to Archean coastal habitats (Moodies Group, Barberton Greenstone Belt, South Africa). Precambrian Res. 2015, 266, 47–64. [Google Scholar] [CrossRef]
- Hofmann, H.J. Stromatolites: Characteristics and utility. Earth-Sci. Rev. 1973, 9, 339–373. [Google Scholar] [CrossRef]
- Verrecchia, E.P. Morphometry of microstromatolites in calcrete laminar crusts and a fractal model of their growth. Math. Geol. 1996, 28, 87–109. [Google Scholar] [CrossRef]
- Grotzinger, J.P.; Rothman, D.H. An abiotic model for stromatolite morphogenesis. Nature 1996, 383, 423–425. [Google Scholar] [CrossRef]
- Grotzinger, J.P.; Knoll, A.H. Stromatolites in Precambrian carbonates: Evolutionary mileposts or environmental dipsticks? Annu. Rev. Earth Planet. Sci. 1999, 27, 313–358. [Google Scholar] [CrossRef]
- Batchelor, M.T.; Burne, R.V.; Henry, B.I.; Watt, S.D. Deterministic KPZ model for stromatolite laminae. Physica A 2000, 282, 123–136. [Google Scholar] [CrossRef]
- Batchelor, M.T.; Burne, R.V.; Henry, B.I.; Watt, S.D. Mathematical and image analysis of stromatolite morphogenesis. Math. Geol. 2003, 35, 789–803. [Google Scholar] [CrossRef]
- Batchelor, M.T.; Burne, R.V.; Henry, B.I.; Jackson, M.J. A case for biotic morphogenesis of coniform stromatolites. Physica A 2004, 337, 319–326. [Google Scholar] [CrossRef] [Green Version]
- Dupraz, C.; Pattisina, R.; Verrecchia, E. Translation of energy into morphology: Simulation of stromatolite morphospace using a stochastic model. Sediment. Geol. 2006, 185, 185–203. [Google Scholar] [CrossRef] [Green Version]
- Bosak, T.; Greene, S.; Newman, D.K. A likely role for anoxygenic photosynthetic microbes in the formation of ancient stromatolites. Geobiology 2007, 5, 119–126. [Google Scholar] [CrossRef] [Green Version]
- Bosak, T.; Bush, J.W.M.; Flynn, M.R.; Liang, B.; Ono, S.; Petroff, A.P.; Sim, M.S. Formation and stability of oxygen-rich bubbles that shape photosynthetic mats. Geobiology 2010, 8, 45–55. [Google Scholar] [CrossRef]
- Petroff, A.P.; Sim, M.S.; Maslov, A.; Krupenin, M.; Rothman, D.H.; Bosak, T. Biophysical basis for the geometry of conical stromatolites. Proc. Natl. Acad. Sci. USA 2010, 107, 9956–9961. [Google Scholar] [CrossRef] [Green Version]
- Petroff, A.P.; Beukes, N.J.; Rothman, D.H.; Bosak, T. Biofilm growth and fossil form. Phys. Rev. X 2013, 3, 041012. [Google Scholar] [CrossRef]
- Tice, M.M.; Thornton, D.C.O.; Pope, M.C.; Olszewski, T.D.; Gong, J. Archean microbial mat communities. Annu. Rev. Earth Planet. Sci. 2011, 39, 297–319. [Google Scholar] [CrossRef]
- Sim, M.S.; Liang, B.; Petroff, A.P.; Evans, A.; Klepac-Ceraj, V.; Flannery, D.T.; Walter, M.R.; Bosak, T. Oxygen-dependent morphogenesis of modern clumped photosynthetic mats and implications for the Archean stromatolite record. Geosciences 2012, 2, 235–529. [Google Scholar] [CrossRef]
- Reid, R.P.; James, N.P.; Macintyre, I.G.; Dupraz, C.P.; Burne, R.V. Shark Bay stromatolites: Microfabrics and reinterpretations of origins. Facies 2003, 9, 243–270. [Google Scholar]
- Burne, R.V.; Moore, L.S. Microbialites: Organosedimentary deposits of benthic microbial communities. Palaios 1987, 2, 241–254. [Google Scholar] [CrossRef]
- Kardar, M.; Parisi, G.; Zhang, Y.-C. Dynamic scaling of growing interfaces. Phys. Rev. Lett. 1986, 56, 889. [Google Scholar] [CrossRef]
- Cuerno, R.; Escudero, C.; García-Ruiz, J.-M.; Herrero, M.A. Pattern formation in stromatolites: Insights from mathematical modelling. Journal of the Royal Society: Interface 2012, 9, 1051–1062. [Google Scholar] [CrossRef]
- Siegesmund, M.A.; Johansen, J.R.; Karsten, U.; Friedl, T. Coleofasciculus gen. nov. (cyanobacteria): Morphological and molecular criteria for revision of the genus Microcoleus Gomont. J. Phycol. 2008, 44, 1572–1585. [Google Scholar] [CrossRef]
- Gorbunov, M.Y.; Falkowski, P.G. Fluorescence induction and relaxation (FIRe) technique and instrumentation for monitoring photosynthetic processes and primary production in aquatic ecosystems. In Photosynthesis: Fundamental Aspects to Global Perspectives; Van der Est, A., Bruce, D., Eds.; Alliance Communications Group: Lawrence, KS, USA, 2004; pp. 1029–1031. [Google Scholar]
- Fetisova, Z.G.; Freiberg, A.M.; Timpmann, K.E. Long-range molecular order as an efficient strategy for light harvesting in photosynthesis. Nature 1988, 334, 633–634. [Google Scholar] [CrossRef]
- Buick, R.; Dunlop, J.; Groves, D. Stromatolite recognition in ancient rocks: An appraisal of irregularly laminated structures in an Early Archean chert-barite unit from North Pole, Western Australia. Alcheringia 1981, 5, 161–181. [Google Scholar] [CrossRef]
- Foucher, F.; Guimbretière, G.; Bost, N.; Westall, F. Petrographical and mineralogical applications of Raman mapping. In Raman Spectroscopy and Applications; Maaz, K., Ed.; Pakistan Institute of Nuclear Science and Technology: Nilore, Pakistan, 2017. [Google Scholar]
- Ketcham, R.A.; Carlson, W.D. Acquisition, optimization and interpretation of X-ray computed tomographic imagery: Applications to the geosciences. Comput. Geosci. 2011, 27, 381–400. [Google Scholar] [CrossRef]
- Baker, D.R.; Mancini, L.; Polacci, M.; Higgins, M.D.; Gualda, G.A.R.; Hill, R.J.; Rivers, M.L. An introduction to the application of X-ray microtomography to the three-dimensional study of igneous rocks. Lithos 2012, 148, 262–276. [Google Scholar] [CrossRef]
- Sutton, M.; Rahman, I.; Garwood, R.J. Techniques for Virtual Palaeontology; Wiley-Blackwell: Hoboken, NJ, USA, 2014; p. 208. [Google Scholar]
- Noffke, N.; Christian, D.; Wacey, D.; Hazen, R.M. Microbially induced sedimentary structures recording an ancient ecosystem in the ca. 3.48 billion-year-old Dresser Formation, Pilbara, Western Australia. Astrobiology 2013, 13, 1103–1124. [Google Scholar] [CrossRef]
- Gupta, P.; Diwan, B. Bacterial Exopolysaccharide mediated heavy metal removal: A Review on biosynthesis, mechanism and remediation strategies. Biotechnol. Rep. 2017, 13, 58–71. [Google Scholar] [CrossRef]
- Picioreanu, C.; van Loosdrecht, M.C.M.; Heijnen, J.J. Mathematical modeling of biofilm structure with a hybrid differential-discrete cellular automaton approach. Biotechnol. Bioeng. 1998, 58, 101–116. [Google Scholar] [CrossRef]
- Karatan, E.; Watnick, P. Signals, regulatory networks, and materials that build and break bacterial biofilms. Microbiol. Mol. Biol. Rev. 2009, 72, 310–347. [Google Scholar] [CrossRef]
- Decho, A.W.; Frey, R.; Ferry, J. Chemical challenges to bacterial AHL signaling in the environment. Chem. Rev. 2011, 111, 86–99. [Google Scholar] [CrossRef]
- Busscher, H.J.; van der Mei, H.C. How do bacteria know they are on a surface and regulate their response to an adhering state? PLoS Pathog. 2012, 8, e1002440. [Google Scholar] [CrossRef]
- Decho, A.W. Microbial exopolymer secretions in ocean environments: Their role(s) in food webs and marine processes. Oceanogr. Mar. Sci. Annu. Rev. 1990, 28, 73153. [Google Scholar]
- Williams, R.J.P. Chemical selection of elements by cells. Coord. Chem. Rev. 2001, 216–217, 583–595. [Google Scholar] [CrossRef]
- Frausto da Silva, J.J.R.; Williams, R.J.P. The Biological Chemistry of the Elements; Oxford University Press: Oxford, UK, 2011; p. 600. [Google Scholar]
- Geesey, G.G.; Jang, L. Interactions between metal ions and capsular polymers. In Metal Ions and Bacteria; Beveridge, T.J., Doyle, R.J., Eds.; John Wiley and Sons: New York, NY, USA, 1989; pp. 325–358. [Google Scholar]
- Schultze-Lam, S.; Fortin, D.; Davis, B.S.; Beveridge, T.J. Mineralization of bacterial surfaces. Chem. Geol. 1993, 132, 171–181. [Google Scholar] [CrossRef]
- Loaëc, M.; Olier, R.; Guezennec, J. Chelating properties of bacterial exopolysaccharides from deep-sea hydrothermal vents. Carbohydr. Polym. 1998, 35, 65–70. [Google Scholar] [CrossRef]
- Margulis, L.; Barghoorn, E.S.; Ashendorf, D.; Banerjee, S.; Chase, D.; Francis, S.; Giovannoni, S.; Stolz, J. The microbial community in the layered sediments at Laguna Fugueroa, Baja California, Mexico: Does it have Precambrian analogues? Precambrian Res. 1983, 11, 93–123. [Google Scholar] [CrossRef]
- Juniper, S.K.; Martineu, P.; Sarrazin, J.; Gélinas, Y. Microbial-mineral floc associated with nascent hydrothermal activity on CoAxial Segment, Juan de Fuca Ridge. Geophys. Res. Lett. 1995, 22, 179–182. [Google Scholar] [CrossRef]
- Cameron, V.; House, C.H.; Brantley, S.L. A first analysis of metallome biosignatures of hyperthermophilic archaea. Archaea 2012, 2012. [Google Scholar] [CrossRef] [PubMed]
- Zerkle, A.L.; House, C.H.; Brantley, S.L. Biogeochemical signatures through time as inferred from whole microbial genomes. Am. J. Sci. 2005, 305, 467–502. [Google Scholar] [CrossRef]
- Robbins, L.J.; Lalonde, S.V.; Planavsky, N.J.; Partin, C.A.; Reinhard, C.T.; Kendall, B.; Scott, C.; Hardisty, D.S.; Gill, B.C.; Alessi, D.S.; et al. Trace elements at the intersection of marine biological and geochemical evolution. Earth-Sci. Rev. 2016, 163, 323–348. [Google Scholar] [CrossRef]
- Moore, E.K.; Jelen, B.I.; Giovannelli, D.; Raanan, H.; Falkowski, P.G. Metal availability and the expanding network of microbial metabolisms in the Archaean eon. Nat. Geosci. 2017, 10, 629–636. [Google Scholar] [CrossRef]
- Armendariz, A.L.; Talano, M.A.; Wevar Oller, A.L.; Medina, M.I.; Agostini, E. Effect of arsenic on tolerance mechanisms of two plant growth-promoting bacteria used as biological inoculants. J. Environ. Sci. 2015, 33, 203–210. [Google Scholar] [CrossRef] [PubMed]
- Nocelli, N.; Bogino, P.C.; Banchio, E.; Giordano, W. Roles of Extracellular polysaccharides and biofilm formation in heavy metal resistance of Rhizobia. Materials 2016, 9, 418. [Google Scholar] [CrossRef] [PubMed]
- Sánchez-Román, M.; Fernaández-Remolar, D.; Amils, R.; Saánchez-Nava, A.; Schmid, T.; Martin-Uriz, P.S.; Rodríguez, N.; McKenzie, J.A.; Vasconcelos, C. Microbial mediated formation of Fe-carbonate minerals under extreme acidic conditions. Sci. Rep. 2014, 4, 4767. [Google Scholar] [CrossRef] [PubMed] [Green Version]
- Orange, F.; Disnar, J.-R.; Gautret, P.; Westall, F.; Bienvenu, N.; Lottier, N.; Prieur, D. Preservation and Evolution of organic matter during experimental fossilisation of the hyperthermophilic Archaea Methanocaldococcus jannaschii. Orig. Life Evolut. Biosph. 2012, 42, 587–609. [Google Scholar] [CrossRef]
- Walter, M.R.; Buick, R.; Dunlop, J.S.R. Stromatolites 3400–3500 Myr old from the North Pole area, Western Australia. Nature 1980, 284, 443–445. [Google Scholar] [CrossRef]
- Ueno, Y.; Maruyama, S.; Isozaki, Y.; Yurimoto, H. Early Archean (ca. 3.5 Ga) microfossils and 13C-depleted carbonaceous matter in the North Pole area, Western Australia: Field occurrence and geochemistry. In Geochemistry and the Origin of Life; Nakashima, S., Maruyama, S., Brack, A., Windley, B.F., Eds.; Universal Academy Press Inc.: Tokyo, Japan, 2001; pp. 201–236. [Google Scholar]
- Lanier, W.P. Approximate growth rates of Early Proterozoic Microstromatolites as deduced by biomass productivity. Palaios 1986, 1, 525–542. [Google Scholar] [CrossRef]
- Kazmierczak, J.; Kempe, S. Genuine modern analogues of Precambrian stromatolites from caldera lakes of Niuafo’ou Island, Tonga. Naturwissenschaften 2006, 93, 119–126. [Google Scholar] [CrossRef] [PubMed]
- Allwood, A.C.; Walter, M.R.; Burch, I.W.; Kamber, B.S. 3.43 billion-year-old stromatolite reef from the Pilbara Craton of western Australia: Ecosystem-scale insights to early life on Earth. Precambrian Res. 2007, 158, 198–227. [Google Scholar] [CrossRef]
- Harwood, C.L.; Sumner, D.Y. Origins of microbial microstructures in the Neoproterozoic Back Spring Dolomite: Variations in microbial community and timing of lithification. J. Sediment. Res. 2012, 82, 709–722. [Google Scholar] [CrossRef]
- de Wit, M.; Hart, R.; Martin, A.; Abbott, P. Archean abiogenic and probable biogenic structures associated with mineralized hydrothermal vent systems and regional metasomatism, with implications for greenstone belt studies. Econ. Geol. 1982, 77, 1783–1802. [Google Scholar] [CrossRef]
- Lindsay, J.F.; Brasier, M.D.; McLoughlin, N.; Green, O.R.; Fogel, M.; Steele, A.; Mertzman, S.A. The problem of deep carbon—An Archean paradox. Precambrian Res. 2005, 143, 1–22. [Google Scholar] [CrossRef]
- McLoughlin, N.; Wilson, L.A.; Brasier, M.D. Growth of synthetic stromatolites and wrinkle structures in the absence of microbes – Implications for the early fossil record. Geobiology 2008, 6, 95–105. [Google Scholar] [CrossRef] [PubMed]
- Shepard, R.N.; Sumner, D.Y. Undirected motility of filamentous cyanobacteria produces reticulate mats. Geobiology 2010, 8, 179–190. [Google Scholar] [CrossRef]
- Flannery, D.T.; Walter, M.R. Archean tufted microbial mats and the Great Oxidation Event: New insights into an ancient problem. Aust. J. Earth Sci. 2011, 59, 1–11. [Google Scholar] [CrossRef]
- Williams, R.J.P.; Frausto da Silva, J.J.R. Evolution was chemically constrained. J. Theor. Biol. 2003, 220, 323–343. [Google Scholar] [CrossRef]
- Hofmann, A. Archaean hydrothermal systems in the Barberton greenstone belt and their significance as a habitat for early life. In Earliest Life on Earth: Habitats, Environments and Methods of Detection; Golding, S.D., Glikson, M., Eds.; Springer Science and Business Media: Berlin, Germany, 2011; pp. 51–78. [Google Scholar]
- Buick, R. When did oxygenic photosynthesis evolve? Philos. Trans. R. Soc. Lond. B 2008, 363, 2731–2743. [Google Scholar] [CrossRef] [Green Version]
- Sforna, M.C.; Philippot, P.; Somogyi, A.; van Zuilen, M.A.; Medjoubi, K.; Schoepp-Cothenet, B.; Nitschke, W.; Visscher, P.T. Evidence for arsenic metabolism and cycling by organisms 2.7 billion years ago. Nat. Geosci. 2014, 7, 811–815. [Google Scholar] [CrossRef]


© 2019 by the authors. Licensee MDPI, Basel, Switzerland. This article is an open access article distributed under the terms and conditions of the Creative Commons Attribution (CC BY) license (http://creativecommons.org/licenses/by/4.0/).
Share and Cite
Hickman-Lewis, K.; Gautret, P.; Arbaret, L.; Sorieul, S.; De Wit, R.; Foucher, F.; Cavalazzi, B.; Westall, F. Mechanistic Morphogenesis of Organo-Sedimentary Structures Growing Under Geochemically Stressed Conditions: Keystone to Proving the Biogenicity of Some Archaean Stromatolites? Geosciences 2019, 9, 359. https://doi.org/10.3390/geosciences9080359
Hickman-Lewis K, Gautret P, Arbaret L, Sorieul S, De Wit R, Foucher F, Cavalazzi B, Westall F. Mechanistic Morphogenesis of Organo-Sedimentary Structures Growing Under Geochemically Stressed Conditions: Keystone to Proving the Biogenicity of Some Archaean Stromatolites? Geosciences. 2019; 9(8):359. https://doi.org/10.3390/geosciences9080359
Chicago/Turabian StyleHickman-Lewis, Keyron, Pascale Gautret, Laurent Arbaret, Stéphanie Sorieul, Rutger De Wit, Frédéric Foucher, Barbara Cavalazzi, and Frances Westall. 2019. "Mechanistic Morphogenesis of Organo-Sedimentary Structures Growing Under Geochemically Stressed Conditions: Keystone to Proving the Biogenicity of Some Archaean Stromatolites?" Geosciences 9, no. 8: 359. https://doi.org/10.3390/geosciences9080359