Validation of Dive Foraging Indices Using Archived and Transmitted Acceleration Data: The Case of the Weddell Seal
 Karine Heerah
 Sam L. Cox
 Pierre Blevin1
  Christophe Guinet
 Jean-Benoît Charrassin
- 1Centre d'Etude Biologique de Chizé, UMR 7372 CNRS, Villers-en-Bois, France
- 2UMR 7159 CNRS-IRD-MNHN, LOCEAN-IPSL, Sorbonne Université, Paris, France
- 3Centre National d'Études Spatiales, Toulouse, France
- 4MARBEC (Institut de Recherche pour le Développement), Sète, France
Dive data collected from archival and satellite tags can provide valuable information on foraging activity via the characterization of movement patterns (e.g., wiggles, hunting time). However, a lack of validation limits interpretation of what these metrics truly represent in terms of behavior and how predators interact with prey. Head-mounted accelerometers have proven to be effective for detecting prey catch attempt (PrCA) behaviors, and thus can provide a more direct measure of foraging activity. However, device retrieval is typically required to access the high-resolution data they record, restricting use to animals returning to predictable locations. In this study, we present and validate data obtained from newly developed satellite-relay data tags, capable of remotely transmitting summaries of tri-axial accelerometer measurements. We then use these summaries to assess foraging metrics generated from dive data only. Tags were deployed on four female Weddell seals in November 2014 at Dumont d'Urville, and successfully acquired data over ~2 months. Retrieved archival data for one individual, and transmitted data for four individuals were used to (1) compare and validate abstracted accelerometer transmissions against outputs from established processing procedures, and (2) assess the validity of previously developed dive foraging indices, calculated solely from time-depth measurements. We found transmitted estimates of PrCA behaviors were generally comparable to those obtained from archival processing, although a small but consistent over-estimation was noted. Following this, dive foraging segments were identified either from (1) sinuosity in the trajectories of high-resolution depth archives, or (2) vertical speeds between low resolution transmissions of key depth inflection points along a dive profile. In both cases, more than 93% of the estimated PrCA behaviors (from either abstracted transmissions or archival processing) fell into inferred dive foraging segments (i.e., “hunting” segments), suggesting the two methods provide a reliable indicator of foraging effort. The validation of transmitted acceleration data and foraging indices derived from time-depth recordings for Weddell seals offers new avenues for the study of foraging activity and dive energetics. This is especially pertinent for species from which tag retrieval is challenging, but also for the post-processing of the numerous low-resolution dive datasets already available.
Introduction
Foraging is a crucial behavior for animals, because obtaining adequate food supply is a basic requirement for all other life-history traits, such as survival, growth and reproduction (Stephens and Krebs, 1986). In marine environments, air-breathing diving predators must find, within the physiological constraints of breath-hold, resources that are heterogeneously distributed in patches across a 3-dimensional dynamic environment (Kooyman and Ponganis, 1998; Benoit-Bird et al., 2013; Goldbogen et al., 2015). In such instances, this selective force is likely very strong. Species may thus adopt foraging strategies and select environmental features associated with the resources needed to maximize reproductive success and survival (i.e., fitness) (MacArthur and Pianka, 1966; Charnov, 1976; Stearns, 1992; Krausman, 1999).
Studying predator-prey interactions is crucial to better understanding the sensory and energetic avenues air-breathing marine predators adopt to maximize resource acquisition in relation to their environment. Despite the importance of measuring foraging activity to this, its quantification in these animals is challenging because they spend most of their time at sea, and often feed on prey aggregated at depth. Consequently, we are only beginning to understand the fine-scale feeding behavior and energy acquisition of many marine predators (Carter et al., 2016). With satellite and archival time-depth recorders, foraging is typically inferred from movement patterns, diving metrics and distinctive dive shapes (Le Boeuf et al., 1988; Wilson et al., 1996; Schreer et al., 2001; Heerah et al., 2017). The fine-scale foraging behaviors of marine predators have also been investigated using esophageal and stomach temperature sensors (Wilson et al., 1995; Charrassin et al., 2001; Horsburgh et al., 2008), Hall sensors (i.e., jaw magnets) and accelerometers (to detect mouth opening events; Wilson et al., 2002; Viviant et al., 2009; Naito et al., 2010) as well as with video cameras (Hooker et al., 2002; Machovsky-Capuska et al., 2011; Naito et al., 2013). Recently, miniaturized head-mounted accelerometers have proven to be effective for detecting prey capture attempts in pinnipeds and penguins, as well as quantifying the energetic expenses associated with diving and foraging (Gleiss et al., 2011; Watanabe and Takahashi, 2013; Ydesen et al., 2014; Volpov et al., 2015; Jeanniard-du-Dot et al., 2016a,b; Jouma'a et al., 2016).
The technological and analytical advances provided by this newer generation of devices (accelerometers and cameras) can yield invaluable information on the strategies marine predators adopt to maximize energy gains in relation to their surrounding environment (Austin et al., 2006; Goldbogen et al., 2011; Guinet et al., 2014; Richard et al., 2016). However, obtaining measured information typically requires device retrieval (Carter et al., 2016). This restricts use to species that return to predictable locations (e.g., central place foragers, such as breeding pinnipeds and seabirds) and limits the validation of more commonly used dive foraging indices. Consequently, studies investigating the fine scale foraging strategies of air breathing marine predators, predator-prey interactions and/or energetic budgets are scarce for individuals/species that spend extended periods at sea and return to inaccessible locations that prevent device retrieval (e.g., sea-ice obligate seal species; e.g., harp [Pagophilus groenlandicus], hooded [Cystophora cristata], leopard [Hydrurga leptonyx], and Weddell [Leptonychotes weddellii] seals; (Tynan et al., 2009; Heerah et al., 2017; Vacquie-Garcia et al., 2017).
Satellite Relay Data Loggers (SRDL), can transmit, via satellite (e.g., Argos CLS™ system, http://www.argos-system.org), data collected by archival loggers in near real time (Fedak et al., 2002; Boehme et al., 2009). However, the limited time and bandwidth available for data transmission at the surface, imposed by the animal's diving habits and the Argos CLS™ system, restrict the amount of data that can be sent (messages must be typically <248/256 bits; Fedak et al., 2002; Boehme et al., 2009; CLS, 2016). In the last decade, SRDLs have been widely used for transmitting degraded data on the behavior of marine predators, such as pinnipeds (e.g., dive depth and duration, swimming speed) and ocean data (e.g., temperature and salinity; Block et al., 2011; Fedak, 2013). Recently, a new generation of SRDLs capable of transmitting summarized tri-axial acceleration measurements alongside degraded dive profiles have been developed, and successfully tested on juvenile Southern elephant seals (Mirounga leonina) (Cox et al., 2018). These loggers represent an invaluable technological development as they provide novel access to inferences on predator-prey interactions, diving behavior and energetics in near real-time without having to retrieve the devices. This widens the range of species (e.g., non-central foragers) which can be studied along with the foraging, movement ecology questions that can be issued.
Capitalizing on these latest developments, we use this new generation of SRDLs to collect data on foraging activity in a sea-ice obligate species, the Weddell seal, for which device retrieval can be extremely difficult. We validate received transmissions from these devices using archival data uniquely retrieved from one individual, which we process using established high resolution accelerometer processing procedures (Viviant et al., 2009; Gallon et al., 2013; Richard et al., 2014; Vacquié-Garcia et al., 2015b; Cox et al., 2018). Following this, we assess the validity of previously developed dive foraging indices, calculated solely from time-depth measurements, against the received and validated accelerometer transmissions (Heerah et al., 2014, 2015). Weddell seals spend their entire life cycle around Antarctic sea-ice, spending most of their time resting on or foraging under the sea-ice in areas that are logistically challenging to access. In addition, previous studies have shown they adopt complex diving behaviors, which may complicate the use of commonly used dive metrics to accurately infer foraging activity (Heerah et al., 2014, 2015). Validation of such methods offers new avenues to investigate the diving and foraging behaviors of this and other remote free-ranging marine species and analyse the numerous low-resolution dive datasets already available.
Materials and Methods
Tag Deployment and Specifications
Animal Handling
Four adult female Weddell seals (mass: 343 ± 41 kg, length: 242 ± 7 cm, mean ± SE, Table 1) were captured at Dumont D'Urville (DDU) in East Antarctica (66°40S 140°E) in late November 2014, which is after pup rearing and before molting. Capture and tagging procedures were similar to those described in Heerah et al. (2013) and were approved by the TAAF (French sub-Antarctic and Antarctic territories) ethic committee (authorization # 2014-134, 15/10/2014). Seals were equipped with a new generation of satellite relayed data loggers (SRDLs) known as DSA tags (SCOUT-DSA-296 tag, Wildlife Computer; Cox et al., 2018). These were head mounted on the Weddell seals.
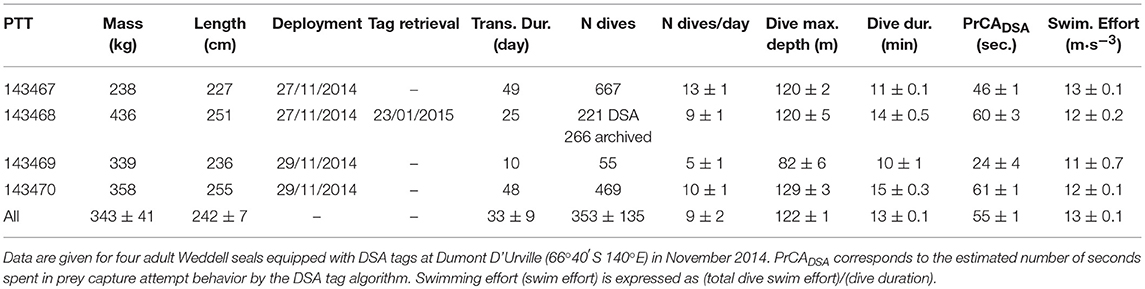
Table 1. General information on tag deployment and transmission outputs.
DSA Tags
The DSA tag measures 86*85*29 mm and weighs 192 g (see also Cox et al., 2018). It comprises an Argos transmitter, alongside pressure sensor (recording rate of 1 Hz, resolution of 0.5 m and accuracy of ±1 m + 1% of a reading), tri-axial accelerometer (recording rate of 16 Hz) and wet-dry sensor. Dives were defined as events that lasted at least 60 s with a maximum depth that exceeded 15 m.
Data Outputs From a DSA Tag
Dives were (1) archived, and (2) then processed on-board to create a dive summary, which was later transmitted via the Argos satellite system [Figures 1, 2A (archived dive) and d (transmitted DSA dive)]. These dive summaries were composed of five dive segments. These were defined by identifying the four most characteristic inflection points along a dive profile via a broken stick algorithm (Fedak et al., 2002). For each dive segment, the total time spent performing prey catch attempt (PrCA) behaviors, and the total swimming effort were calculated using an algorithm directly implemented within the DSA tag. DSA algorithms were based on simplified procedures of established techniques (Viviant et al., 2009; e.g., Richard et al., 2014; Vacquié-Garcia et al., 2015a).
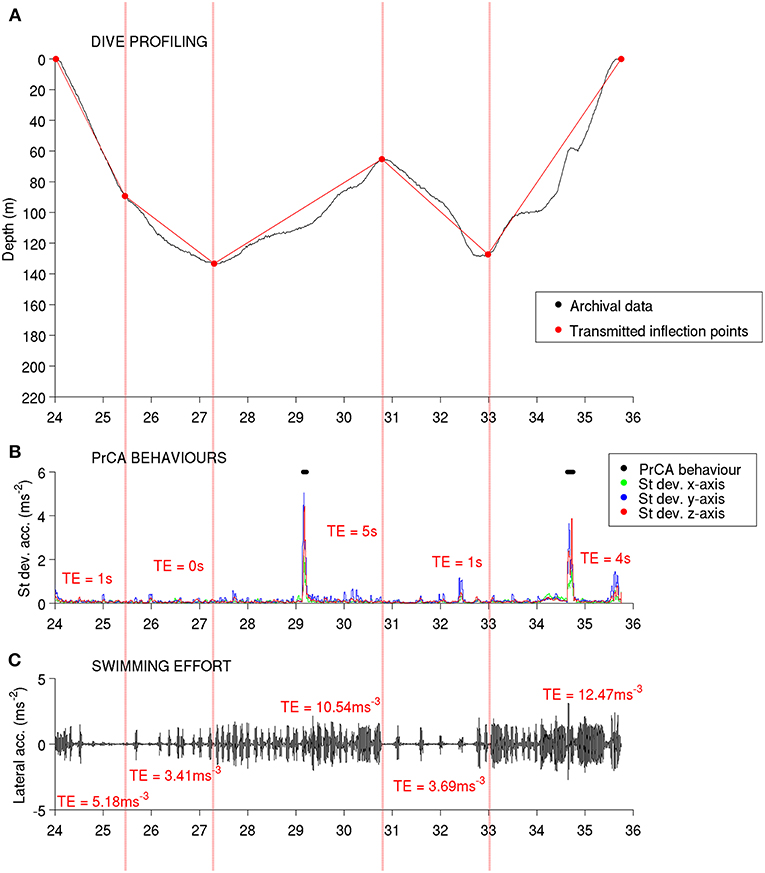
Figure 1. Overview of the high-resolution archives (prior to summarizing) and associated DSA tag data transmissions from one example dive. Red dotted partitions from left to right correspond to each segment [1–5, respectively; identified via an on-board broken-stick algorithm (BSDSA)]. From top to bottom: (A) depth measurements from high-resolution archives in black and reconstructions from transmitted BSDSA inflection points in red, (B) standard deviations in acceleration from high-resolution archives along the three axes (green = x, blue = y and red = z) with identified PrCAarchival behaviors marked by black dots, and (C) filtered lateral (y) accelerations from high resolution archival data showing stroke amplitudes and rates (used to estimate swimming effort). Red text (B,C) corresponds to transmitted estimates (TE) for each segment.
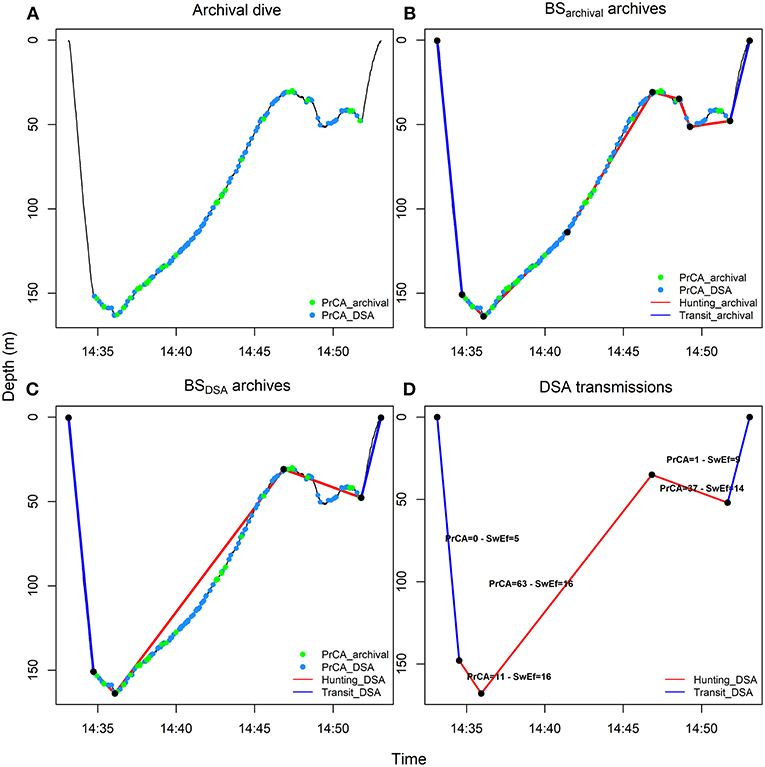
Figure 2. From high-resolution to low-resolution dive profiles. High-resolution archived dives (A) were summarized by an optimal number of inflection points (BSarchival archives) (B, see methods and Heerah et al., 2014) and degraded in SRDL low-resolution dives (BSDSA summarized archives) (C, see methods and Heerah et al., 2015). The corresponding dives were also transmitted, along with the associated swimming efforts (Swim effort, expressed in m·s−3) and time spent in PrCADSA behaviors per segment (D) (see also Figure 1). For the later, acceleration records were automatically processed on board the DSA tag before transmission. Red lines represent broken stick segments associated with huntingarchival (B, sinuous phases of high-resolution dives, 0 < vertical sinuosity < 0.9) or huntingDSA (C,D, segments associated with reduced vertical velocity of low-resolution dives, vertical velocity ≤ 0.5 m·s−1) behaviors. Conversely, blue lines represent segments associated with transitarchival (B, straighter phases of high-resolution dives, 0.9 ≤ vertical sinuosity ≤ 1) or transitDSA (C,D, segments associated with increased vertical velocity of low-resolution dives, vertical velocity > 0.5 m·s−1) behaviors. The green and blue dots indicate seconds spent in PrCAarchival (estimates from high-resolution archives using well established algorithms) and PrCADSA (estimates from DSA algorithm before transmission) behaviors, respectively.
For the total time spent in PrCA behaviors, accelerations along the x, y and z axes were used to calculate magnitude in acceleration as magAi = . Changes in magAi over 1 s periods were then calculated by summing the absolute values of the previous 16 successive magAiestimates to give a per second measure of variance, varS, as . A running average across 11 s was then applied to the time series of varS to produce varA, which represents a per second average variance in acceleration. PrCA behaviors occurred when varSi ≥ varAi + thresV, where thresV is a user selectable threshold, here of 5
For total swimming effort, accelerations from the lateral y-axis were high pass filtered using a second-order IIR Butterworth filter with a 3 dB cut-off set at 0.2 Hz. The absolute total of these accelerations was then taken as the swimming effort.
DSA simplified algorithms and their associated transmitted acceleration outputs (per dive segment summaries of PrCA and swimming effort; hereafter “DSA transmissions”) have been assessed and validated for adult and juvenile southern elephant seals (see full details in Cox et al., 2018). We did not have prior information on Weddell seal movements from accelerometers. Thus, where it was necessary to set specific thresholds for the DSA simplified algorithms, the same values as those determined via the analysis of female adult Southern elephant seal accelerometer data were used (see Cox et al., 2018). Female adult Southern elephant seals are comparable in size and weight to Weddell seals (Arnbom et al., 1993; Guinet, 1994; Guinet et al., 2014; Heerah, 2014) and so the transferal of thresholds is appropriate. The tag transmitted each dive summary a maximum of 10 times, with a minimum interval of 15 min between each uplink attempt. Tags were also set to allow for up to 200 total transmission attempts per 24 h to estimate seal locations. PrCA behavior was set to not exceed 100 s per dive segment, although post-hoc analyses showed that times spent in PrCA above 60 s per segment were not recorded (i.e., in practice a ceiling of 60 s per segment was applied).
Datasets and Pre-processing Analyses
The two analyses performed in this study were based on two main datasets. First, to assess and validate the DSA simplified algorithms for use on Weddell seals, we used DSA transmissions from one individual (#143468) and coupled these to high-resolution archives that were uniquely retrieved from this seal. It was not possible to retrieve archives from other seals due to the ice obligate behavior of this species. Second, to assess the validity of previously developed dive foraging indices calculated solely from time-depth measurements, these two datasets were used in combination with low-resolution DSA transmissions from a further three seals.
For the first analysis, the high-resolution archives included both detections of PrCA behaviors identified by the DSA simplified algorithms (hereafter “PrCADSA”), and tri-axial acceleration values. From these, high-resolution swimming effort and time spent in PrCA behaviors (hereafter “PrCAarchival”) were calculated using established processing procedures (see Cox et al., 2018 for full details). Briefly, to identify PrCA behaviors, high frequency dynamic accelerations, likely associated with rapid head movements, were isolated from gravitational forces along the three accelerometer axes using a third order high pass digital Butterworth filter of 2.64 Hz (Viviant et al., 2009; Guinet et al., 2014). Along each axis, standard deviations in acceleration were then calculated over a moving window of 1.5 s. K means clustering was used to group these standard deviations into “low” and “high” states. A PrCA behavior was considered to have occurred within a 1 s period when each of the three axes were in a “high” state at least once along the corresponding section of the 16 Hz resolution time series (Figure 1 Viviant et al., 2009; Guinet et al., 2014; Vacquié-Garcia et al., 2015a). Swimming efforts were taken by isolating flipper stroke rates and movement intensities. Accelerations along the lateral y-axis were high-pass filtered using a third-order band pass Butterworth filter, centered on the second peak in power intensity as identified from the power spectral density of the signal (between 0.48 and 1 Hz). Swimming effort at a 1 s resolution was then calculated as the absolute sum of peaks (and troughs) of flipper stroke accelerations with absolute amplitudes/intensities of at least 0.3 m/s2 (Richard et al., 2014).
For comparison to DSA transmissions, the high-resolution estimates of swimming effort and PrCAarchival were summarized in two ways, using a broken-stick (BS) algorithm. First, we used the high-resolution archives to generate a SRDL equivalent low-resolution dataset, by constraining the BS algorithm to retain only the four most informative inflection points, similarly to the algorithm implemented on-board the DSA tags [hereafter “BSDSA summarized archives” (Fedak et al., 2002; Heerah et al., 2015; Cox et al., 2018)]. For each segment, the total time spent in PrCA behaviors (in seconds) was taken as the sum of all PrCA behaviors detected in that segment. A per dive segment swimming effort was taken as the sum of all identified swimming effort associated accelerations during that segment divided by the duration of the segment. These BSDSA summarized archives were used for comparisons between the high-resolution archives and DSA transmissions as well as for calculating and validating a low-resolution foraging index from dive only data (“huntingDSA,” see below and Heerah et al., 2015). Second, we applied the BS method described in Heerah et al. (2014), to resume each dive into an optimal number of segments (hereafter “BSarchival archives”), from which we calculated a high-resolution index of foraging activity using established procedures (“huntingarchival,” see below and Heerah et al., 2014).
Validation of DSA On-Board Processing
To assess and validate the suitability of the DSA algorithms for Weddell seals, we compared DSA transmissions of PrCA behaviors (s) and swimming effort (ms−3), to time matched estimates from the BSDSA summarized archives (Cox et al., 2018). Comparisons were limited to one individual (# 143468, only tag retrieved) and to 70% of archived dives (used transmitted dives = 189,945 segments; archived dives = 270), because of transmission losses (not all archived dives were successfully transmitted; 48 dives) and/or because of errors in transmissions [i.e., repeated times in start/end of dive segments which possibly occur when transmission uplinks are interrupted (Boehme et al., 2009); 1 dive] and time mis-matches (32 transmitted dives did not have archived dives within 10 min of their time-stamp). Similar “errors” have been observed in previous studies using SRDL and DSA transmitted datasets (Labrousse et al., 2015; Heerah et al., 2017; Cox et al., 2018).
Due to potential differences in seal behavior within a dive (e.g., between segments), we assessed how DSA algorithms performed at both the dive and segment scales. For each behavioral variable (time in PrCA behavior and swimming effort), linear regression models were fitted to (1) pooled data encompassing all five segments of a dive (Supplementary Figure 1) and (2) data from each segment (i.e., separate regressions for each segment 1–5, Figure 3). In all statistical analyses, DSA transmissions were fitted as the response variable and BSDSA summarized archives as the explanatory variable. All models were fitted using standardized data (subtract mean and divide by standard deviation of combined DSA transmissions and summarized high resolution archives to retain 1:1 expectation) and validated using commonly used post-processing techniques of model residuals (Zuur et al., 2009). Intercept, slope and R-squared (R2) values were used to assess correlations between DSA transmissions and the BSDSA summarized archives. In addition, root mean square errors (RMSE) were calculated between the fitted values of the linear model vs. the BSDSA summarized archives, as well as between the DSA transmissions and BSDSA summarized archives (for both standardized and raw datasets).
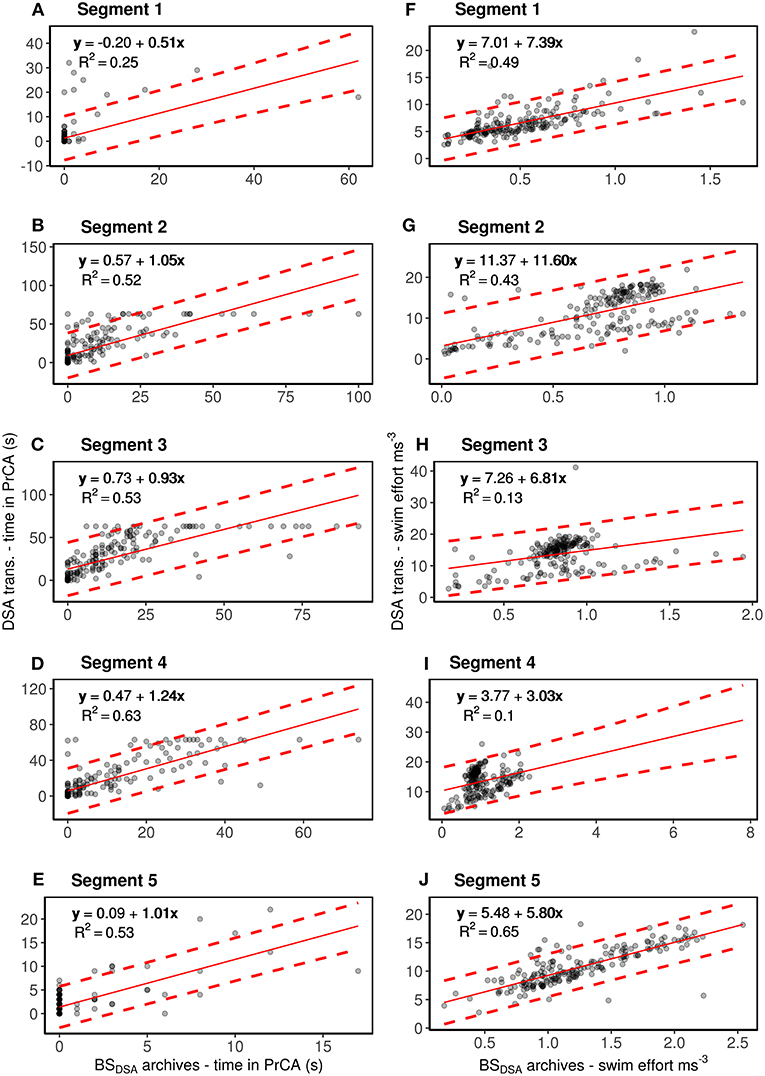
Figure 3. Segment by segment comparisons between DSA transmissions of time spent in PrCA behaviors (column one; A–E) and swimming effort (column 2; F–J) to estimates from the corresponding BSDSA summarized archives (for one individual #143468). The red line represents the intercept-slope output, with 95% prediction intervals in dashed red. Intercept and slope values close to 0 and 1, respectively reflect stronger correlations/likeness between the two data types than those far from 0 to 1. R2 values show the amount of variation accounted for by the model. Rows, from top to bottom, correspond to segments one through to five.
Confusion matrices [via the SDMTools package in R (Van der Wal et al., 2014), were used to compare PrCADSA from PrCAarchivalnnand assess when/when not these were in agreement with each other (Table 2)]. This analysis was performed at both dive (“ALL” in Table 2) and segment scales.
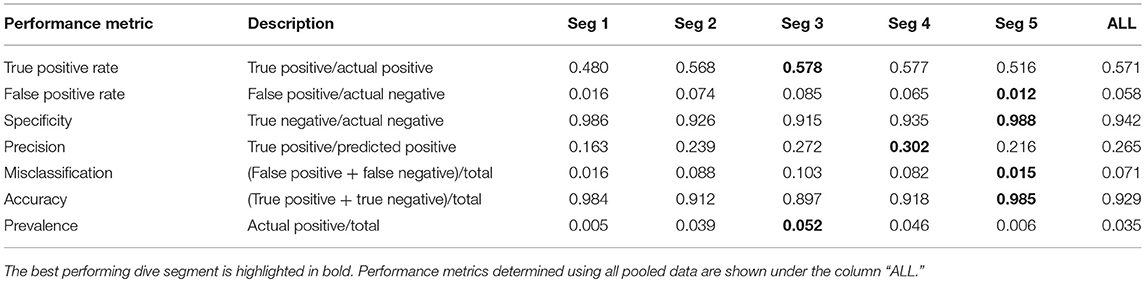
Table 2. Performance metrics from confusion matrices of PrCADSA (used in DSA transmissions) and PrCAarchival (from high-resolution archives) detections.
Validation of Foraging Activity Inferred From Dive Indices
In previous studies, Heerah et al. (2014, 2015) developed foraging indices that can be calculated for high-resolution (archived) and low-resolution (transmitted) dives from time-depth records solely. Instead of inferring foraging activity by only considering pre-determined parts of a dive (Watanabe et al., 2003; Austin et al., 2006; Kuhn et al., 2009; Le Bras et al., 2016; e.g., bottom phase, Houston and Carbone, 1992), the authors assumed that diving predators would increase the time spent in parts of the water column likely associated with more prey. This would be marked by an increase in vertical sinuosity and a decrease in vertical velocity, characteristic of vertical Area Restricted Search (ARS) behavior as initially hypothesized by Bailleul et al. (2010) and Dragon (2011).
Following the approach fully described in Heerah et al. (2014), high resolution archives were processed with the BSarchival method in order to be summarized into an optimal number of segments (Figures 2A,B). For the resulting 266 dives (the Gompertz model of the algorithm did not fit for four dives), each dive segment was then associated with a behavioral mode according to its sinuosity. Highly sinuous segments indicated “huntingarchival” behavior, while more directed segments indicated “transitarchival” behavior (Figure 2B). Vertical sinuosity cannot be calculated for BSDSA summarized archives (5 segments simulated transmitted dives for # 143468) and DSA transmissions. Instead, behavioral mode was defined for each of the five segments according to their vertical velocity (see details in Heerah et al., 2015). “HuntingDSA” corresponded to “low-speed” segments and “transitDSA” corresponded to “high-speed” segments (Figures 2C,D). Successive segments associated with the same behavior were grouped into behavioral bouts/phases. Following this, for each dive we summed the total time spent in huntingarchival or huntingDSA mode, resulting in an overall dive foraging effort index.
In order to assess the validity of these foraging indices for Weddell seals and different data resolutions, we calculated the time spent in PrCA behaviors associated with hunting/transit behavioral phases for each of the datasets (BSarchival archives, BSDSA summarized archives, DSA transmissions). We fitted linear regression models and calculated R-squared values (as described above) to study (1) the accuracy of hunting time estimation between BSarchival archives and equivalent BSDSA summarized archives (Supplementary Figure 2); (2) the correlation between the time spent in hunting mode and PrCA behaviors at the bout and dive scale for BSarchival and BSDSA summarized archives and DSA transmissions (Figure 4; Table 3).
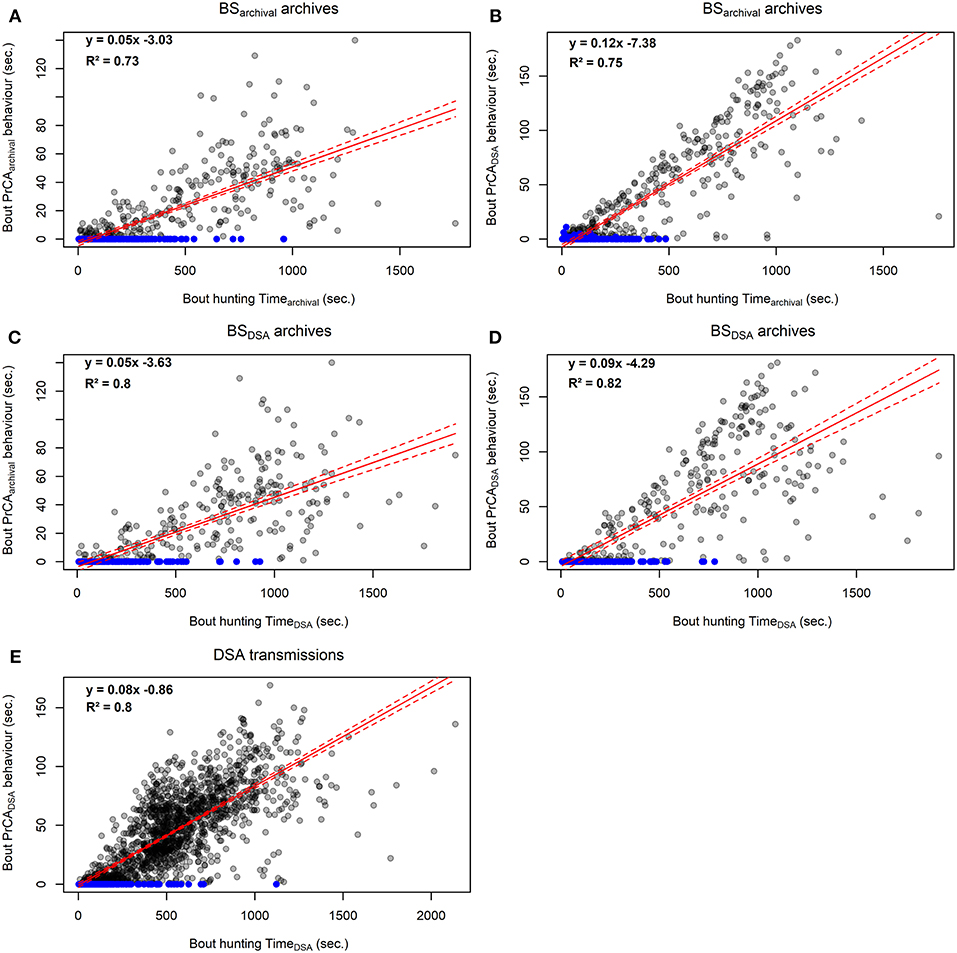
Figure 4. Comparison between foraging bout durations and time spent in PrCA behaviors estimated from high-resolution acceleration archives from established procedures (#143468; A and C) and simplified DSA algorithms (#143468, B and D; n = 4, E). The red line represents the intercept-slope output, with 95% confidence intervals in dashed red. Blue dots indicate hunting bouts during which there was no time spent in PrCA behaviors.
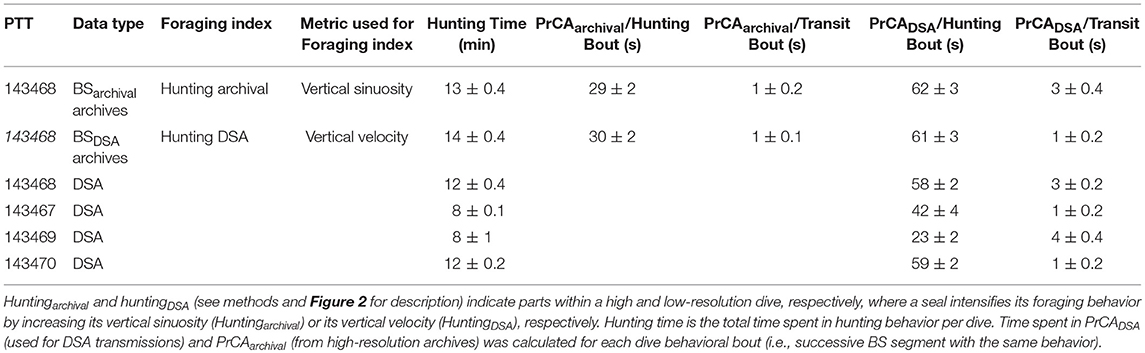
Table 3. Foraging effort outputs from the calculation of high and low-resolution effort indices.
Results
DSA Transmissions and Diving Behavior
For the four seals, the DSA tags transmitted data on per segment diving depth, duration, swimming effort and time spent in PrCA behaviors, for time periods of 10–49 days, between November 2014 and January 2015 (Table 1; Figure 2D). The number of dives transmitted per individual ranged from 55 to 667, resulting in 1,412 total dives, with an average of 9 ± 9 (mean ±SE, nSeal = 4, Table 1) dives per day.
A DSA tag was retrieved from one individual (# 143468), providing high-resolution archives for 270 dives across 27 days (Figure 1). Of these high-resolution dives, 82% were transmitted. 84% of dives across the entire dataset (encompassing 4 seals) and 59% of sampling days came from the three seals for which tags were not retrieved (Table 1).
Seals dived on average to 122 ± 1 m (max: 344 m) for 13 ± 0.1 min (max: 38 min) and spent 55 ± 1 s in PrCADSA behaviors (max: 173 s), representing 6 ± 0.4% (max: 21%) of total dive durations (Table 1; Figure 2D). Relative swimming effort was on average 12.5 ± 0.1 m·s−3 (Table 1).
Assessment and Validation of DSA Transmissions
Time Spent in PrCA Behaviors
Overall, DSA transmissions of time spent in PrCA behaviors (PrCADSA) were consistently overestimated to those from the BSDSA summarized archives (PrCAarchival) (n = 189, intercept of 0.40 and slope 1.15 Supplementary Figure 1; Supplementary Table 1). Nonetheless, R2 values of 0.61 were satisfactory (Supplementary Figure 1; Supplementary Table 1). At the segment scale, the DSA algorithms performed best for segments two through to five (Figure 3; Supplementary Table 1).
Confusion matrix performance metrics generally reflect results from the linear regressions (Supplementary Figures 1, 3; Table 2). Overall accuracy and specificity of the algorithm were high (0.93 and 0.94, Table 2). Similarly, true positive rates were deemed satisfactory (0.57, Table 2). False positive rates and misclassifications were low (0.058 and 0.07, respectively, Table 2). At the segment scale, the DSA algorithms performed best for segments two through to four (Figure 3; Supplementary Table 1).
A ceiling of 60 s in the total time spent in PrCADSA behaviors during a segment was too low and estimates from the BSDSA summarized archives exceeded this several times (Figure 3).
Swimming Effort
Average swimming efforts from the DSA transmissions were also consistently overestimated compared to those from the BSDSA summarized archives (n = 189, intercept of 5.93 and slope of 5.82, Supplementary Figure 1; Supplementary Table 1). Overall, R2 values were low (0.27, Supplementary Figure 1; Supplementary Table 1). However, segment by segment comparisons suggest these observations are predominantly driven by the algorithms low performance for segments three and four (R2 values of 0.13 and 0.10, respectively, Figure 3; Supplementary Table 1). For segments one, two and five, R2 values of 0.49, 0.43 and 0.65 were deemed satisfactory (although lesser so for segment two; Figure 3; Supplementary Table 1).
Validation of Foraging Effort Indices Calculated From Time-Depth Records
Comparison With PrCA Behaviors From Archived Data: From High to Low Resolution
Seal #143468 (retrieved tag, n = 266) spent 73 ± 1% (13 ± 0.4 min) and 79 ± 1% (14 ± 0.4 min) of its time spent diving (on average 14 ± 0.4 min) in huntingarchival and huntingDSA mode, respectively (Table 3). Overall dive huntingarchival and huntingDSA times were positively and highly correlated (intercept of 21.7, slope of 1.02 and R2 of 0.97; Supplementary Figure 2).
Overall, hunting phases (either huntingarchival and huntingDSA) were associated with numerous PrCADSA (~ 60 ± 3 s, max: 183 s) and PrCAarchival (~ 30 ± 2 s, max: 140 s) (Table 3; Figure 2). In addition, 97 and 95% of time spent in PrCAarchival and PrCADSA behaviors, occurred within huntingarchival phases of the dives (e.g., Figure 2B). Similarly, 98 and 93% of time spent in PrCAarchival and PrCADSA behaviors, respectively, occurred within HuntingDSA phases of the dives (Figure 2C). Conversely, transit phases (either transitarchival and transitDSA) were associated with few PrCA (Table 3; Figure 2).
At the bout scale, time spent in hunting mode (either huntingarchival and huntingDSA) correlated well with both the time spent in PrCAarchival (R2Huntingarchival of 0.73, Figure 4A; R2HuntingDSA of 0.8, Figure 4C) and PrCADSA behaviors (R2Huntingarchival of 0.75, Figure 4B; R2HuntingDSA of 0.68, Figure 4D). At the dive scale, the relationship between the time spent in huntingarchival mode and PrCA behaviors was slightly weaker (PrCAarchival: slope of 0.05, intercept of −0.15, R2 of 0.68, Supplementary Figure 3A; PrCADSA: slope of 0.09, intercept of 4.71, R2 of 0.73, Supplementary Figure 3B). The time spent in huntingDSA mode underestimated the time spent in PrCA behaviors, particularly for PrCADSA (PrCAarchival: slope of 0.04, intercept of −0.51, R2 of 0.68, Supplementary Figure 3C; PrCADSA: slope of 0.06, intercept of 3.23, R2 of 0.43, Supplementary Figure 3D).
Comparison With PrCA Behaviors From Transmitted Dives
For transmitted DSA dives (n = 1,412), the time spent in huntingDSA modes represented on average 75 ± 0.4% of corresponding dive durations (10 ± 0.1 min). HuntingDSA phases were associated with 49 ± 1 s (max: 169 s) spent in PrCADSA behaviors (Table 3). Overall, 94% of time spent in PrCADSA behaviors, occurred within huntingDSA phases of the dives. In contrast, transitDSA phases were associated with 3 ± 0.1 s (37 s) spent in PrCADSA behaviors.
At the bout scale, time spent in huntingDSA mode correlated well with the time spent in PrCADSA behaviors (slope of 0.08, intercept of −0.86, R2 of 0.8, Figure 4) while it was weaker at the overall dive scale (slope of 0.05, intercept of 8.82, R2 of 0.43, Supplementary Figure 3).
Discussion
In this study, we present data acquired from a new generation of SRDLs (the DSA tag) that record, process on-board and transmit data from time-depth and tri-axial acceleration records along with Argos locations (see also, Cox et al., 2018). These were successfully deployed on four Weddell seals, allowing novel data to be obtained across a period of 10–49 days. Retrieval of one of these tags, providing high-resolution acceleration records, offered a unique opportunity to assess simultaneously the validity of DSA transmitted outputs and previously developed foraging effort indices for this species. The Weddell seal is a relevant study case on which to apply the procedure because (1) they inhabit unpredictable, dynamic environments where tag retrieval is far from guaranteed (i.e., 25% of tag retrieval in our study), and (2) like other species of pinnipeds, such as the Antarctic fur seal, they have complex diving behaviors that challenge well-established methods to infer foraging activity (Heerah et al., 2014; Viviant et al., 2016). Although some improvements could be made in the DSA algorithm, and analyses comparing high-resolution archives and summarized transmissions were performed on only one individual (but numerous dives, behavioral bouts and segments), we show that both transmitted acceleration and “hunting” foraging indices were reliable in inferring foraging activity and potential prey encounters for Weddell seals. These results offer promising opportunities to post-process the numerous existing SRDL datasets and/or use DSA tags to further understand the energetic budgets involved in the strategies marine predators adopt to maximize resource acquisition in relation to their environment (e.g., Block et al., 2011; Arthur et al., 2016; Richard et al., 2016; Heerah et al., 2017).
Assessment and Validation of DSA Transmissions
PrCA Behaviors
Overall, comparisons of estimates of time spent in PrCA behaviors from DSA transmissions (PrCADSA) to detailed archives (PrCAarchival) obtained from one Weddell seal were satisfactory, and displayed performance metrics similar to those observed in juvenile southern elephant seals (Cox et al., 2018). However, as in Cox et al. (2018), segment by segment analyses suggested that the DSA algorithm performed better for some segments than others (for an in depth discussion of the possible factors driving this, see Cox et al., 2018). Correlations of time spent in PrCA behaviors were much stronger during segments two through to five than in segment one, as were true positive rates (particularly for segments two through to four). Segments two through to four most likely correspond to the bottom and/or hunting phases of a dive, where individuals concentrate foraging effort and thus perform the majority of PrCA behaviors (Ropert-Coudert et al., 2001; Schreer et al., 2001; Watanabe et al., 2003; Mitani et al., 2004; Heerah et al., 2014; Volpov et al., 2016). Subsequently, it is most important that the algorithm performs adequately during these phases. Whilst positive bias (i.e., over-estimation), false positive rates and RMSE's were slightly increased during these phases relative to segments one and particularly five, this may be attributable to other prey capture behaviors, such as prey chase and handling behaviors, that are picked up by the DSA simplified algorithm and correlate well with true PrCA detections (Cox et al., 2018). Poorer correlations and true detection rates during phases one and, to a lesser extent five (only evident in detection rates) may partially result from a low prevalence of PrCA behaviors while transiting between the surface to/from the water column where they forage, alongside the presence of other behaviors unrelated to PrCA and possibly related to directed swimming motions (Heerah et al., 2014; Viviant et al., 2016).
Despite an overall over-estimation of time spent in PrCADSA behaviors and some misclassifications compared to time spent in PrCAarchival behaviors, the strength of correlations and consistency between segments two to four (the expected foraging parts of the dives), as well as algorithm accuracy, suggest PrCADSA are reliable enough to quantify foraging effort. However, instead of using time spent in PrCADSA behaviors as absolute values to quantify dive foraging activity/success, we would recommend using these as a relative index of foraging activity across all dives (e.g., building classes of foraging dives; intense vs. low foraging dives), or to identify parts of the water column where most foraging occurs.
Swimming Effort
Overall, comparisons of DSA transmissions and the detailed archives of swimming effort obtained from one Weddell seal were poor and highly variable. However, segment by segment analyses suggested that this pattern was predominantly driven by particularly low performances for segments three and four. In contrast, comparisons for segments one and five (and a lesser extent two) were good and suggested that the algorithm performed well in these instances. Such a pattern was also observed in juvenile southern elephant seals (Cox et al., 2018). Segments one and five (and sometimes two) correspond to times when individuals tend to perform the directed swimming behaviors associated with the descent and ascent phases of a dive. They also correspond to the dive phases from which swimming effort can be used to infer seal body condition (Biuw, 2003; Richard et al., 2014). Thus, it is most important that algorithms perform well during these segments, as our analyses suggest. Poor algorithm performance during segments three and four, may be due to the presence of more complex movement patterns associated with an increase in foraging related behaviors. For example, active searching alongside prey chasing and handling may increase rolling and horizontal sinuosity movements, which will translate to increased accelerations on the lateral y-axis (used in swimming effort calculations) that are not related to swimming motions (Mitani et al., 2004; Gallon et al., 2013; Viviant et al., 2016; Le Bras et al., 2017).
The results obtained for DSA transmitted swimming efforts make us less confident in using these values for segments two to four (e.g., Jeanniard-du-Dot et al., 2016a,b). Swimming effort during transit phases from/to the surface (segments one and five, and possibly two dependent on dive shape) seem sufficiently reliable and could be used, for instance, in combination with ascent and descent rates, to investigate changes in body condition along a foraging trip (Beck et al., 2000; Biuw, 2003; Sato et al., 2003; Adachi et al., 2014; Richard et al., 2014). However, swimming efforts from segments three and four (and likely two when it is associated with the ‘hunting’ phase of a dive) appear much less reliable, making further inference for these parts of the dive difficult.
Inference on Foraging Effort Using Vertical ARS Indices
Overall, for the one individual from which a DSA tag was retrieved, huntingDSA time was highly correlated with huntingarchival time, indicating that low-resolution dive segments of decreased vertical velocity (i.e., “huntingDSA mode”) are also associated with increased vertical sinuosity (i.e., “huntingarchival mode”). Moreover, for archived and DSA dives, most time spent in PrCA behaviors (>90%) occurred within hunting phases, during which times spent in PrCA behaviors were around 20 to 30 times higher than those estimated for transit phases. Similarly, at the behavioral bout scale, both indices correlated well with times spent in PrCA behaviors (R2 between 0.73 and 0.82). At the dive scale, both indices performed similarly in estimating times spent in PrCAarchival behaviors (R2 = 0.68). However, while huntingarchival times were well-correlated with times spent in PrCADSA behaviors (R2 = 0.68), huntingDSA times were underestimated and less well-correlated (R2 = 0.43).
An underestimation of times spent in PrCADSA with huntingDSA time may be due to several reasons. First, there is an overall over-estimation of time spent in PrCADSA compared to PrCAarchival. Second, the relationship between the two variables could be weakened by dives associated with low vertical speed phases which are classified as foraging but not associated with any time spent in PrCADSA behaviors (3% of dives and 5% of behavioral bouts). This would typically be observed if a seal meanders at depth exploring the water column horizontally to find a prey patch, gliding periods (e.g., drift dives for elephant, gray and fur seals; Beck et al., 2000; Page et al., 2005; Gordine et al., 2015) or a change in orientation (e.g., upside down exploratory dives under the sea-ice to find a breathing hole for Weddell seals and other sea-ice obligate species; Bengtson and Stewart, 1992; Wartzok et al., 1992; Davis et al., 2003). Combined information on prey encounters and 3D diving movements would provide a better understanding of these different scenarios (e.g., Davis et al., 2003; Le Bras et al., 2017). Finally, at the dive scale, as previously shown for other species, considering additional dive metrics, such as depth, duration and ascent/descent rates may increase correlations to estimations of time spent in PrCA behaviors (Viviant et al., 2014; Vacquié-Garcia et al., 2015b; Volpov et al., 2016).
Altogether, these results strengthen the assumption on which “hunting” indices rely, that marine predators would adopt a vertical ARS behavior to increase time spent at favorable parts of the water column (Heerah et al., 2014, 2015; Le Bras et al., 2016; see also MacArthur and Pianka, 1966). The fundamental advantage of this approach over other methods is that it detects foraging activity along the dive profile rather than assuming foraging occurs at putative parts of a dive (Watanabe et al., 2003; Austin et al., 2006; Kuhn et al., 2009; Le Bras et al., 2016, such as bottom time, Houston and Carbone, 1992). Moreover, it relies on sinuosity and velocity thresholds that can be adapted to any species (see Heerah et al., 2014, 2015 for more methodological discussion, scripts and training datasets are also provided). Vertical sinuosity, a feature only captured by high-resolution data and quantified using “wiggles” has been used and associated with successful prey capture in seals, penguins and whales (Simeone and Wilson, 2003; Goldbogen et al., 2006; Bost et al., 2007; Calambokidis et al., 2007; Hanuise et al., 2010; Watanabe and Takahashi, 2013). Associations between hunting times and decreased vertical velocities (which also correspond to increased time spent in a water column layer), were observed and validated for Southern elephant seals (Heerah et al., 2015; Labrousse et al., 2015; Le Bras et al., 2016). Decreased vertical velocity has also been used as a proxy of foraging activity in several other species of diving predators (belugas, Hauser et al., 2015; Antarctic fur seals, Arthur et al., 2016; sea turtles, Chambault et al., 2016; Weddell seals, Heerah et al., 2017), for which only degraded dive transmissions were available. This study provides further validation that the same method can be applied to different species, as well as to both high and low-resolution dive datasets (see Heerah et al., 2014, 2015 for more methodological discussion, scripts and training datasets are also provided). Another advantage is that the hunting indices rely on the sinuosity and velocity of the animal's trajectory which should not be influenced by the logger position on the animal (e.g., back-mounted instead of head-mounted). Typically, Le Bras et al. (2016) showed that PrCA estimated from a head or back mounted accelerometer correlated at 93% (see also Ladds et al., 2016). It also appears that hunting indices can provide a value that correlates well with time spent in PrCA behaviors, despite data being highly degraded for satellite transmission. Nonetheless, to ensure rigorous analyses and ecological conclusions, we would recommend using the hunting indices as proxies of foraging effort, alongside overall prey distribution and availability in the water column, rather than prediction of the exact time spent in PrCAs behaviors (Labrousse et al., 2015; Arthur et al., 2016; Carter et al., 2016; Pascoe et al., 2016; Heerah et al., 2017).
Methodological Sights
In this study, we used outputs from processed high-resolution acceleration data as a baseline reference to validate both DSA transmitted outputs and vertical ARS foraging indices. While acceleration outputs cannot provide direct observation of feeding success, an increasing number of studies have now established links between acceleration peaks and time spent in PrCA behavior or feeding events for pinnipeds as well as numerous diving seabirds (Watanabe and Takahashi, 2013; Ydesen et al., 2014; Volpov et al., 2015). Moreover, acceleration measurements can provide a reliable proxy for energy expenditure (i.e., swimming effort, overall dynamic body acceleration; Gleiss et al., 2011; Skinner et al., 2014; Jeanniard-du-Dot et al., 2016b) and relative measure of body condition (Sato et al., 2003; Richard et al., 2014; Jouma'a et al., 2016). As such, accelerometers have revolutionized our ability to study the behaviors of free-ranging, cryptic species, such as free and far ranging diving animals (Brown et al., 2013). However, the need to retrieve devices often limits ecological studies to a range of species that return to predictable locations.
Novel SDRLs/DSA tags represent a promising tool to overcome these logistical challenges and extend our knowledge of the foraging activity and energetic budgets of less accessible species (e.g., sea-ice obligate species, juveniles). The algorithm and PrCA detection threshold implemented in the DSA tags here were initially developed for Southern elephant seals, and would probably benefit from further validation at the species level (i.e., simultaneous deployment of video cameras, jaw movement sensors, stomach temperature tags; Viviant et al., 2009; Ydesen et al., 2014; Jorgensen et al., 2015; Volpov et al., 2015). Nonetheless, despite being simplified to meet tag requirements (power limitation and dive by dive functionality), the on-board DSA algorithm relies on well-established acceleration processing techniques, already applied on a wide range of diving species (Viviant et al., 2009; Ydesen et al., 2014; Jorgensen et al., 2015; Volpov et al., 2015). In addition, PrCA detections and swimming effort measurements mostly rely on dynamic combinations of signal processing techniques, clustering analyses and thresholds that evolve with dive records, and thus should be adaptable to a range of species (see Cox et al., 2018 for more details). Cox et al. (2018), suggested several algorithm modifications that could improve the accuracy of PrCADSA detections and swimming effort measurements, which regarding the similarities observed in outputs for the two species would likely benefit datasets acquired from Weddell seals.
DSA transmissions and hunting indices were validated using high-resolution records from only one individual from which a tag could be retrieved. While ideally further validation should be made on a larger dataset, this provides a realistic insight into the difficulties and logistical challenges faced in studies investigating free-ranging animal behaviors. It also stresses the importance of technological advances, such as the DSA tags presented here, to overcome tag retrieval issues and methodological development. Reliable hunting/foraging indices, to infer functional behaviors even from highly degraded time-depth records, are also important in such developments (Carter et al., 2016). There was an overall consistency, accuracy and correlation strength between acceleration outputs (archived and transmitted) and foraging/hunting indices across Southern elephant seals and Weddell seals, which are two species that display a broad range of different dive types in contrasting environments (Schreer and Testa, 1996; Davis et al., 2003; Dragon et al., 2012; Heerah et al., 2014). The consistency of foraging strategies across species suggests that these developments could be applied to a broad range of diving species (Schreer et al., 2001; Carter et al., 2016). This offers exciting perspectives to expand studies on foraging strategies, and address the under sampling of remote species as well as analyzing pre-existing time-depth records that are prevalent for many species, and have been collected in abundance since the early 1980s (Block et al., 2011; Hussey et al., 2015; Wilmers et al., 2015; Carter et al., 2016).
Author Contributions
KH, J-BC, and CG designed the study protocol. KH, J-BC, and PB collected the data. KH and SC performed the analyses and wrote the manuscript. J-BC, CG, and PB significantly contributed to and revised the manuscript.
Funding
This study was funded by a CNES-TOSCA project Ecologie des phoques de Weddell et bio-océanographie de la banquise antarctique (PI JBC) and an European Research Council Advanced Grant as part of the program EARLYLIFE under the European Community's Seven Framework (grant agreement FP7/2007–2013/ERC-2012-ADG_20120314; PI Dr. Henri Weimerskirsch).
Conflict of Interest Statement
The authors declare that the research was conducted in the absence of any commercial or financial relationships that could be construed as a potential conflict of interest.
Acknowledgments
This study is part of French Polar Institute (Institut Paul Emile Victor, IPEV) research project IPEV #109 (PI H. Weimerskirch). We thank IPEV for logistical support and winterers of the 64th mission in Dumont d'Urville for expert help in the field. More specifically, we warmly thank P. Apelt, A. Thollot, and F. Petit for their investment in the field.
Supplementary Material
The Supplementary Material for this article can be found online at: https://www.frontiersin.org/articles/10.3389/fevo.2019.00030/full#supplementary-material
References
Adachi, T., Maresh, J. L., Robinson, P. W., Peterson, S. H., Costa, D. P., Naito, Y., et al. (2014). The foraging benefits of being fat in a highly migratory marine mammal. Proc. R. Soc. B Biol. Sci. 281:20142120. doi: 10.1098/rspb.2014.2120
Arnbom, T., Fedak, M. A., Boyd, I. L., and McConnell, B. J. (1993). Variation in weaning mass of pups in relation to maternal mass, postweaning fast duration, and weaned pup behaviour in southern elephant seals (Mirounga leonina) at South Georgia. Can. J. Zool. 71, 1772–1781. doi: 10.1139/z93-252
Arthur, B., Hindell, M., Bester, M. N., Oosthuizen, W. C., Wege, M., and Lea, M. (2016). South for the winter? within-dive foraging effort reveals the trade-offs between divergent foraging strategies in a free-ranging predator. Funct. Ecol. 30, 1623–1637. doi: 10.1111/1365-2435.12636
Austin, D., Bowen, W. D., McMillan, J. I., and Iverson, S. J. (2006). Linking movement, diving, and habitat to foraging success in a large marine predator. Ecology 87, 3095–3108. doi: 10.1890/0012-9658(2006)87[3095:LMDAHT]2.0.CO;2
Bailleul, F., Lesage, V., and Hammill, M. O. (2010). Spherical first passage time: a tool to investigate area-restricted search in three-dimensional movements. Ecol. Model. 221, 1665–1673. doi: 10.1016/j.ecolmodel.2010.04.001
Beck, C. A., Bowen, W. D., and Iverson, S. J. (2000). Seasonal changes in buoyancy and diving behaviour of adult grey seals. J. Exp. Biol. 203, 2323–2330.
Bengtson, J. L., and Stewart, B. S. (1992). Diving and haulout behavior of crabeater seals in the Weddell Sea, Antarctica, during March 1986. Polar Biol. 12, 635–644. doi: 10.1007/BF00236986
Benoit-Bird, K. J., Battaile, B. C., Heppell, S. A., Hoover, B., Irons, D., Jones, N., et al. (2013). Prey patch patterns predict habitat use by top marine predators with diverse foarging strategies. PLoS ONE 8:e53348. doi: 10.1371/journal.pone.0053348
Biuw, M. (2003). Blubber and buoyancy: monitoring the body condition of free-ranging seals using simple dive characteristics. J. Exp. Biol. 206, 3405–3423. doi: 10.1242/jeb.00583
Block, B. A., Jonsen, I. D., Jorgensen, S. J., Winship, A. J., Shaffer, S. A., Bograd, S. J., et al. (2011). Tracking apex marine predator movements in a dynamic environment. Nature 475, 86–90. doi: 10.1038/nature10082
Boehme, L., Lovell, P., Biuw, M., Roquet, F., Nicholson, J., Thorpe, S. E., et al. (2009). Technical note: animal-borne CTD-satellite relay data loggers for real-time oceanographic data collection. Ocean Sci. 5, 685–695. doi: 10.5194/os-5-685-2009
Bost, C.-A., Handrich, Y., Butler, P. J., Fahlman, A., Halsey, L. G., Woakes, A. J., et al. (2007). Changes in dive profiles as an indicator of feeding success in king and Adélie penguins. Deep Sea Res. Part II Top. Stud. Oceanogr. 54, 248–255. doi: 10.1016/j.dsr2.2006.11.007
Brown, D. D., Kays, R., Wikelski, M., Wilson, R., and Klimley, A. P. (2013). Observing the unwatchable through acceleration logging of animal behavior. Anim. Biotelemetry 1:1. doi: 10.1186/2050-3385-1-20
Calambokidis, J., Schorr, G. S., Steiger, G. H., Francis, J., Bakhtiari, M., Marshall, G., et al. (2007). Insights into the underwater diving, feeding, and calling behavior of blue whales from a suction-cup-attached video-imaging tag (CRITTERCAM). Mar. Technol. Soc. J. 41, 19–29. doi: 10.4031/002533207787441980
Carter, M. I. D., Bennett, K. A., Embling, C. B., Hosegood, P., and Russell, D. J. F. (2016). Navigating uncertain waters: a critical review of inferring foraging behaviour from location and dive data in pinnipeds. Mov. Ecol. 4:25. doi: 10.1186/s40462-016-0090-9
Chambault, P., de Thoisy, B., Heerah, K., Conchon, A., Barrioz, S., Dos Reis, V., et al. (2016). The influence of oceanographic features on the foraging behavior of the olive ridley sea turtle Lepidochelys olivacea along the Guiana coast. Prog. Oceanogr. 142, 58–71. doi: 10.1016/j.pocean.2016.01.006
Charnov, E. L. (1976). Optimal foraging, the marginal value theorem. Theor. Popul. Biol. 9, 129–136. doi: 10.1016/0040-5809(76)90040-X
Charrassin, J.-B., Kato, A., Handrich, Y., Sato, K., Naito, Y., Ancel, A., et al. (2001). Feeding behaviour of free-ranging penguins determined by oesophageal temperature. Proc. R. Soc. B Biol. Sci. 268, 151–157. doi: 10.1098/rspb.2000.1343
CLS (2016). Argos User's Manual: Worldwide Tracking and Environmental Monitoring by Satellite. Toulouse: CLS.
Cox, S. L., Orgeret, F., Gesta, M., Rodde, C., Heizer, I., Weimerskirch, H., et al. (2018). Processing of acceleration and dive data on-board satellite relay tags to investigate diving and foraging performance in free-ranging marine predators. Methods Ecol. Evol. 9, 64–77. doi: 10.1111/2041-210X.12845
Davis, R. W., Fuiman, L. A., Williams, T. M., Horning, M., and Hagey, W. (2003). Classification of Weddell seal dives based on 3-dimensional movements and video-recorded observations. Mar. Ecol. Prog. Ser. 264, 109–122. doi: 10.3354/meps264109
Dragon, A., Bar-Hen, A., Monestiez, P., and Guinet, C. (2012). Horizontal and vertical movements as predictors of foraging success in a marine predator. Mar. Ecol. Prog. Ser. 447, 243–257. doi: 10.3354/meps09498
Dragon, A. C. (2011). Modélisation des Stratégies D'approvisionnement des Eléphants de mer Austraux–Influence de la Variabilité de la Production Primaire et des Conditions Océanographiques Physiques. Available online at: https://www.locean-ipsl.upmc.fr/AnneCecile.Dragon/manuscript/AC-Dragon_PhD-thesis.pdf
Fedak, M., Lovell, P., McConnell, B., and Hunter, C. (2002). Overcoming the constraints of long range radio telemetry from animals: getting more useful data from smaller packages. Integr. Comp. Biol. 42, 3–10. doi: 10.1093/icb/42.1.3
Fedak, M. A. (2013). The impact of animal platforms on polar ocean observation. Fourth Int. Symp. Bio-Logging Sci. 88–89, 7–13. doi: 10.1016/j.dsr2.2012.07.007
Gallon, S., Bailleul, F., Charrassin, J. B., Guinet, C., Bost, C. A., Handrich, Y., et al. (2013). Identifying foraging events in deep diving southern elephant seals, Mirounga leonina, using acceleration data loggers. Deep-Sea Res. II 88–89, 14–22. doi: 10.1016/j.dsr2.2012.09.002
Gleiss, A. C., Wilson, R. P., and Shepard, E. L. C. (2011). Making overall dynamic body acceleration work: on the theory of acceleration as a proxy for energy expenditure. Methods Ecol. Evol. 2, 23–33. doi: 10.1111/j.2041-210X.2010.00057.x
Goldbogen, J. A., Calambokidis, J., Oleson, E., Potvin, J., Pyenson, N. D., Schorr, G., et al. (2011). Mechanics, hydrodynamics and energetics of blue whale lunge feeding: efficiency dependence on on krill density. J. Exp. Biol. 214, 131–146. doi: 10.1242/jeb.048157
Goldbogen, J. A., Calambokidis, J., Shadwick, R. E., Oleson, E. M., McDonald, M. A., and Hildebrand, J. A. (2006). Kinematics of foraging dives and lunge-feeding in fin whales. J. Exp. Biol. 209, 1231–1244. doi: 10.1242/jeb.02135
Goldbogen, J. A., Hazen, E. L., Friedlaender, A. S., Calambokidis, J., DeRuiter, S. L., Stimpert, A. K., et al. (2015). Prey density and distribution drive the three-dimensional foraging strategies of the largest filter feeder. Funct. Ecol. 29, 951–961. doi: 10.1111/1365-2435.12395
Gordine, S. A., Fedak, M., and Boehme, L. (2015). Fishing for drifts: detecting buoyancy changes of a top marine predator using a step-wise filtering method. J. Exp. Biol. 218, 3816–3824. doi: 10.1242/jeb.118109
Guinet, C. (1994). Poids a la naissance et croissance des éléphants de mer austraux. Quelles informations nous apportent-ils sur le milieu marin? Recl. Médecine Vét. 170, 105–110.
Guinet, C., Vacquié-Garcia, J., Picard, B., Bessigneul, G., Lebras, Y., Dragon, A., et al. (2014). Southern elephant seal foraging success in relation to temperature and light conditions: insight into prey distribution. Mar. Ecol. Prog. Ser. 499, 285–301. doi: 10.3354/meps10660
Hanuise, N., Bost, C.-A., Huin, W., Auber, A., Halsey, L. G., and Handrich, Y. (2010). Measuring foraging activity in a deep-diving bird: comparing wiggles, oesophageal temperatures and beak-opening angles as proxies of feeding. J. Exp. Biol. 213, 3874–3880. doi: 10.1242/jeb.044057
Hauser, D. D., Laidre, K. L., Parker-Stetter, S. L., Horne, J. K., Suydam, R. S., and Richard, P. R. (2015). Regional diving behavior of pacific arctic beluga whales delphinapterus leucas and possible associations with prey. Mar. Ecol. Prog. Ser. 541, 245–264. doi: 10.3354/meps11530
Heerah, K. (2014). Ecologie en mer des phoques de Weddell de l'Antarctique de l'Est en relation avec les param etres physiques de l'environnement–At sea ecology of Weddell seals in East Antarctica in relation with environmental physical parameters. Available online at: http://eprints.utas.edu.au/22756/ (Accessed June 10, 2017).
Heerah, K., Andrews-Goff, V., Williams, G., Sultan, E., Hindell, M., Patterson, T., et al. (2013). Ecology of weddell seals during winter: influence of environmental parameters on their foraging behaviour. Deep Sea Res. Part II Top. Stud. Oceanogr. 88–89, 23–33. doi: 10.1016/j.dsr2.2012.08.025
Heerah, K., Hindell, M., Andrew-Goff, V., Field, I., McMahon, C. R., and Charrassin, J. (2017). Contrasting behavior between two populations of an ice-obligate predator in East Antarctica. Ecol. Evol. 7, 606–618. doi: 10.1002/ece3.2652
Heerah, K., Hindell, M., Guinet, C., and Charrassin, J.-B. (2014). A new method to quantify within dive foraging behaviour in marine predators. PLoS ONE 9:e99329. doi: 10.1371/journal.pone.0099329
Heerah, K., Hindell, M., Guinet, C., and Charrassin, J.-B. (2015). From high-resolution to low-resolution dive datasets: a new index to quantify the foraging effort of marine predators. Anim. Biotelemetry 3:42. doi: 10.1186/s40317-015-0074-3
Hooker, S. K., Boyd, I. L., Jessopp, M., Cox, O., Blackwell, J., Boveng, P. L., et al. (2002). Monitoring the prey-field of marine predators: combining digital imaging with datalogging tags. Mar. Mammal Sci. 18, 680–697. doi: 10.1111/j.1748-7692.2002.tb01066.x
Horsburgh, J. M., Morrice, M., Lea, M., and Hindell, M. A. (2008). Determining feeding events and prey encounter rates in a southern elephant seal: a method using swim speed and stomach temperature. Mar. Mammal Sci. 24, 207–217. doi: 10.1111/j.1748-7692.2007.00156.x
Houston, A. I., and Carbone, C. (1992). The optimal allocation of time during the diving cycle. Behav. Ecol. 3, 255–265. doi: 10.1093/beheco/3.3.255
Hussey, N. E., Kessel, S. T., Aarestrup, K., Cooke, S. J., Cowley, P. D., Fisk, A. T., et al. (2015). Aquatic animal telemetry: a panoramic window into the underwater world. Science 348, 1255642–1255642. doi: 10.1126/science.1255642
Jeanniard-du-Dot, T., Guinet, C., Arnould, J. P. Y., Speakman, J. R., and Trites, A. W. (2016a). Accelerometers can measure total and activity-specific energy expenditures in free-ranging marine mammals only if linked to time activity budgets. Funct. Ecol. 31, 377–386. doi: 10.1111/1365-2435.12729
Jeanniard-du-Dot, T., Trites, A. W., Arnould, J. P. Y., Speakman, J. R., and Guinet, C. (2016b). Flipper strokes can predict energy expenditure and locomotion costs in free-ranging northern and Antarctic fur seals. Sci. Rep. 6:33912. doi: 10.1038/srep33912
Jorgensen, S. J., Gleiss, A. C., Kanive, P. E., Chapple, T. K., Anderson, S. D., Ezcurra, J. M., et al. (2015). In the belly of the beast: resolving stomach tag data to link temperature, acceleration and feeding in white sharks (Carcharodon carcharias). Anim. Biotelemetry 3:52. doi: 10.1186/s40317-015-0071-6
Jouma'a, J., Le Bras, Y., Richard, G., Vacquié-Garcia, J., Picard, B., El Ksabi, N., et al. (2016). Adjustment of diving behaviour with prey encounters and body condition in a deep diving predator: the southern elephant seal. Funct. Ecol. 30, 636–648. doi: 10.1111/1365-2435.12514
Kooyman, G. L., and Ponganis, P. J. (1998). The physiological basis of diving to depth: birds and mammals. Annu. Rev. Physiol. 60, 19–32. doi: 10.1146/annurev.physiol.60.1.19
Krausman, P. R. (1999). Some basic principles of habitat use. Grazing Behav. Livest. Wildl. 70, 85–90.
Kuhn, C. E., Crocker, D. E., Tremblay, Y., and Costa, D. P. (2009). Time to eat: measurements of feeding behaviour in a large marine predator, the northern elephant seal Mirounga angustirostris. J. Anim. Ecol. 78, 513–523. doi: 10.1111/j.1365-2656.2008.01509.x
Labrousse, S., Vacquié-Garcia, J., Heerah, K., Guinet, C., Sallée, J.-B., Authier, M., et al. (2015). Winter use of sea ice and ocean water mass habitat by southern elephant seals: the length and breadth of the mystery. Prog. Oceanogr. 137, 52–68. doi: 10.1016/j.pocean.2015.05.023
Ladds, M. A., Thompson, A. P., Slip, D. J., Hocking, D. P., and Harcourt, R. G. (2016). Seeing it all: evaluating supervised machine learning methods for the classification of diverse otariid behaviours. PloS ONE 11:e0166898. doi: 10.1371/journal.pone.0166898
Le Boeuf, B. J., Costa, D. P., Huntley, A. C., and Feldkamp, S. D. (1988). Continuous, deep diving in female northern elephant seals, Mirounga angustirostris. Can. J. Zool. 66, 446–458. doi: 10.1139/z88-064
Le Bras, Y., Jouma'a, J., Picard, B., and Guinet, C. (2016). How Elephant Seals (Mirounga leonina) adjust their fine scale horizontal movement and diving behaviour in relation to prey encounter rate. PLoS ONE 11:e0167226. doi: 10.1371/journal.pone.0167226
Le Bras, Y., Picard, B., and Guinet, C. (2017). Three-dimensional assessment of hunting strategies in a deep diving predator, southern elephant seal Mirounga leonina. Mar. Ecol. Prog. Ser. 573, 255–268. doi: 10.3354/meps12191
MacArthur, R. H., and Pianka, E. R. (1966). On optimal use of a patchy environment. Am. Nat. 100, 603–609. doi: 10.1086/282454
Machovsky-Capuska, G. E., Vaughn, R. L., Wursig, B., Katzir, G., and Raubenheimer, D. (2011). Dive strategies and foraging effort in the Australasian gannets Morus serrator revealed by underwater videography. Mar. Ecol. Prog. Ser. 442, 255–261. doi: 10.3354/meps09458
Mitani, Y., Watanabe, Y., Sato, K., Cameron, M. F., and Naito, Y. (2004). 3D diving behavior of Weddell seals with respect to prey accessibility and abundance. Mar. Ecol. Prog. Ser. 281, 275–281. doi: 10.3354/meps281275
Naito, Y., Bornemann, H., Takahashi, A., McIntyre, T., and Plotz, J. (2010). Fine-scale feeding behaviour of Weddell seals revealed by a mandible accelerometer. Polar Sci. 4, 309–316. doi: 10.1016/j.polar.2010.05.009
Naito, Y., Costa, D. P., Adachi, T., Robinson, P. W., Fowler, M., and Takahashi, A. (2013). Unravelling the mysteries of a mesopelagic diet: a large apex predator specializes on small prey. Funct. Ecol. 27, 710–717. doi: 10.1111/1365-2435.12083
Page, B., McKenzie, J., Hindell, M. A., and Goldsworthy, S. D. (2005). Drift dives by male New Zealand fur seals (Arctocephalus forsteri). Can. J. Zool. 83, 293–300. doi: 10.1139/z05-013
Pascoe, P., Lea, M.-A., Mattlin, R. H., McMahon, C. R., Harcourt, R., Thompson, D., et al. (2016). Assessing the utility of two-and three-dimensional behavioural metrics in habitat usage models. Mar. Ecol. Prog. Ser. 562, 181–192. doi: 10.3354/meps11947
Richard, G., Cox, S. L., Picard, B., Vacquie-Garcia, J., and Guinet, C. (2016). Southern elephant seals replenish their lipid reserves at different rates according to foraging habitat. PLoS ONE 11:e0166747. doi: 10.1371/journal.pone.0166747
Richard, G., Vacquie-Garcia, J., Jouma'a, J., Picard, B., Génin, A., Arnould, J. P. Y., et al. (2014). Variation in body condition during the post-moult foraging trip of southern elephant seals and its consequences on diving behaviour. J. Exp. Biol. 217, 2609–2619. doi: 10.1242/jeb.088542
Ropert-Coudert, Y., Kato, A., Baudat, J., Bost, C.-A., Le Maho, Y., and Naito, Y. (2001). Feeding strategies of free-ranging Adélie penguins Pygoscelis adeliae analysed by multiple data recording. Polar Biol. 24, 460–466. doi: 10.1007/s003000100234
Sato, K., Mitani, Y., Cameron, M. F., Siniff, D. B., and Naito, Y. (2003). Factors affecting stroking patterns and body angle in diving Weddell seals under natural conditions. J. Exp. Biol. 206, 1461–1470. doi: 10.1242/jeb.00265
Schreer, J. F., Kovacs, K. M., and O'Hara Hines, R. J. (2001). Comparative diving patterns of pinnipeds and seabirds. Ecol. Monogr. 71, 137–162. doi: 10.1890/0012-9615(2001)071[0137:CDPOPA]2.0.CO;2
Schreer, J. F., and Testa, J. W. (1996). Classification of Weddell Seal diving behavior. Mar. Mammal Sci. 12, 227–250. doi: 10.1111/j.1748-7692.1996.tb00573.x
Simeone, A., and Wilson, R. P. (2003). In-depth studies of Magellanic penguin (Spheniscus magellanicus) foraging: can we estimate prey consumption by perturbations in the dive profile? Mar. Biol. 143, 825–831. doi: 10.1007/s00227-003-1114-8
Skinner, J. P., Mitani, Y., Burkanov, V. N., and Andrews, R. D. (2014). Proxies of food intake and energy expenditure for estimating the time-energy budgets of lactating northern fur seals Callorhinus ursinus. J. Exp. Mar. Biol. Ecol. 461, 107–115. doi: 10.1016/j.jembe.2014.08.002
Stephens, D. W., and Krebs, J. R. (1986). Foraging theory. Princeton, NJ: Princeton University Press.
Tynan, C. T., Ainley, D. G., and Stirling, I. (2009). Sea ice: a critical habitat for polar marine mammals and birds. Sea Ice 395, 395–424. doi: 10.1002/9781444317145.ch11
Vacquié-Garcia, J., Guinet, C., Dragon, A. C., Viviant, M., Ksabi, N. E., and Bailleul, F. (2015a). Predicting prey capture rates of southern elephant seals from track and dive parameters. Mar. Ecol. Prog. Ser. 541, 265–277. doi: 10.3354/meps11511
Vacquié-Garcia, J., Guinet, C., Laurent, C., and Bailleul, F. (2015b). Delineation of the southern elephant seal? s main foraging environments defined by temperature and light conditions. Deep Sea Res. Part II Top. Stud. Oceanogr. 113, 145–153. doi: 10.1016/j.dsr2.2014.10.029
Vacquie-Garcia, J., Lydersen, C., Biuw, M., Haug, T., Fedak, M. A., and Kovacs, K. M. (2017). Hooded seal Cystophora cristata foraging areas in the Northeast Atlantic Ocean—Investigated using three complementary methods. PloS ONE 12:e0187889. doi: 10.1371/journal.pone.0187889
Van der Wal, J., Falconi, L., Januchowski, S., Shoo, L., and Storlie, C. (2014). SDMTools. R package version.
Viviant, M., Jeanniard-du-Dot, T., Monestiez, P., Authier, M., and Guinet, C. (2016). Bottom time does not always predict prey encounter rate in Antarctic fur seals. Funct. Ecol. 30, 1834–1844. doi: 10.1111/1365-2435.12675
Viviant, M., Monestiez, P., and Guinet, C. (2014). Can we predict foraging success in a marine predator from dive patterns only? validation with prey capture attempt data. PLoS ONE 9:e88503. doi: 10.1371/journal.pone.0088503
Viviant, M., Trites, A. W., Rosen, D. A. S., Monestiez, P., and Guinet, C. (2009). Prey capture attempts can be detected in Steller sea lions and other marine predators using accelerometers. Polar Biol. 33, 713–719. doi: 10.1007/s00300-009-0750-y
Volpov, B. L., Hoskins, A. J., Battaile, B. C., Viviant, M., Wheatley, K. E., Marshall, G., et al. (2015). Identification of prey captures in Australian fur seals (Arctocephalus pusillus dorifeus) using head-mounted accelerometers: field validation with animal-born video cameras. PLoS ONE 10:e0128789. doi: 10.1371/journal.pone.0128789
Volpov, B. L., Rosen, D. A. S., Hoskins, A. J., Lourie, H. J., Dorville, N., Baylis, A. M. M., et al. (2016). Dive characteristics can predict foraging success in Australian fur seals (Arctocephalus pusillus doriferus) as validated by animal-borne video. Biol. Open 5:262–271. doi: 10.1242/bio.016659
Wartzok, D., Elsner, R., Stone, H., Kelly, B. P., and Davis, R. W. (1992). Under-ice movements and the sensory basis of hole finding by ringed and Weddell seals. Can. J. Zool. 70, 1712–1722. doi: 10.1139/z92-238
Watanabe, Y., Mitani, Y., Sato, K., Cameron, M. F., and Naito, Y. (2003). Dive depths of Weddell seals in relation to vertical prey distribution as estimated by image data. Mar. Ecol. Prog. Ser. 252, 283–288. doi: 10.3354/meps252283
Watanabe, Y. Y., and Takahashi, A. (2013). Linking animal-borne video to accelerometers reveals prey capture variability. Proc. Natl. Acad. Sci. 110, 2199–2204. doi: 10.1073/pnas.1216244110
Wilmers, C. C., Nickel, B., Bryce, C. M., Smith, J. A., Wheat, R. E., and Yovovich, V. (2015). The golden age of bio-logging: how animal-borne sensors are advancing the frontiers of ecology. Ecology 96, 1741–1753. doi: 10.1890/14-1401.1
Wilson, R., PÜT, K., GrÉMillet, D., Culik, B., Kierspel, M., Regel, J., et al. (1995). Reliability of stomach temperature changes in determining feeding characteristics of seabirds. J. Exp. Biol. 198, 1115–1135.
Wilson, R. P., Culik, B. M., Peters, G., and Bannasch, R. (1996). Diving behaviour of gentoo penguins, pygoscelis papua; factors keeping dive profiles in shape. Mar. Biol. 126, 153–162. doi: 10.1007/BF00571387
Wilson, R. P., Steinfurth, A., Ropert-Coudert, Y., Kato, A., and Kurita, M. (2002). Lip-reading in remote subjects: an attempt to quantify and separate ingestion, breathing and vocalisation in free-living animals using penguins as a model. Mar. Biol. 140, 17–27. doi: 10.1007/s002270100659
Keywords: satellite relayed data logger, accelerometers, diving behavior, movement ecology, foraging, sea-ice, biologging
Citation: Heerah K, Cox SL, Blevin P, Guinet C and Charrassin J-B (2019) Validation of Dive Foraging Indices Using Archived and Transmitted Acceleration Data: The Case of the Weddell Seal. Front. Ecol. Evol. 7:30. doi: 10.3389/fevo.2019.00030
Received: 30 July 2018; Accepted: 28 January 2019;
Published: 19 February 2019.
Edited by:
Andreas Fahlman, Fundación Oceanográfica, SpainReviewed by:
Allyson Hindle, Massachusetts General Hospital and Harvard Medical School, United StatesLewis Halsey, University of Roehampton, United Kingdom
Tessa van Walsum, University of Roehampton, United Kingdom, in collaboration with reviewer LH
Copyright © 2019 Heerah, Cox, Blevin, Guinet and Charrassin. This is an open-access article distributed under the terms of the Creative Commons Attribution License (CC BY). The use, distribution or reproduction in other forums is permitted, provided the original author(s) and the copyright owner(s) are credited and that the original publication in this journal is cited, in accordance with accepted academic practice. No use, distribution or reproduction is permitted which does not comply with these terms.
*Correspondence: Karine Heerah, karine.heerah@hotmail.fr