Article

Assessing Weather Effects on Dengue Disease in Malaysia

1
Geoinformation Science Lab, Department of Geography, Humboldt-Universität zu Berlin, Unter den Linden 6, Berlin 10099, Germany
2
Medical Research Resource Centre, Institute for Medical Research, Jalan Pahang, Kuala Lumpur 50588, Malaysia
3
Climatological Section, Department of Geography, Humboldt-Universität zu Berlin, Unter den Linden 6, Berlin 10099, Germany
4
Geomatics Lab, Department of Geography, Humboldt-Universität zu Berlin, Unter den Linden 6, Berlin 10099, Germany
*
Author to whom correspondence should be addressed.
Int. J. Environ. Res. Public Health 2013, 10(12), 6319-6334; https://doi.org/10.3390/ijerph10126319
Submission received: 23 September 2013 / Revised: 4 November 2013 / Accepted: 8 November 2013 / Published: 26 November 2013

Abstract

:
The number of dengue cases has been increasing on a global level in recent years, and particularly so in Malaysia, yet little is known about the effects of weather for identifying the short-term risk of dengue for the population. The aim of this paper is to estimate the weather effects on dengue disease accounting for non-linear temporal effects in Selangor, Kuala Lumpur and Putrajaya, Malaysia, from 2008 to 2010. We selected the weather parameters with a Poisson generalized additive model, and then assessed the effects of minimum temperature, bi-weekly accumulated rainfall and wind speed on dengue cases using a distributed non-linear lag model while adjusting for trend, day-of-week and week of the year. We found that the relative risk of dengue cases is positively associated with increased minimum temperature at a cumulative percentage change of 11.92% (95% CI: 4.41–32.19), from 25.4 °C to 26.5 °C, with the highest effect delayed by 51 days. Increasing bi-weekly accumulated rainfall had a positively strong effect on dengue cases at a cumulative percentage change of 21.45% (95% CI: 8.96, 51.37), from 215 mm to 302 mm, with the highest effect delayed by 26–28 days. The wind speed is negatively associated with dengue cases. The estimated lagged effects can be adapted in the dengue early warning system to assist in vector control and prevention plan.

Graphical Abstract

1. Introduction

The risk of mosquito-borne dengue infection has increased dramatically in tropical and sub-tropical regions around the World in recent decades [1]. Each year there are between 50 and 100 million dengue infections, and more than 500,000 cases are hospitalized [2]. The pattern of dengue transmission is influenced by complex factors including the environment, climate and weather, human behavior and dengue virus serotype-specific herd immunity among the human population [3,4,5]. Here, we focus on weather, one of the fundamental driving forces behind dengue epidemics [6,7] that may allow us to narrow down the timeframe of high risk dengue infection.
Dengue disease transmission is sensitive to weather for several reasons: a warm ambient temperature is critical to adult dengue vectors’ feeding behavior and gonotrophic cycle, as well as the rate of larval development and speed of virus replication; and rainfall-induced standing water are necessary for dengue vectors to breed [8,9,10]. The entire immature or aquatic cycle from egg to adult is approximately 7–9 days [11,12]. Dengue vectors become infected by biting infected humans or non-human primates (viremic stage), and they can then transmit the infection to other uninfected people after an extrinsic incubation period (EIP) of 8–12 days [13]. The EIP is the time when dengue vectors take a viremic blood meal to the time of the first successful transmission of the DENV [14]. After the intrinsic incubation period (IIP) of 4–10 days, the dengue symptoms begins unexpectedly sudden on the host [15]. The dengue vectors fit to transmit DENV survives for 30 days [16]. Hence, the estimated lagged time for the development of dengue vectors to the onset of dengue symptoms in human could be as short as 19 days if the dengue vectors bite a susceptive host on the first day after EIP.
Many studies have reported varying associations and lagged effects between climate and weather on dengue cases. Strong positive correlations were found between El Niño-Southern Oscillation (ENSO) and dengue epidemics in 10 island nations of the South Pacific [17], across the Indonesian archipelago and northern South America [18], and in Thailand [19]. For temperature, a varying lagged effect was reported in countries situated within 13 and 25 degrees latitude, both North and South. An increasing dengue risk was associated with increasing minimum and maximum temperature by a 1–2 month lag in Mexico [20], Brazil [21] and French West Indies [22], but with a longer lag time up to 3–4 months in Barbados [23] and Australia [24]. For countries closer to the equator, that is, within 1–6 degrees North and South, a shorter 2-week lag of temperature on dengue cases was reported in Singapore [25], and a 1-month lag of temperature was reported in Indonesia [26]. Furthermore, rainfall interactions exhibited a mixture of influences, from a 2-week lag, a 4-week lag, a 7-week lag, to a 10-week lag on the increase of dengue cases in Mexico [27], Thailand [28], Barbados [23], and Taiwan [29], respectively. Wind speed also exhibited a disparate association with dengue cases, from the common negative association in Barbados [23], Sri Lanka [30] and Guangzhou, China [31], to no association in Thailand [32] and Taiwan [33]. This study contributes to the overall estimation of the weather influence on dengue transmission in the area close to the equator.
Earlier studies have shown that Malaysia is dengue hyperendemic, with all four serotypes circulating concurrently [34], and with an abundance of both Aedes aegypti and Aedes albopictus [35,36]. The potential contribution of the results in this work may help health workers and stakeholders to plan vector control activities. Few studies in Malaysia focus on the weather interaction with dengue vectors abundance [37,38,39,40] and dengue cases in a local study site [41,42]. To date, there is no study on the short-term weather interaction with dengue cases in Selangor, Kuala Lumpur and Putrajaya, Malaysia. We aimed to estimate the weather effects on dengue disease accounting for non-linear temporal effects.

2. Materials and Methods
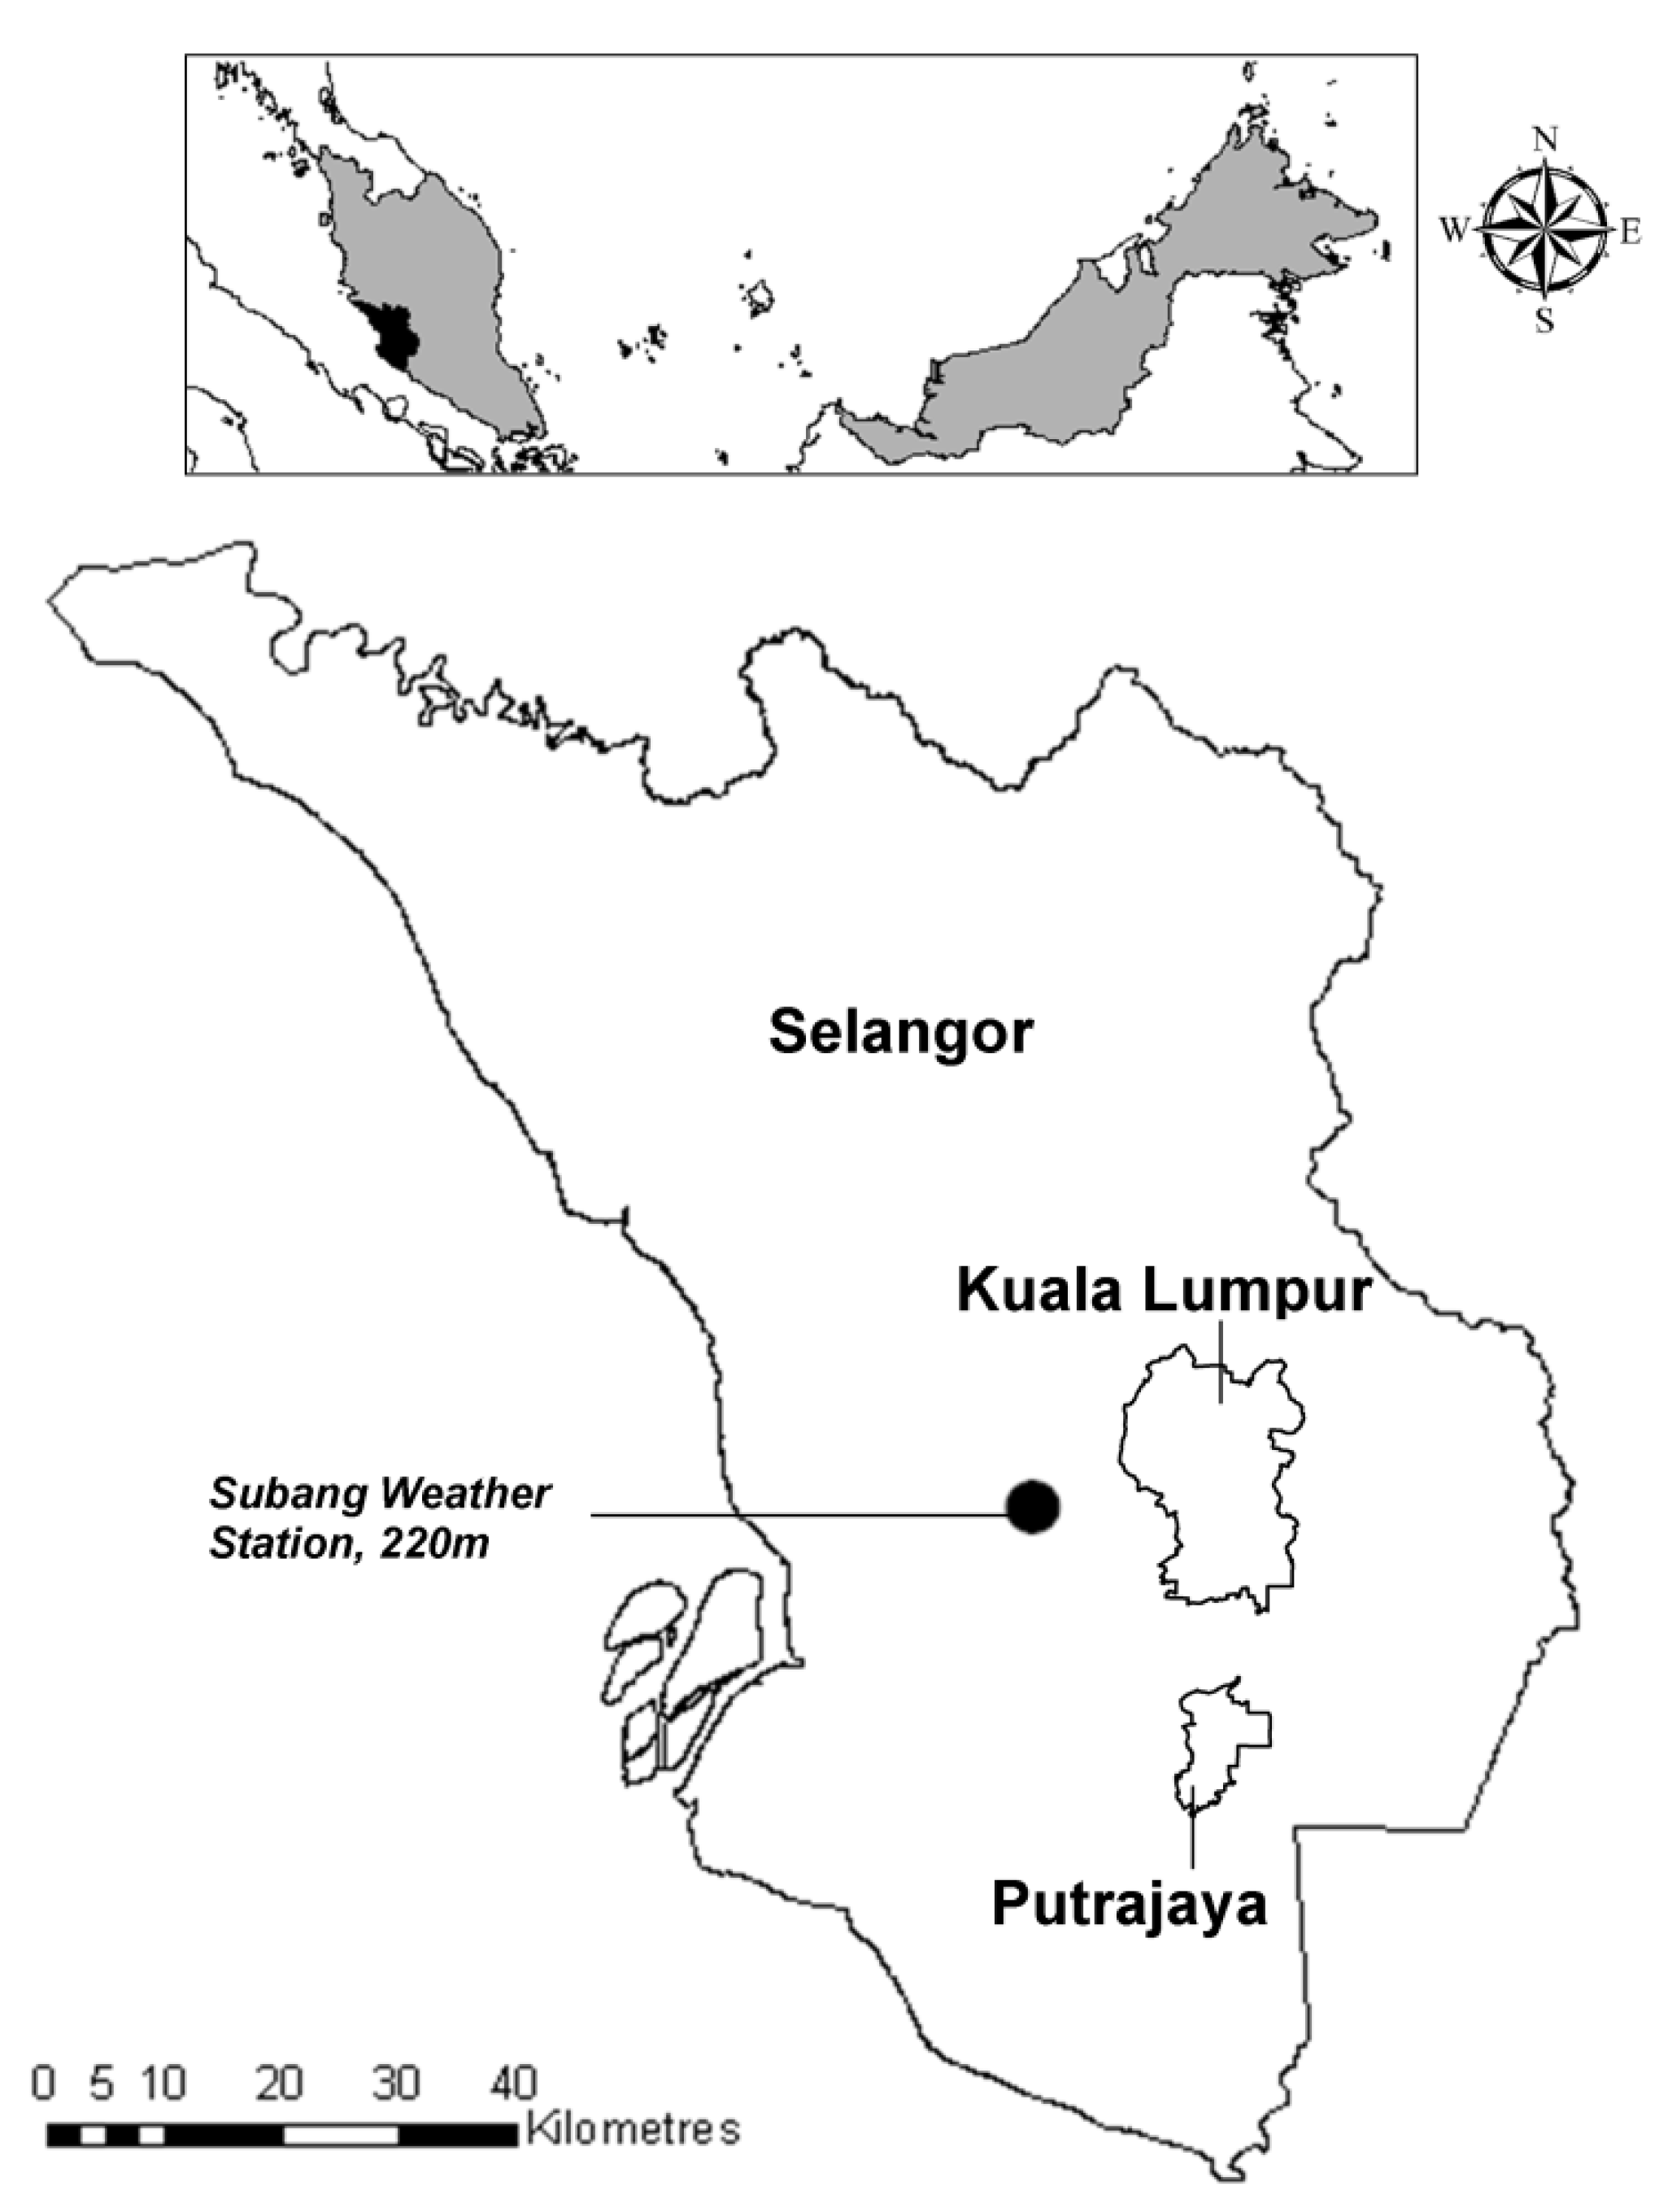
2.1. Study Area

The study area included the State of Selangor, the federal territory of Kuala Lumpur and the federal administrative capital of Putrajaya, and covered an area of 8,222 km2; the geographical location is between 2°35'N and 3°60'N, and 100°43'E and 102°5'E (Figure 1).
Figure 1. Study area: State of Selangor, including the federal territory of Kuala Lumpur and the federal administrative capital of Putrajaya.
Ijerph 10 06319 g001
The tropical climate is characterized by fairly high but uniform average daily temperatures ranging from 21 °C to 32 °C, a mean annual temperature of 26 °C, average daily humidity levels exceeding 80%, and mean annual rainfall of about 2,500 mm. The climate of Selangor, Kuala Lumpur and Putrajaya is governed by two monsoonal winds, which originate from the northeast between October and February, and the southwest from May to September [43].

2.2. Data

In Malaysia, dengue is a nationally notifiable disease and physicians must report every suspected case of dengue to the local health authority within 24 h [44]. We obtained dengue data from the Disease Control Division, Ministry of Health Malaysia. We used only dengue cases that were confirmed by the serological tests IgM capture enzyme-linked immunosorbent assay (ELISA) with single positive IgM as also applied by other studies [45,46]. For Selangor, Kuala Lumpur and Putrajaya, 32,181 cases of dengue were found from 2008 to 2010. The number of dengue cases shows a mean of 29.4 per day, with a standard deviation of 13.7 (Table 1).
Table 1. Distribution of dengue cases and selected weather parameters in Selangor, Kuala Lumpur and Putrajaya, 2008–2010.
Variables (unit)MeanStandard deviationMinimumPercentiles
25th50th75th100th
Daily total dengue cases29.413.71.020.028.038.0117.0
Daily minimum temperature (°C)24.21.020.423.524.024.927.0
Daily maximum temperature (°C)32.91.625.432.033.034.036.4
Daily mean temperature (°C)27.81.323.326.927.828.831.3
Daily relative humidity (%)78.06.059.973.678.582.693.5
Cumulative bi-weekly rainfall (mm)117.472.91.355.6108.2170.4329.2
Daily mean wind speed (knots)2.90.91.02.32.73.46.2
We compiled the daily data for maximum, minimum and mean temperature (in degrees Celsius), cumulative bi-weekly rainfall (mm), relative humidity (percentage) and mean wind speed (knots) from the local weather station in Kuala Lumpur, Subang (WMO# 486470; North Latitude 3°07'01''; East Longitude 101°32'60''; 220 masl) from 2007–2010. The data distribution of dengue cases and weather parameters are shown in Table 1. We used cumulative bi-weekly rainfall to include the immature cycle of dengue vectors that takes at least seven days, which is consistent with previous studies [47]. One station data was used due to the availability of the data, the high number of dengue cases concentrated near the station, and the weather conditions would not vary significantly across space [48]. Weather data were obtained from the National Climatic Data Center (NCDC) website [49].

2.3. Statistical Analysis

Initially, we included daily minimum temperature, daily maximum temperature, daily mean temperature, daily relative humidity, daily mean wind speed and bi-weekly rainfall in our analysis. We assessed the correlation analyses between all weather parameters and dengue cases. Mean temperature was reported with a high positive correlation with maximum temperature, and was then excluded (Table S4).
We assessed the relationship between the weather parameters and the number of daily dengue cases using Poisson generalized additive models (GAM) [50] in the “mgcv” R [51] package, version 1.7–23 [52] with natural cubic splines. The GAM are useful for identifying non-linear relationships and do not require an a priori knowledge of the shape of the response curves [50,53], which is determined by the data itself [54]. We excluded outliers of 4 standard deviations from the mean for all weather parameters, as GAM modeling is outlier-sensitive [55]. Model construction was based on a stepwise forward and backward variable selection using the Akaike’s Information Criteria (AIC) score [56]. The significance of the spline term(s) was assessed and fitted with linear interactions when non-significance was detected. The best parsimonious model was selected based on the Delta AICs (AIC—minimum AIC) [56], and its accuracy was assessed by a 10-fold cross-validation. We assessed the autocorrelation and partial autocorrelation of the model residuals to adjust the need to account for seasonal trends.
To capture the delayed effects of weather parameters on the number of dengue cases, we used distributed lag non-linear models (DLNM) in the “dlnm” R [51] package version 1.6.8 [57,58] to simultaneously describe non-linear and delayed dependencies in the association between weather parameters and dengue cases based on a “cross-basis” function. Recent studies have shown promising modeling performances in the weather effects on inpatient mortality and outpatient visit with GAM and DLNM [59,60,61,62]. We used lags up to 90 days to account for any potential lag period (i.e., the extrinsic incubation period of the dengue vector and intrinsic incubation period of dengue virus). The median value of weather parameters (Table 1) was defined as the baseline centering value for calculating relative risk. The relative risk was based on the Poisson regression models adjusting for various confounders following the work of Gasparrini et al. [63]. We compared the relative risk at specific lags to account for the effect of the current day’s weather parameters on the current day’s dengue cases (lag 0), weather parameters one month before (lag 30), two months before (lag 60), and three months before (lag 90) on the current day’s dengue cases. To quantify the nonlinear exposure-response curves, we calculated the percentage change with the 95% confidence intervals (CIs) in the number of dengue cases for minimum temperature, cumulated rainfall and wind speed with the 99th percentile relative to the 90th percentile for high weather effect, and the 1st percentile relative to the 10th percentile, respectively, for low weather effect. The percentage change was calculated by the following formula (Equation 1) [64]:
Percentage Change = (Relative Risk − 1) × 100%
Sensitivity analyses were performed by varying the degrees of freedom (df), using 3–7 df for trend adjustment. Moreover, we conducted the analysis for maximum lags of 60 and 90 days for the DLNM.

3. Results

3.1. Best Model Selection and Validation

By comparing the AIC and the Delta AIC values, we identified the best Poisson GAM model with minimum temperature, bi-weekly accumulated rainfall, and wind speed (AIC: 7367.23; deviance explained: 75.5%) (Tables S2 and S3). The relative humidity and maximum temperature were not statistically significant and were thus not included in the model (Table S4). The model was adjusted with a natural cubic spline of the time per year using 4 df, a factor for day of week and a natural cubic spline of week of the year to control for seasonal and long-term trends. We found that the selected GAM model correctly described 66% of the withheld deviance in a 10-fold cross-validation without a lag effect. The deviance not described by the model may account for temporal fluctuations in the immunity status of host populations [65], socio-economical factors [66], and other factors related to the population of dengue virus vectors [5]. The autocorrelation and partial autocorrelations of residuals from our main models were free from systematic patterns and summed close to zero (Figure S1). This suggested our original choice of smoothing had adequately adjusted for seasonal trends.
In the sensitivity analyses for DLNM, the estimates for the results with varying df and lag changed little. Hence, we eventually used the natural cubic B-spline with 3 df for minimum temperature, 3 df for accumulated rainfall, and 3 df for wind speed to describe the association of weather parameters and dengue cases. For the lag stratification, we selected 3 df for minimum temperature, 3 df for accumulated rainfall, and 3 df for wind speed.

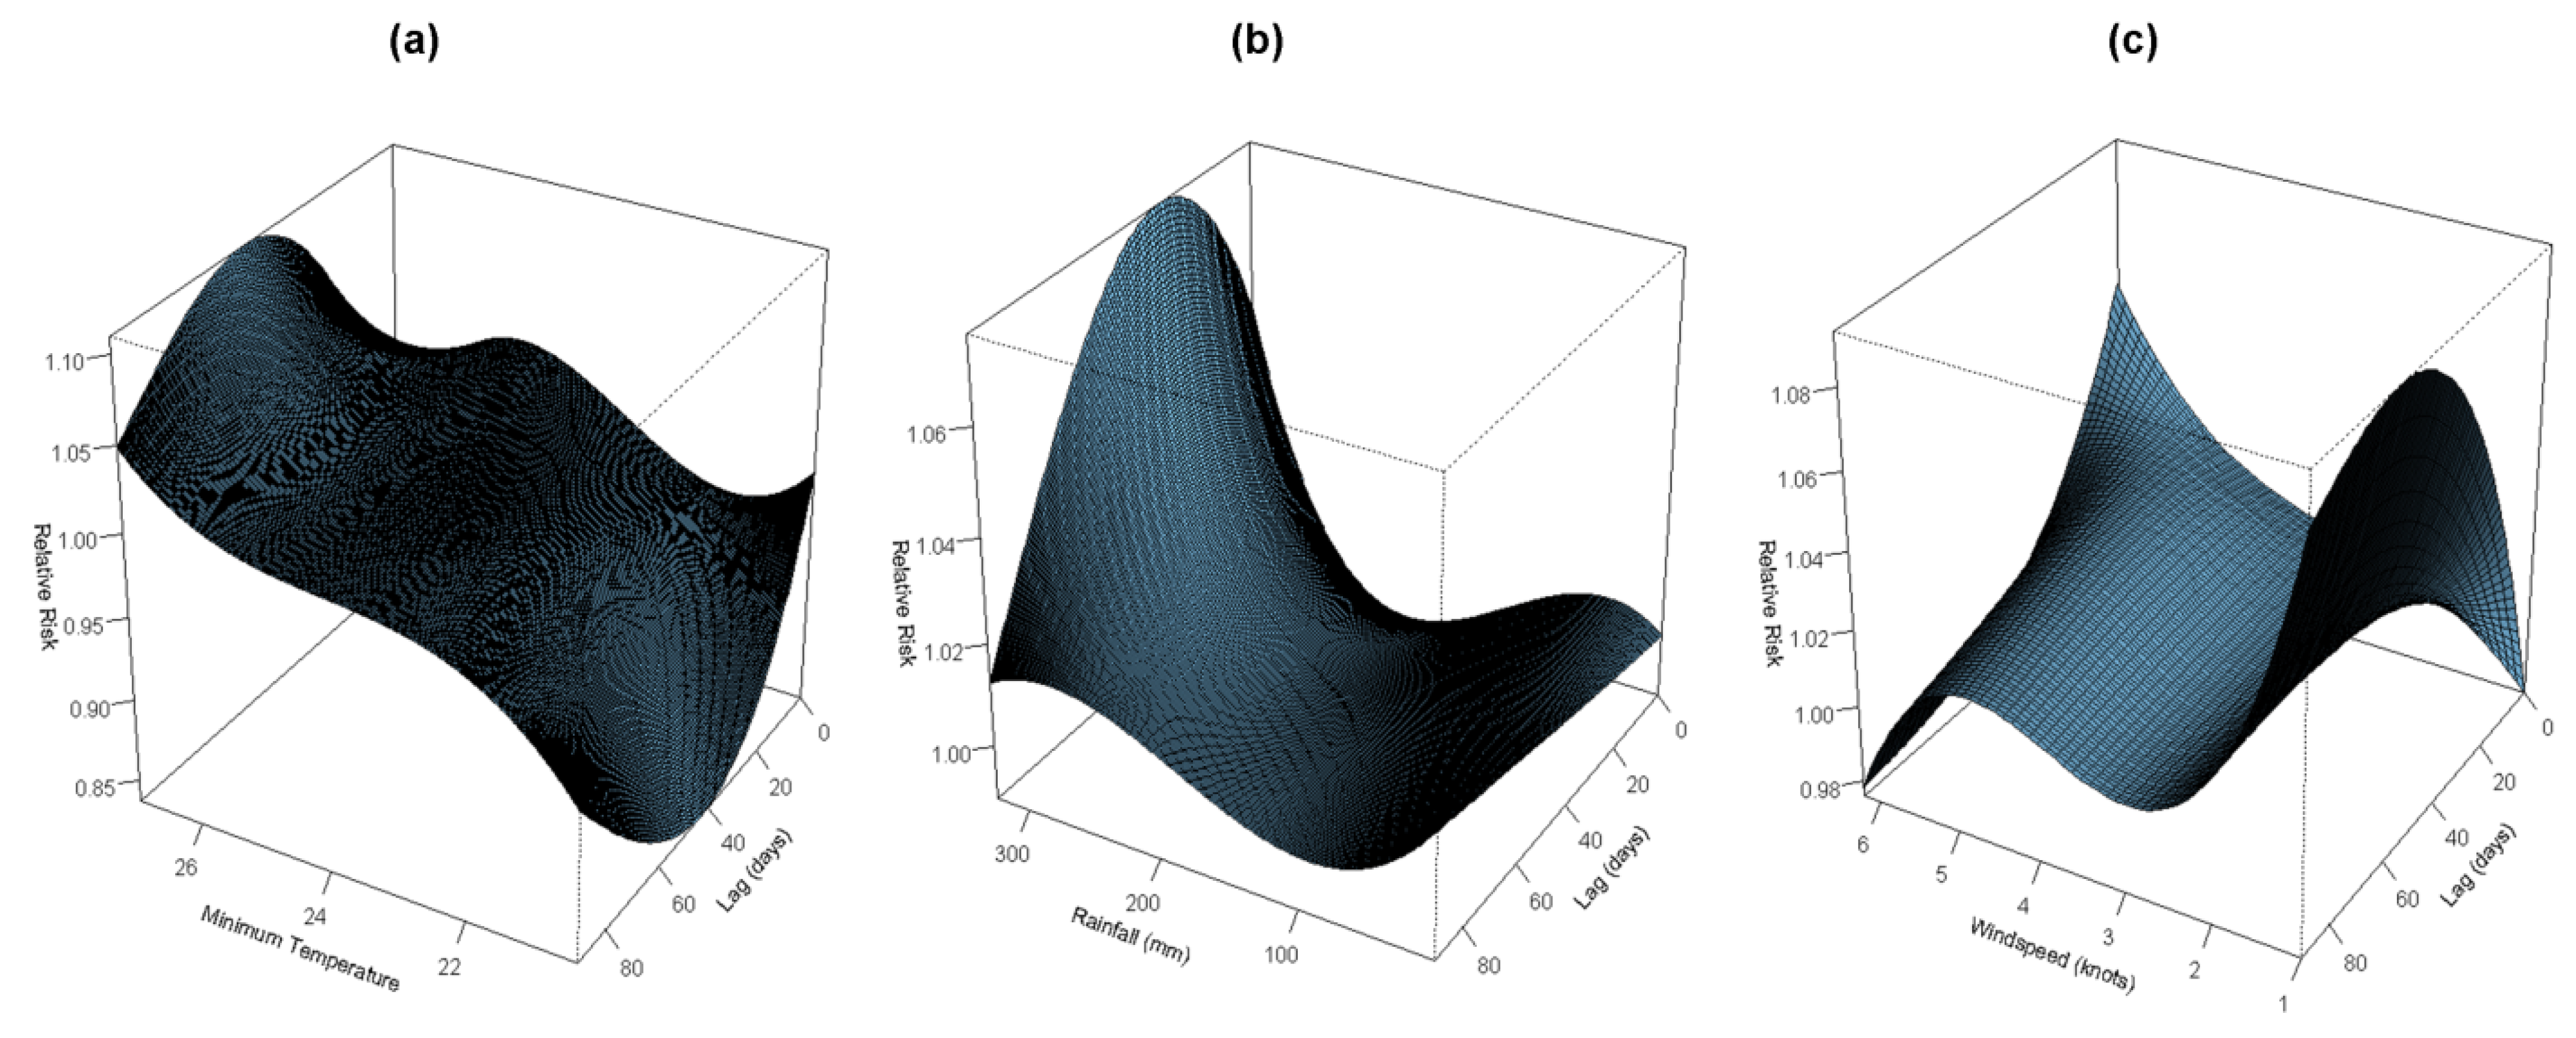
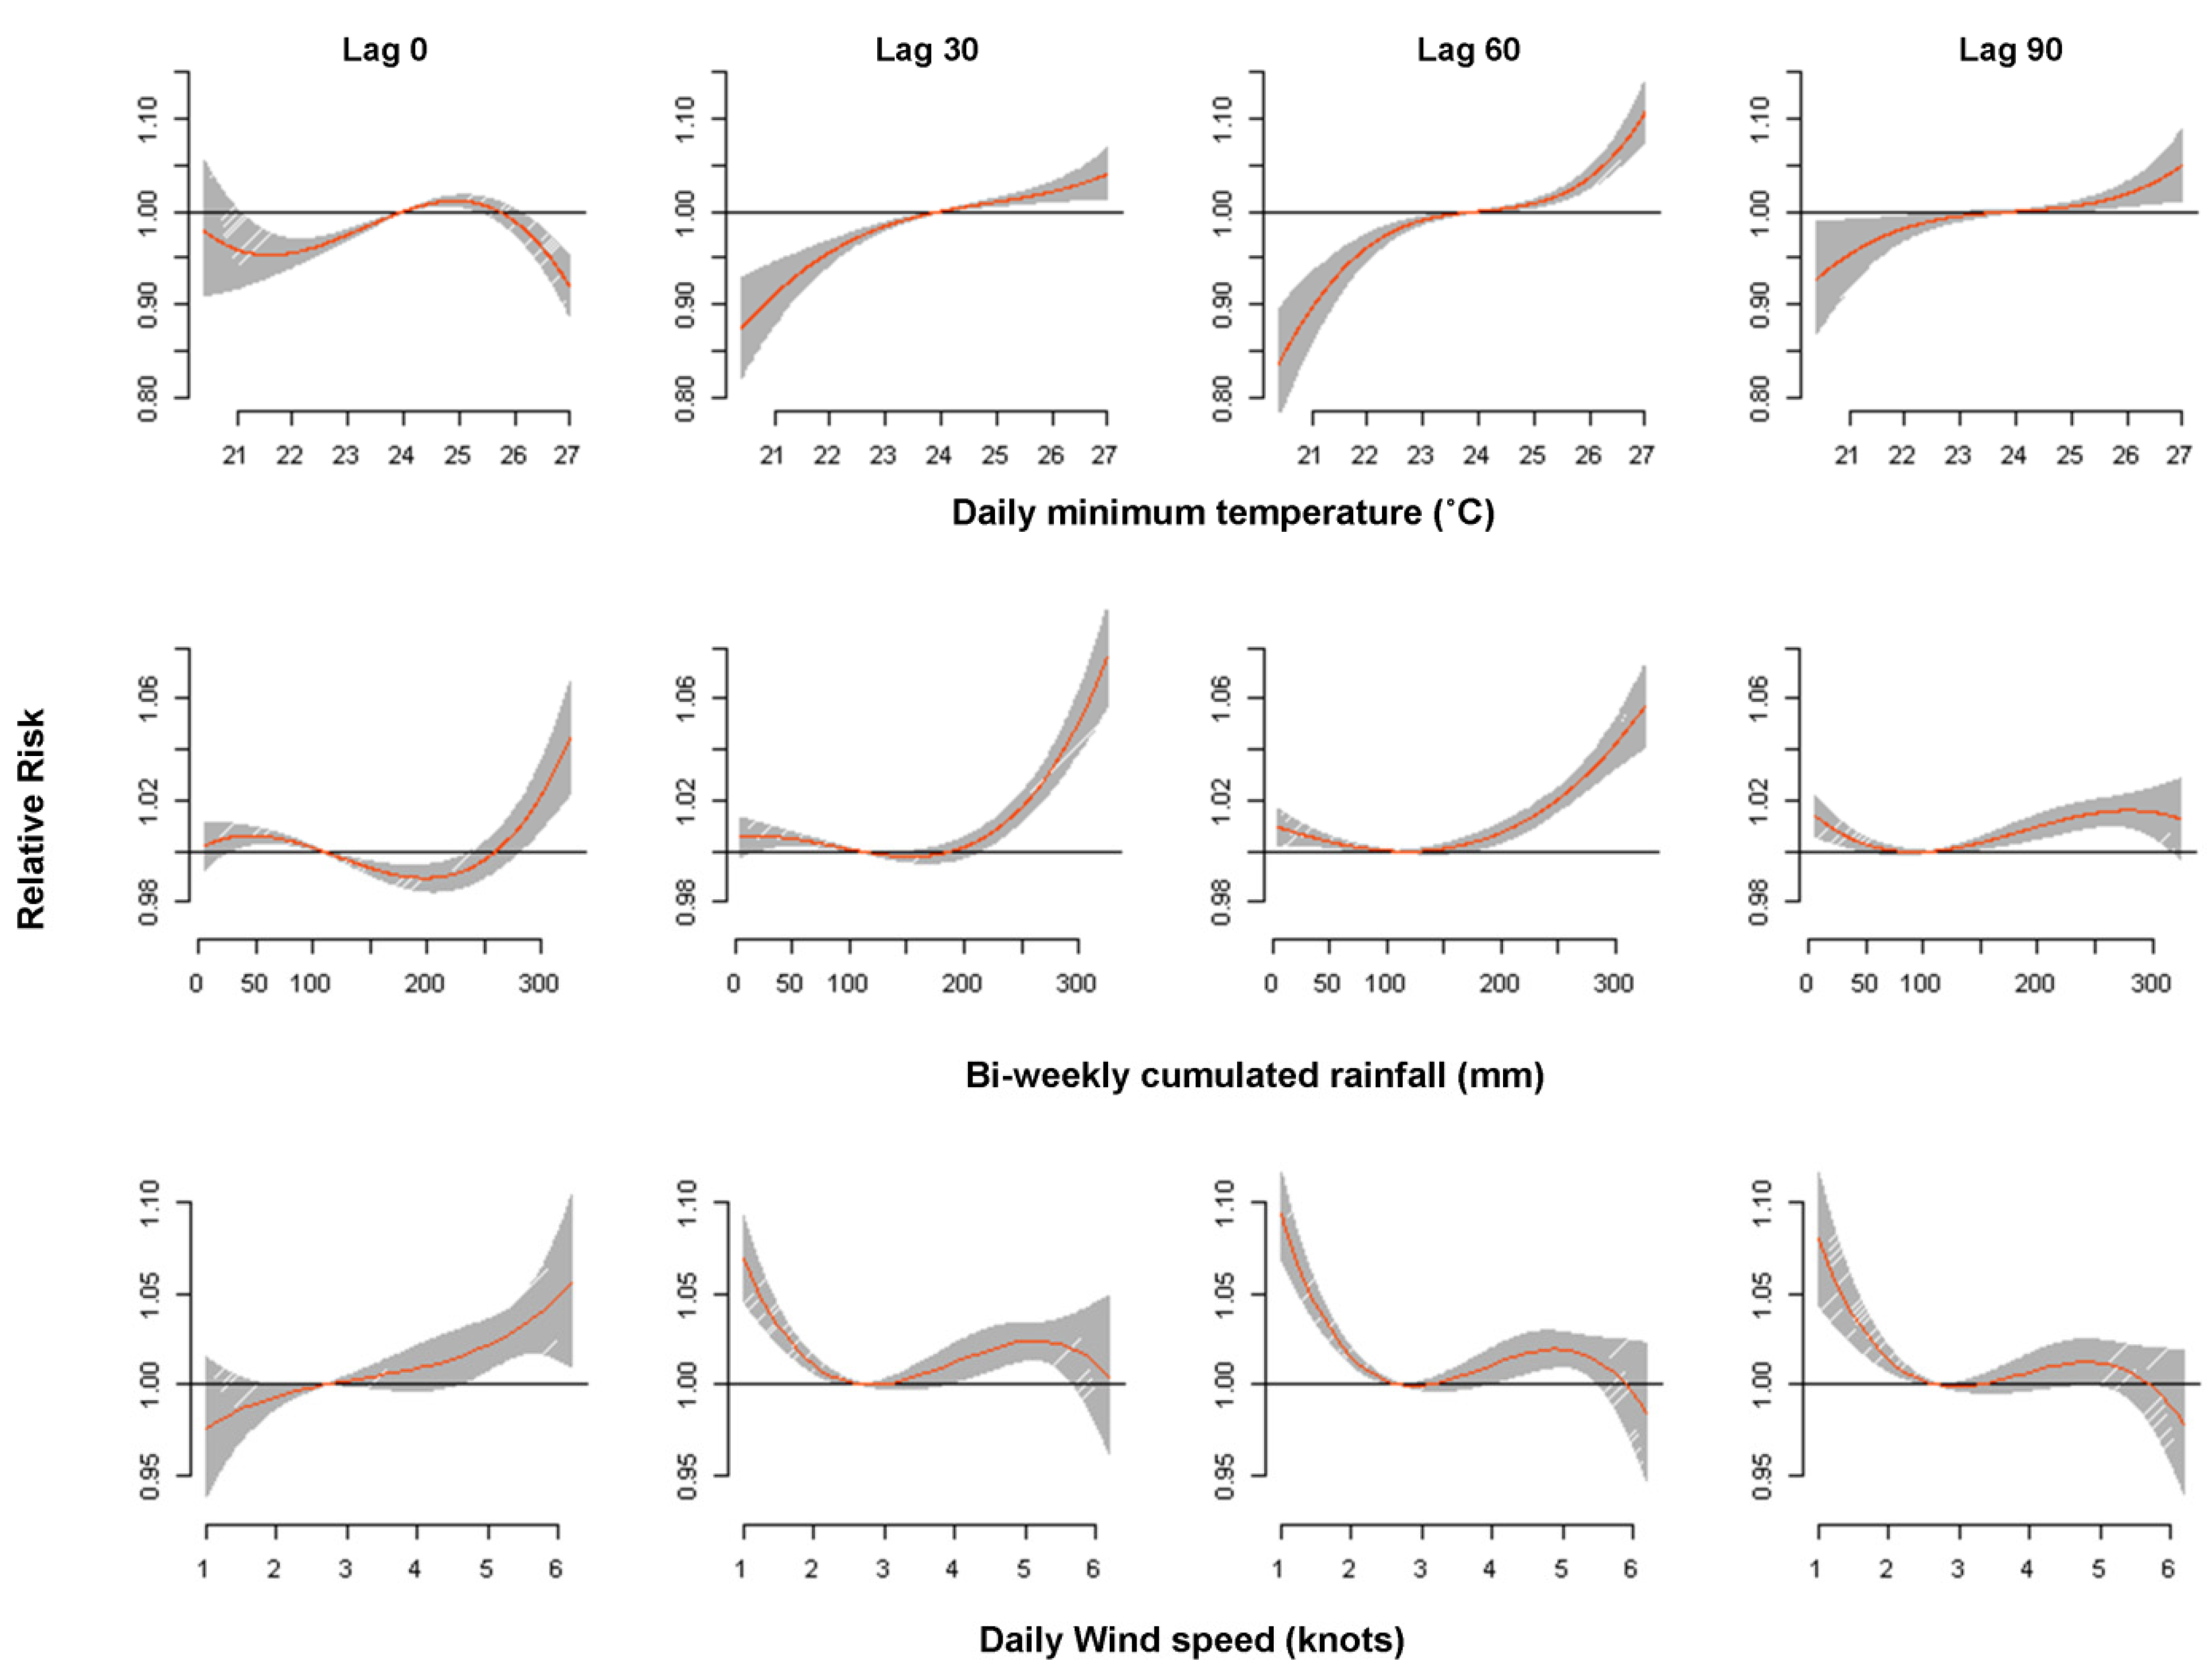
3.2. Association of Temperature and Dengue

The estimated effects of minimum temperature were nonlinear for dengue cases, with increasing relative risk at a higher minimum temperature (Figure 2a).
Figure 2. Relative Risk of dengue cases by (a) minimum temperature (°C); (b) rainfall (mm) and (c) wind speed (knots) for a lag of 90 days, using a “natural cubic B-spline-natural cubic spline” DLNM with a 3 degrees of freedom natural cubic B-spline for minimum temperature, a 3 degrees of freedom natural cubic B-spline for accumulated rainfall, and a 3 degrees of freedom natural cubic B-spline for wind speed. The reference values were median of minimum temperature (24 °C), rainfall (108.20 mm), and wind speed (2.7 knots). (see also Supplemental Movie S1, Movie S2 and Movie S3).
Ijerph 10 06319 g002
The minimum temperature effect on dengue cases on the current day showed a different shape from the other specific lags of 30, 60 and 90 (Figure 3). The current day effect was basically not statistically significant, but the other lagged effect showed an increasing risk with an increase of minimum temperature. The increase of minimum temperature from 25.4 °C (90th percentile) to 26.5 °C (99th percentile) increased dengue cases by the highest amount, that is, 5.04% (95% CI: 3.58, 6.51) at a lag of 51 days (Table S4). The cumulative effect of the overall percentage change in the daily dengue cases exhibited a higher percentage value, of 11.92% (95% CI: 4.41–32.19) in warm temperature (an increase from 25.4 °C to 26.5 °C), than did the cold temperature (a decrease from 23 °C to 22 °C), at 0.10% (95% CI: 0.05–0.23) (Table S4).
Figure 3. Relative Risk of dengue cases by minimum temperature (°C), rainfall (mm) and wind speed (knots) at specific lags of 0, 30, 60 and 90 days, using a “natural cubic B-spline-natural cubic spline” DLNM with a 3 degrees of freedom natural cubic B-spline for minimum temperature, a 3 degrees of freedom natural cubic B-spline for accumulated rainfall, and a 3 degrees of freedom natural cubic B-spline for wind speed. The reference values were median of minimum temperature (24 °C), rainfall (108.2 mm), and wind speed (2.7 knots).
Ijerph 10 06319 g003

3.3. Association between Rainfall and Dengue

The estimated effect of rainfall on dengue cases obviously differed for low and high cumulated rainfall for a lag period of 90 days in the three-dimensional plot (Figure 2b). There was a strong effect at high rainfall, but a rather small effect at low rainfall (Figure 2b). Further, Figure 3 exhibited the strongest effect of rainfall at a lag of 30 days with a rapid increase of risk above bi-weekly cumulated rainfall of 200 mm. The increase of cumulated rainfall from 215 mm (90th percentile) to 302 mm (99th percentile) increased dengue cases by the highest, 4.75% (95% CI: 3.50, 6.01) at a lag of 26 to 28 days (Table S4). Overall, high rainfall exhibited a higher cumulative percentage value of 21.45% (95% CI: 8.96, 51.37) than the low rainfall level of 1.08% (95% CI: 0.94, 1.25) (Table S4).

3.4. Association of Wind Speed and Dengue

The three-dimensional plot shows that the relative risk of dengue cases are inversely associated with the wind speed for longer lag periods (Figure 2c). The effect of low wind speed lasted for a longer period, while the effect of a high wind speed lasted for a shorter period (Figure 2c). For the high wind speed, the high effects were the largest at a lag of 0, and then declined gradually. Figure 3 exhibits the wind speed effect on dengue cases during the current day differed from the lagged effect. The relative risk of dengue cases increased with the increasing wind speed on the current day. At the lag of 1, 2 and 3 months, wind speed was negatively associated with dengue cases up to 3 knots, positively associated from 3–5 knots, followed by a negative association again at 5 knots and above. Table S4 shows the percentage change of wind speed on dengue cases. The drop of wind speed from 2.7 knots (10th percentile) to 1.7 knots (1st percentile) increased dengue cases by the highest amount, 4.02% (95% CI: 2.99, 5.06) at a lag of 59 days (Table S4). However, the increase of wind speed from 4.1 knots (90th percentile) to 5.7 knots (99th percentile) showed the highest effect at the lag of 0, 2.80% (95% CI: 0.12, 5.56), and then decreasing with the lagged period (Table S4). Overall, low wind speed exhibited a higher cumulative percentage value of 13.63% (95% CI: 5.42, 34.25) than the high wind speed of 1.30% (95% CI: 0.20, 8.39) (Table S4).

4. Discussion

The aim of this study was to estimate the effects of weather parameters on dengue cases, with particular focus placed on lag times. Although the relationships between climate change effects on local weather and ecological systems is complex [67], it is encouraging that we found a short-term association of weather parameters, including minimum temperature, rainfall and wind speed with dengue cases at different lag periods.
We found the highest significant positive association between dengue cases and the minimum temperature with the lag time of 51 days, that is, close to two months. The significant association of dengue cases with minimum temperature was reported in numerous studies [21,23,68]. Similar observations were also reported in Taiwan [69] and Mexico [20], where minimum temperature at a lag of two months had the highest positive effect on dengue cases. The two-month lagged period may include time for dengue vectors to develop from eggs, become infected with the virus, EIP and biting activities in the gonotrophic cycle, and then IIP. Increasing temperatures shorten the gonotrophic cycle [5,70] and reduce the EIP [14,71,72]. At higher but not extreme temperatures, adult infected vectors require more blood meal to complete the gonotrophic cycle, and more than one gonotrophic cycle throughout the survival life cycle may lead to an increasing risk of dengue transmission [10,73]. Furthermore, a recent incubation period review stated that EIP decreases with increases in temperature [14]. In addition, a different pattern of risk observed for the current day and the lagged days might be due to the flying behavior of adult dengue vectors (Figure 3). A higher risk of dengue cases in colder temperatures exists, as dengue vectors tend to fly farther at 15 °C than at 27 °C, which leads to greater dispersal and a higher biting rate of humans [74].
Rainfall season is positively associated with DENV adult abundance and higher dengue transmission [5,75,76]. We found a higher risk of dengue cases reported during the lag of 26–28 days, or close to one month for bi-weekly cumulated rainfall (Table S4). This is in line with the studies that reported the highest risk of dengue cases related to rainfall 3 weeks prior in Veracruz, Mexico [77], and one month prior in Rio de Janeiro, Brazil [21], respectively. Rainfall influences the abundance of dengue vectors in the winged (adult) and aquatic populations (eggs, larvae, pupae) [7]. Increased near-surface humidity associated with rainfall enhances adult dengue vectors flight activity and host-seeking behavior [7], whereas increased rainfall supports more suitable breeding sites for the immature development of the aquatic population [78]. Furthermore, prolonged rainfall that leads to flooding may increase the dengue risk [79,80]. Aside from the indoor breeding habitats, probable rain filled breeding sites ranged from discarded car tires, animal watering dishes, tree holes, and discarded and neglected bottles and other containers are often found in parks, vacant land, blocked cement drains and septic tanks [78,81,82]. Moreover, the short lag period of one month indicated that the presence of a critical hyperendemic DENV environment in the study area may be due to the vertical dengue virus transmitting directly from adult to offspring [83], and multiple DENV serotypes co-circulating [34].
We found that wind speed is inversely associated with the dengue cases (Figure 2c, Figure 3), which is in line with the study in Barbados [23], Guangzhou, China [31] and Sri Lanka [30]. This was further supported by the higher cumulative percentage change in low wind speed compared to high wind speed (Table S4). Wind suppresses dengue vectors host-seeking flying activity, which affects oviposition and contact with humans [84,85,86]. However, a slight increase of dengue risk was observed with an increase in wind speed from 3 knots to 5 knots, as this is still within the maximum threshold where dengue vectors can fly freely, which was reported to have a threshold of 4.4 knots in Wisconsin [87]. The suitable wind condition below the maximum threshold favors the dispersion of dengue vectors and their oviposition [88]. Furthermore, there was a steep decrease of wind speed’s effect on dengue cases for a short period of 10–15 lag days at high wind speeds (Figure 2c). This pattern suggests some harvesting phenomenon, as also reported by other studies [57,89]. Therefore, short lags cannot adequately be used to assess risk effects [90]. A maximum percentage increase from 1.7 knots to 2.7 knots was found at the lag of 59 days. This lag period of 59 days was reasonable if we include the period for immature development, EIP, DENV infection and transmission, and IIP.
Findings from our study can be adapted together with the other factors including population density, dengue virus circulating, efforts of vector control and vector density to assist in establishing a dengue early warning system. Current dengue disease control and prevention in Malaysia mainly based on the reported dengue cases in the passive surveillance system without predictive capabilities. For every notified dengue cases, adulticiding with space spraying is conducted. Other vector control strategies including larviciding with direct application of Temephos and misting of Bti [91], community-based larval control (COMBI) [92] and biological control [82] are applied for the selected outbreak areas or in areas where the outbreak cannot be controlled after long time period. In order to better control the dengue outbreak, an early warning system helps to alert on the increasing predicted risk of dengue based on the weather forecast and the other parameters to effectively target limited resources to the hotspot area [93]. This requires serious concern from local authorities, health professionals and the community to combine efforts for vector control and prevention.
However, our study also has some limitations. Firstly, there was under-reporting of dengue cases to an unknown degree [94]. Even if there were unreported dengue cases, our study still provides insights, the pattern of dengue occurrences were consistent over time when we compared with the clinically suspected dengue cases (results not shown) and this is the only national surveillance data that is available. Secondly, due to data limitations we could not include unmeasured confounders such as variation in virus serotype and variation in dengue vectors population density. Nevertheless, in hyperendemic areas, analytical models based on syndromic case surveillance can be more informative than the vector densities, as the dengue virus transmission can occur even when dengue vectors population densities are low because of the repeating feeding behavior [72,95]. Thirdly, we used the aggregated number of dengue cases and weather parameters from one principal weather station. Using weather parameters as close to the highly clustered dengue cases area could reduce the spatial discrepancies between the hotspot area and the location of weather station.

5. Conclusions

Temperature, rainfall and wind speed all influence dengue transmission in high population density areas. The estimated lagged effects and patterns, in accordance with the time necessary for the development of the dengue vectors, the EIP, and the incubation period in human body, as well as the onset of dengue symptoms, can be adapted in the vector control and prevention plan. The relationship found in this study helps to shed light on the link between weather and dengue for the development of future dengue prediction models while vaccines are not available.

Acknowledgments

The authors would like to thank the Director General of Health, Malaysia for his permission to publish this paper. We gratefully thank the Disease Control Division of Ministry of Health Malaysia for providing the data. We also thank Rohani Ahmad and Oliver Grübner for their advice on entomological and spatio-epidemiological aspects. We appreciate the assistance from Thomas Mönkemeier to create the animated movie. CYL is supported by the Ministry of Health Malaysia doctoral scholarship.

Conflicts of Interest

The authors declare no conflict of interest.

References

  1. World Health Organization. DengueNet Database and Geographic Information System. Available online: http://www.who.int/globalatlas (accessed on 9 January 2013).
  2. Gubler, D. Dengue/dengue haemorrhagic fever: History and current status. Novartis Found. Symp. 2006, 277, 3–16. [Google Scholar] [CrossRef]
  3. Hay, S.I.; Myers, M.F.; Burke, D.S.; Vaughn, D.W.; Endy, T.; Ananda, N.; Shanks, G.D.; Snow, R.W.; Rogers, D.J. Etiology of interepidemic periods of mosquito-borne disease. Proc. Natl. Acad. Sci. USA 2000, 97, 9335–9339. [Google Scholar] [CrossRef]
  4. Gubler, D.J.; Rosen, L. Quantitative aspects of replication of dengue viruses in Aedes albopictus (Diptera: Culicidae) after oral and parenteral infection. J. Med. Entomol. 1977, 13, 469–472. [Google Scholar]
  5. Halstead, S.B. Dengue virus-mosquito interactions. Annu. Rev. Entomol. 2008, 53, 273–291. [Google Scholar] [CrossRef]
  6. Hales, S.; de Wet, N.; Maindonald, J.; Woodward, A. Potential effect of population and climate changes on global distribution of dengue fever: An empirical model. Lancet 2002, 360, 830–834. [Google Scholar] [CrossRef]
  7. Wardekker, J.; de Jong, A.; van Bree, L.; Turkenburg, W.; van der Sluijs, J. Health risks of climate change: An assessment of uncertainties and its implications for adaptation policies. Environ. Health 2012, 11, 67. [Google Scholar] [CrossRef]
  8. Focks, D.A.; Haile, D.G.; Daniels, E.; Mount, G.A. Dynamic life table model for Aedes aegypti (Diptera: Culicidae): Analysis of the literature and model development. J. Med. Entomol. 1993, 30, 1003–1017. [Google Scholar]
  9. Patz, J.; Martens, W.; Focks, A.; Jetten, T. Dengue fever epidemic potential as projected by general circulation models of global climate change. Environ. Health Perspect. 1998, 6, 147–153. [Google Scholar]
  10. Delatte, H.; Gimonneau, G.; Triboire, A.; Fontenille, D. Influence of temperature on immature development, survival, longevity, fecundity, and gonotrophic cycles of aedes albopictus, vector of chikungunya and dengue in the Indian Ocean. J. Med. Entomol. 2009, 46, 33–41. [Google Scholar] [CrossRef]
  11. Focks, D.A.; Haile, D.G.; Daniels, E.; Mount, G.A. Dynamic life table model for Aedes aegypti (diptera: Culicidae): Simulation results and validation. J. Med. Entomol. 1993, 30, 1018–1028. [Google Scholar]
  12. Centers for Disease Control and Prevention. Dengue and the Aedes Aegypti Mosquito. Available online: http://www.cdc.gov/dengue/resources/30Jan2012/aegyptifactsheet.pdf (accessed on 2 November 2012).
  13. Gubler, D.J. Dengue and dengue hemorrhagic fever. Clin. Microbiol. Rev. 1998, 11, 480–496. [Google Scholar]
  14. Chan, M.; Johansson, M.A. The incubation periods of dengue viruses. PLoS One 2012, 7, e50972. [Google Scholar] [CrossRef]
  15. World Health Organization. Dengue Guidelines for Diagnosis, Treatment, Prevention and Control; World Health Organization: Geneva, Switzerland, 2009; Volume I, pp. 1–14. [Google Scholar]
  16. Yang, H.M.; Macoris, M.L.G.; Galvani, K.C.; Andrighetti, M.T.M.; Wanderley, D.M.V. Assessing the effects of temperature on the population of Aedes aegypti, the vector of dengue. Epidemiol. Infect. 2009, 137, 1188–1202. [Google Scholar]
  17. Hales, S.; Weinstein, P.; Souares, Y.; Woodward, A. El Nino and the dynamics of vectorborne disease transmission. Environ. Health Perspect. 1999, 107, 99–102. [Google Scholar]
  18. Gagnon, A.S.; Bush, A.B.G.; Smoyer-Tomic, K.E. Dengue epidemics and the El Niño Southern Oscillation. Climate Res. 2001, 19, 35–43. [Google Scholar] [CrossRef]
  19. Cazelles, B.; Chavez, M.; McMichael, A.J.; Hales, S. Nonstationary influence of El Niño on the synchronous dengue epidemics in Thailand. PLoS Med. 2005, 2, e106. [Google Scholar] [CrossRef] [Green Version]
  20. Garcia, C.; Garcia, L.; Espinosa-Carreon, L.; Ley, C. Abundance and distribution of Aedes aegypti (Diptera: Culicidae), and dengue dispersion in Guasave Sinaloa, Mexico. Rev. Biol. Trop. 2011, 59, 1609–1619. [Google Scholar]
  21. Gomes, A.F.; Nobre, A.A.; Cruz, O.G. Temporal analysis of the relationship between dengue and meteorological variables in the city of Rio de Janeiro, Brazil, 2001–2009. Cad. Saúde Pública 2012, 28, 2189–2197. [Google Scholar] [CrossRef]
  22. Gharbi, M.; Quenel, P.; Gustave, J.; Cassadou, S.; Ruche, G.; Girdary, L.; Marrama, L. Time series analysis of dengue incidence in Guadeloupe, French West Indies: Forecasting models using climate variables as predictors. BMC Infect. Dis. 2011, 11, 166. [Google Scholar] [CrossRef]
  23. Depradine, C.A.; Lovell, E.H. Climatological variables and the incidence of Dengue fever in Barbados. Int. J. Environ. Health Res. 2004, 14, 429–441. [Google Scholar] [CrossRef]
  24. Bi, P.; Tong, S.; Donald, K.; Parton, K.A.; Hobbs, J. Climate Variability and the Dengue Outbreak in Townsville, Queensland, 1992–1993. Environ. Health 2001, 1, 54–60. [Google Scholar]
  25. Earnest, A.; Tan, S.B.; Wilder-Smith, A. Meteorological factors and El Niño Southern Oscillation are independently associated with dengue infections. Epidemiol. Infect. 2012, 140, 1244–1251. [Google Scholar] [CrossRef]
  26. Arcari, P.; Tapper, N.; Pfueller, S. Regional variability in relationships between climate and dengue/DHF in Indonesia. Singap. J. Trop. Geogr. 2007, 28, 251–272. [Google Scholar] [CrossRef]
  27. Brunkard, J.M.; Cifuentes, E.; Rothenberg, S.J. Assessing the roles of temperature, precipitation, and ENSO in dengue re-emergence on the Texas-Mexico border region. Salud Publica Mexico 2008, 50, 227–234. [Google Scholar]
  28. Jeefoo, P.; Tripathi, N.K.; Souris, M. Spatio-temporal diffusion pattern and hotspot detection of dengue in Chachoengsao Province, Thailand. Int. J. Environ. Res. Public Health 2010, 8, 51–74. [Google Scholar] [CrossRef]
  29. Chen, M.J.; Lin, C.Y.; Wu, Y.T.; Wu, P.C.; Lung, S.C.; Su, H.J. Effects of extreme precipitation to the distribution of infectious diseases in Taiwan, 1994–2008. PLoS One 2012, 7, e34651. [Google Scholar] [CrossRef]
  30. Yasuoka, J.; Levins, R. Ecology of vector mosquitoes in Sri Lanka--suggestions for future mosquito control in rice ecosystems. Southeast Asian J. Trop. Med. Public Health 2007, 38, 646–657. [Google Scholar]
  31. Lu, L.; Lin, H.; Tian, L.; Yang, W.; Sun, J.; Liu, Q. Time series analysis of dengue fever and weather in Guangzhou, China. BMC Public Health 2009, 9, 395–400. [Google Scholar] [CrossRef]
  32. Tipayamongkholgul, M.; Fang, C.T.; Klinchan, S.; Liu, C.M.; King, C.C. Effects of the El Niño-Southern Oscillation on dengue epidemics in Thailand, 1996–2005. BMC Public Health 2009, 9, 422. [Google Scholar] [CrossRef]
  33. Shang, C.S.; Fang, C.T.; Liu, C.M.; Wen, T.H.; Tsai, K.H.; King, C.C. The role of imported cases and favorable meteorological conditions in the onset of dengue epidemics. PLoS Negl. Trop. Dis. 2010, 4, e775:1–e775:9. [Google Scholar]
  34. Chew, M.H.; Rahman, M.M.; Jelip, J.; Hassan, M.R.; Isahak, I. All serotypes of dengue viruses circulating in Kuala Lumpur, Malaysia. Curr. Res. J. Biol. Sci. 2012, 4, 229–234. [Google Scholar]
  35. Chen, C.D.; Nazni, W.A.; Lee, H.L.; Seleena, B.; Mohd Masri, S.; Chiang, Y.F.; Sofian-Azirun, M. Mixed breeding of Aedes aegypti (L.) and Aedes albopictus Skuse in four dengue endemic areas in Kuala Lumpur and Selangor, Malaysia. Trop. Biomed. 2006, 23, 224–227. [Google Scholar]
  36. Saleeza, S.N.R.; Norma-Rashid, Y.; Sofian-Azirun, M. Mosquitoes larval breeding habitat in Urban and Suburban Areas, Peninsular Malaysia. World Acad. Sci. Eng. Technol. 2011, 58, 569–573. [Google Scholar]
  37. Rozilawati, H.; Zairi, J.; Adanan, C.R. Seasonal abundance of Aedes albopictus in selected urban and suburban areas in Penang, Malaysia. Trop. Biomed. 2007, 24, 83–94. [Google Scholar]
  38. Rohani, A.; Suzilah, I.; Malinda, M.; Anuar, I.; Mazlan, I.M.; Maszaitun, M.S.; Topek, O.; Tanrang, Y.; Ooi, S.C.; Rozilawati, H.; et al. Aedes larval population dynamics and risk for dengue epidemics in Malaysia. Trop. Biomed. 2011, 28, 237–248. [Google Scholar]
  39. Saifur, R.G.M.; Hassan, A.A.; Dieng, H.; Ahmad, H.; Salmah, M.R.C.; Satho, T.; Saad, A.R.; Vargas, R.E.M. Update on temporal and spatial abundance of dengue vectors in Penang, Malaysia. J Amer Mosquito Contr Assn. 2012, 28, 84–92. [Google Scholar] [CrossRef]
  40. Dieng, H.; Saifur, R.G.M.; Abu Hassan, A.; Salmah, M.R.C.; Boots, M.; Satho, T.; Jaal, Z.; AbuBakar, S. Indoor-breeding of Aedes albopictus in Northern Peninsular Malaysia and its potential epidemiological implications. PLoS One 2010, 5, e11790. [Google Scholar] [CrossRef]
  41. Li, C.F.; Lim, T.W.; Han, L.L.; Fang, R. Rainfall, abundance of Aedes aegypti and dengue infection in Selangor, Malaysia. Southeast Asian J. Trop. Med. Public Health 1985, 16, 560–568. [Google Scholar]
  42. Shafie, A. Evaluation of the spatial risk factors for high incidence of dengue fever and dengue hemorrhagic fever using GIS application. Sains Malays. 2011, 40, 937–943. [Google Scholar]
  43. Olaniyi, A.O.; Abdullah, A.M.; Ramli, M.F.; Sood, A.M. Factors affecting agricultural land use for vegetables production—A case study of the state of Selangor, Malaysia. Afr. J. Agr. Res. 2012, 7, 5939–5948. [Google Scholar]
  44. Ministry of Health Malaysia, Academy of Medicine of Malaysia. Clinical Practice Guidelines on Management of Dengue Infection in Adults, 2nd ed.Ministry of Health Malaysia: Putrajaya, Malaysia, 2010; pp. 11–12.
  45. Chadwick, D.; Arch, B.; Wilder-Smith, A.; Paton, N. Distinguishing dengue fever from other infections on the basis of simple clinical and laboratory features: Application of logistic regression analysis. J. Clin. Virol. 2006, 35, 147–153. [Google Scholar] [CrossRef]
  46. Krishnan, N.; Purswani, M.; Hagmann, S. Severe dengue virus infection in pediatric travelers visiting friends and relatives after travel to the Caribbean. Amer. J. Trop. Med. Hyg. 2012, 86, 474–476. [Google Scholar] [CrossRef]
  47. Barrera, R.; Amador, M.; MacKay, A.J. Population dynamics of Aedes aegypti and dengue as influenced by weather and human behavior in San Juan, Puerto Rico. PLoS Negl. Trop. Dis. 2011, 5, e1378. [Google Scholar] [CrossRef]
  48. Guo, Y.M.; Barnett, A.G.; Tong, S.L. Spatiotemporal model or time series model for assessing city-wide temperature effects on mortality? Environ. Res. 2013, 120, 55–62. [Google Scholar] [CrossRef]
  49. National Climatic Data Center (NCDC). Global Summary of the Day (GSOD). Available online: http://www.ncdc.noaa.gov (accessed on 15 September 2012).
  50. Hastie, T.; Tibshirani, R. Generalized Additive Models, 2nd ed.; Chapman & Hall/CRC Press: Boca Raton, FL, USA, 1990; pp. 1–22. [Google Scholar]
  51. R Development Core Team. A Language and Environment for Statistical Computing. R Foundation for Statistical Computing: Vienna, Austria, 2013. Available online: http://www.r-project.org/ (accessed on 15 April 2013).
  52. Wood, S.N. Fast stable direct fitting and smoothness selection for generalized additive models. J. Roy. Stat. Soc. Ser. B-Stat. Met. 2008, 70, 495–518. [Google Scholar] [CrossRef] [Green Version]
  53. Wood, S. Generalized Additive Mmodels: An Introduction with R; Chapman & Hall/CRC Press: Boca Raton, FL, USA, 2006; pp. 119–265. [Google Scholar]
  54. Ferrier, S.; Watson, G.; Pearce, J.; Drielsma, M. Extended statistical approaches to modelling spatial pattern in biodiversity in northeast New South Wales. I. Species-level modelling. Biodivers. Conserv. 2002, 11, 2275–2307. [Google Scholar] [CrossRef]
  55. Alimadad, A.; Salibian-Barrera, M. An outlier-robust fit for generalized additive models with applications to disease outbreak detection. J. Amer. Statist. Assn. 2011, 106, 719–731. [Google Scholar]
  56. Burnham, K.P.; Anderson, D.R. Multimodel inference—Understanding AIC and BIC in model selection. Sociol. Method. Res. 2004, 33, 261–304. [Google Scholar] [CrossRef]
  57. Armstrong, B. Models for the relationship between ambient temperature and daily mortality. Epidemiology 2006, 17, 624–631. [Google Scholar] [CrossRef]
  58. Gasparrini, A. Distributed lag linear and non-linear models in R: The package dlnm. J. Stat. Softw. 2011, 43, 1–20. [Google Scholar]
  59. Iñiguez, C.; Ballester, F.; Ferrandiz, J.; Pérez-Hoyos, S.; Sáez, M.; López, A. Relation between temperature and mortality in Thirteen Spanish cities. Int. J. Environ. Res. Public Health 2010, 7, 3196–3210. [Google Scholar] [CrossRef]
  60. Thach, T.-Q.; Wong, C.-M.; Chan, K.-P.; Chau, Y.-K.; Chung, Y.-N.; Ou, C.-Q.; Yang, L.; Hedley, A.J. Daily visibility and mortality: Assessment of health benefits from improved visibility in Hong Kong. Environ. Res. 2010, 110, 617–623. [Google Scholar] [CrossRef]
  61. Tian, Z.; Li, S.; Zhang, J.; Jaakkola, J.; Guo, Y. Ambient temperature and coronary heart disease mortality in Beijing, China: A time series study. Environ. Health 2012, 11, 56. [Google Scholar] [CrossRef]
  62. Zhang, F.; Krafft, T.; Ye, B.; Zhang, J.; Luo, H.; Li, M.; Zhang, Y.; Zhou, L.; Xu, J.; Wang, W. The lag effects and seasonal differences of air pollutants on allergic rhinitis in Beijing. Sci. Total Environ. 2013, 442, 172–176. [Google Scholar] [CrossRef]
  63. Gasparrini, A.; Armstrong, B.; Kenward, M.G. Distributed lag non-linear models. Stat. Med. 2010, 29, 2224–2234. [Google Scholar] [CrossRef]
  64. Luo, Y.; Zhang, Y.; Liu, T.; Rutherford, S.; Xu, Y.; Xu, X.; Wu, W.; Xiao, J.; Zeng, W.; Chu, C.; et al. Lagged effect of diurnal temperature range on mortality in a subtropical megacity of China. PLoS One 2013, 8, e55280. [Google Scholar] [CrossRef]
  65. Gubler, D.J.; Clark, G.G. Dengue/dengue hemorrhagic fever: The emergence of a global health problem. Emerg. Infect. Dis. 1995, 1, 55–57. [Google Scholar]
  66. Eisen, L.; Lozano-Fuentes, S. Use of mapping and spatial and space-time modeling approaches in operational control of aedes aegypti and dengue. PLoS Negl. Trop. Dis. 2009, 3, e411. [Google Scholar] [CrossRef]
  67. Adger, W.N.; Eakin, H.; Winkels, A. Nested and teleconnected vulnerabilities to environmental change. Front. Ecol. Environ. 2008, 7, 150–157. [Google Scholar] [CrossRef]
  68. Chen, S.C.; Liao, C.M.; Chio, C.P.; Chou, H.H.; You, S.H.; Cheng, Y.H. Lagged temperature effect with mosquito transmission potential explains dengue variability in southern Taiwan: Insights from a statistical analysis. Sci. Total Environ. 2010, 408, 4069–4075. [Google Scholar] [CrossRef]
  69. Wu, P.C.; Guo, H.R.; Lung, S.C.; Lin, C.Y.; Su, H.J. Weather as an effective predictor for occurrence of dengue fever in Taiwan. Acta Trop. 2007, 103, 50–57. [Google Scholar] [CrossRef]
  70. Pant, C.P.; Yasuno, M. Field studies on the gonotrophic cycle of Aedes aegypti in Bangkok, Thailand. J. Med. Entomol. 1973, 10, 219–223. [Google Scholar]
  71. Focks, D.; Daniels, E.; Haile, D.; Keesling, J. A simulation model of the epidemiology of urban dengue fever: Literature analysis, model development, preliminary validation, and samples of simulation results. Amer. J. Trop. Med. Hyg. 1995, 53, 489–506. [Google Scholar]
  72. Scott, T.W.; Morrison, A.C. Vector dynamics and transmission of dengue virus: Implications for dengue surveillance and prevention strategies: Vector dynamics and dengue prevention. Curr. Top. Microbiol. Immunol. 2010, 338, 115–128. [Google Scholar] [CrossRef]
  73. Watts, D.M.; Burke, D.S.; Harrison, B.A.; Whitmire, R.E.; Nisalak, A. Effect of temperature on the vector efficiency of Aedes aegypti for dengue 2 virus. Amer. J. Trop. Med. Hyg. 1987, 36, 143–152. [Google Scholar]
  74. Rowley, W.; Graham, C. The effect of temperature and relative humidity on the flight performance of female Aedes aegypti. J. Insect Physiol. 1968, 14, 1251–1257. [Google Scholar] [CrossRef]
  75. Moore, C.G.; Cline, B.L.; Ruiz-Tiben, E.; Lee, D.; Romney-Joseph, H.; Rivera-Correa, E. Aedes aegypti in Puerto Rico: Environmental determinants of larval abundance and relation to dengue virus transmission. Amer. J. Trop. Med. Hyg. 1978, 27, 1225–1231. [Google Scholar]
  76. Pham, H.; Doan, H.; Phan, T.; Minh, N. Ecological factors associated with dengue fever in a central highlands Province, Vietnam. BMC Infect. Dis. 2011, 11, 172. [Google Scholar] [CrossRef]
  77. Hurtado-Diaz, M.; Riojas-Rodriguez, H.; Rothenberg, S.; Gomez-Dantes, H.; Cifuentes, E. Short communication: Impact of climate variability on the incidence of dengue in Mexico. Trop. Med. Int. Health 2007, 12, 1327–1337. [Google Scholar] [CrossRef]
  78. Lowe, R.; Bailey, T.C.; Stephenson, D.B.; Graham, R.J.; Coelho, C.A.S.; Carvalho, M.S.; Barcellos, C. Spatio-temporal modelling of climate-sensitive disease risk: Towards an early warning system for dengue in Brazil. Comput. Geosci. 2011, 37, 371–381. [Google Scholar] [CrossRef]
  79. Hashizume, M.; Dewan, A.; Sunahara, T.; Rahman, M.; Yamamoto, T. Hydroclimatological variability and dengue transmission in Dhaka, Bangladesh: A time-series study. BMC Infect. Dis. 2012, 12, 98. [Google Scholar] [CrossRef]
  80. Bich, T.H.; Quang, L.N.; Ha le, T.T.; Hanh, T.T.; Guha-Sapir, D. Impacts of flood on health: Epidemiologic evidence from Hanoi, Vietnam. Glob. Health Action 2011, 4. [Google Scholar] [CrossRef]
  81. Wan-Norafikah, O.; Nazni, W.A.; Noramiza, S.; Shafa’ar-Ko’Ohar, S.; Heah, S.K.; Nor-Azlina, A.H.; Khairuh-Asuad, M.; Lee, H.L. Distribution of aedes mosquitoes in three selected localities in Malaysia. Sains Malays. 2012, 41, 1309–1313. [Google Scholar]
  82. Chang, M.S.; Christophel, E.M.; Gopinath, D.; Abdur, R.M. Challenges and future perspective for dengue vector control in the Western Pacific Region. West. Pac. Surveill. Response J. 2011, 2, 9–16. [Google Scholar]
  83. Adams, B.; Boots, M. How important is vertical transmission in mosquitoes for the persistence of dengue? Insights from a mathematical model. Epidemics 2010, 2, 1–10. [Google Scholar] [CrossRef]
  84. Hoffmann, E.J.; Miller, J.R. Reduction of mosquito (Diptera: Culicidae) attacks on a human subject by combination of wind and vapor-phase DEET repellent. J. Med. Entomol. 2002, 39, 935–938. [Google Scholar] [CrossRef]
  85. Kay, B.H.; Ryan, P.A.; Lyons, S.A.; Foley, P.N.; Pandeya, N.; Purdie, D. Winter intervention against aedes aegypti (Diptera: Culicidae) larvae in subterranean habitats slows surface recolonization in summer. J. Med. Entomol. 2002, 39, 356–361. [Google Scholar] [CrossRef]
  86. Clements, A.N. The Biology of Mosquitoes: Sensory Reception and Behaviour; CABI: Wallingford, UK, 1999; Volume 2, pp. 281–284. [Google Scholar]
  87. Grimstad, P.R.; DeFoliart, G.R. Mosquito nectar feeding in Wisconsin in relation to twilight and microclimate. J. Med. Entomol. 1975, 11, 691–698. [Google Scholar]
  88. Service, M.W. Mosquito (Diptera: Culicidae) dispersal—The long and short of it. J. Med. Entomol. 1997, 34, 579–588. [Google Scholar]
  89. Turner, L.R.; Connell, D.; Tong, S. Exposure to hot and cold temperatures and ambulance attendances in Brisbane, Australia: A time-series study. BMJ Open 2012, 2, e001074. [Google Scholar] [CrossRef] [Green Version]
  90. Guo, Y.; Barnett, A.G.; Pan, X.; Yu, W.; Tong, S. The impact of temperature on mortality in Tianjin, China: A case-crossover design with a distributed lag nonlinear model. Environ. Health Perspect. 2011, 119, 1719–1725. [Google Scholar] [CrossRef] [Green Version]
  91. Nazni, W.A.; Lee, H.L.; Rozita, W.M.W.; Lian, A.C.; Chen, C.D.; Azahari, A.H.; Sadiyah, I. Oviposition behaviour of Aedes albopictus in temephos and Bacillus thuringiensis israelensis-treated ovitraps. Dengue Bull. 2009, 33, 209–217. [Google Scholar]
  92. Rozhan, S.; Jamsiah, M.; Rahimah, A.; Ang, K.T. The COMBI (Communication for Behavioural Impact) in the prevention and control of dengue-the hulu langat experience. J. Commun. Health 2006, 12, 19–32. [Google Scholar]
  93. Lowe, R.; Bailey, T.C.; Stephenson, D.B.; Jupp, T.E.; Graham, R.J.; Barcellos, C.; Carvalho, M.S. The development of an early warning system for climate-sensitive disease risk with a focus on dengue epidemics in Southeast Brazil. Stat. Med. 2013, 32, 864–883. [Google Scholar] [CrossRef]
  94. Shepard, D.S.; Undurraga, E.A.; Lees, R.S.; Halasa, Y.; Lum, L.C.S.; Ng, C.W. Use of multiple data sources to estimate the economic cost of dengue illness in Malaysia. Amer. J. Trop. Med. Hyg. 2012, 87, 796–805. [Google Scholar] [CrossRef]
  95. Kuno, G. Review of the factors modulating dengue transmission. Epidemiol. Rev. 1995, 17, 321–335. [Google Scholar]

Supplementary Files

  • Supplementary File 1:

    supplementary file 1 (PDF, 156 KB)

  • Supplementary File 2:

    supplementary file 2 (GIF, 4560 KB)

  • Supplementary File 3:

    supplementary file 3 (GIF, 5039 KB)

  • Supplementary File 4:

    supplementary file 4 (GIF, 5995 KB)

  • Share and Cite

    MDPI and ACS Style

    Cheong, Y.L.; Burkart, K.; Leitão, P.J.; Lakes, T. Assessing Weather Effects on Dengue Disease in Malaysia. Int. J. Environ. Res. Public Health 2013, 10, 6319-6334. https://doi.org/10.3390/ijerph10126319

    AMA Style

    Cheong YL, Burkart K, Leitão PJ, Lakes T. Assessing Weather Effects on Dengue Disease in Malaysia. International Journal of Environmental Research and Public Health. 2013; 10(12):6319-6334. https://doi.org/10.3390/ijerph10126319

    Chicago/Turabian Style

    Cheong, Yoon Ling, Katrin Burkart, Pedro J. Leitão, and Tobia Lakes. 2013. "Assessing Weather Effects on Dengue Disease in Malaysia" International Journal of Environmental Research and Public Health 10, no. 12: 6319-6334. https://doi.org/10.3390/ijerph10126319

    Article Metrics

    Back to TopTop