


1. INTRODUCTION
The snow that covers Arctic lands most of the year is a critical element in the surface energy budget because of its high albedo (Hall, Reference Hall2004; Pithan and Mauritsen, Reference Pithan and Mauritsen2014) and because the snowpack insulates the ground from the cold winter air (Zhang, Reference Zhang2005; Dutra and others, Reference Dutra, Viterbo, Miranda and Balsamo2012). A simplified description of the Arctic snowpack is that it consists of a basal depth hoar layer overlaid by a wind slab (Benson and Sturm, Reference Benson and Sturm1993; Sturm and others, Reference Sturm, Holmgren and Liston1995; Domine and others, Reference Domine, Cabanes and Legagneux2002; Sturm and Benson, Reference Sturm and Benson2004; Derksen and others, Reference Derksen2009; Domine and others, Reference Domine, Gallet, Bock and Morin2012; Domine and others, Reference Domine, Barrere and Sarrazin2016b), as illustrated in Figure 1. These two layer types have very different appearances and physical properties. The most typical type of depth hoar, similar to that encountered in the boreal forest (Sturm and Benson, Reference Sturm and Benson1997; Taillandier and others, Reference Taillandier2006) is formed of large (2–20 mm) hollow faceted and striated crystals which form unconsolidated layers of low density, ~200 kg m−3. Wind slabs are hard dense layers (typically 350–450 kg m−3) formed of small rounded grains typically 0.2–0.3 mm in size (Domine and others, Reference Domine, Cabanes and Legagneux2002).
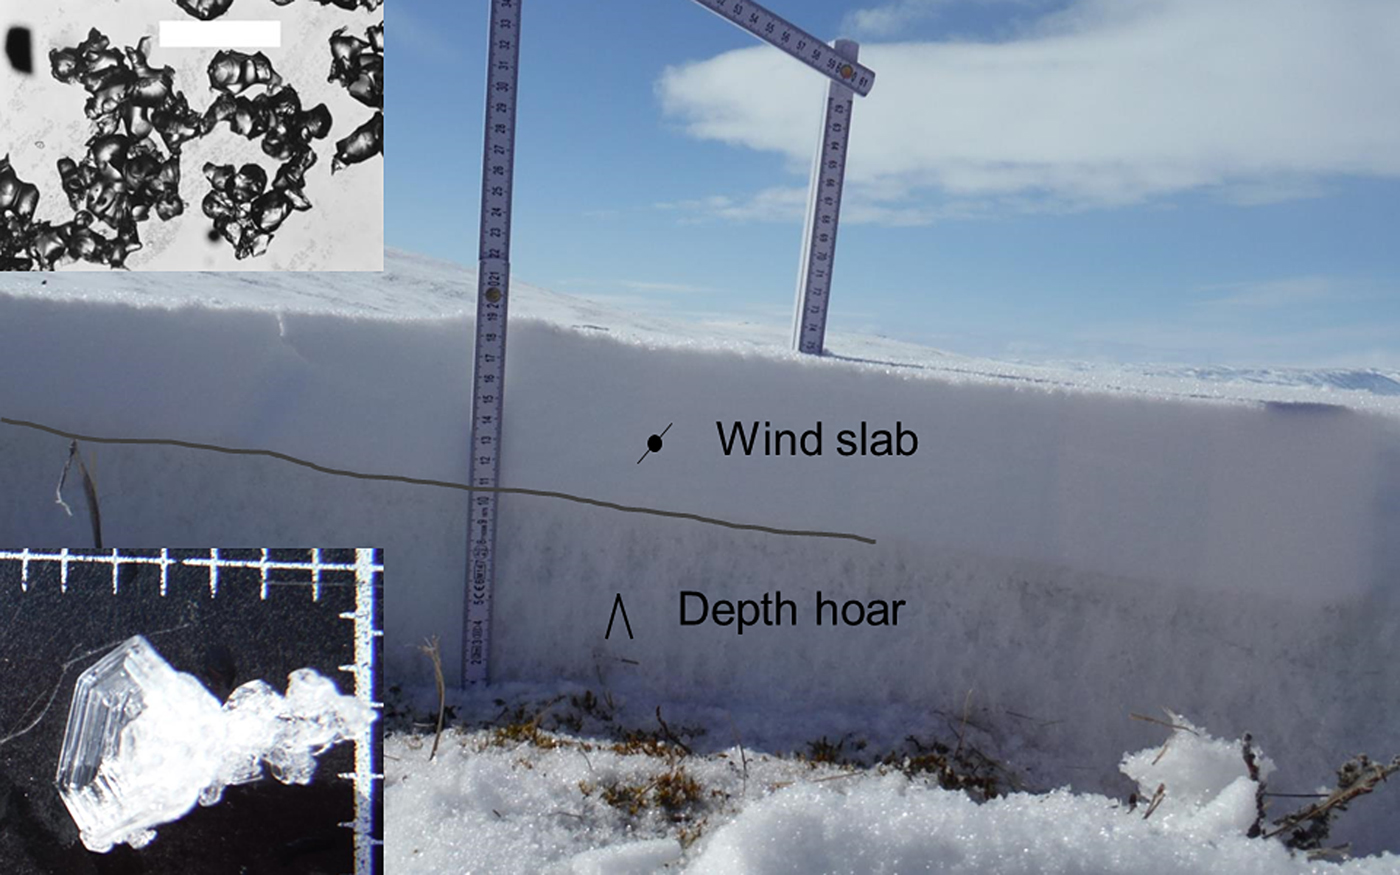
Fig. 1. Typical vertical section of the Arctic snowpack at Bylot Island in May 2015. The thin snowpack (20 cm) consists of a basal layer of unconsolidated depth hoar and a hard upper wind slab. Insets: photographs of a depth hoar crystal from this pit, 4 mm in size, and of small rounded grains from a wind slab. The scale bar in the wind slab inset is 1 mm.
Another critical difference between wind slabs and depth hoar layers is that wind slabs have a large thermal conductivity, 0.15–0.5 W m−1 K−1, while typical depth hoar shows much lower values, 0.025–0.1 W m−1 K−1 (Sturm and others, Reference Sturm, Holmgren, Konig and Morris1997; Sturm and others, Reference Sturm, Perovich and Holmgren2002; Domine and others, Reference Domine, Gallet, Bock and Morin2012; Domine and others, Reference Domine, Barrere and Sarrazin2016b). Depth hoar is thus responsible for most of the thermal insulance of Arctic snowpacks (Barrere and others, Reference Barrere2017), which affects not only the thermal regime of the ground, but also the near-surface air temperature (Dutra and others, Reference Dutra, Viterbo, Miranda and Balsamo2012).
Typical depth hoar has been reported to form from the metamorphism of snow subjected to a temperature gradient >20 K m−1 (Akitaya, Reference Akitaya1975; Marbouty, Reference Marbouty1980; Colbeck, Reference Colbeck1983). This gradient induces a water vapor pressure gradient which generates a water vapor flux between the warm base of the snowpack in contact with the ground and the top of the snowpack in contact with the cold winter air. The water vapor, generated by sublimation of the top of snow crystals, recondenses at the base of snow crystals above. The water vapor is thus delivered ‘hand to hand’ upward through the snowpack (Yosida, Reference Yosida1955), resulting in the growth of large faceted striated hollow crystals. Since the temperature gradient is greater at the beginning of the season when the ground is still at or near 0°C and the snowpack is thin, depth hoar is usually found at the base of the snowpack, although it is sometimes observed higher up between two wind slabs (Domine and others, Reference Domine, Cabanes and Legagneux2002; Sturm and Benson, Reference Sturm and Benson2004).
In Arctic snowpacks, depth hoar layers show significant variations in thickness, structure and physical properties, because depth hoar can be formed from different initial snow types (Sturm and others, Reference Sturm, Perovich and Holmgren2002; Derksen and others, Reference Derksen2009; Domine and others, Reference Domine, Barrere and Sarrazin2016b). When formed from deposited snow that has not been wind-drifted, as happens frequently in the boreal forest and less frequently on Arctic tundra, depth hoar is unconsolidated, very brittle, of low density (130–250 kg m−3) and of low thermal conductivity (0.025–0.1 W m−1 K−1) (Sturm and others, Reference Sturm and Benson1997; Domine and others, Reference Domine, Barrere, Sarrazin, Morin and Arnaud2015; Domine and others, Reference Domine, Barrere and Sarrazin2016b). Depth hoar can also form from wind slabs and is then referred to as indurated depth hoar. Such depth hoar has been described by Derksen and others (Reference Derksen2009): ‘Wind slabs formed in early winter often completely metamorphose into depth hoar by the end of the season as a result of these temperature gradients. The grains in these layers will be morphologically similar to regular depth hoar, but the layers will be stronger and more cohesive than normal for depth hoar layers, a relict feature of the original wind slab. We call these layers indurated.’ Domine and others (Reference Domine, Barrere and Morin2016a) add further observations: ‘Large depth hoar crystals coexist with small grains that have not been subject to fast crystal growth, probably because water vapour vertical transfer has followed preferential paths in the dense snow. This often gives indurated depth hoar a milky aspect.’ Indurated depth hoar can have a wide range of densities (230 to >400 kg m−3) and thermal conductivities (0.05 to >0.3 W m−1 K−1) (Sturm and others, Reference Sturm and Benson1997; Sturm and others, Reference Sturm, Perovich and Holmgren2002; Derksen and others, Reference Derksen2009; Domine and others, Reference Domine, Gallet, Bock and Morin2012; Domine and others, Reference Domine, Barrere and Morin2016a, Reference Domine, Barrere and Sarrazinb). Lastly, depth hoar can be formed from refrozen layers, e.g. snow that has been exposed to rain in fall (Domine and others, Reference Domine, Gallet, Bock and Morin2012, Reference Domine, Barrere and Morin2016a). It is then also indurated but does not have the milky aspect of indurated depth hoar formed from wind slabs because the small grains present in wind slabs have been replaced by larger grains caused by melting and refreezing. Its density and thermal conductivity are similar to those of depth hoar from wind slabs. Figure 2 shows the difference in appearance between typical depth hoar and indurated depth hoar formed in wind slabs.
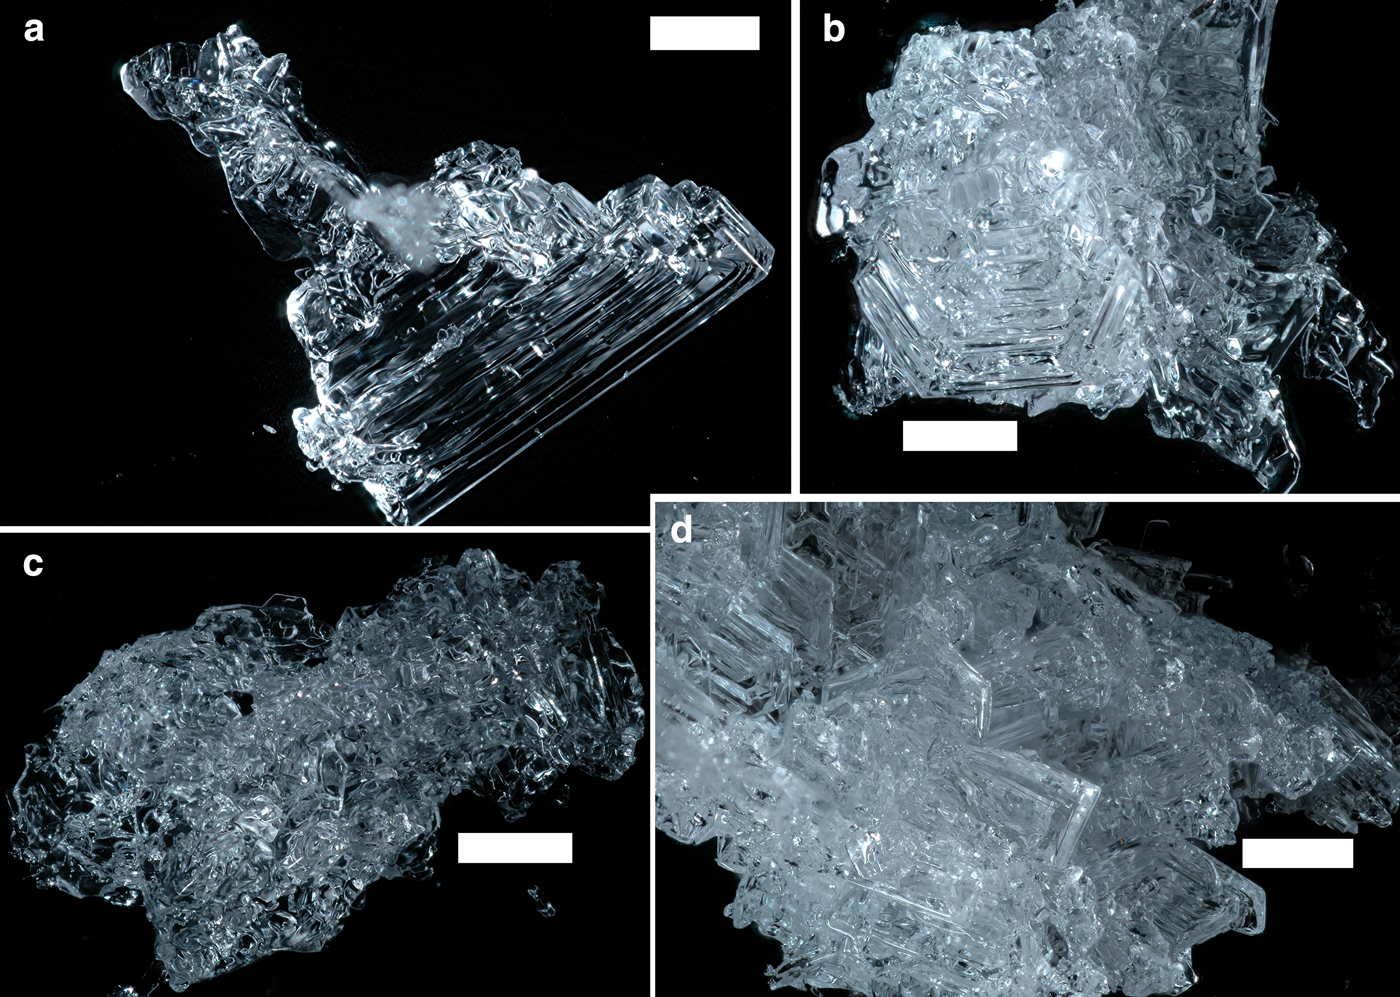
Fig. 2. Photomacrographs of depth hoar crystals. (a) Typical depth hoar, which forms unconsolidated low density layers. (b), (c) and (d) indurated depth hoar with various degrees of induration, which forms fairly hard and cohesive layers. (d) still has well-formed hollow faceted crystals, (b) is a mix between reasonably well formed hollow faceted crystals and small grains with a low degree of metamorphism, while (c), although showing facets and some hollow crystals, is mostly comprised of small grains. When observed in the field with the naked eye, (b) and (c) have a milky aspect typical of indurated depth hoar formed from wind slabs. Scale bars: 1 mm.
Depth hoar in its varied forms is ubiquitous in Arctic snowpacks. However during a spring field campaign at Ward Hunt Island in the Canadian high Arctic (83°05′N, 74°07′W), one of the northernmost and coldest low elevation Arctic sites, no depth hoar was found in most places. Given the importance of depth hoar for the snowpack thermal insulance and therefore for the ground thermal regime and near-surface air temperature (Zhang, Reference Zhang2005; Dutra and others, Reference Dutra, Viterbo, Miranda and Balsamo2012), we investigate here the conditions that impeded depth hoar formation at this a priori favorable site and compare them with those that prevail at another high Arctic site where we routinely observe typical and indurated depth hoar, Bylot Island (73°09′N, 80°00′W), in order to improve our understanding of the conditions required for depth hoar formation. Furthermore, several sophisticated snow physics models such as Crocus (Vionnet and others, Reference Vionnet2012) and SNOWPACK (Bartelt and Lehning, Reference Bartelt and Lehning2002) are not able to simulate adequately depth hoar formation under Arctic conditions (Domine and others, Reference Domine, Barrere and Sarrazin2016b) and these investigations might assist future developers in filling this gap. This is essential as studies have shown the importance of adequately simulating snow properties and in particular thermal conductivity to simulate the ground thermal regime and the evolution of permafrost (Paquin and Sushama, Reference Paquin and Sushama2015).
Our working hypothesis is that at Ward Hunt Island (hereafter WH) high wind speeds and low soil moisture combined to impede depth hoar formation. Strong winds form dense wind slabs, where depth hoar formation is impeded (Marbouty, Reference Marbouty1980) unless very high temperature gradients are present to form indurated depth hoar. Low soil moisture allows fast ground cooling because of the near-absence of a zero-curtain period (Outcalt and others, Reference Outcalt, Nelson and Hinkel1990), preventing the establishment of an elevated and persistent temperature gradient between the ground still at 0°C and the already cold atmosphere. We present here data from WH and Bylot Island to test this hypothesis and suggest in a preliminary manner a simple method to parameterize depth hoar thermal conductivity in land surface or climate models, in order to provide an alternative to existing snow schemes. We then consider how our observations might help identify new climate feedbacks.
2. METHODS
2.1. Site descriptions
The location of WH and Bylot Islands are shown on the map in Figure 3. WH qualifies as a polar desert, as detailed in Vincent and others (Reference Vincent2011). The average annual temperature for the 3 year period 2007–2009 was −17.2°C and precipitation is <200 mm per year. Permafrost is continuous and thick. The ground near our study site consists of coarse gravel with grains in the 1 mm–2 cm range. Vegetation is scarce. Vascular plants are rare (<5% of ground cover (Vincent and others, Reference Vincent2011)) and most vegetation consists of low lichen and bryophytes. At our study sites (~83°05′N, 74°08′W) the ground is mostly bare.
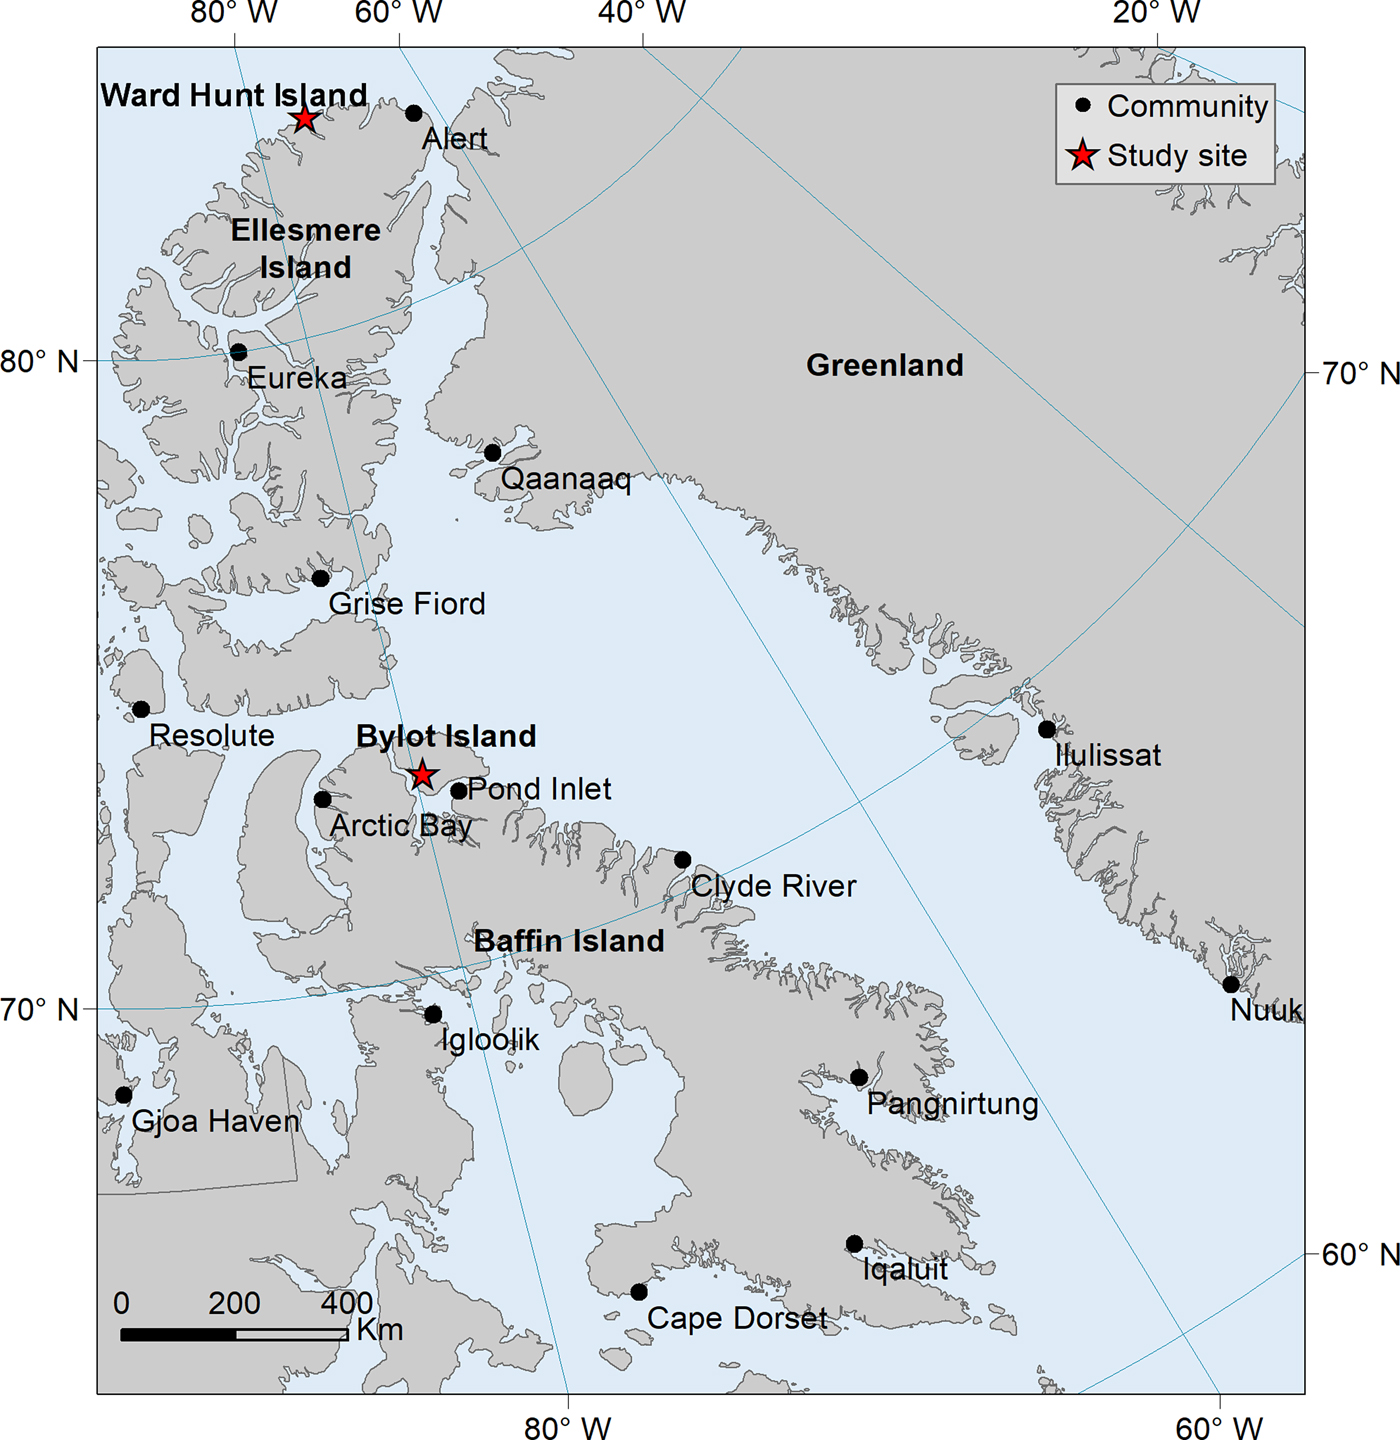
Fig. 3. Location of our study sites: WH and Bylot Island in the eastern Canadian high Arctic. WH is small and hidden by the red star.
Our study site on Bylot Island is in Qarlikturvik valley and our instrumental station is in a low center polygon (73°09′01.4″N, 80°00′16.6″W) as described in Domine and others (Reference Domine, Barrere and Sarrazin2016b). Vegetation consists mostly of sedges, graminoids and mosses with small prostrate willows (mostly Salix herbacea and S. arctica). The average annual temperature measured 1.5 km east of our site between 1 July 1998 and 30 June 2008 was −14.4°C. The soil consists of an organic litter layer 5–10 cm thick over sandy silt (Domine and others, Reference Domine, Barrere and Sarrazin2016b).
2.2. Environmental monitoring
At WH, air temperature, wind speed, wind direction, shortwave and longwave radiation and snow depth (at two locations) have been monitored since 2004 (Vincent and others, Reference Vincent2011; CEN, 2018b). In summer 2015, the monitoring of snow thermal conductivity at 3, 9 and 15 cm height was started using TP08 needle probes from Hukseflux following the method described in Domine and others (Reference Domine, Barrere, Sarrazin, Morin and Arnaud2015), as well as the monitoring of snow temperature at 0, 6 and 12 cm height. Starting in summer 2016, soil temperature, soil volume liquid water fraction (hereafter called soil moisture) using time domain reflectometry and soil thermal conductivity, all at 5 cm depth, were also monitored. Thermal conductivity is measured once every 2 d to minimize perturbation to the snow and soil and because this variable rarely shows rapid variations (Domine and others, Reference Domine, Barrere, Sarrazin, Morin and Arnaud2015; Domine and others, Reference Domine, Barrere and Sarrazin2016b). The other variables are measured every minute and hourly averages are recorded. A time-lapse camera was installed in summer 2015 with the snow instruments within its field of view. It was taking six photographs a day and functioned until 6 November 2015.
Manual field measurements were performed between 24 and 30 May 2016. Methods were similar to those detailed in Domine and others (Reference Domine, Barrere and Sarrazin2016b). Briefly, snow pits were dug and the stratigraphy was observed and recorded. Vertical density profiles were measured with a vertical resolution of 3 cm using a 100 cm3 metal box cutter 3 cm high. Snow thermal conductivity was measured with a heated needle probe (TP02 model from Hukseflux). The specific surface area (SSA) of the snow was determined from the snow reflectance at 1310 nm using an integrating sphere (DUFISSS instrument), from which SSA was derived (Gallet and others, Reference Gallet, Domine, Zender and Picard2009). SSA was measured with a vertical resolution of 1–2 cm.
At Bylot Island, environmental monitoring started in 1993 and instruments were added over the years in Qarlikturvik valley (CEN, 2018a). In 2004, a 10 m-high tower was added ~800 m from our site, which measured wind speed, wind direction and temperature at its top. In summer 2013, fairly complete instrumentation was deployed in the low-centered polygon mentioned above as described in Domine and others (Reference Domine, Barrere and Sarrazin2016b). The instruments included an air temperature and relative humidity sensor and an anemometer at 2.3 m height, a CNR4 radiometer with a CNF4 ventilator/heater, a thermal IR surface temperature gage and an ultrasonic snow gage. Snow thermal conductivity was monitored at 2, 12 and 22 cm height and snow temperature at 3, 7, 17, 27 and 37 cm. Soil temperature and moisture were monitored at 2, 5, 10 and 15 cm depth and soil thermal conductivity at 10 cm depth. Data from these instruments for the 2013–2014 and 2014–2015 winters have been detailed in Domine and others (Reference Domine, Barrere and Sarrazin2016b). Here we show additional data from the 2016–2017 winter. Manual field measurements were also performed between 14 and 20 May 2017, similarly to those at WH.
Snow thermal conductivity data are critical to this study. The heated needle probe method (Domine and others, Reference Domine, Barrere, Sarrazin, Morin and Arnaud2015) is currently the only practical technique to monitor this variable automatically. While very useful and reasonably reliable, this method, like any other, has limitations detailed in Domine and others (Reference Domine, Barrere, Sarrazin, Morin and Arnaud2015) largely based on investigations by Riche and Schneebeli (Reference Riche and Schneebeli2013). Briefly, a horizontally inserted needle measures a mixture of horizontal and vertical conductivities while many snow types and in particular depth hoar are anisotropic. Furthermore, there are indications that for large-grained snow such as depth hoar the needle probe method underestimates thermal conductivity. We are fully aware of these difficulties. However, the resulting uncertainty has been evaluated at 29% (Domine and others, Reference Domine, Barrere, Sarrazin, Morin and Arnaud2015). Since snow thermal conductivity varies over a factor of 25, in the range 0.025–0.65 W m−1 K−1 (Sturm and others, Reference Sturm and Benson1997), it is clear that even a 29% error still allows meaningful conclusions.
3. RESULTS
We start with data from the 2016–2017 winter at Bylot Island, where depth hoar has always been observed. These data, together with those of the 2014–2015 winter (Domine and others, Reference Domine, Barrere and Sarrazin2016b) will make the peculiarities of the snow at WH appear more clearly.
3.1. Bylot Island field data
Figure 1 shows a typical snowpack at Bylot Island. In spring 2017 depth hoar was slightly less abundant and was often indurated to various degrees because of snowdrift and slight melting in early October 2016, as revealed by time-lapse cameras in the valley. Figure 4 shows vertical profiles of density, thermal conductivity and SSA of seven snow pits. Three of these pits were in willow shrubs (Salix richardsonii) while four were on herb tundra. Depth hoar was present in all seven pits. It was often indurated and its density was never below 200 kg m−3, as expected from its indurated character (Derksen and others, Reference Derksen2014). Basal thermal conductivity was mostly low, but at the Salix f1a and herb 3 sites melting had been more extensive and the depth hoar was very hard, dense (Fig. 4b) and had a high thermal conductivity. In contrast, in spring 2015, much more moderate signs of melting were observed and the basal depth hoar layer was always unconsolidated, with thermal conductivities <0.05 W m−1 K−1 and densities <220 kg m−3 except in one case (Domine and others, Reference Domine, Barrere and Morin2016a). This illustrates the important role of fall processes, which affect depth hoar properties during the whole snow season.
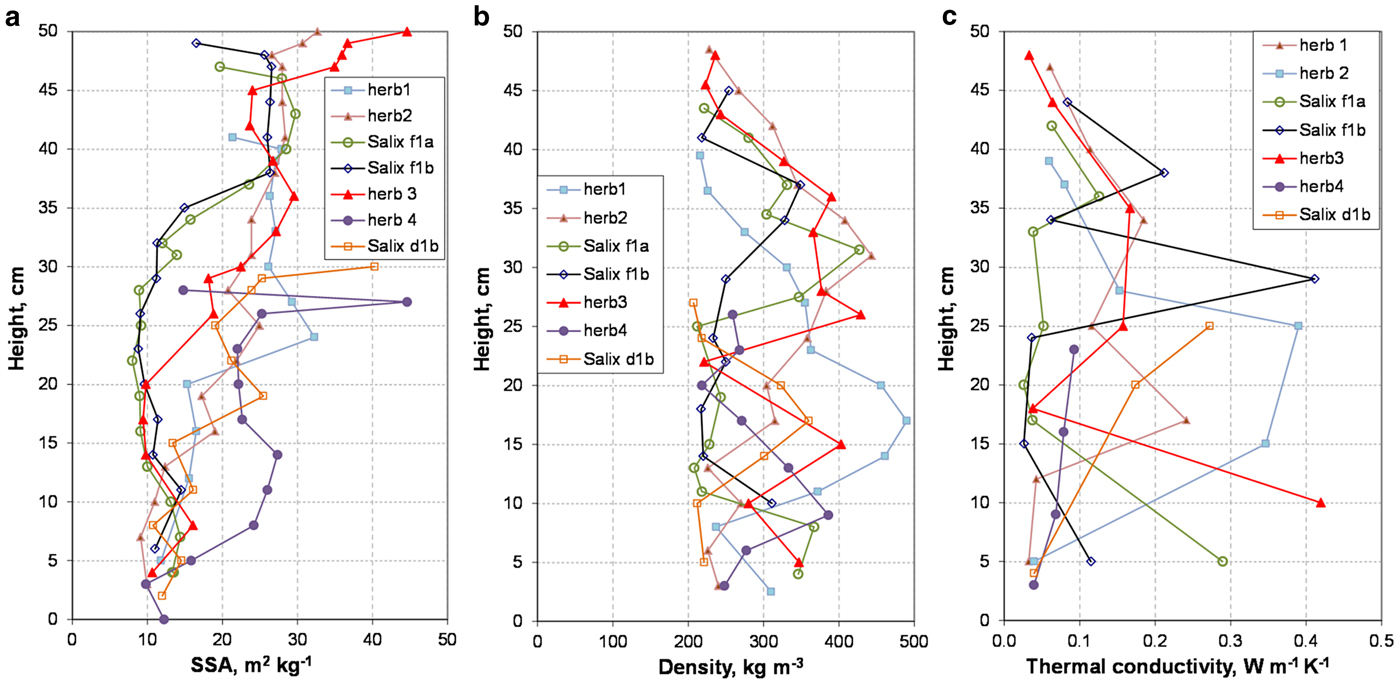
Fig. 4. Vertical profiles of physical properties for snow pits at Bylot Island in May 2017. (a) SSA; (b) density and (c) thermal conductivity.
3.2. Bylot monitoring data, fall 2016
Figure 5 shows snow, atmospheric and soil data for the 2016–2017 winter. Time-lapse photographs show that snowfalls on 3, 9 and 10 October established a permanent snow cover. Continuous thermal conductivity measurements started on 3 October at 2 cm height, on 13 October at 12 cm and on 16 October at 22 cm.
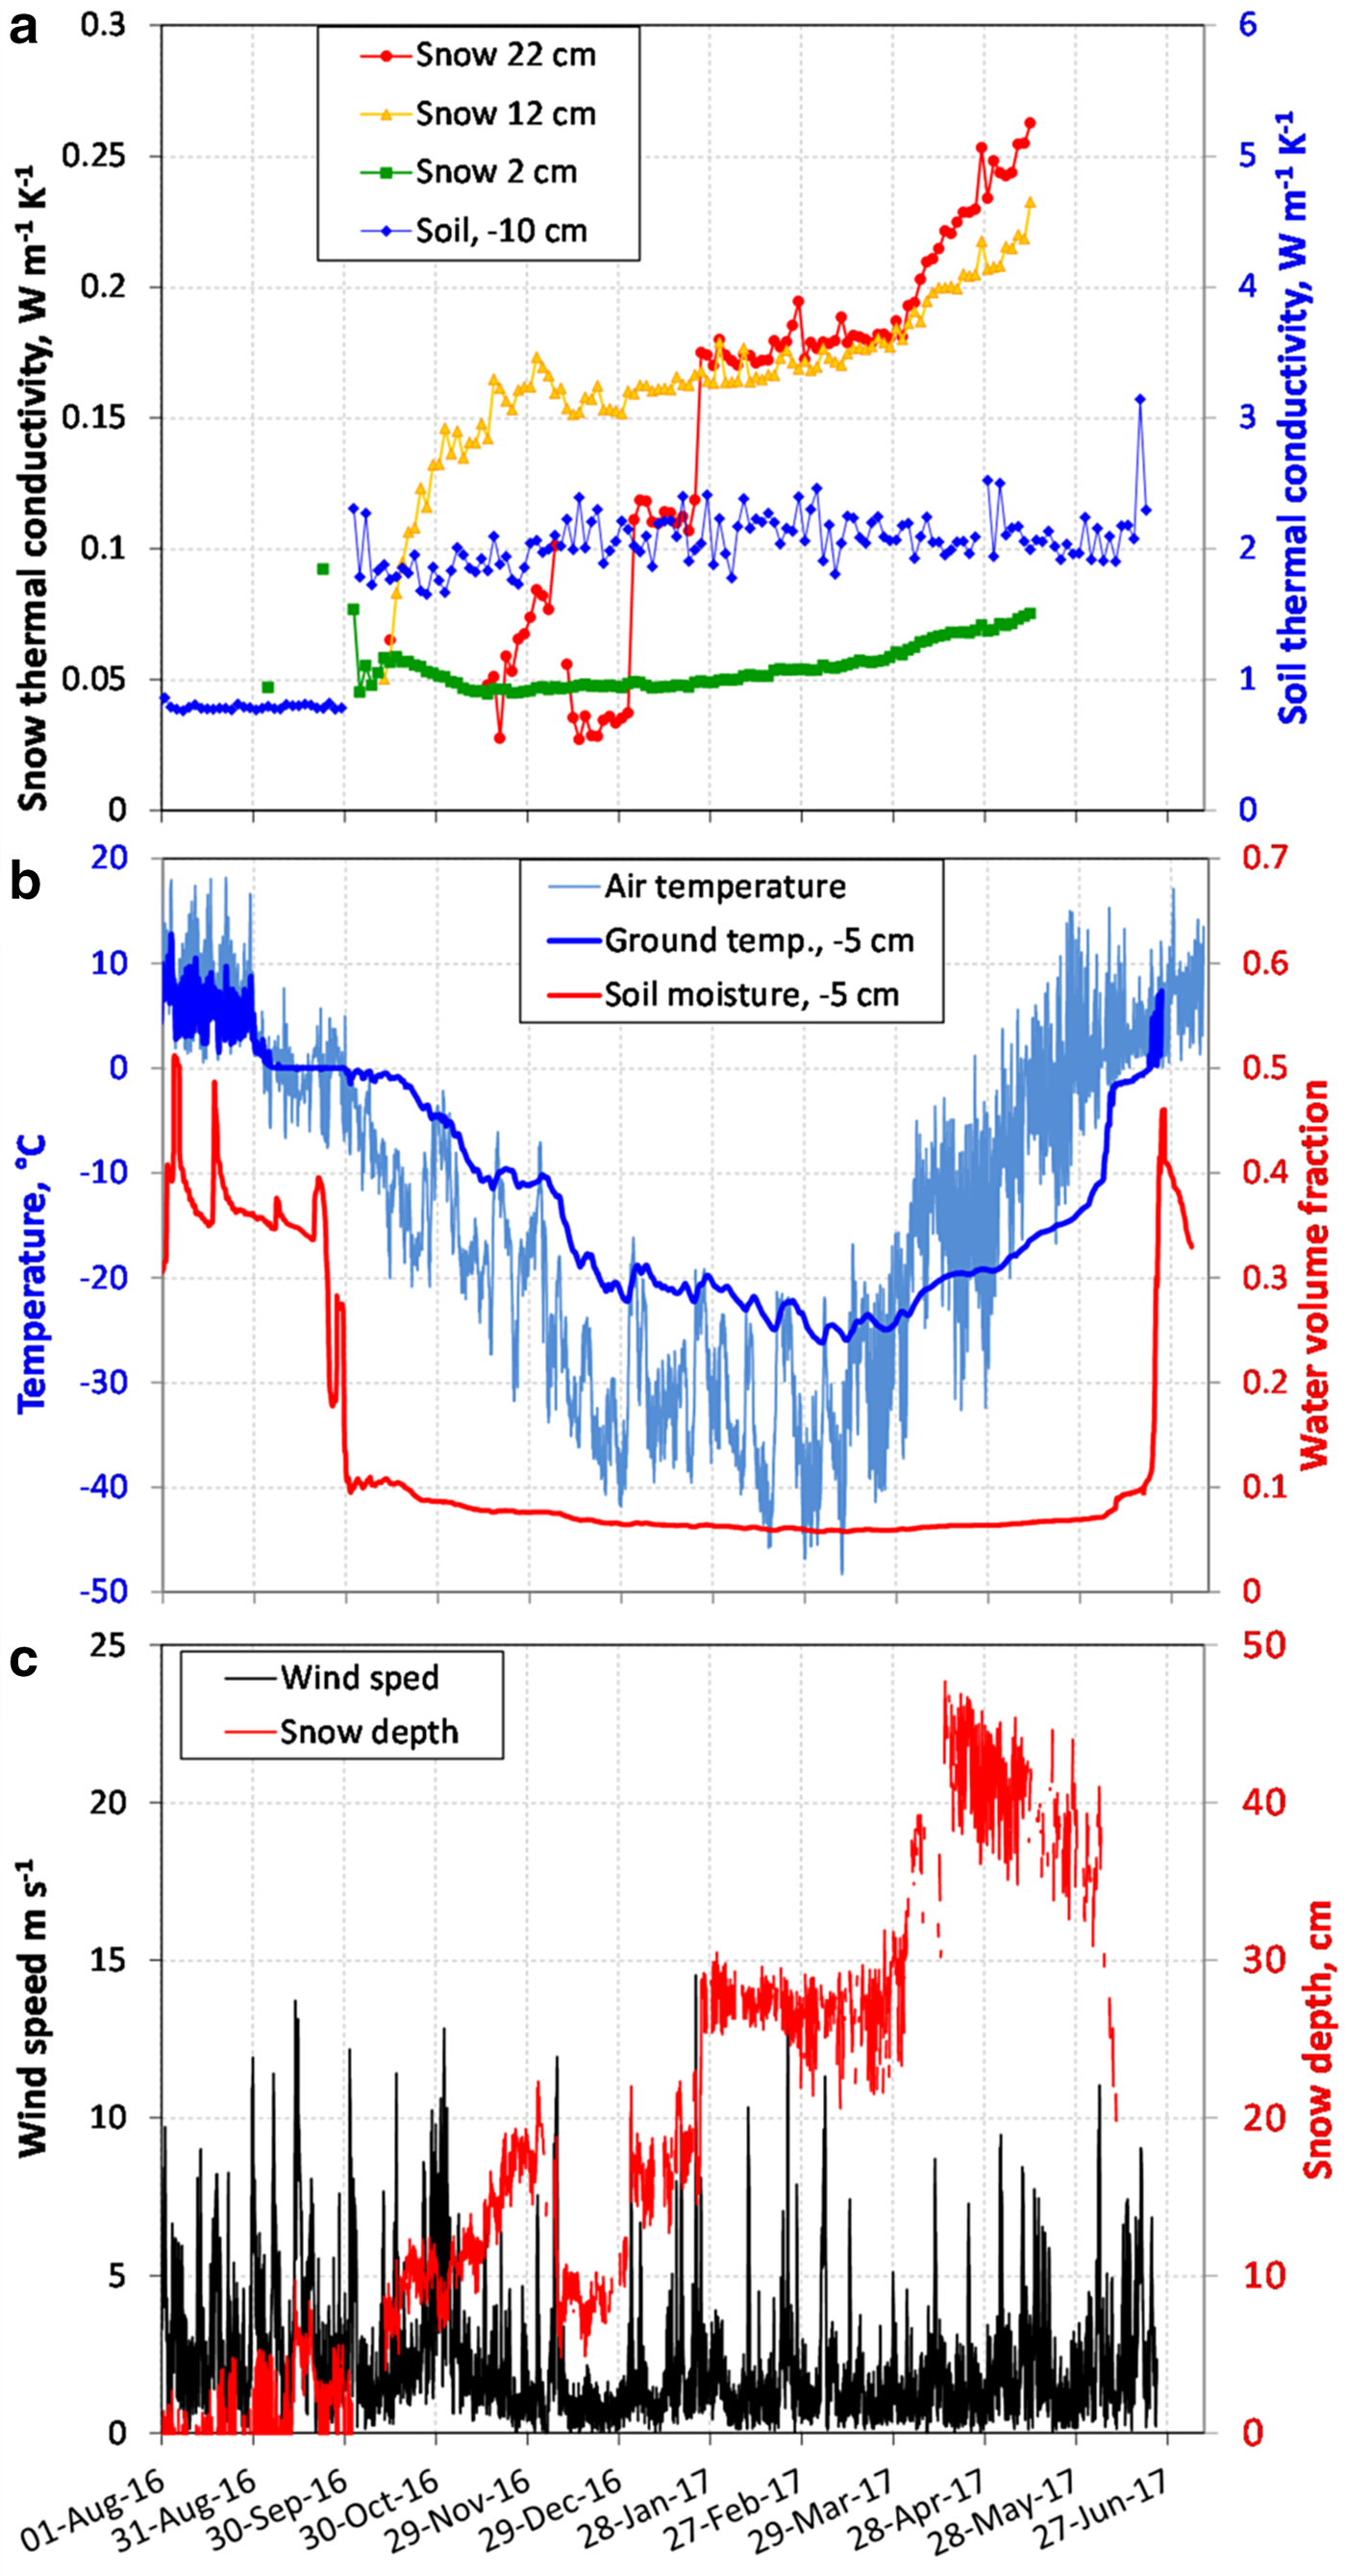
Fig. 5. Environmental time series for Bylot Island for the 2016–2017 winter. (a) Snow thermal conductivity at three heights and ground thermal conductivity at 10 cm depth. (b) Air temperature and ground temperature at 5 cm depth and soil moisture at 5 cm depth. (c) Wind speed and snow depth. The full dataset is archived in CEN (2018a).
Figure 5a shows that the thermal conductivity at 2 cm height shows an initial rapid decrease followed by values that remain fairly stable for several months ~0.05 W m−1 K−1, a value typical of depth hoar. The initial decrease, also observed in fall 2014 (Domine and others, Reference Domine, Barrere and Sarrazin2016b), is indicative of depth hoar formation. The 2016 depth hoar thermal conductivity value is twice that of 2014 when little effect of melting was noticed. Thermal conductivity at 12 and 22 cm on the contrary are typical of wind slab sintering. The complex behavior at 22 cm indicates several stages of erosion and redeposition during snow storms on 7–8 December 2016 and 2 and 23 January 2017, with maximum wind speeds of, respectively, 11.9, 10.0 and 14.5 m s−1.
The initial soil moisture at 5 cm depth was ~35% in early September (Fig. 5b). The soil reached 0°C on 5 September, remained exactly at 0°C until 29 September and then hovered between 0 and −1°C until 16 October so that the zero-curtain period lasted 41 d. During that time the air temperature dropped as low as −20°C. This allowed the establishment of a large temperature gradient in the thin snowpack. It could only be measured reliably when the second highest temperature sensor at 7 cm height was covered on 9 October and then remained around 80 K m−1 for a few days before rising to >200 K m−1 on 12 October (Fig. 6). It averaged 113 K m−1 during the first 15 d of measurements and 81 K m−1 until 31 December. Values >100 k m−1 were still recorded on 23 March 2017. Such high gradients allowed the development of basal depth hoar everywhere, even in snow where density measured in May 2017 was >350 kg m−3.
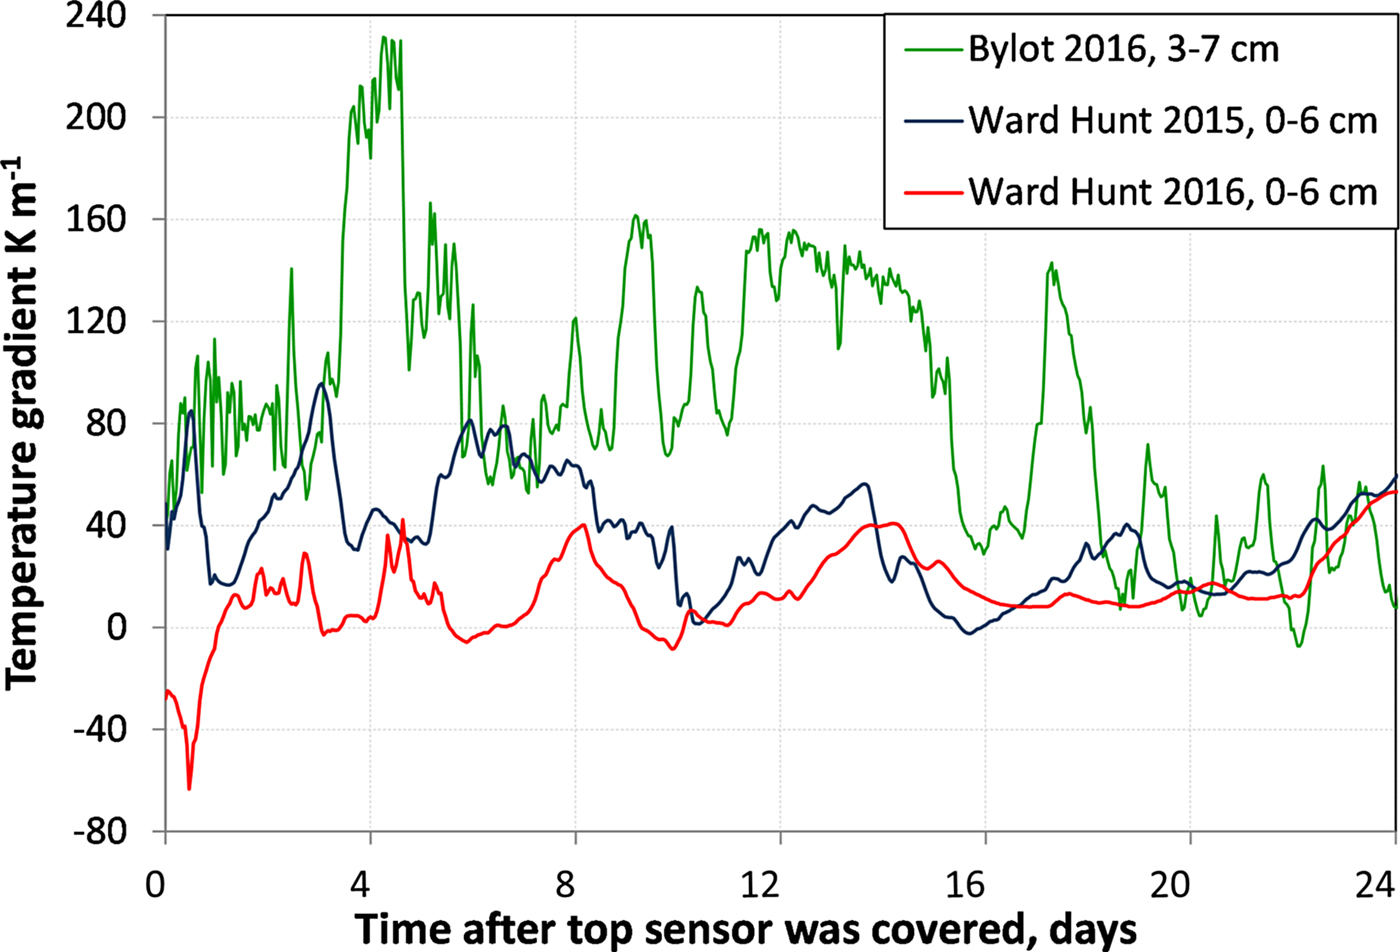
Fig. 6. Time series of the temperature gradient at or near the base of the snowpack at Bylot Island for fall 2016 and WH for falls 2015 and 2016. The series start when the gradient becomes measureable, i.e. when the top temperature sensor (6 cm at WH and 7 cm at Bylot) is covered by snow. The dates were 9 October 2016 for Bylot and 6 November 2015 and 26 September 2016 for WH.
Wind leads to snow compaction. Figure 7 shows that early season wind speeds remained moderate with extended calm periods during which snow grains could grow and subsequently avoid being drifted by wind events. Time-lapse photographs show limited drifting on 3–4 October when wind speed reached 7 m s−1. More drifting is visible on 13 October, with snow accumulation behind grass clumps. Small barchans and sastrugi formed, but snow erosion was limited. Erosion on exposed topographic highs is however visible on 17 October, when wind reached 11 m s−1. Nevertheless, overall perturbations by wind were moderate and the resulting snow compaction was probably limited, especially compared with what was observed at WH.
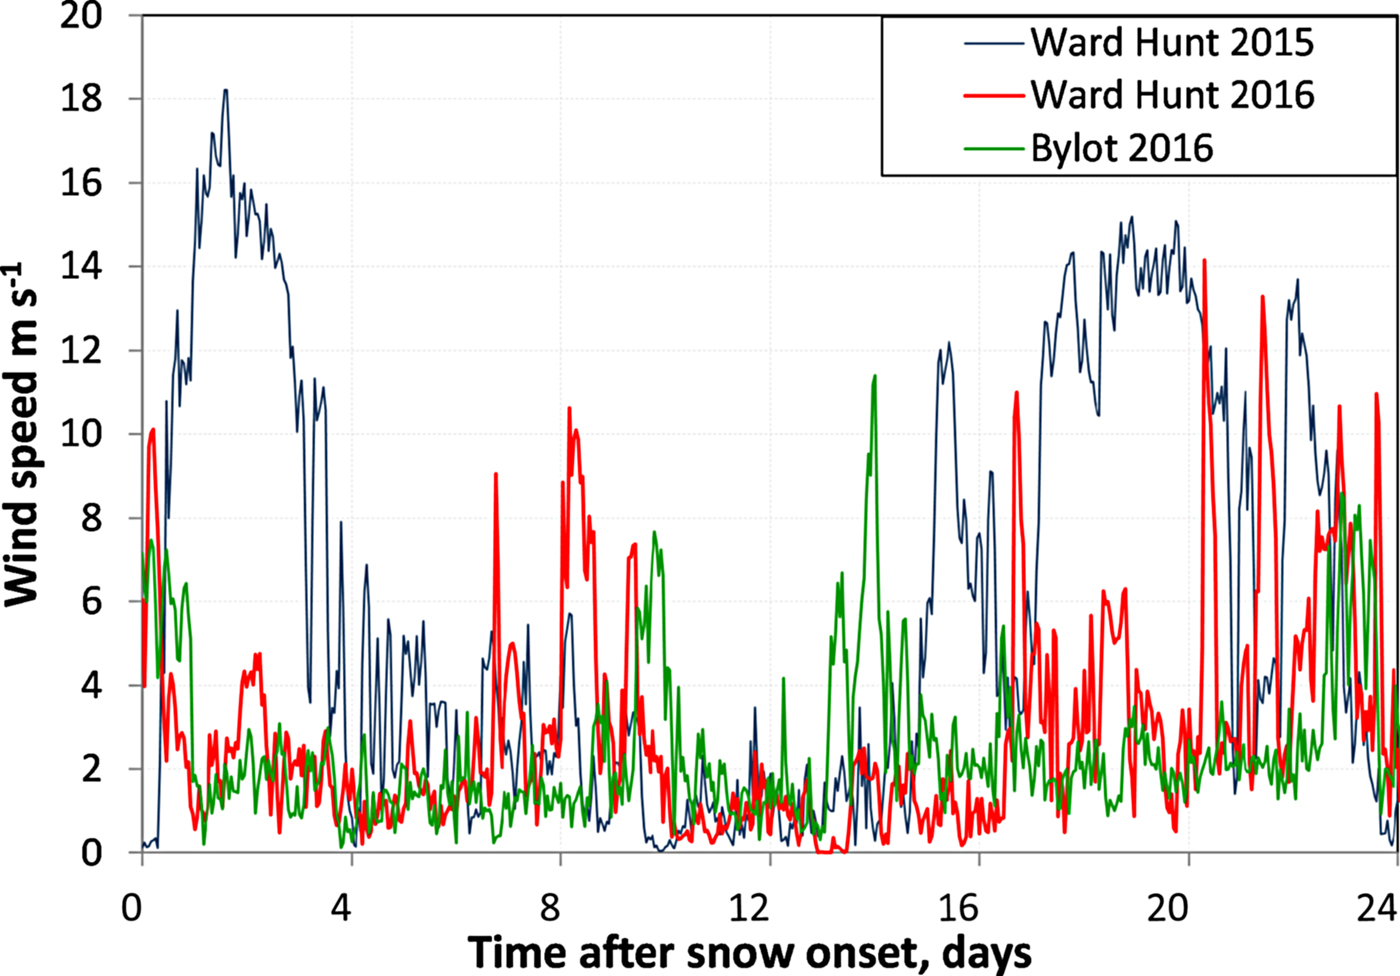
Fig. 7. Time series of the wind speed (10 m height) at Bylot for fall 2016 and WH for falls 2015 and 2016. The series start when snow cover at the TP08 post becomes permanent. The dates were 3 October 2016 for Bylot and 16 October 2015 and 1 September 2016 for WH.
3.3. WH field data
Photographs of typical snowpacks observed at WH are shown in Figure 8. Most of the time, depth hoar was absent from the base of the snowpack. Occasional thin layers (Fig. 8a) or basal depth hoar lenses were observed. Most snow layers were hard, although occasional unconsolidated layers of faceted crystals or even rare depth hoar were encountered higher up in the snowpack.
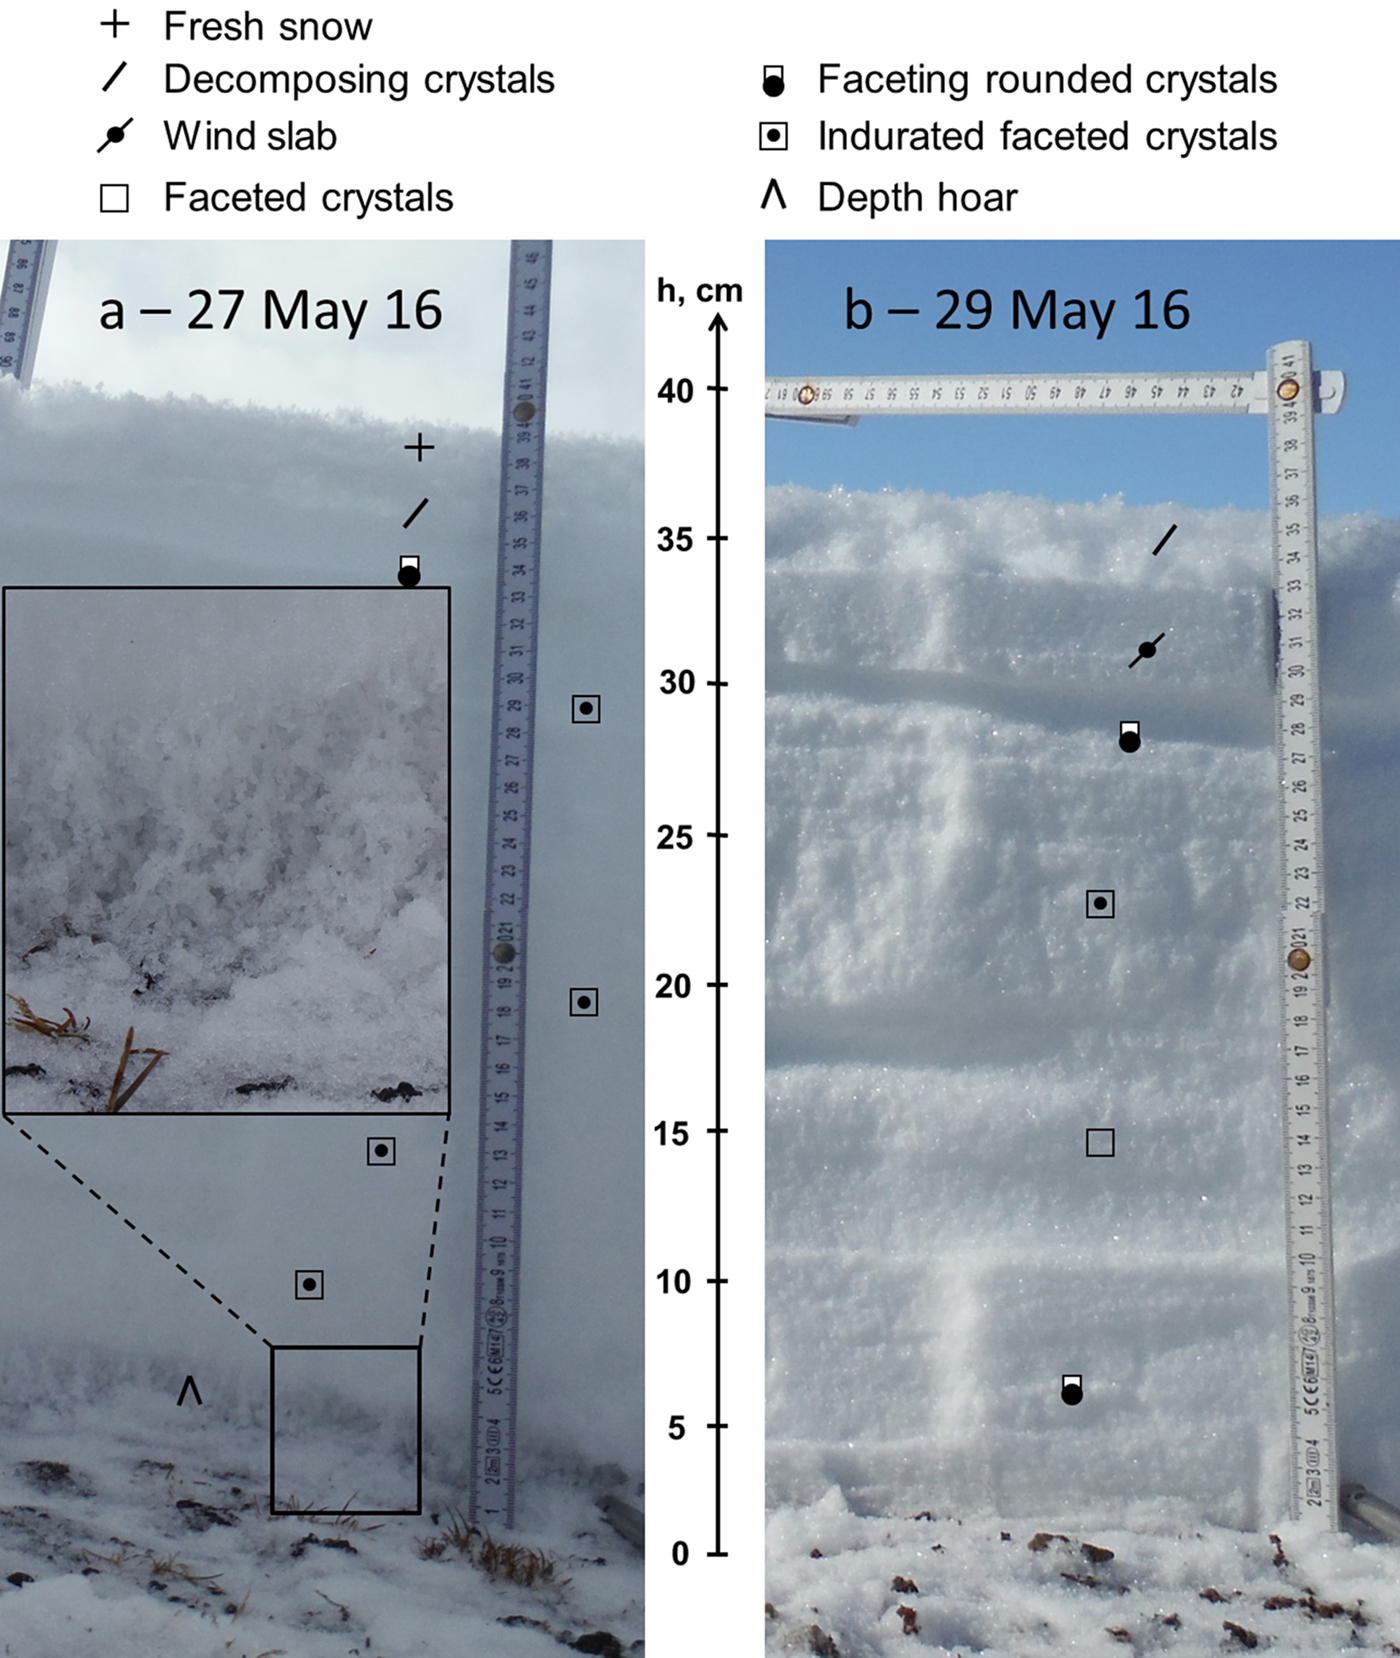
Fig. 8. Photographs of snow pits at WH, illustrating the rare occurrence of depth hoar. The inset in (a) shows the small depth hoar crystals (2 mm at the most) and their milky aspect, indicating poor development.
Figure 9 shows vertical profiles of density, thermal conductivity and SSA of eight snow pits, including those of Figure 8. The pit of 27 May is the only one to show basal layer properties representative of typical depth hoar, with a density of 232 kg m−3, a thermal conductivity of 0.044 W m−1 K−1 and a SSA of 12 m2 kg−1. It is noteworthy that at WH basal thermal conductivities reach 0.42 W m−1 K−1, densities reach 459 kg m−3 and SSAs 25.3 m2 kg−1, values typical of hard wind slabs (Sturm and others, Reference Sturm and Benson1997; Domine and others, Reference Domine, Barrere and Morin2016a). Furthermore, the spatial variability of the profiles of all variables is significant, with for example basal SSA and density varying over a factor of 2 and thermal conductivity by a factor of 10.
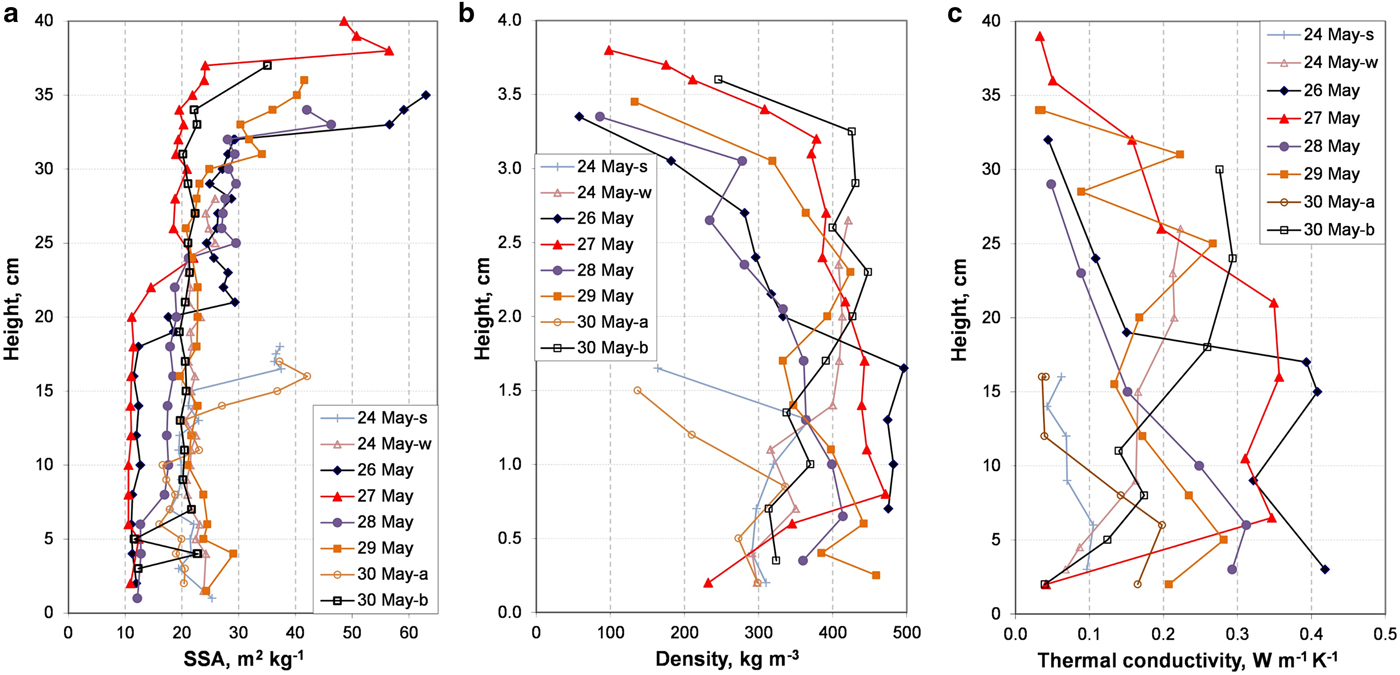
Fig. 9. Vertical profiles of physical properties for snow pits at WH in May 2016. (a) SSA; (b) density and (c) thermal conductivity.
Comparing profiles at Bylot and WH (Figs 4, 9) show smaller variations in SSA at WH except for those due to the presence of fresh snow at WH. This is probably related to the fewer metamorphic processes that induce changes: less melting and less depth hoar formation. The higher densities at WH can be related to the absence of depth hoar formation, which reduces basal density (Domine and others, Reference Domine, Barrere and Sarrazin2016b) and to the stronger winds that form denser wind slabs. Thermal conductivity is also greater at WH again because of the near-absence of depth hoar and the presence of harder wind slabs. A noteworthy observation is the large variations of the thermal conductivity of the basal layer, between 0.04 and 0.42 W m−1 K−1. Thermal conductivity is a snow variable that shows a wide range of variations, over a range that can reach a factor of 25 (Sturm and others, Reference Sturm and Benson1997). At both Bylot and WH, variations over a factor of 10 are observed, but at WH this range is seen in the basal 5 cm, illustrating the impact of the absence of depth hoar on the properties of the basal layer.
3.4. WH monitoring data, fall 2015
Figure 10 shows snow, atmospheric and soil data for the 2015–2016 winter. Time-lapse pictures (Fig. 11) show that the snow cover was very heterogeneous at the beginning of the season. Snow that initially deposited at the TP08 post was almost completely eroded by wind several times before continuous snow cover was established. In particular, wind speeds reaching 18.2 m s−1 on 17 October left only the TP08 needle at 3 cm height barely buried. The last picture on 6 November 2015 shows very patchy snow: at the TP08 post only the lowermost probe at 3 cm was buried while 2 m away the SR50 snow gage indicated a 21 cm snow depth (Fig. 11).
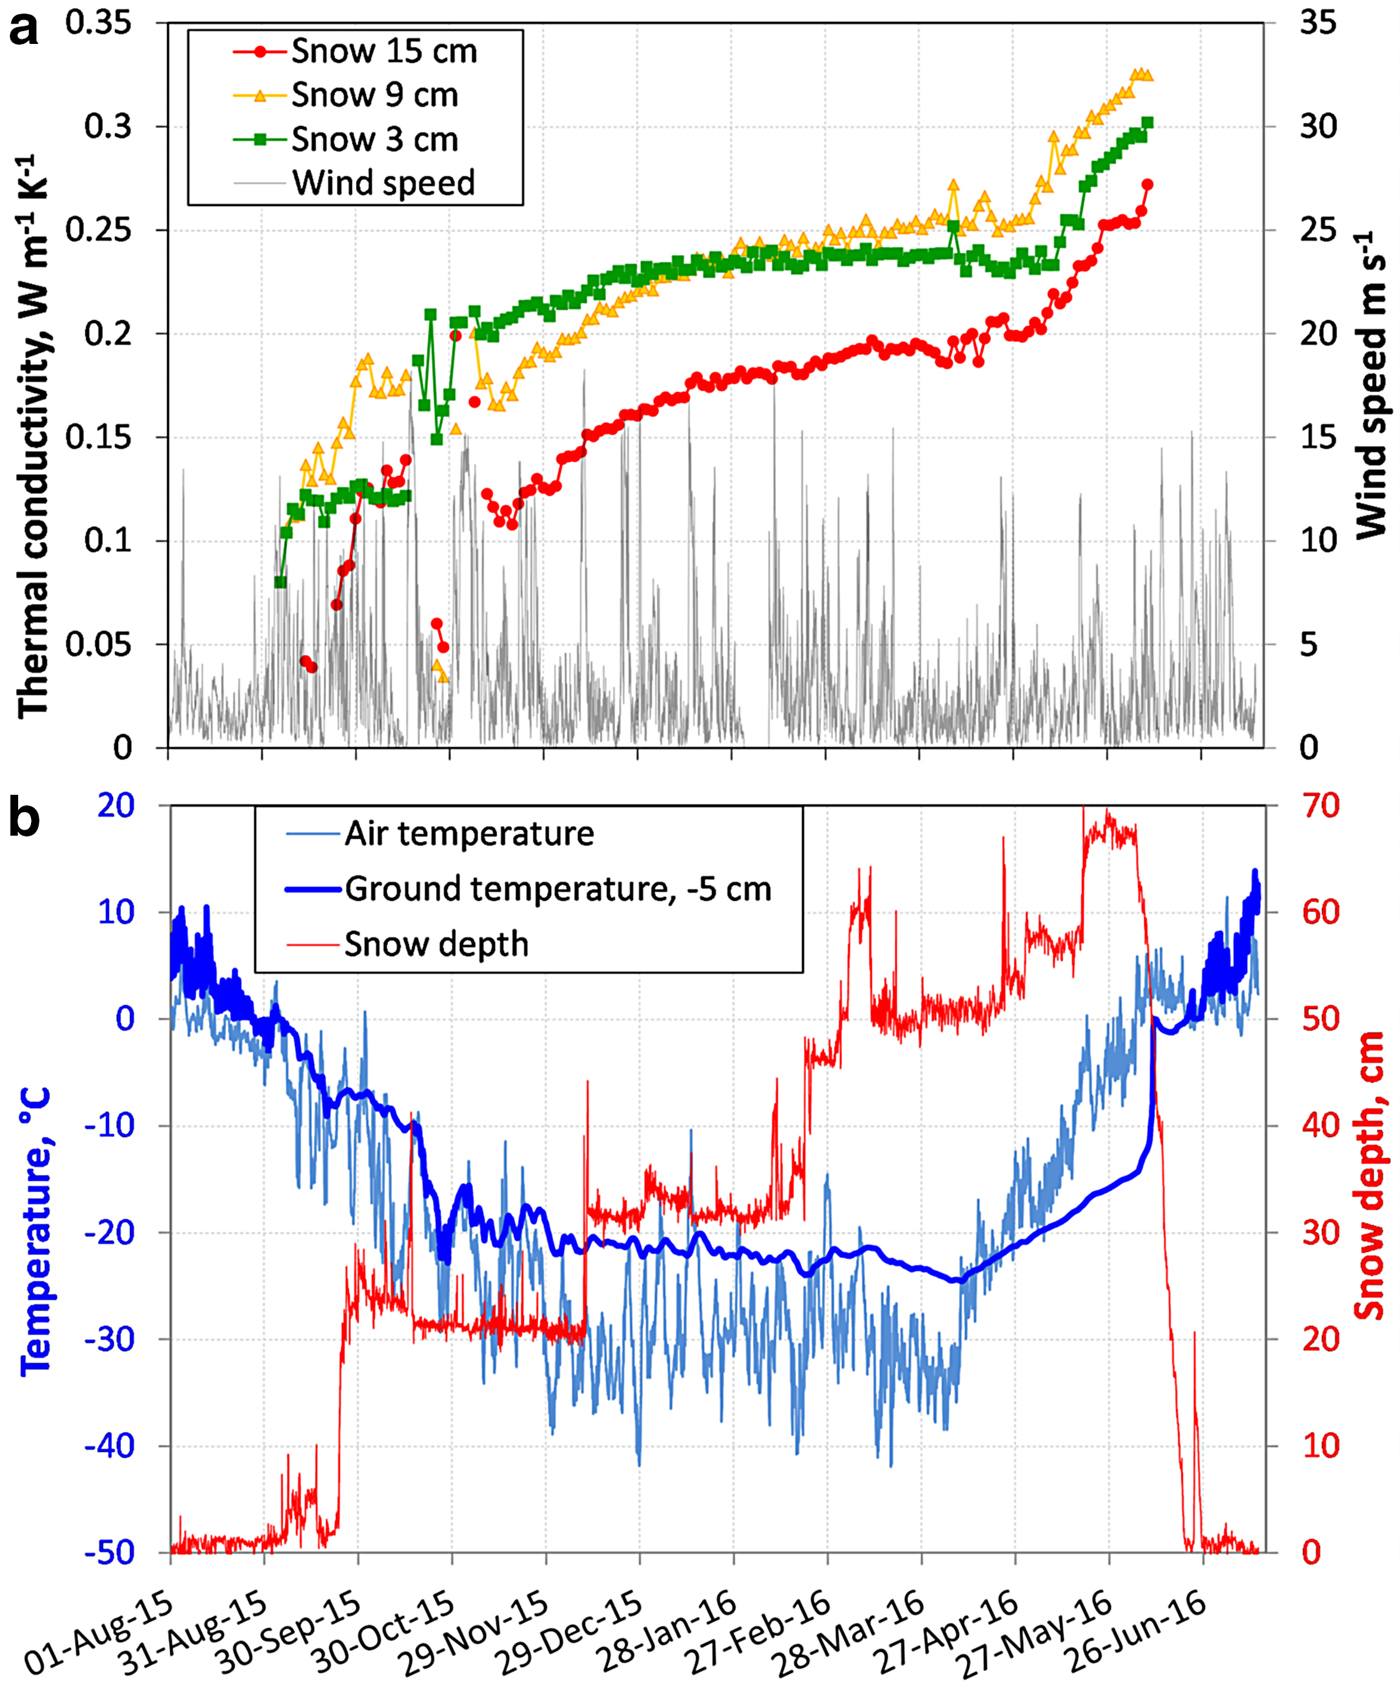
Fig. 10. Environmental time series for WH for the 2015–2016 winter. (a) Snow thermal conductivity at three heights and wind speed; (b) snow depth, air temperature and ground temperature at 5 cm depth. The full dataset is archived in CEN (2018b).
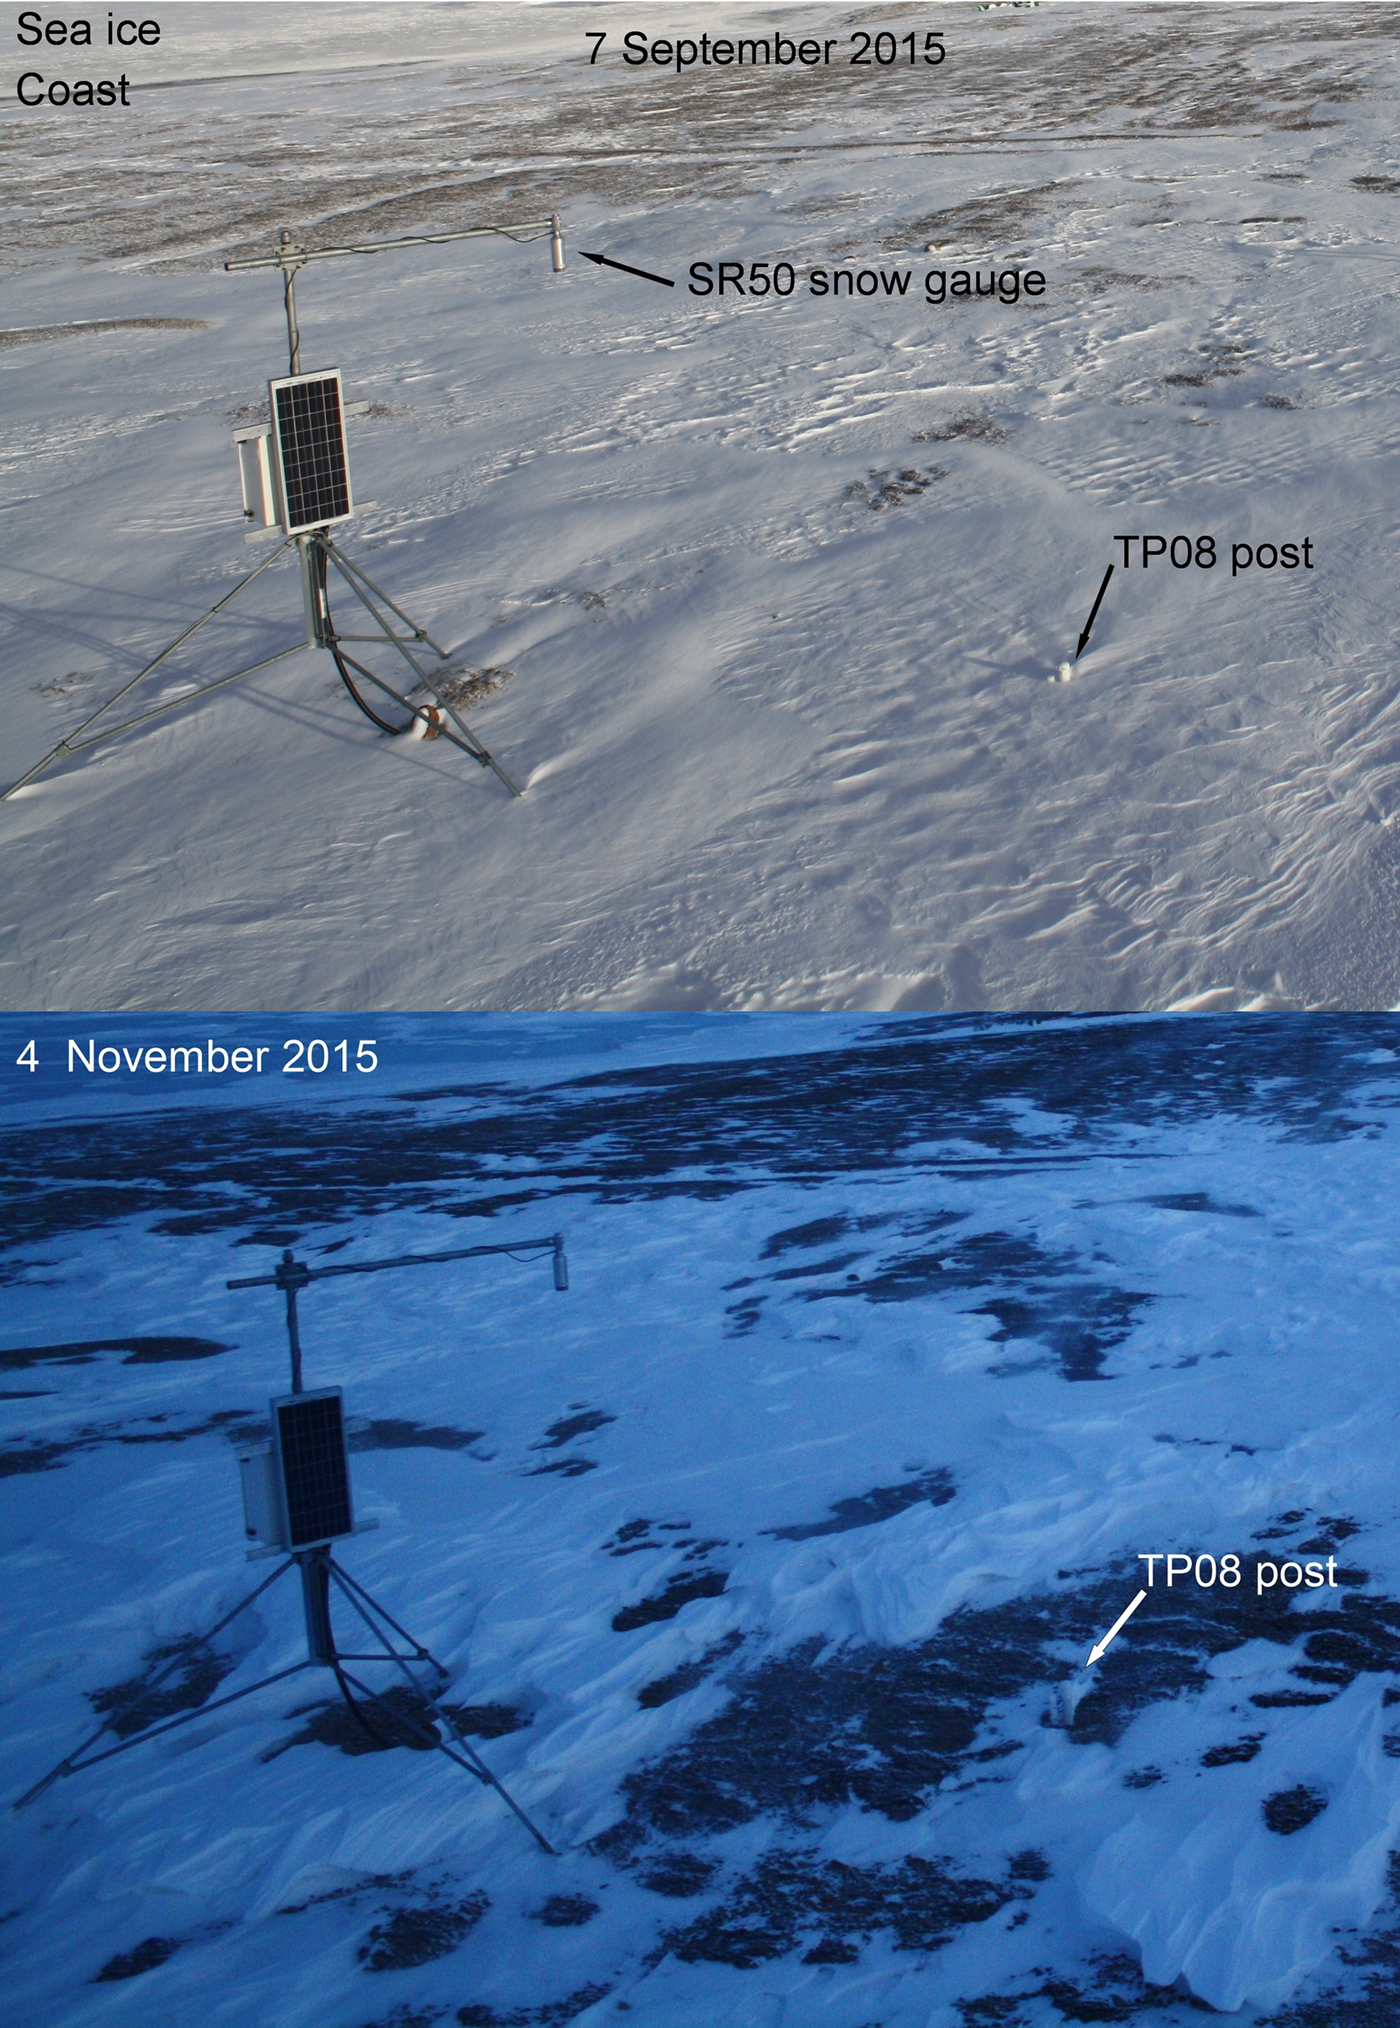
Fig. 11. Photographs of the WH snow instruments on 7 September and 4 November 2015 illustrating the wind erosion and variable snow cover.
Figures 10, and 11 show that measurements relevant to the evolution of snow thermal conductivity start on 1 November at 3 cm height, 9 November at 9 cm and 15 November at 15 cm. September and October data were obtained from snow that was subsequently completely eroded away. The erratic behavior of the thermal conductivity at 3 cm height between 20 and 30 October is probably due to snow ventilation by windpumping (Colbeck, Reference Colbeck1989) that affected the measurement, so that these data will not be considered. Figure 10a shows essentially continuous increases in thermal conductivity, with high initial values, in particular an initial value of 0.2 W m−1 K−1 at 3 cm on 1st November. These values and their evolution are symptomatic of wind slab sintering, and there is no hint of depth hoar formation, as this would have been indicated by much lower values and an initial decrease (Domine and others, Reference Domine, Barrere and Sarrazin2016b). Even early season values on snow subsequently eroded are high and increase, so that even the September snows did not start transforming into depth hoar.
Figure 10b shows that ground cooling was rapid, with no zero-curtain period since the temperature was never stable near 0°C. Ground temperature showed diurnal variations slightly above 0°C until 28 August. Variations below 0°C followed until 2 September, when short spikes above 0°C were observed as the air temperature reached 3°C. On 6 September, the ground temperature definitely dropped below 0°C without diurnal variations. Ground cooling was fast most likely because of the absence of a durable continuous snow cover and because the lack of moisture-holding capacity of the coarse-grained soil, so that little latent heat needed to be released. Figure 10b shows that ground temperature followed air temperature fairly closely, without the significant lag observed at Bylot Island when a long zero-curtain is visible in Figure 5b and in Domine and others (Reference Domine, Barrere and Sarrazin2016b). The numerous patches of bare ground doubtless helped cool the ground fast until late in the season. Figure 6 shows that the temperature gradient in the snow remained moderate for Arctic standards. However, current understanding suggests that it should be sufficient to lead to typical depth hoar formation, as the threshold often recognized is ~20 K m−1 (Akitaya, Reference Akitaya1975; Marbouty, Reference Marbouty1980).
Figure 7 shows wind speeds after the onset of the snowpack at the TP08 post. Note that the onset dates are different to those when the temperature gradient became measureable (Fig. 6). Just after snow onset, a violent snow storm that lasted 4 d and reached wind speeds of 18.2 m s−1 formed a hard dense wind slab. Subsequently, wind storms were frequent. Considering mean hourly wind speeds during 60 d after snow onset, wind speed was above 6 m s−1 (drifting was then likely (Vionnet and others, Reference Vionnet2012)) 25.8% of the time, and it was above 10 m s−1 17.3% of the time. Extended quiet periods, where snowfalls could have started to transform into depth hoar before being wind-drifted and packed, were rare. We will explore in the discussion whether these strong wind speeds, associated with the lack of a very high temperature gradient required to transform wind slabs into depth hoar, may explain the near-complete absence of depth hoar observed at WH in spring 2016.
3.5. WH monitoring data, fall 2016
Figure 12 shows snow, atmospheric and soil data for the 2016–2017 winter. Soil moisture and soil thermal conductivity data are available that year, but time-lapse pictures are not. Snow conditions show interesting differences relative to the previous winter. Given the continuity of the snow thermal conductivity curve at 3 cm, it is reasonable to suggest permanent snow cover at the TP08 post on 1 September, 6 weeks earlier than the previous year. An initial decrease in this curve is observed during the first month, indicative of slow depth hoar formation. However, the thermal conductivity value remains above 0.1 W m−1 K−1, suggesting indurated depth hoar. At 9 and 15 cm, thermal conductivity values are also lower than the previous year.
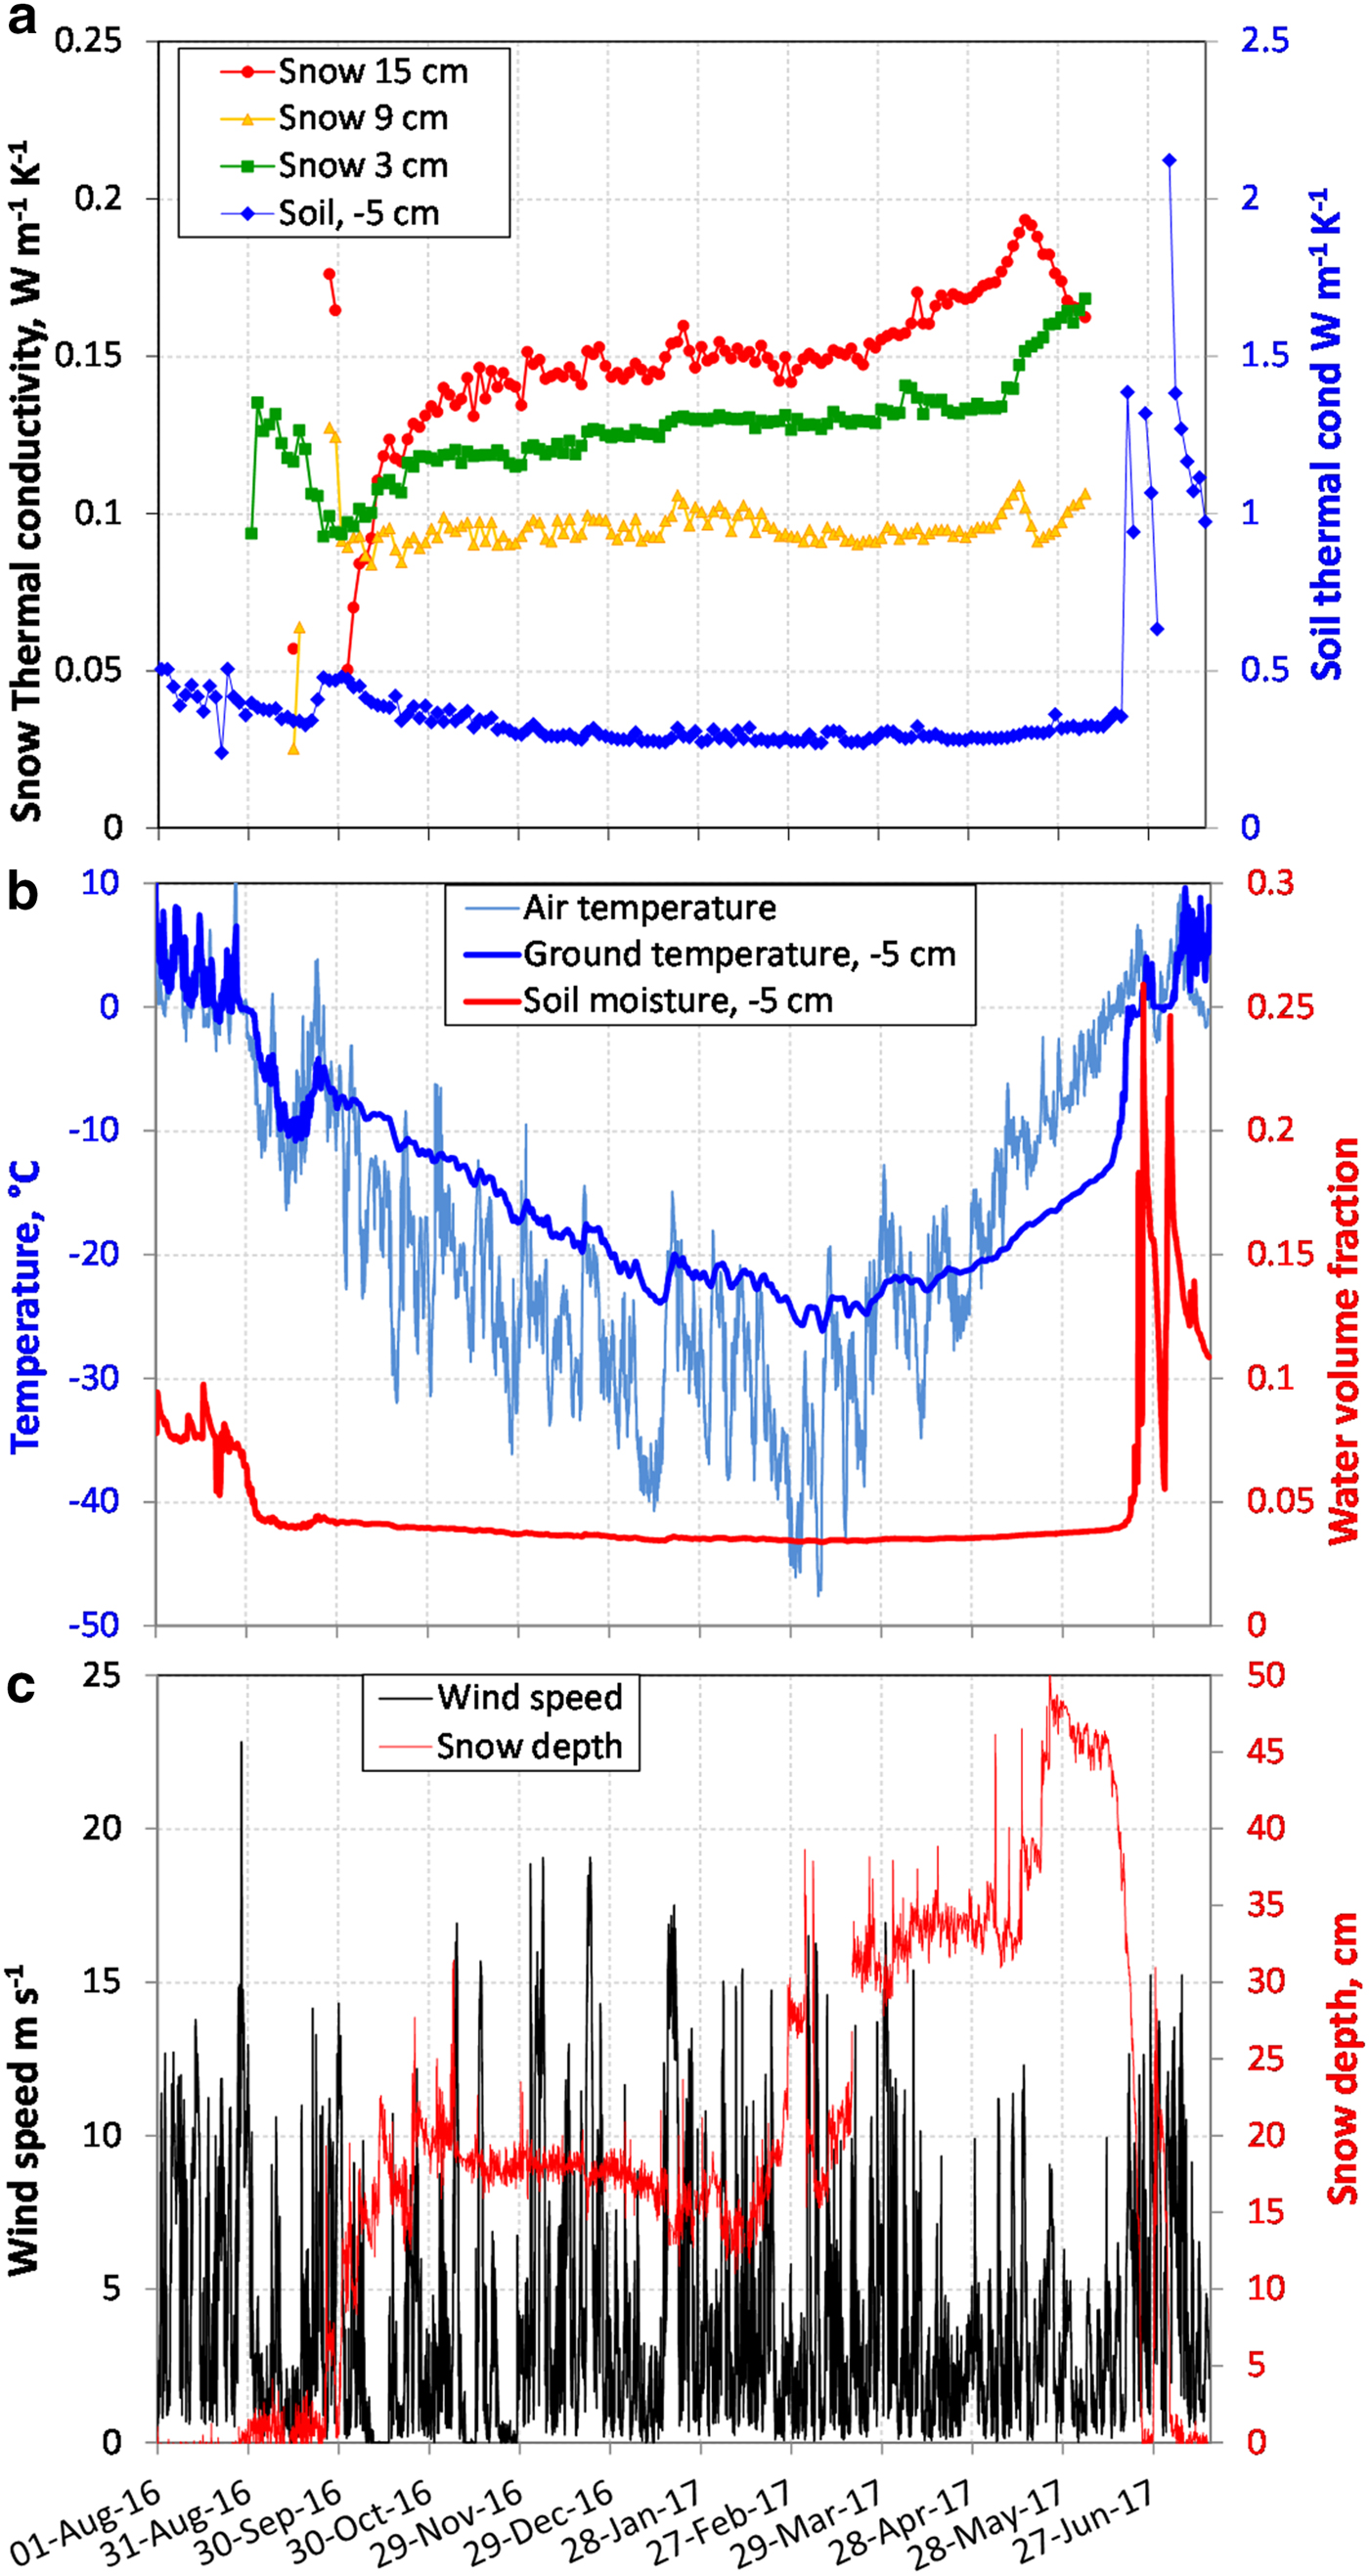
Fig. 12. Environmental time series for WH for the 2016–2017 winter. (a) Snow thermal conductivity at three heights and ground thermal conductivity at 5 cm depth. (b) Air temperature and ground temperature at 5 cm depth and soil moisture at 5 cm depth. (c) Wind speed and snow depth. The full dataset is archived in CEN (2018b).
Soil temperature shows a short 4-d zero-curtain between 29 August and 2 September and this is consistent with the low soil moisture data (<10%) as expected from the soil nature. Freezing was slower than the previous year, as there was already between 3 and 6 cm of snow on the ground because the TP08 at 3 cm was covered while the 6 cm temperature sensor was still in the air. There probably was a large temperature gradient in the few cm of snow present on the ground on 1 September 2016. We cannot calculate it exactly because the 6 cm sensor was not covered and our temperature gradient data starts on 26 September (Fig. 6). However, under the approximate hypothesis that the snow surface and the 6 cm temperature sensor were at the same temperature between 1 and 26 September, the temperature difference between the 0 and 6 cm sensor gives a lower limit of the gradient. Values reaching 120 K m−1 were observed between 1 and 16 September, with an average of 49.4 K m−1. Wind speed was low in the few days after deposition of the first snow layer (Fig. 7), except for a short spike at 10 m s−1 that lasted just a few hours on 1 September. Conditions were therefore reasonable for depth hoar development in the basal snow layer. Subsequently the temperature gradient remained low and wind speeds were higher after the snow covered the 9 cm TP08 (12–14 m s−1 for 3 d, Figs 7, 10c) so that depth hoar development was not possible in higher layers.
The variations of soil thermal conductivity are peculiar (Fig. 12a). The thermal conductivity of most soils increases upon freezing as observed at Bylot Island (Fig. 5a) and as found in earlier works (Penner and others, Reference Penner, Johnston and Goodrich1975; Overduin and others, Reference Overduin, Kane and van Loon2006; Domine and others, Reference Domine, Barrere and Sarrazin2016b). This is expected because the thermal conductivity of ice is about four times that of water. Here no increase is found, except for a slight temporary increase ~20 d after freezing. This is probably related to the low water content of the soil. Previous studies (Penner and others, Reference Penner, Johnston and Goodrich1975; Buteau and others, Reference Buteau, Fortier, Delisle and Allard2004) have found that the thermal conductivity of soils with low water content could even decrease upon freezing.
4. DISCUSSION
4.1. Soil moisture and water vapor fluxes
Soil moisture maintains the soil at 0°C during fall freezing and this allows the establishment of a high temperature gradient between the ground and the cold atmosphere. At Bylot Island in fall 2014 (Domine and others, Reference Domine, Barrere and Sarrazin2016b) and 2016, extended zero-curtain periods of ~6 weeks lead to temperature gradients exceeding 200 K m−1 that produced well-developed depth hoar of low thermal conductivity: 0.025 and 0.05 W m−1 K−1 in 2014 and 2016 respectively. At WH in fall 2016 the thermal conductivity of the basal snow initially decreased from 0.14 to 0.09 W m−1 K−1, indicating a short period of indurated depth hoar formation. This was probably possible because of the short 4-d zero-curtain period. Finally at WH in fall 2015 the basal layer thermal conductivity was >0.2 W m−1 K−1 and there was no depth hoar even though the temperature gradient averaged 47 K m−1 for the first 15 d after 6 November 2015 and 35 K m−1 until 31 December. These values are much larger that the commonly accepted threshold of 20 K m−1 for typical depth hoar formation (Yosida, Reference Yosida1955; Akitaya, Reference Akitaya1975; Marbouty, Reference Marbouty1980). This absence of depth hoar therefore deserves further investigation.
The actual variable that leads to depth hoar formation is the water vapor flux. When temperature gradient was considered in early depth hoar studies, the basal temperature was near 0°C. At WH this was not the case even at the very start of the snow season because of the fast ground cooling. Given the exponential dependence of water vapor pressure on temperature, fluxes were greatly decreased. Figure 13 shows water vapor fluxes,  $F_{{\rm H}_{\rm 2}{\rm O}}$, at the base of the snowpacks, calculated from the temperature measured by the lowermost two temperature sensors, using an effective diffusion coefficient for water vapor D eff = 2 × 10⁻⁵ m2 s−1 (Calonne and others, Reference Calonne, Geindreau and Flin2014):
 $$F_{{\rm H}_{\rm 2}{\rm O}} = -D_{{\rm eff\;}} \displaystyle{{n_{{\rm H}_{\rm 2}{\rm O,1}}-n_{{\rm H}_{\rm 2}{\rm O,2}}} \over {h_1-h_{\rm 2}}},$$
where  $n_{{\rm H}_{\rm 2}{\rm O}}$ is the molar concentration of water vapor in snow interstitial air at height h.
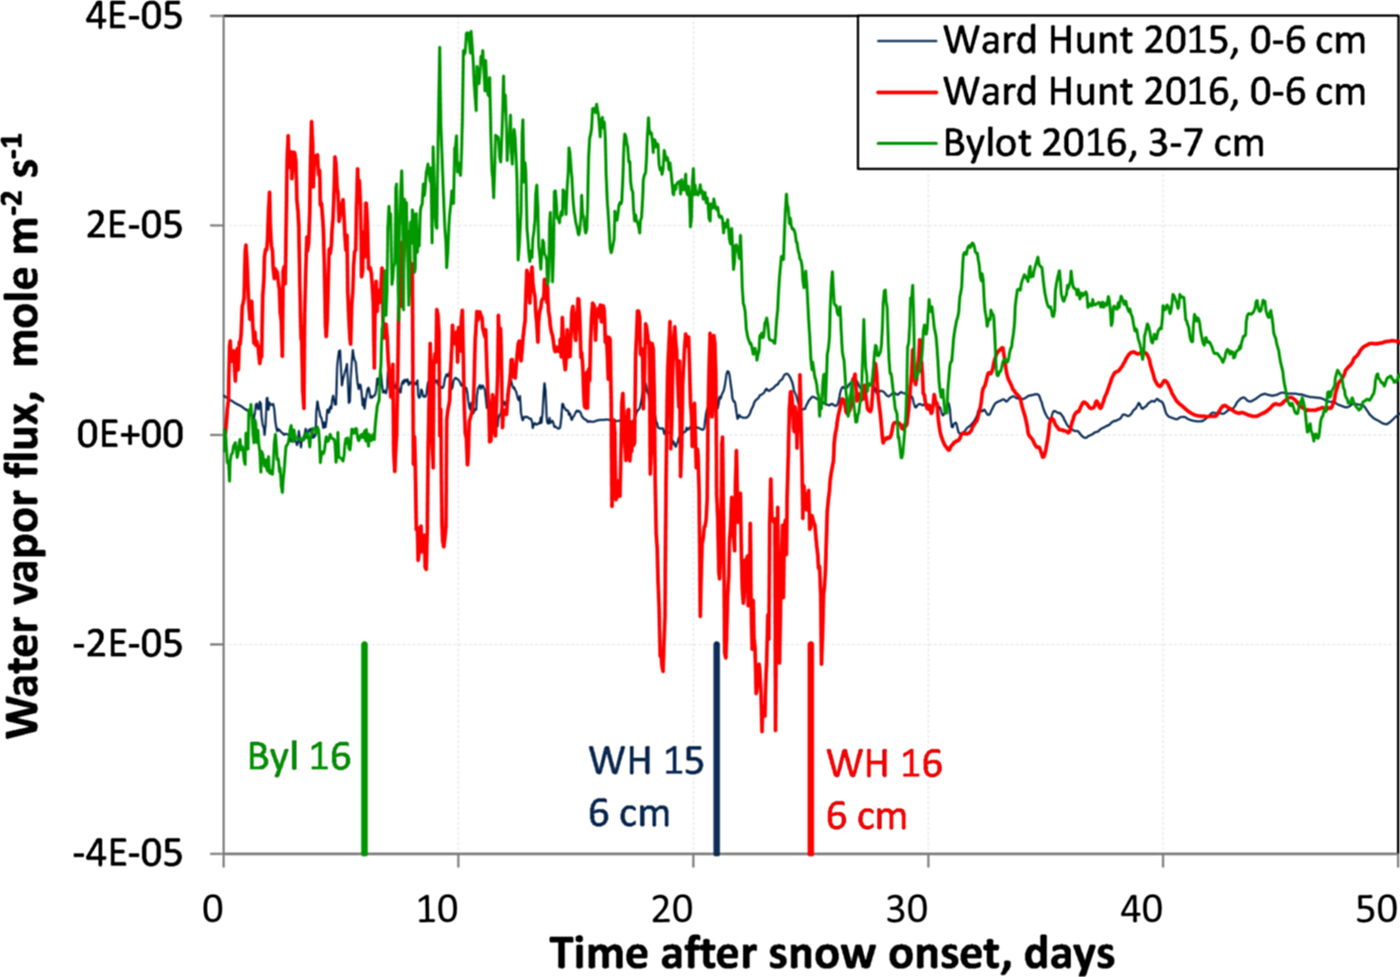
Fig. 13. Water vapor fluxes at or near the base of the snowpack at Bylot Island for fall 2016 and WH for falls 2015 and 2016. The series started at snow onset. Fluxes are lower limits until the sensor at 6 cm height (WH) or 7 cm (Bylot) had been covered by snow. Those times are identified by colored vertical bars.
Fluxes can be reliably calculated after the top sensor had been covered by snow. However, between snow onset and that moment, a temperature gradient already existed in the thin snow. With the approximation that the top sensor in the air and the snow surface were at the same temperature, the gradient and vapor fluxes calculated between onset and the second sensor coverage are lower limits of the actual values. Fluxes show some negative values at WH in 2016 because of the warm spell around 20 September which inverted the temperature gradient.
To interpret snow metamorphism in fall we calculated four values of the integrated vapor fluxes over 24 d: (i) the sum of algebraic values over 24 d after snow onset; (ii) the sum of absolute values for that period; (iii) the sum of algebraic values after the top sensor has been covered and (iv) the sum of absolute values for that period. Absolute values are considered because metamorphism still takes place when the gradient is reversed (Pinzer and Schneebeli, Reference Pinzer and Schneebeli2009). Data are shown in Table 1.
Table 1. Water vapor fluxes (kg m−2) integrated over 24 d for the three cases studied
There is a difference of a factor of six between WH 2015 and Bylot 2016, which may explain why depth hoar was well formed at Bylot and not at WH. Regarding WH 2016, values are highly dependent on the calculation method but are always intermediate between WH 2015 and Bylot 2016. This is consistent with the observations of increased depth hoar formation in the order WH2015 < WH2016 < Bylot2016. This illustrates well that low soil moisture, by facilitating soil cooling, reduces both the temperature and the temperature gradient in the snowpack, and hence the water vapor flux and the rate of snow metamorphism. Snow structure may further enhance these effects.
4.2. Wind speed, snow structure and D eff
Diffusive water vapor fluxes depend on D eff. There has been a long and complex controversy on the relationship between snow structure and D eff, the most recent detailed review of which has been written by Pinzer and others (Reference Pinzer, Schneebeli and Kaempfer2012). The aspect debated is whether D eff could be enhanced in snow, possibly by a factor >5 relative to D 0, the value in air. An important physical process that would enhance D eff is the ‘hand to hand’ delivery of water vapor (Yosida, Reference Yosida1955), where a molecule of water condensing at the base of a crystal is balanced by another one released at the top of the crystal, so that the crystal length is short-circuited and this effect accelerates diffusion.
Another process is that since ice conducts heat ~100 times more than air (Colbeck, Reference Colbeck1993), the temperature gradient can be greatly amplified in a pore space with ice crystals above and below. This effect will be larger in snow of low density and with large grains as detailed by Colbeck (Reference Colbeck1993). Wind slabs, which have a high density and small grains, will therefore benefit little from this amplification, contrary to depth hoar. Lately, calculations have suggested that the amplification of D eff in snow did not take place (Calonne and others, Reference Calonne, Geindreau and Flin2014) but arguments presented by Yosida (Reference Yosida1955) and Colbeck (Reference Colbeck1993) and others have to our understanding not been convincingly countered so that we feel this controversy remains today. Settling it is beyond our current scope, but it had to be mentioned here. We however turn to other related physical processes: buoyancy-driven convection and windpumping, and how they are affected by snow structure.
Regardless of diffusive processes, convection can take place in sufficiently permeable snow. This was first proposed by Trabant and Benson (Reference Trabant and Benson1972) in the natural snowpack of interior Alaska, where most of the snowpack transforms into low-density depth hoar. Akitaya (Reference Akitaya1975) deduced the occurrence of convection from heat transfer measurements during his experimental studies of depth hoar formation but he reports that ‘Natural convection of air occurred only in artificial samples with very large air spaces.’ Sturm and Johnson (Reference Sturm and Johnson1991) convincingly detected convection from temperature measurements in the natural snow cover in interior Alaska. The current understanding is that convection does take place in natural snowpacks, but there is a threshold in snow permeability below which it does not take place. Once this threshold is reached, water vapor fluxes, which are then not only diffusive, are enhanced and accelerate metamorphism and depth hoar formation. Trabant and Benson (Reference Trabant and Benson1972) and Sturm and Benson (Reference Sturm and Benson1997) indicated that convection can increase water vapor transfer by a factor of ~10. Domine and others (Reference Domine, Barrere and Sarrazin2016b) observed that at Bylot Island, the complete disappearance of basal depth hoar by sublimation could not be explained by water vapor diffusion alone and also invoked convection. This process is therefore probably necessary to lead to fully developed depth hoar as observed at Bylot Island, in interior Alaska (Trabant and Benson, Reference Trabant and Benson1972) and certainly elsewhere.
We propose here that high wind speed, by forming hard dense wind slabs of low permeability, prevent convection and this is another factor that retards depth hoar formation. Convection is also probably involved in the formation of indurated depth hoar. Remaining small grains from wind slabs noted by Domine and others (Reference Domine, Barrere and Sarrazin2016b) were probably outside of convective pathways.
Wind flowing over snow with irregular topography can also induce snowpack ventilation (Colbeck, Reference Colbeck1989). However, this process will induce mostly horizontal air flow, so its efficiency in generating vertical water vapor fluxes may be limited. Furthermore, windpumping is efficient only near the surface of the snowpack (Albert and others, Reference Albert, Grannas, Bottenheim, Shepson and Perron2002) which will further limit the induced H2O fluxes because of the very low snow surface temperature and because of the very low permeability of the dense wind slabs. In any case, the absence of depth hoar at WH in 2015 strongly suggests that windpumping had limited impact on its formation.
Summing up our data at WH in fall 2015, high wind speeds at the very beginning of the snow season (Fig. 7) led to the formation of a low permeability dense wind slab which prevented the occurrence of convection and strongly hindered advection by windpumping. Simultaneously the temperature gradient was limited by the rapid ground cooling due to its low moisture content. Both factors combined to efficiently prevent depth hoar formation at this very cold high Arctic site. We may wonder whether just one of these factors would be sufficient to prevent depth hoar formation. This seems unlikely based on WH 2016 data, because wind speed was then significantly lower than in 2015 (Fig. 7), and thermal conductivity data (Fig. 12a) suggest indurated depth hoar formation. We look for a confirmation by considering other Arctic sites: Barrow and Alert.
4.3. Considerations based on Barrow and Alert data
Domine and others (Reference Domine, Gallet, Bock and Morin2012) studied the snowpack at Barrow (now called Utqiagvik), Alaska (71°17′N, 156°43′W) during a field campaign in March–April 2009. They observed the widespread presence of indurated depth hoar with occurrences of regular depth hoar. Barrow is arguably windier than WH, as indicated by the wind speed distributions of Figure 14, obtained from https://www.esrl.noaa.gov/gmd/dv/data/index.php?site=brw&category=Meteorology&pageID=1. Here we show wind speed for 60 d following snow onset at Bylot and WH. For Barrow, we do not know the exact date of snow onset and present data for September–October and October–November 2008, which certainly covers the 2 months period following onset.
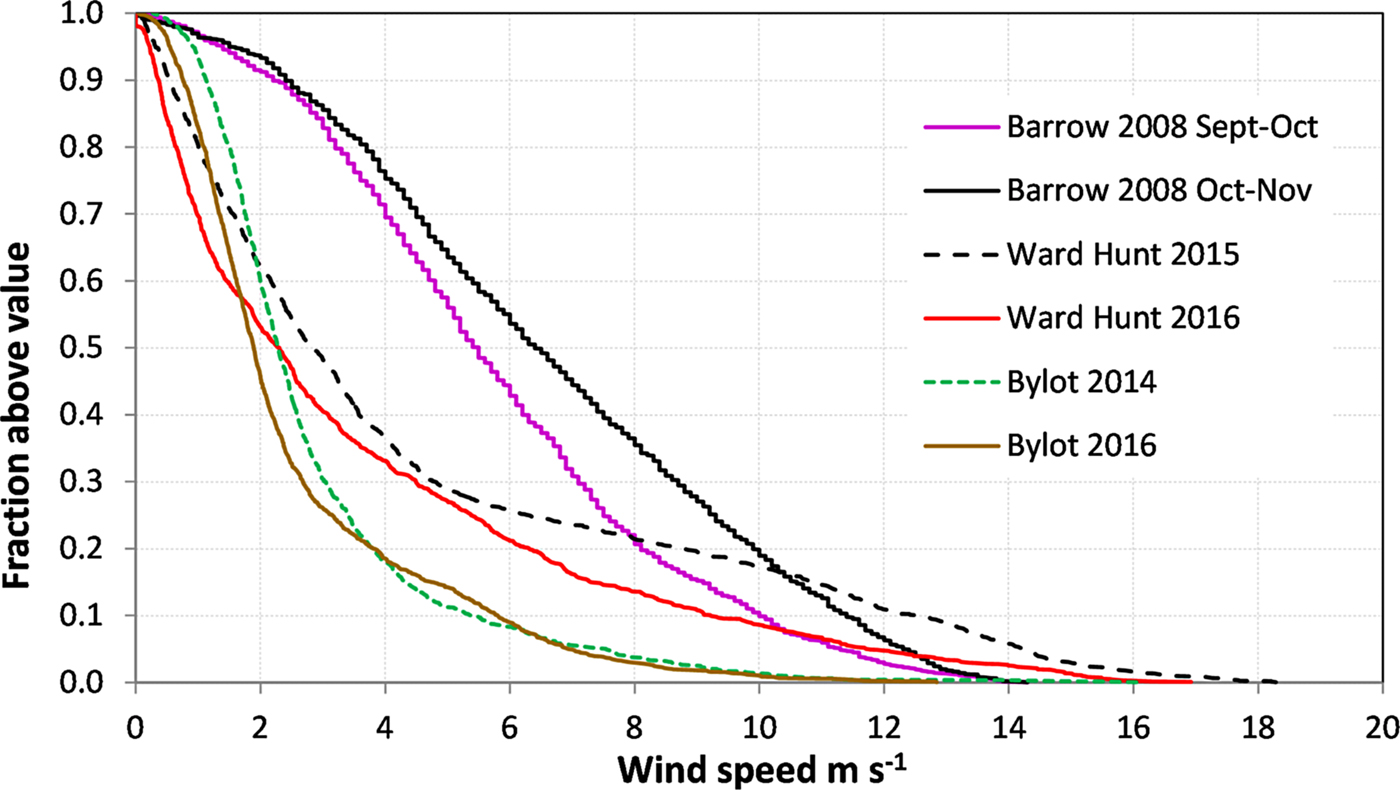
Fig. 14. Wind speed distribution of hourly averages at Barrow, WH and Bylot Island for 60 d periods during the falls of interest to this study. For WH and Bylot the periods start at snow onset. For Barrow, two different periods very likely to cover the unknown onset date are reported.
While WH has the most violent wind storms, Barrow clearly has the most frequent winds very likely to generate snowdrift and wind slab formation: wind speed is >6 m s−1, >40% of the time at Barrow vs ~25% at WH and <10% at Bylot. Yet there was basal depth hoar everywhere at Barrow. The terrain there is flat tussock tundra with many lakes, the study site was near a lake, so that even though we did not measure soil moisture it is certain that the ground was moist and that an extended zero-curtain period took place. Strong winds alone therefore do not suffice to prevent depth hoar formation.
Would low soil moisture suffice? Indeed, by allowing rapid ground cooling, low moisture could reduce the vapor pressure and its flux at the base of the snowpack, even though the temperature gradient could still be ~20–40 K m−1 as observed at WH. Domine and others (Reference Domine, Cabanes and Legagneux2002) studied the snowpack at Alert (82°29′N, 62°20′W) in February and April 2000 and observed unconsolidated depth hoar almost everywhere. The coarse-grain soil at this polar desert with very sparse vegetation is similar to that at WH. The site was on a plateau far from moisture sources so it is reasonable to assume moisture was low. Reported wind speed can reach high values (Domine and others, Reference Domine, Cabanes and Legagneux2002) but unfortunately the anemometer did not function in September 1999. However, extended calm periods are frequent at Alert between violent storms, leaving opportunities for depth hoar development. Even though we lack detailed data at Alert for a strong conclusion, the most reasonable one is that depth hoar developed during an extended calm period on dry cold soil, so that low soil moisture alone probably does not suffice to prevent depth hoar formation.
These considerations from other high Arctic sites therefore strengthen our conclusion that the combination of both frequent high wind speed and low soil moisture are required to prevent depth hoar formation in the high Arctic. As mentioned in the Introduction, the thermal conductivity of depth hoar has a critical impact on the permafrost thermal regime. Since snow physics models do not currently simulate correctly this variable, an empirical parameterization as a function of wind speed and soil moisture may be an alternate avenue to simulate it. Lecomte and others (Reference Lecomte2013) parameterized snow thermal conductivity on sea ice as a function of wind speed only and could thus simulate sea-ice growth as well or better as with other approaches, so we feel that our proposed approach has some basis. Regarding wind speed, the critical process is snowdrifting, so we consider only wind speed >6 m s−1. We define a wind speed index, similar to a degree-day index, where the wind speed above 6 m s−1 is multiplied by the amount of time (in d) during which this wind speed prevails. A wind speed of 8 m s−1 will therefore have twice the index of one at 7 m s−1. We show in Figure 15 a very preliminary best-guess plot of what a parameterization of depth hoar thermal conductivity on high Arctic land surfaces might look like. For the moment this is based on just four data points (WH2105, WH2106, Bylot2014 and Bylot2016) and their thermal conductivity values (respectively, 0.23, 0.12, 0.025 and 0.05 W m−1 K−1) are reported in the figure, showing that the approach is at least self-consistent. For WH2015, we used the same soil moisture as for WH2016. This approach may seem over-simplistic, but for projections and simulations where precise driving data are not available, simple approaches can compete with sophisticated schemes. For example, a simple degree-day approach has been shown to be as good as any other to model the long-term glacier-wide mass balance of a glacier (Réveillet and others, Reference Réveillet, Vincent, Six and Rabatel2017). The clear advantage of such an approach is that it is simple to implement and would run much faster than more sophisticated (and currently less efficient) snow schemes. With more data, future improvements may also take into account rain-on-snow and melting events in fall.
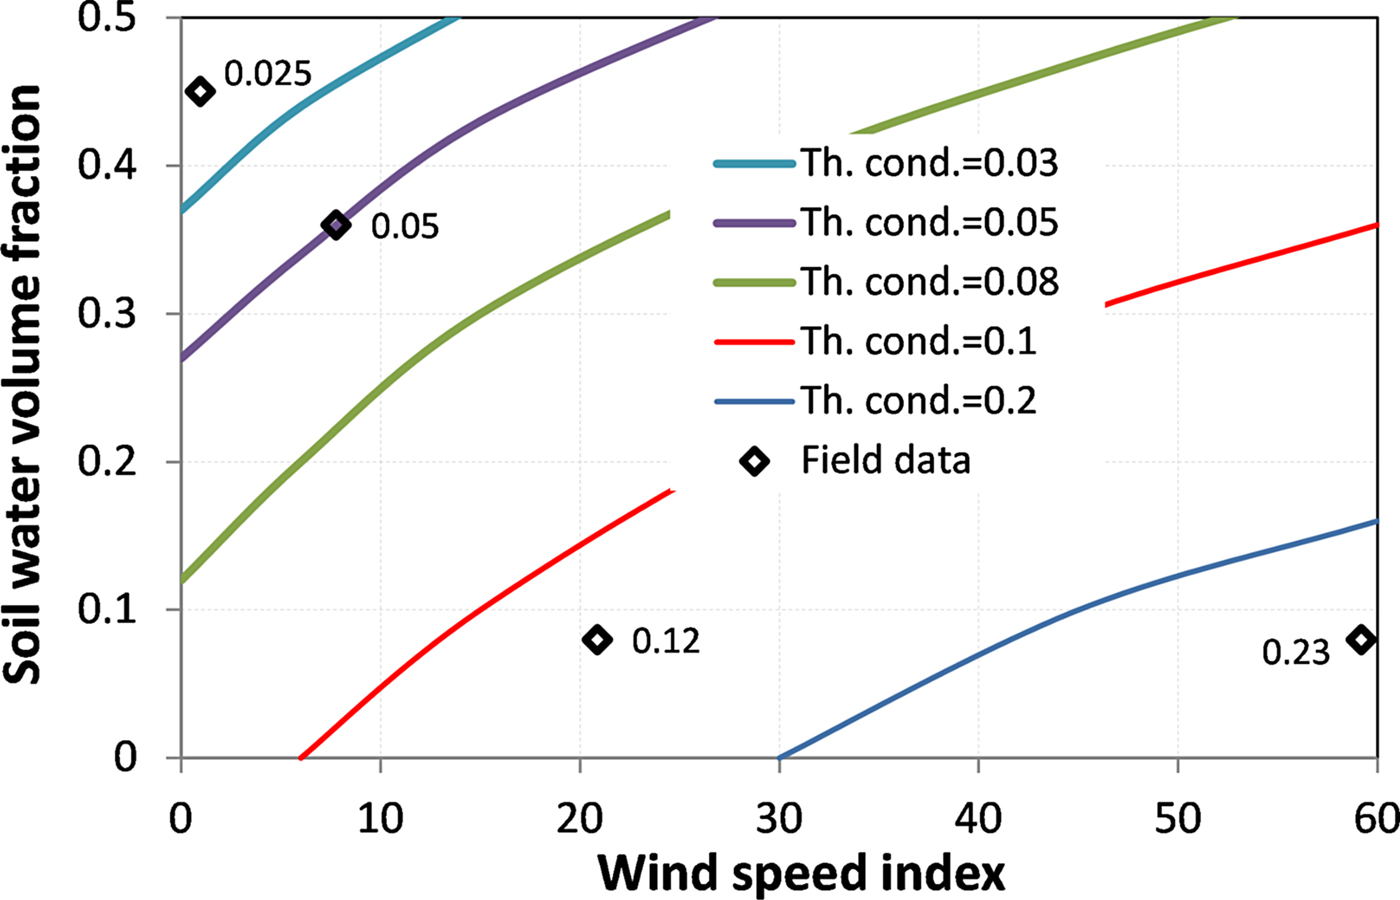
Fig. 15. Preliminary suggestion of a possible parameterization of the thermal conductivity of basal depth hoar in Arctic snowpacks as a function of the wind speed index during the first 30 d after snow onset and of the soil liquid water content just before freezing. The four points this is based on are reported, along with the depth hoar thermal conductivity in W m−1 K−1.
4.4. Possible new climate feedbacks
With climate warming, vegetation grows, litter forms and the moisture retention capacity of the soil increases. The thermal conductivity of the basal snow layer is therefore expected to decrease, leading to further ground warming. Given the impact of soil moisture on depth hoar formation identified here, this effect may amplify the impact of climate warming on permafrost temperature. However, other effects will come into play. Comparing soil thermal conductivities in Figures 5a, and 12a shows that increased soil moisture will increase soil thermal conductivity so that winter cooling will be favored. Counterbalancing this soil effect, litter buildup will form an insulating layer at the snow–soil interface. A precise evaluation of the impact of these three processes on the permafrost thermal regime will require simulations with well-defined scenarios and values. It is however likely that these processes will modulate the impact of climate change on permafrost, possibly feeding back on climate (Grosse and others, Reference Grosse, Goetz, McGuire, Romanovsky and Schuur2016).
These effects may therefore deserve consideration in projections of permafrost temperature and Arctic climate. However, testing their impact may not be possible now with available modeling tools. For example simulating the spatial distribution of Arctic depth hoar would in principle be possible as reanalysis data for soil conditions are available (Balsamo and others, Reference Balsamo2015). Unfortunately, no snow physics model, however detailed, is currently capable of simulating the formation of Arctic depth hoar because the main physical process involved, the vertical water vapor transport, is not described. The development of snow physics models adapted to Arctic conditions would therefore be required.
AUTHOR CONTRIBUTION
FD designed research. FD and MBB performed the field measurements at WH. DS installed and maintained the instruments at WH and Bylot Island. LA designed an early version of the thermal conductivity monitoring scheme and assisted DS in the adaptation to the Canadian Arctic. MB and MP performed the field measurements at Bylot Island. FD analyzed the data and wrote the paper.
ACKNOWLEDGEMENTS
This work was funded by ArcticNet (NCE), the Natural Sciences and Engineering Research Council of Canada (NSERC Discovery Grant program), Sentinel North (CFREF), the French Polar Institute (IPEV, program 1042) and the BNP-Paribas foundation. Aircraft support for research at the Ward Hunt Island and Bylot Island stations within the CEN Qaujisarvik network was provided by the Polar Continental Shelf Program (PCSP). Ward Hunt Island is located within Quttinirpaaq National Park, Bylot Island is located within Sirmilik National Park, and the authors thank Parks Canada and the communities of Resolute Bay (Qausuittuq), Grise Fjord (Aujuittuq) and Pond Inlet (Mittimatalik) for permission to work there. We are grateful to Gilles Gauthier and Marie Christine Cadieux for the use of the Bylot Research station. Special thanks to Warwick F. Vincent (Université Laval) for coordinating the ArcticNet project and encouraging us to work at Ward Hunt Island within the program Northern Ellesmere Island in the Global Environment (NEIGE). Carl Barette kindly drafted the map of Figure 3.


 Open access