Article

Emissions from the Road Traffic of West African Cities: Assessment of Vehicle Fleet and Fuel Consumption

by
Madina Doumbia
1,2,*,†,
N’Datchoh E. Toure
1,†,
Siélé Silue
3,†,
Véronique Yoboue
1,
Arona. Diedhiou
4,† and
Célestin Hauhouot
5
1
Laboratoire de Physique de l’Atmophère et Mécanique des fluides, Université Félix Houphouët-Boigny, 22 BP 582 Abidjan 22, Cote d’Ivoire
2
Centre d’Excellence Africain sur le Changement Climatique, la Biodiversité et l’Agriculture Durable, Université Félix Houphouët-Boigny, 22 BP 582 Abidjan 22, Cote d’Ivoire
3
Unité de Formation et de Recherche des Sciences Biologiques, Université Péléforo Gon Coulibaly, BP 1328 Korhogo, Cote d’Ivoire
4
Institute of Geosciences for Environment, Université Grenoble Alpes, IRD, CNRS, Grenoble INP, F-38000 Grenoble, France
5
Institut de Géographie Tropicale (IGT), Université Félix Houphouët-Boigny, 01 BPV 34 Abidjan 01, Abidjan 22, Cote d’Ivoire
*
Author to whom correspondence should be addressed.
These authors contributed equally to this work.
Energies 2018, 11(9), 2300; https://doi.org/10.3390/en11092300
Submission received: 8 June 2018 / Revised: 12 July 2018 / Accepted: 17 July 2018 / Published: 1 September 2018
(This article belongs to the Special Issue Energy Management in Vehicle–Grid–Traffic Nexus)

Abstract

:
Traffic source emission inventories for the rapidly growing West African urban cities are necessary for better characterization of local vehicle emissions released into the atmosphere of these cities. This study is based on local field measurements in Yopougon (Abidjan, Côte d’Ivoire) in 2016; a site representative of anthropogenic activities in West African cities. The measurements provided data on vehicle type and age, traveling time, fuel type, and estimated amount of fuel consumption. The data revealed high traffic flow of personal cars on highways, boulevards, and backstreets, whereas high flows of intra-communal sedan taxis were observed on main and secondary roads. In addition, the highest daily fuel consumption value of 56 L·day−1 was recorded for heavy vehicles, while the lowest value of 15 L·day−1 was recorded for personal cars using gasoline. This study is important for the improvement of uncertainties related to the different databases used to estimate emissions either in national or international reports. This work provides useful information for future studies on urban air quality, climate, and health impact assessments in African cities. It may also be useful for policy makers to support implementation of emission reduction policies in West African cities.

1. Introduction

Air quality deterioration in West Africa is accentuated by an increase in urbanization across cities such as Abidjan (Côte d’Ivoire), Dakar (Sénégal), Lagos (Nigeria), Accra (Ghana), and Conakry (Guinea) associated with rapid population growth [1]. This urbanization will lead to development into mega-cities by 2030 with an estimated population of 7.773 million for Abidjan, 6.046 million for Dakar, 24.239 million for Lagos, and 3.262 and 3.134 million for Accra and Conakry, respectively [2]. This rapid urbanization is associated with an increase of atmospheric pollution through gases and particulate emissions from anthropogenic sources [1,3,4,5]. Despite this, the characterization of anthropogenic emissions in sub-Saharan Africa, especially across West Africa, remains uncertain and is one of the major challenges of the scientific community. The car fleet of West African cities is mainly constituted of used vehicles from European and American countries [6,7,8]. These old vehicles often lack emission reduction technology [9,10]. In general, traffic emission estimation is associated with uncertainties related to fuel consumption, daily variability of traffic, emission factors [11,12,13,14], and assumptions used to geographically distribute pollutant emissions. For example, studies [15,16,17,18] in European areas and cities such as Naples, Sardinia, and in the Litorale Domizio-Agro Aversano, road traffic emissions were associated with uncertainties from emission factors (dependent on pollutant, vehicle type, inspection, and maintenance programs) as well as fuel consumption, driving patterns, and annual mileage. Therefore, the presence of numerous old vehicles in West Africa may constitute an additional source of uncertainties for this region.
Consequently, determination of the uncertainties of emissions remains either in the “top down” or “bottom-up” methods. The “bottom-up” methods estimate the level of emissions, using highest spatial resolution information on fuel consumption, traffic, and local emission factors, better than the “top-down” methodology which relies on more general information [13,19,20,21]. Existing works mostly relied on national reports or international reports from the United Nations (UN), International Energy Agency (IEA), and the Africa clean database for the estimation of fuel consumption of the number of vehicles in the traffic [3,22,23]. These reports and database provide rough information about the inventories of anthropogenic emission sources, but not many studies have been conducted on real cases or in a local field of any West African city. This needs to be addressed for the improvement and the assessment of uncertainties related to the different databases as well as national and international reports. Thus, it appears relevant that for better assessment of traffic emission inventories for sub-Saharan Africa, the scientific community need accurate and detailed information from field measurements for reducing uncertainties related to fuel consumption, traffic flow, and emission factors. It is in this vision that this work based on a field campaign, is focused on sites representative of West African cities, with the purpose of providing valuable information about fuel consumption, daily activities, and traffic flow that may be used by emissions inventory research groups for emissions improvement in Africa.
It is therefore the aim of this current work to investigate: (1) the road traffic and the associated fuel consumption at a local scale at representative sites of West Africa; and (2) provide more accurate and useful information on daily activity and fuel consumption for both the scientific community engaged in climate change and the West African policy makers involved in the implementation of mitigation measures with respect to the Paris Agreement. The study site, its particularity and the observation strategy implemented to collect the information on the traffic by focusing both on the vehicle fleet and fuel consumption, are presented in Section 2. Section 3 provides preliminary results, discussions and future implications of our approach, while the conclusion are presented in Section 4.

2. Materials and Methods

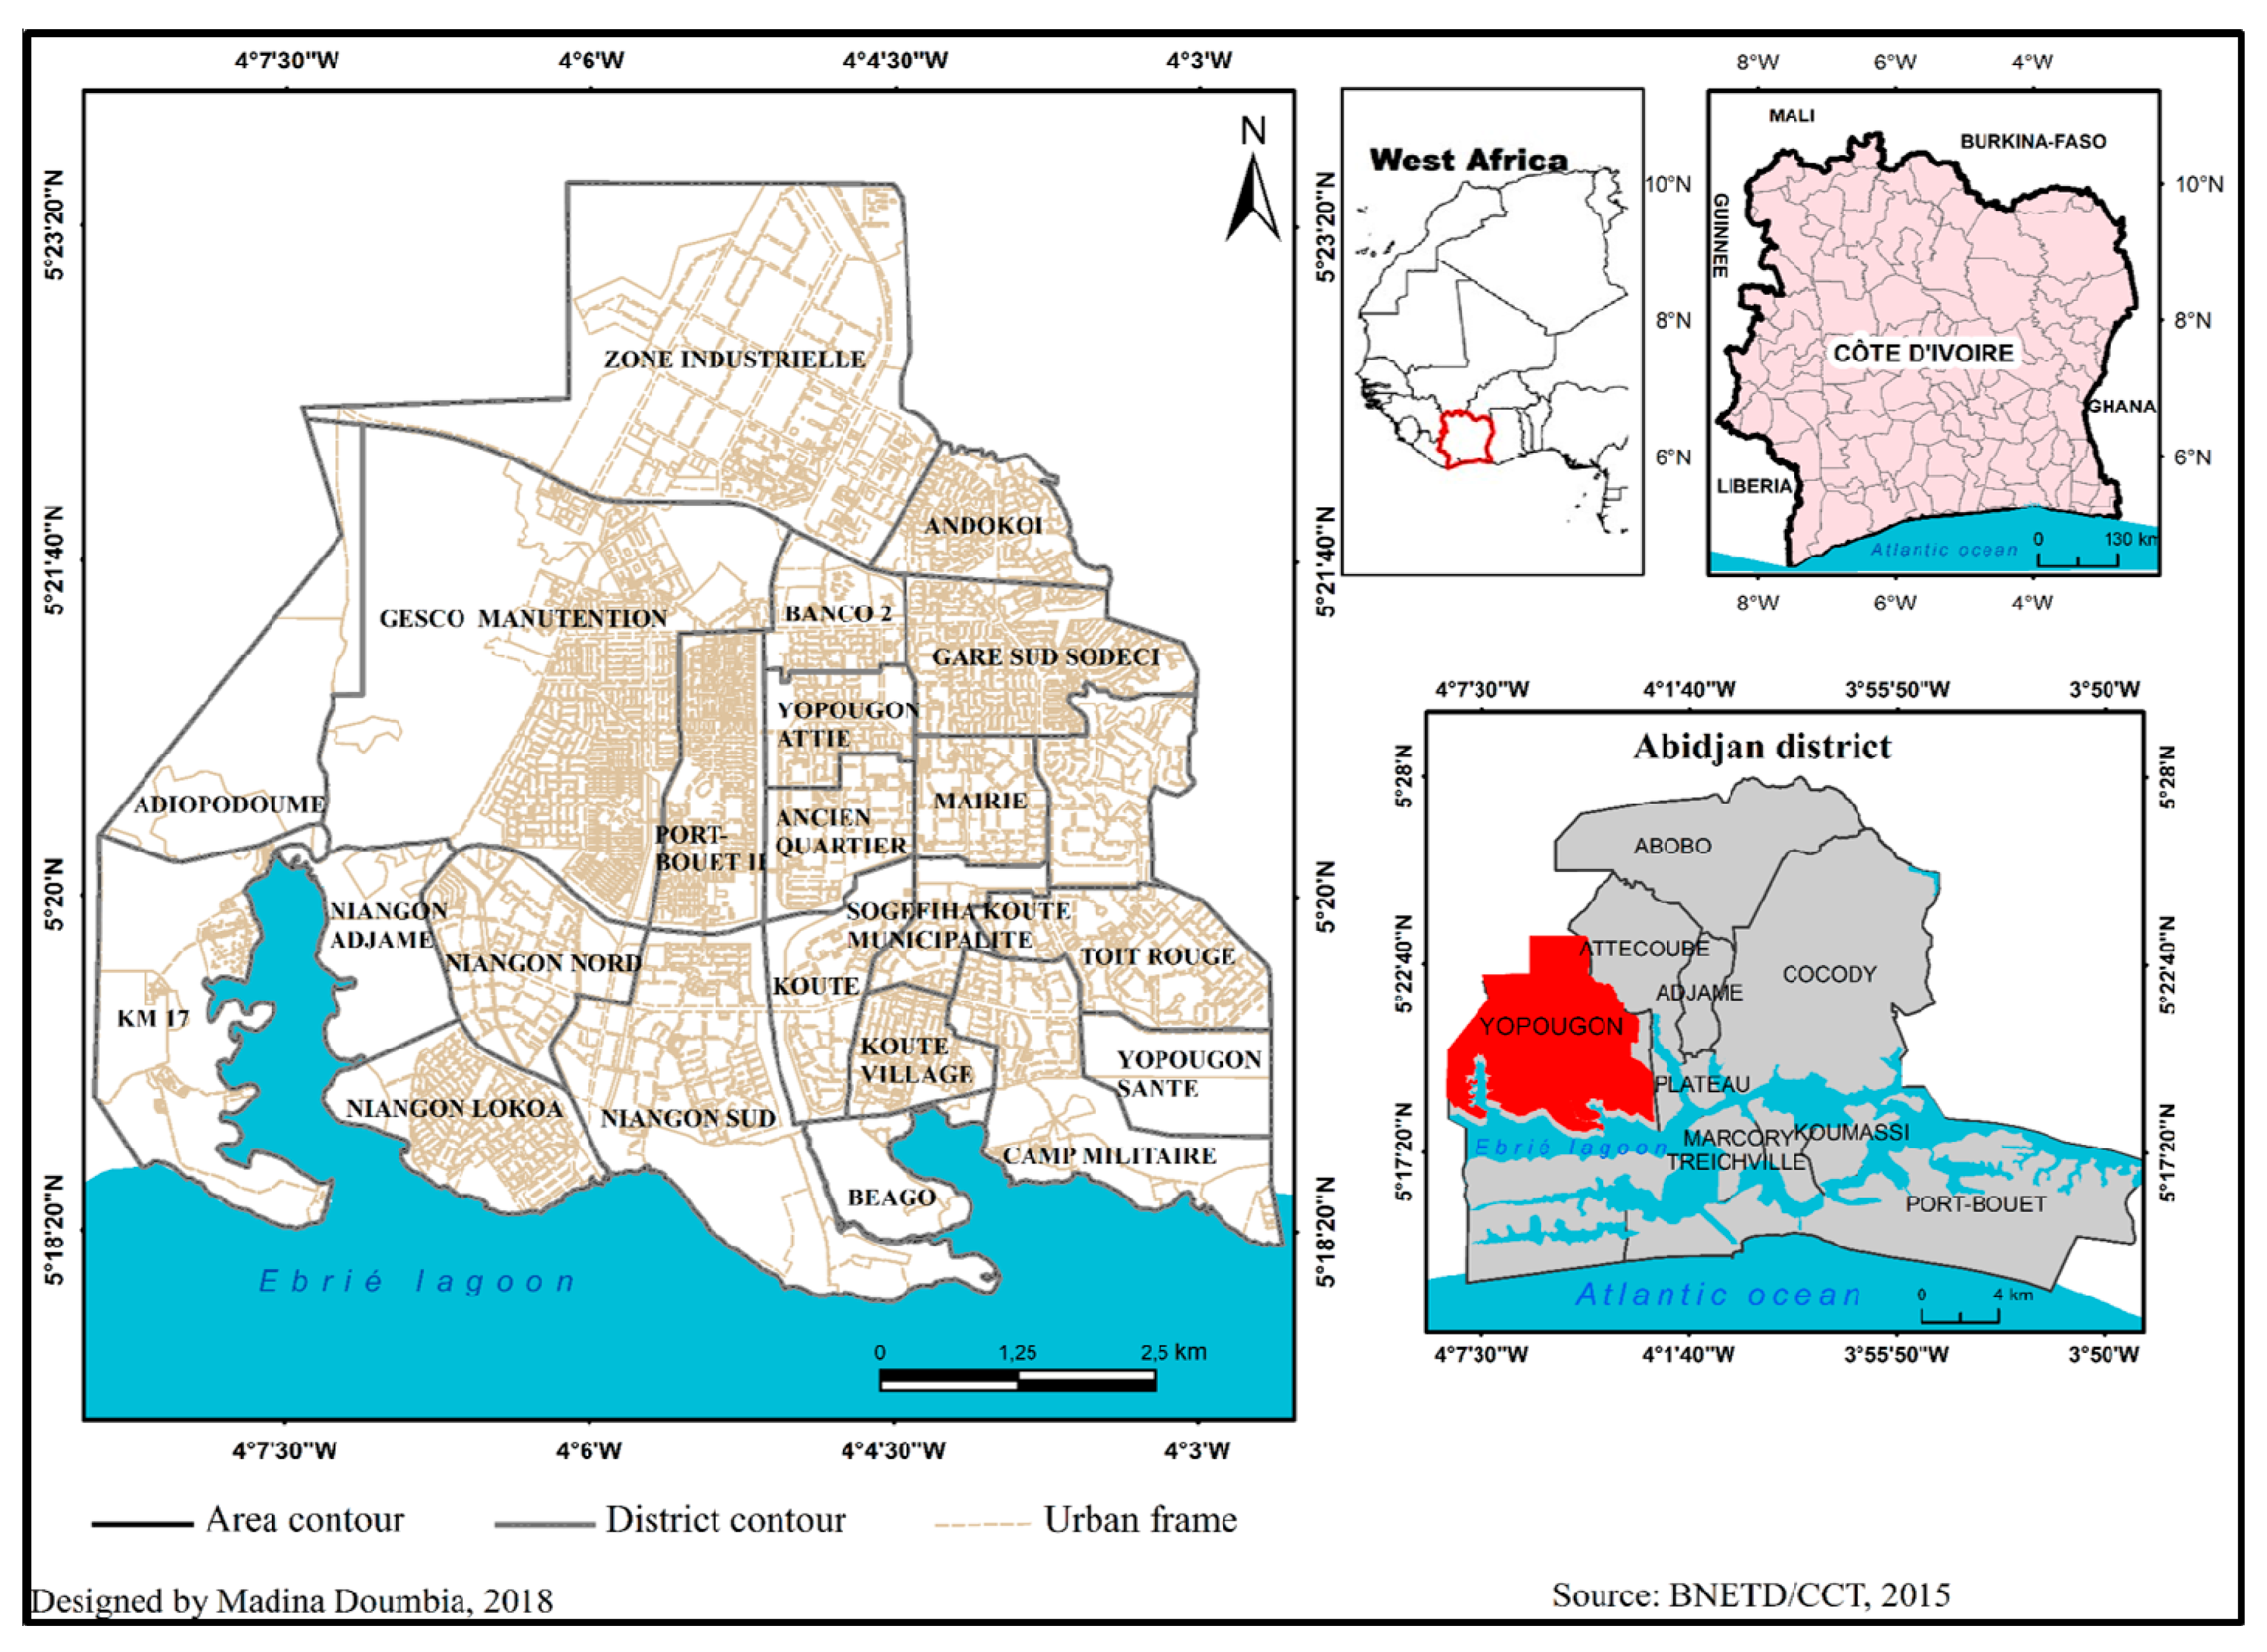
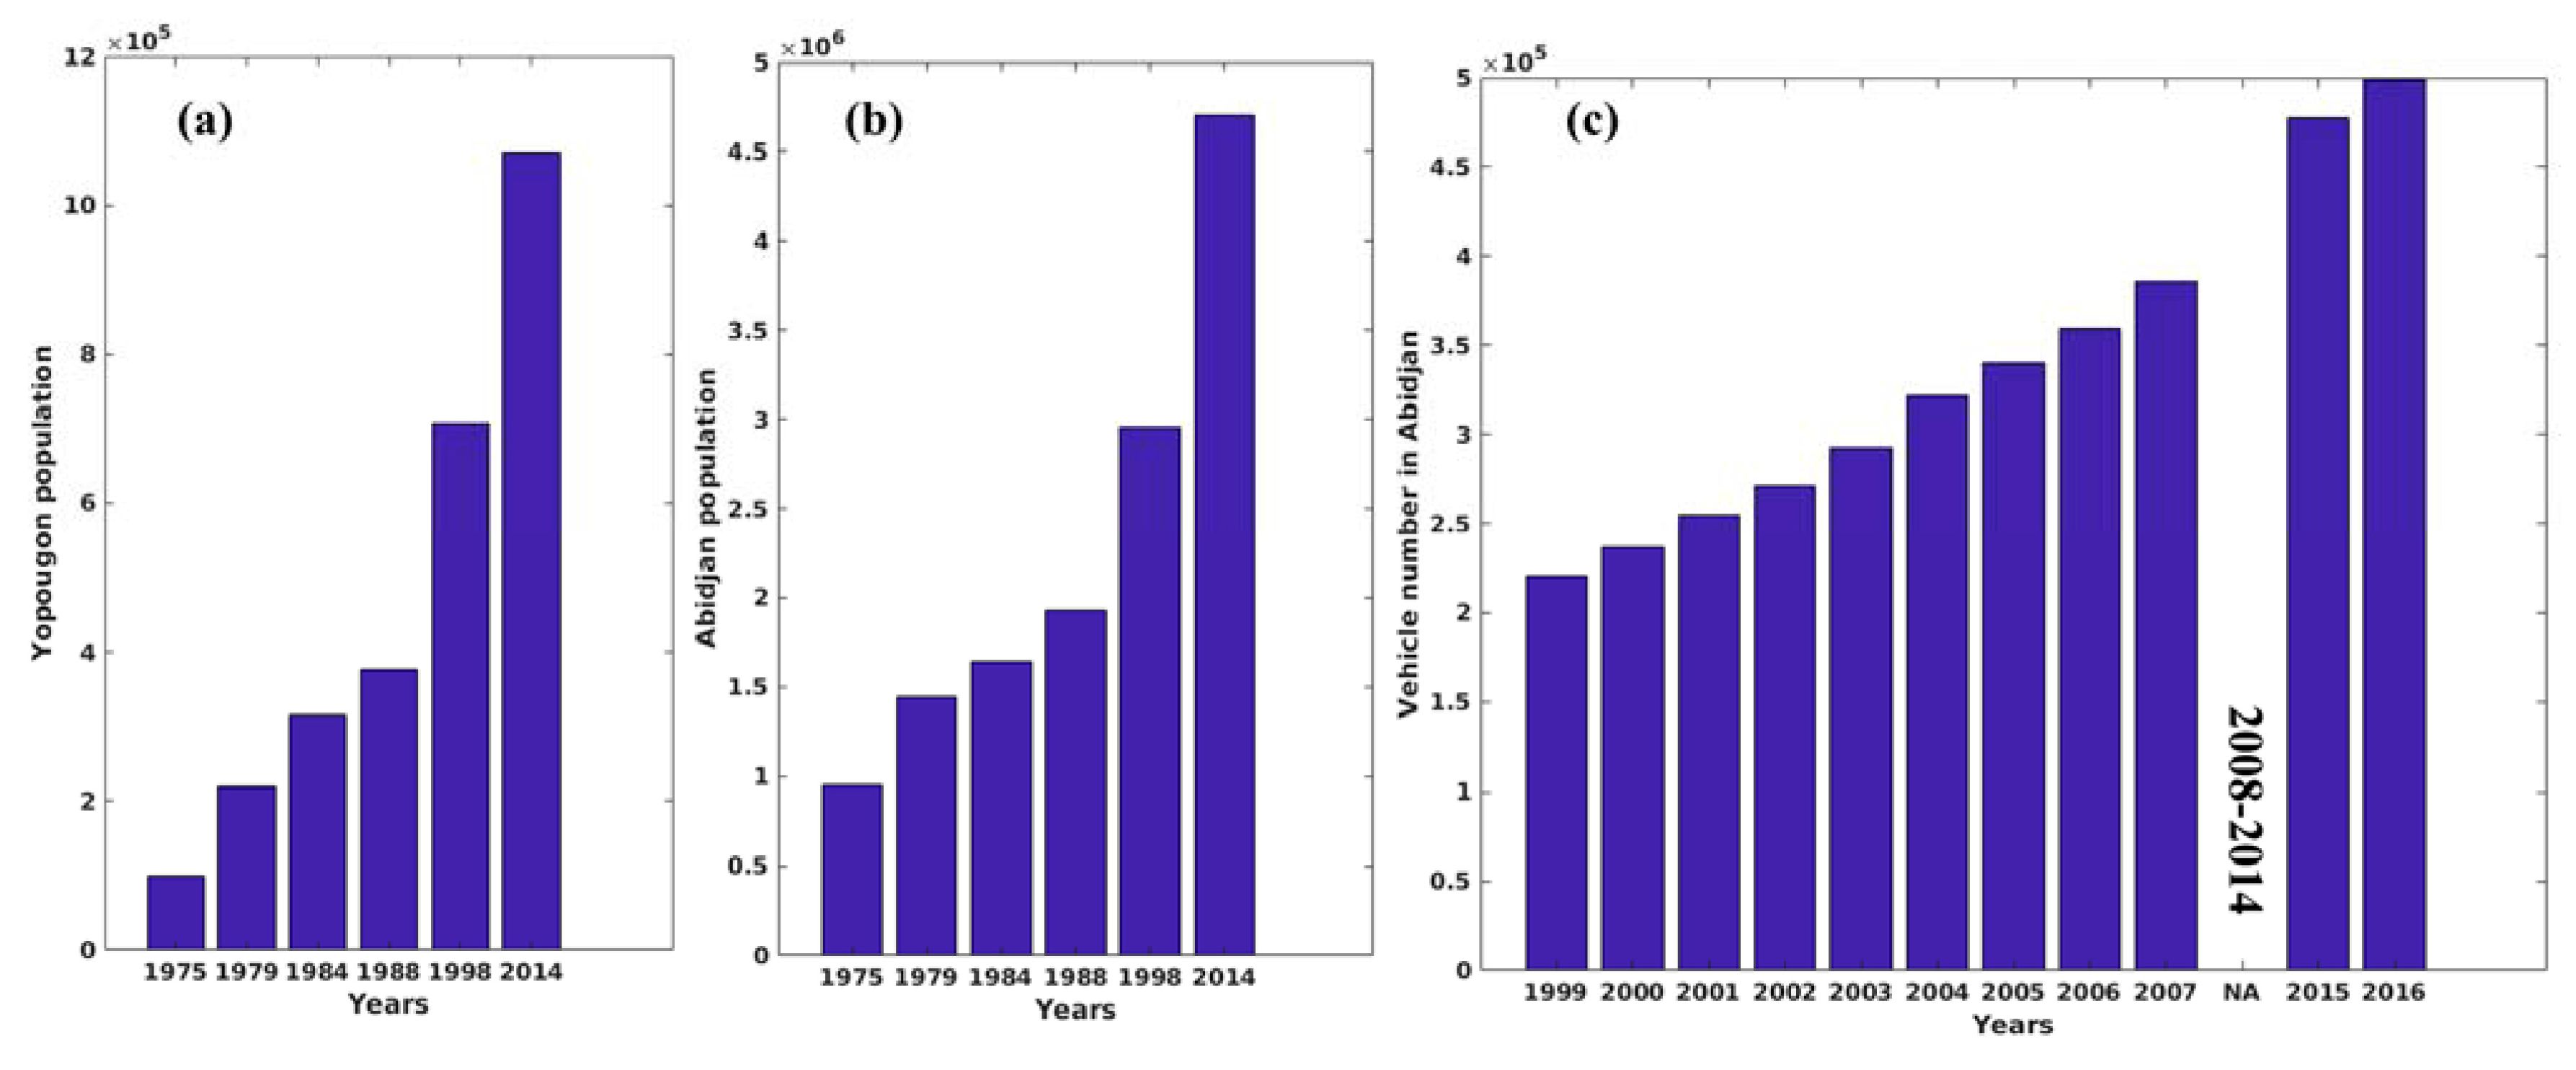
2.1. Presentation of the Study Site

Our study area was Yopougon (5.34° N and 4.01° W) located in the northwestern part of Abidjan (Figure 1). Yopougon is representative of the rapid urban development of African cities with a significant increase in population and economic activities over the last 30 years. From 1965 to 2005, the Yopougon area has increased by a multiple of over 200, with 65 ha in 1965 to 6667 ha in 1996, and 14,800 ha in 2014 [24,25,26,27]. This extent of growth has been attributed to high population growth, estimated to be around 1,071,500 inhabitants in 2014, which represents one quarter of the total population of Abidjan [28] (Figure 2a,b). Yopougon has 23 sub-areas (Figure 1), its own residential areas, with intense traffic, an industrial zone, and a central thermal power plant. It can be considered as the city with the widest town in Abidjan. Yopougon’s industrial zone is the most important in the country [24,29]. The high population growth and spatial extent have led to an increase in transportation demand and high traffic emission levels. In addition, Yopougon has neighborhoods of various standings with habitats belonging to different economic strata [30]. Yopougon’s vehicle fleet comprises personal cars, local public taxis called intra-communal sedan taxis or “Taxi Woro-woro”, ordinary taxis (or inter-communal taxis), small buses or minicars known as minibuses or “Gbaka”, heavy vehicles (buses, trucks, and long vehicles) and very few motorcycles. However, the streets of Yopougon did not have a lot of motorcycles, like those of Ouagadougou (Burkina Faso), Cotonou (Benin), Lomé (Togo), and Bamako (Mali), where the most common mode of transport is the motorcycle and motorbike taxi [31,32]. That is why, in the following sections, the motorcycle fleet is not taken into account.
African cities are hubs of socio-economic development and are becoming areas where an important part of the population lives. Abiodun et al. [33] predicted that 50% of the African population will be an urban population by 2020, and that more than half of them will be in West Africa. This represents an increase of 100% in less than 30 years [34]. The high population growth and its accumulation into the urban area and mega-cities leads to social-economic problems, environmental problems, and strong stress on the existing public transportation facilities. The high cost of new vehicles and unavailability of means of transportation contribute to the increasing number of used vehicles [5]. For example, the fleet in Abidjan city represents 80% of the national vehicle fleet. The number of vehicles has increased enormously over time, reaching approximately 477,265 in 2015 [35,36,37,38,39] (Figure 2c). The car fleet in West Africa is characterized by vehicles with diesel engines. Sixty percent of these diesel engines are in Abidjan and Dakar, comprising of personal cars, buses, minibuses, taxis, and other modes of transport such as common passenger cars or motorcycles [6,36,40,41]. Minibuses—which carry roughly 8 to 25 passengers—tend to have colloquial names, such as “Trotro” in Accra, “Danfo” in Lagos, and “Gbaka” in Abidjan. In Accra, for example, minibuses constitute more than half of the traffic fleet with 52% of ”Trotro”, 9% of taxis, 13% of personal vehicles, and 20% of buses [42]. Knowing that the governments in Africa do not invest enough in sustainable infrastructure (around 2–3% of the gross domestic product), this under-investment in road transport will have an impact on air quality and on emissions of greenhouse gases in these African cities [43].

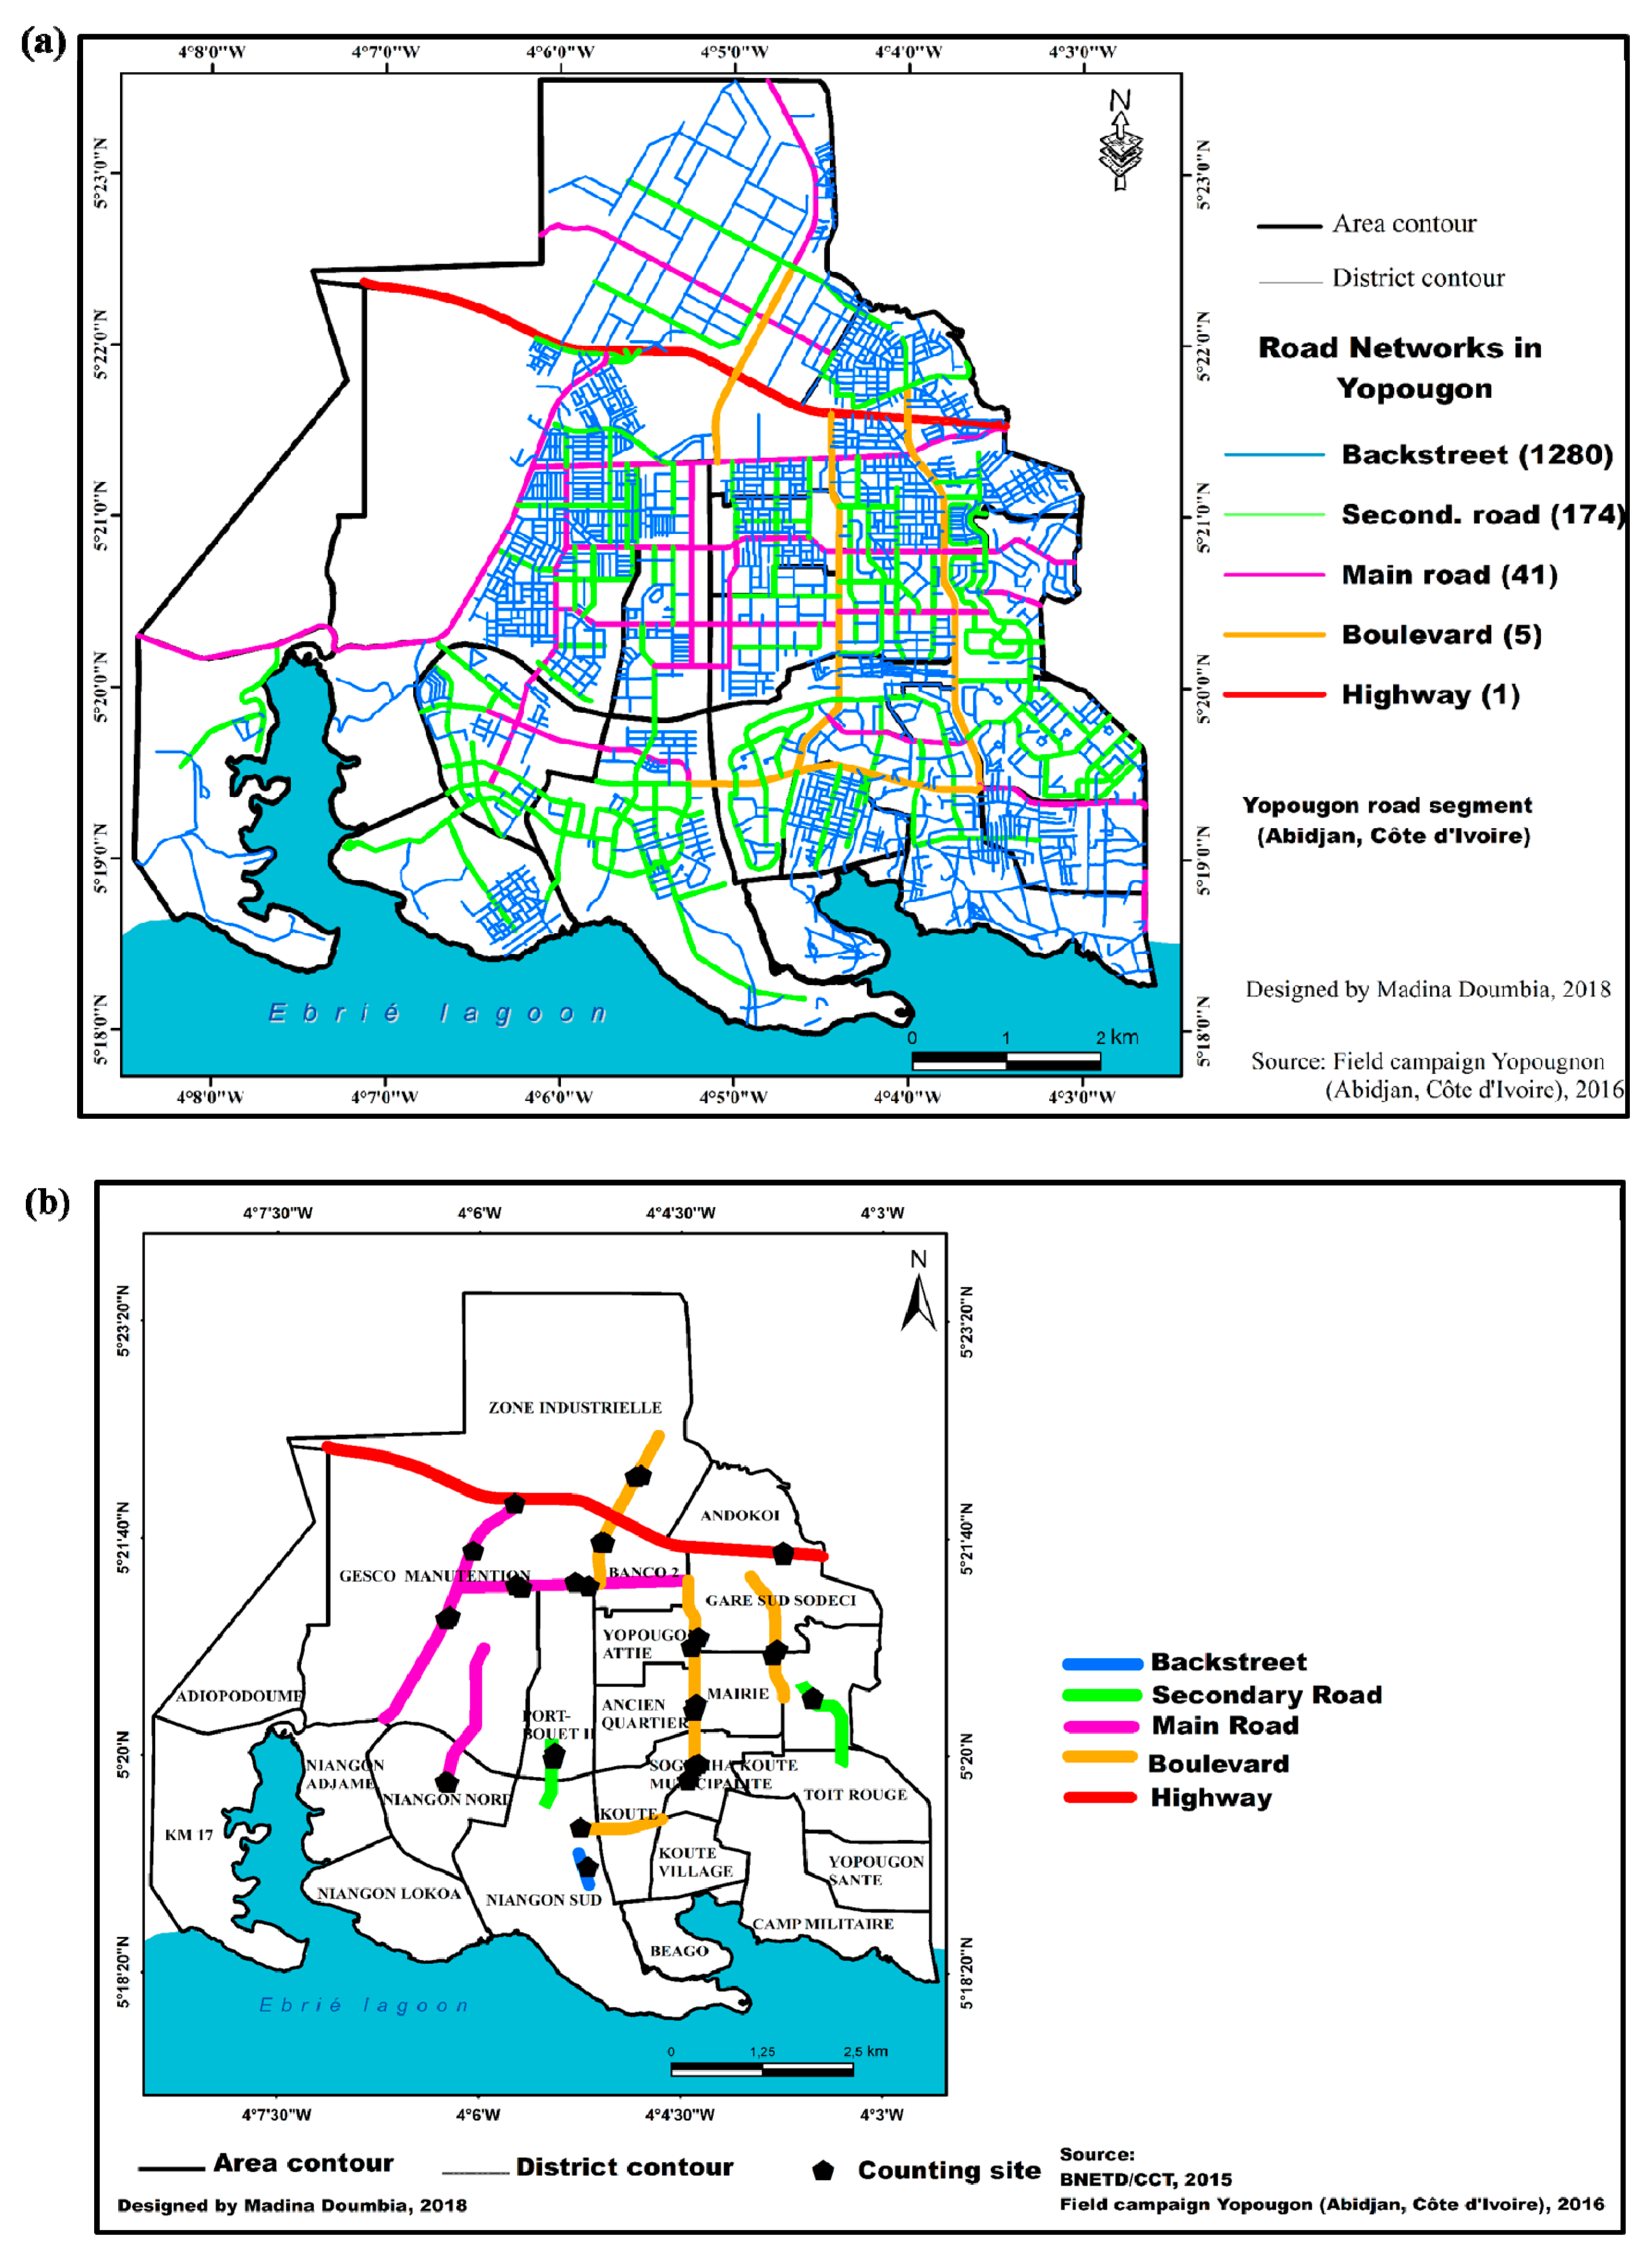
2.2. The Traffic Monitoring Strategy

A field experiment was implemented to observe and to collect data on the number of cars as well as the quantity and quality of fuel used by all vehicles. The observing and counting points were uniformly distributed on different road types in Yopougon during two different intensive observing periods (from 22 to 24 February 2016, and from 4 to 7 April 2016) performed in the same areas. The second period of measurement was undertaken to correct biases that might have occurred during the first period of measurement, and to distinguish daytime and nighttime traffic that were not observed during the first period of measurement. In addition, to provide information on hourly counting (between 6 a.m. and 6 p.m.), this second period also provided information on the flow or volume of vehicles from 9–10 p.m., 1–2 a.m., and 5–6 a.m. Night vehicle counting was conducted at specific times regarding the prevailing insecurity on the sites and the availability of police officers to protect investigators. We distinguished several classes of vehicles, such as personal cars, intra-communal sedan taxis, inter-communal taxis, minibuses, and heavy vehicles (buses, trucks, and long vehicles). Figure 3a displays the different road classes in Yopougon, with 1501 road segments separated between highways, boulevards, main roads, secondary roads, and backstreets. The field measurements campaign estimated traffic flows over few road types representing road networks in Yopougon (Figure 3b). Generally, in African cities and particularly in Yopougon, one of the difficulties is that the increase in the number of vehicles is not associated with an improvement of the road network and the quality of the infrastructure. There are a significant number of backstreets (85% of the total road network, Figure 3a), which will enhance traffic emissions. The traffic flow or volume was defined as the number of vehicles (in each class) per hour moving on a given road. The traffic flow was assessed hourly across different road types or classes. A parallel survey was also conducted to provide necessary information about the fuel type and the consumption, the vehicle types and ages, and the travelling time of each vehicle type. From 22 February to 16 March 2016, a total of 472 drivers chosen randomly in Yopougon were interviewed during the survey to help in the assessment of vehicle fleet and traffic emissions.

2.3. Statistical Analysis

Statistical analyses were performed on the collected data during the field measurement. A sample size of 472 drivers chosen randomly in Yopougon was analyzed with a margin error of 4.51% using Equation (1) as described in Dagnelie [44]:
N = U 2 1 a / 2 × [ P × ( 1 P ) / d 2 ]  
where N is the sample size (the total number of field campaign in the study), U21−a/2 = is 1.96 as value of the normal random variable for a probability value of a = 0.05, P is assumed 50% as estimated proportion of people randomly chosen who have a vehicle, and d is 4.51 as the expected error margin from the survey, which is between 1% ≤ d ≤ 15%.

3. Results and Discussion

3.1. Validation of Traffic Flow Measurement Data
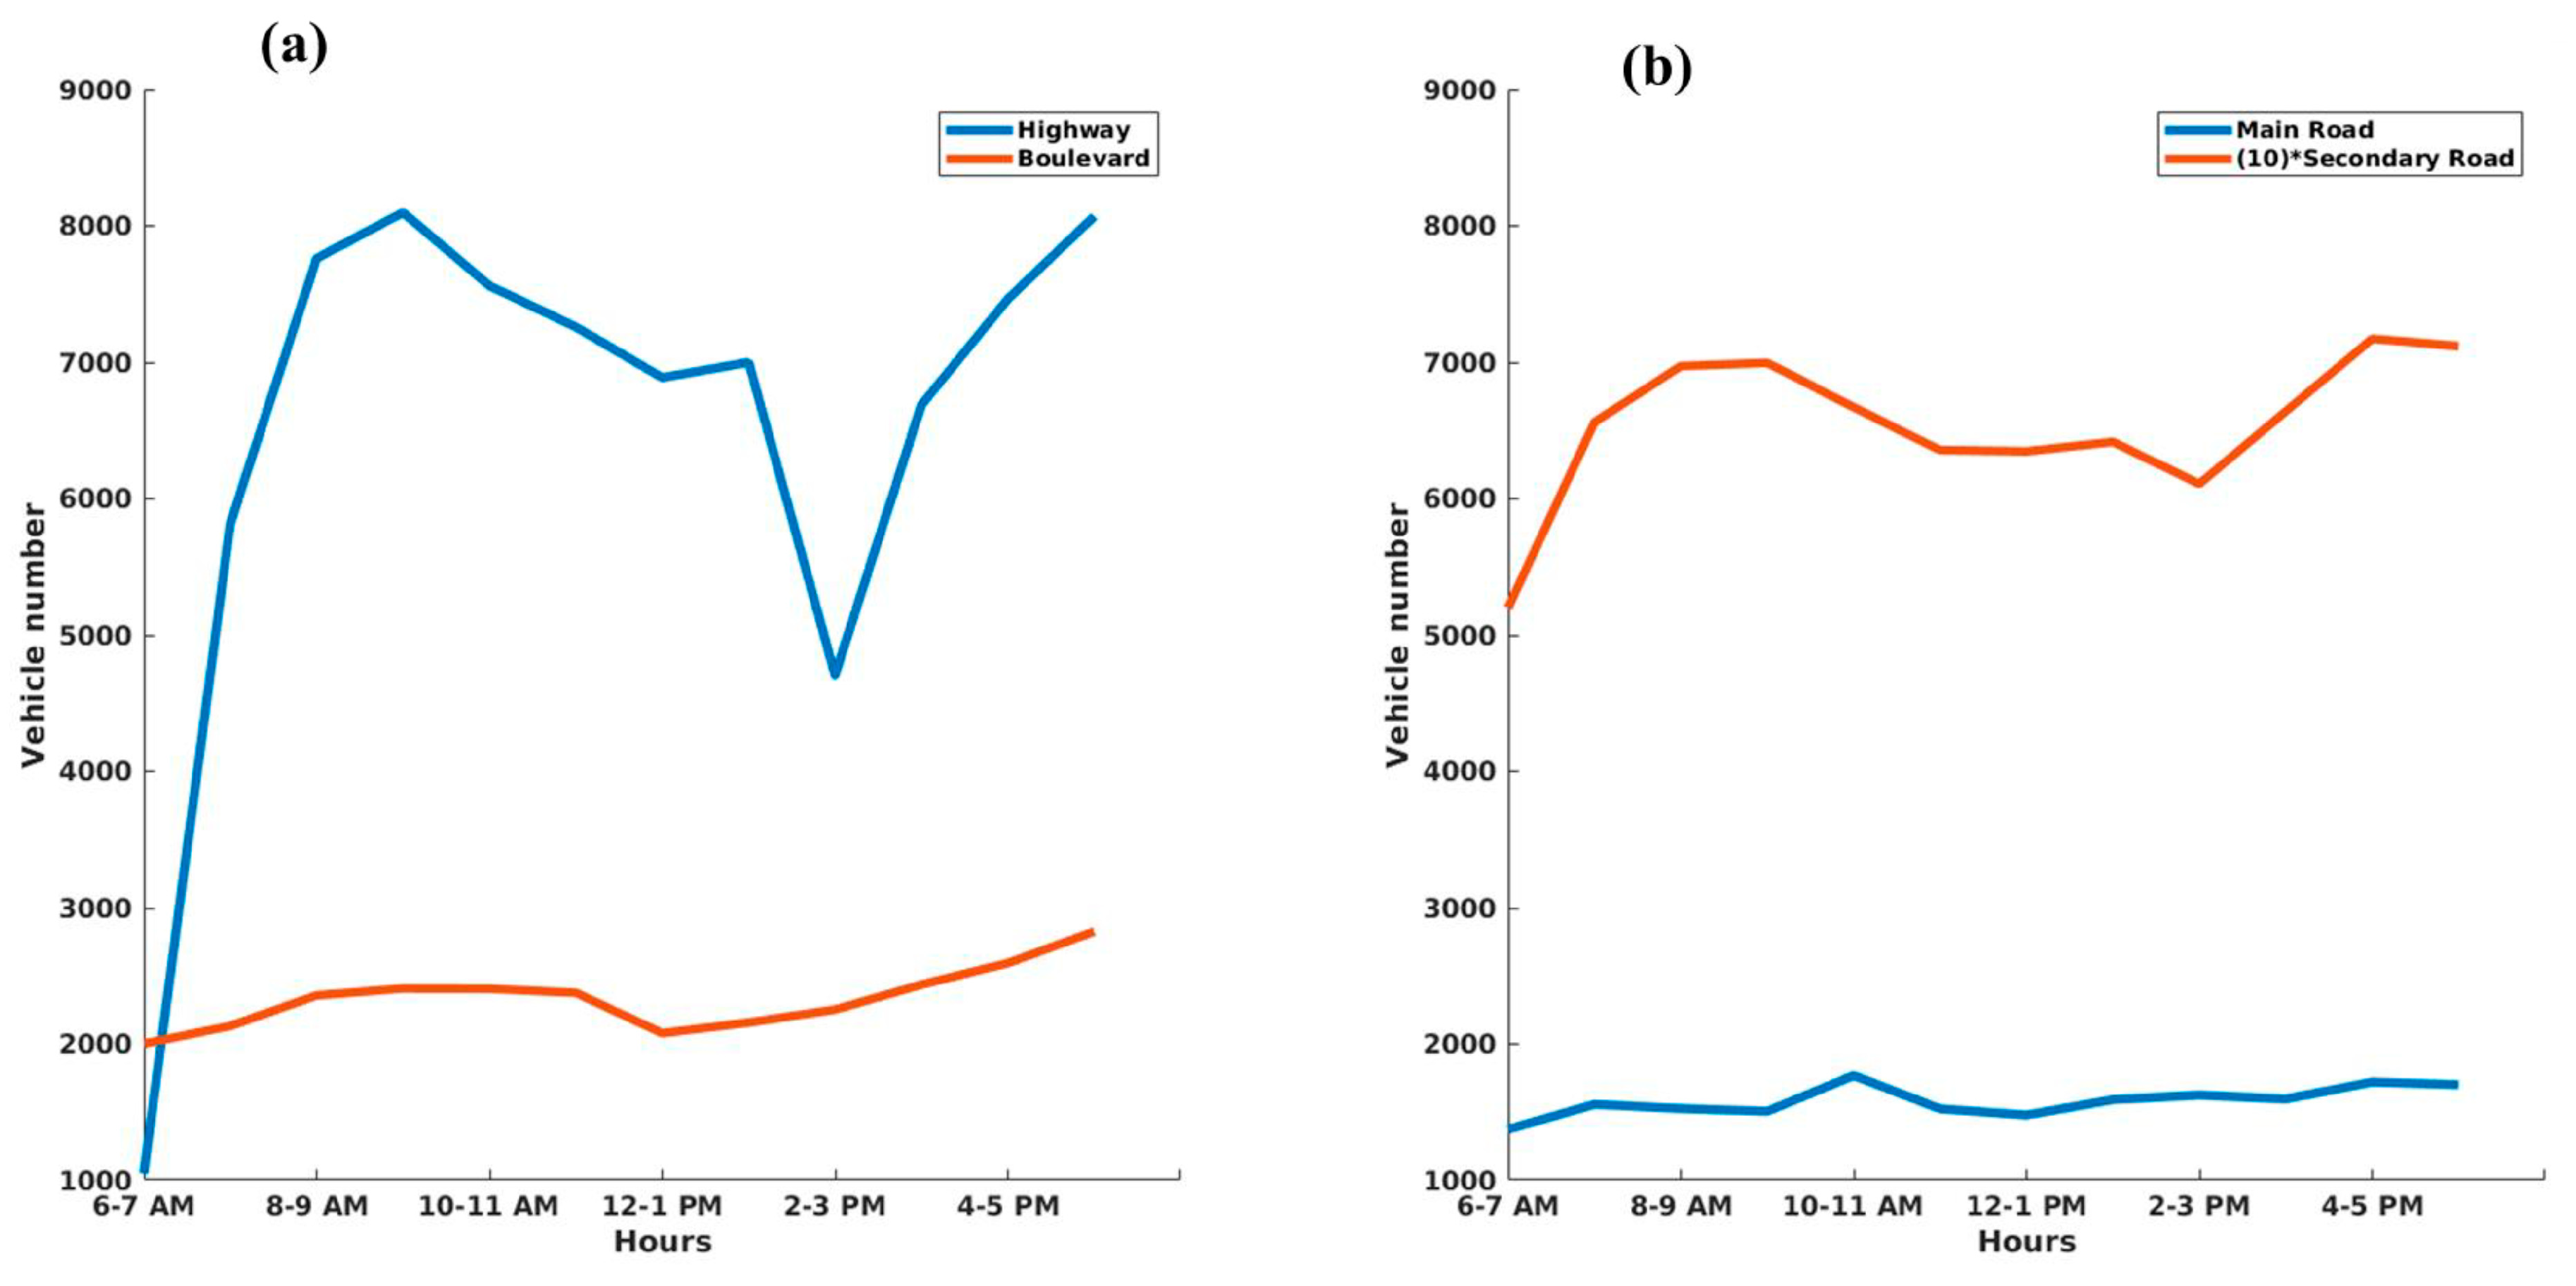
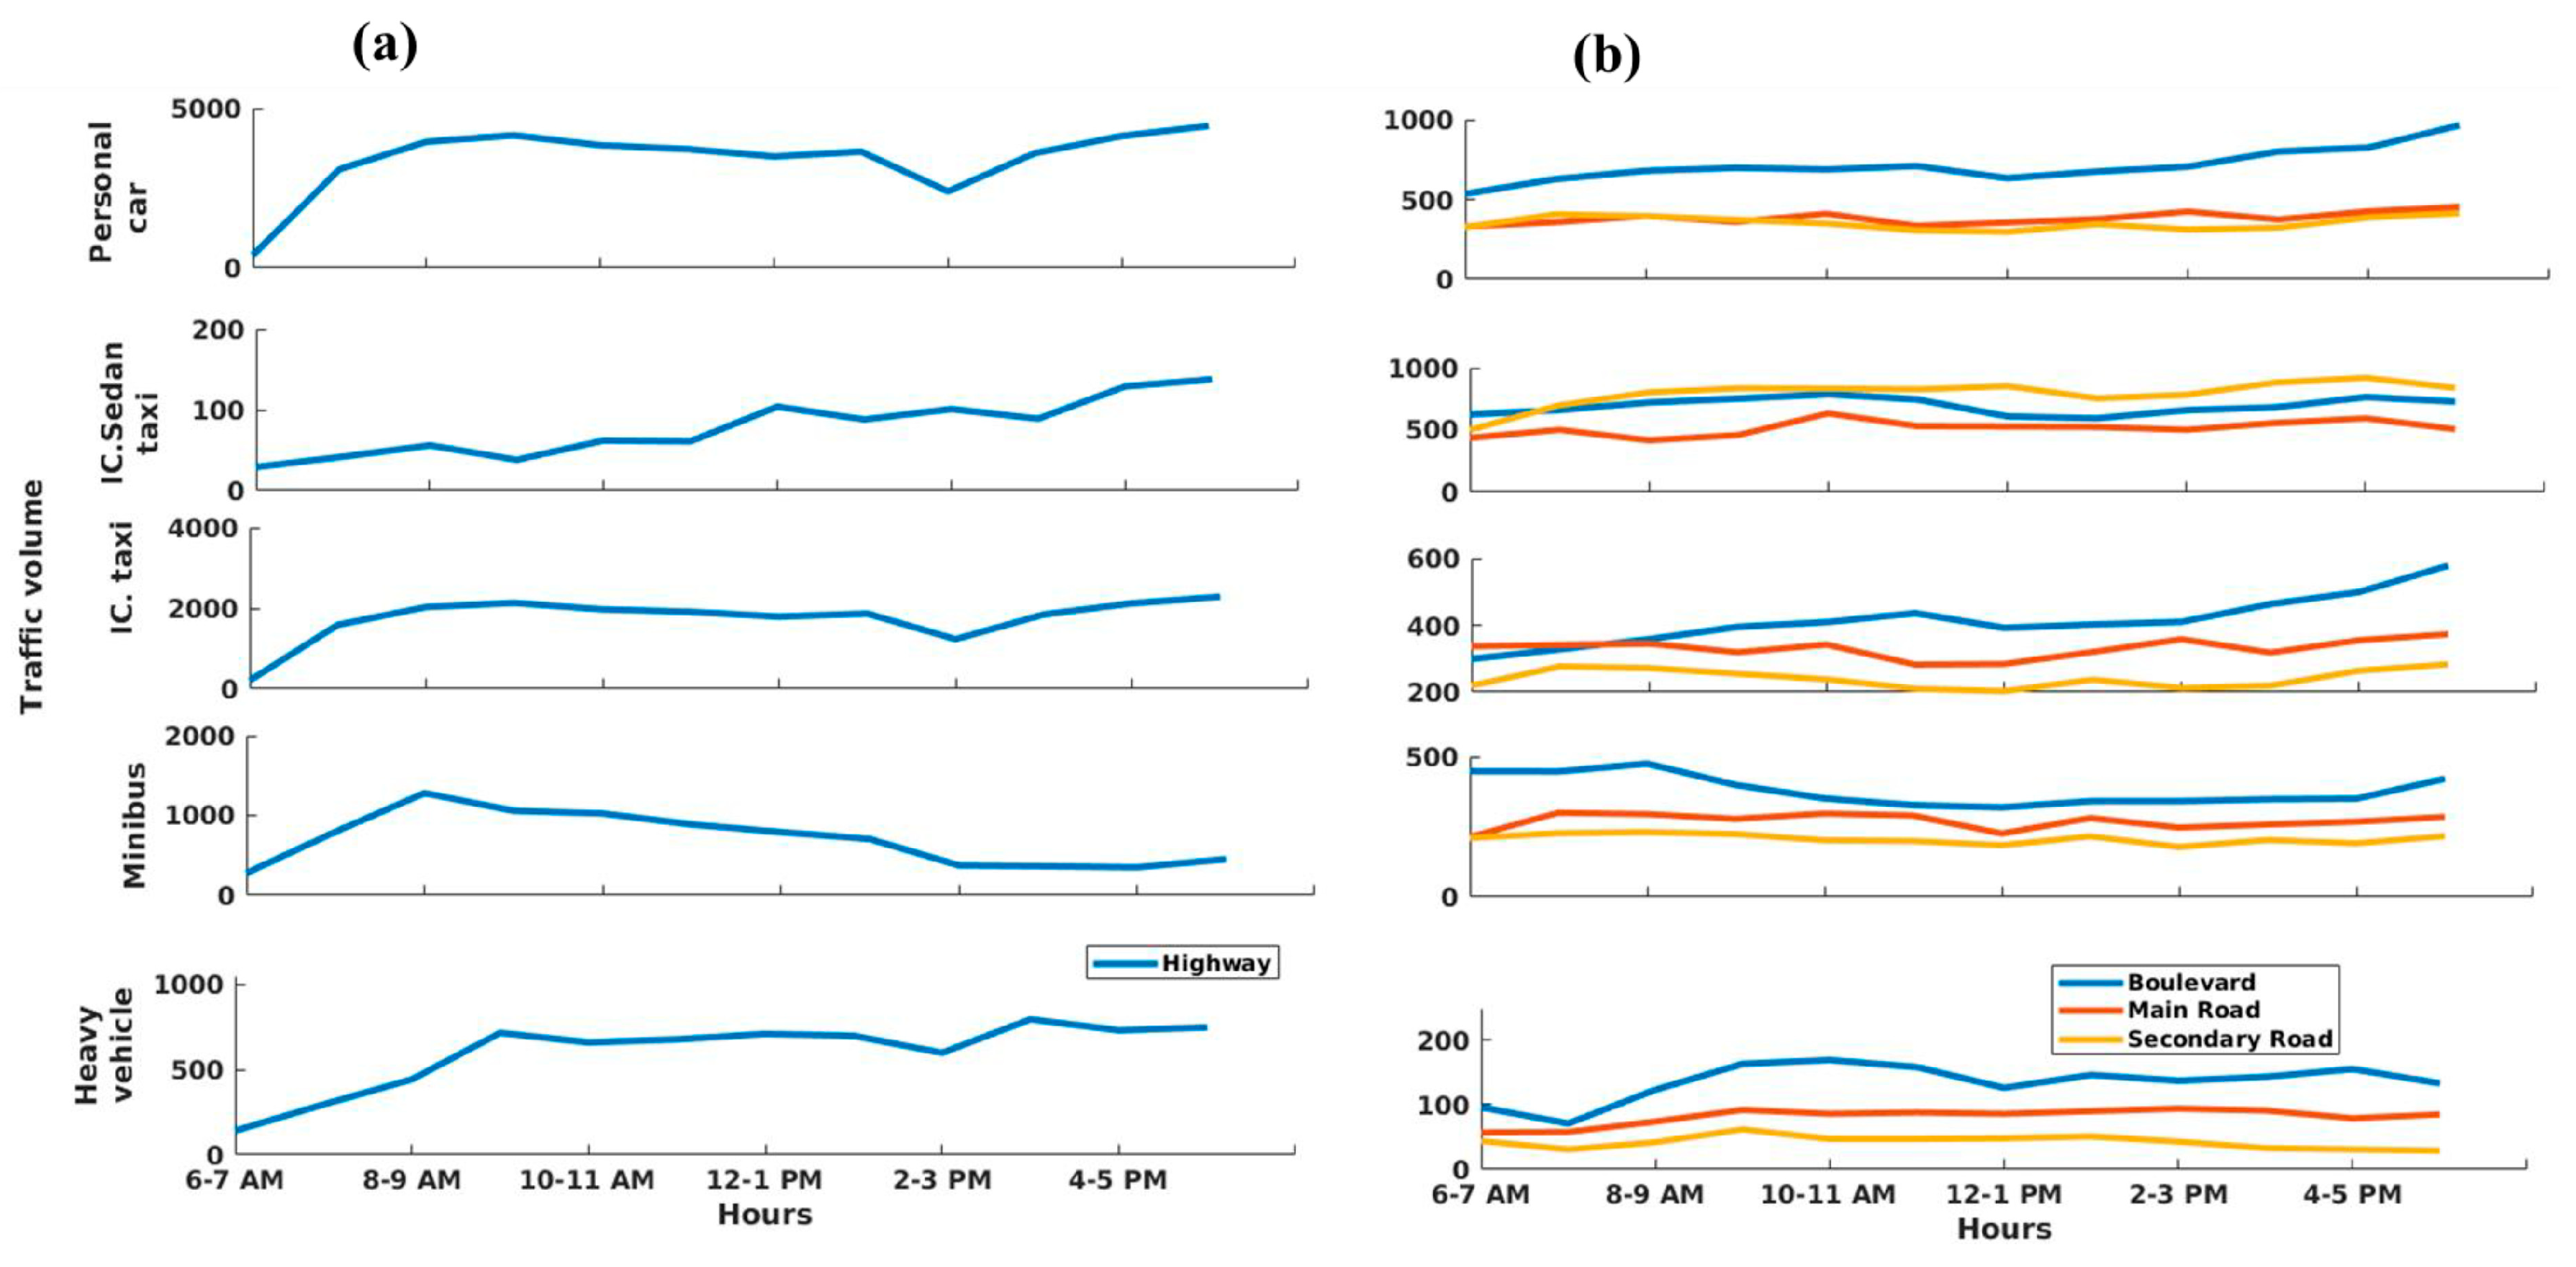
As there is no available database, the traffic data collected during the survey were validated using data provided by Bureau National d’Etudes Techniques et de Développement (BNETD), which is the national bureau of standards for monitoring and verification to support elaboration and implementation of development plans and policies in Côte d’Ivoire. The BNETD data have been collected from 9 to 13 August 2014 on a highway where our measurements were made and thus, the comparison with our data is performed on this unique highway (Table 1). Table 1 shows that we recorded a higher number of vehicles than BNETD. The differences between the two datasets may be explained by the difference in season. Our measurements were made during the school season (February) while those of BNETD were collected during the holidays or non-school season (August). The school season corresponds to the period of regular and high demand of personal cars, intra-communal sedan taxis, and inter-communal taxis by schoolchildren, middle and high school students. This may explain why we recorded more vehicles than BNETD. It should also be noted that holiday periods correspond to travel times, which could explain the increase of travel, from cars through to minibuses and buses (heavy vehicles). Officially, since the intra-communal sedan taxis (or local taxis) are not supposed to use the highway, the BNETD considered none of these vehicles in their report. However, during our field measurement, we recorded their presence on the highway.

3.2. Traffic Flow

Figure 4 shows daily traffic flows from linear sources for each road class (highway, boulevards, main roads, secondary roads, and backstreets) during the counting day. It can be seen that maximum total traffic flows vary between 36,872 and 78,360 vehicles per hour on the highway (red line). The blue line corresponds to roads inside so-called “backstreets” and is associated with weak traffic flows varying between 0 and 700 vehicles between 6 a.m. to 6 p.m. Traffic flows for boulevards, main roads, and secondary roads are respectively shown in orange, pink, and green lines. A high traffic flow is noted on the highway. This may be explained by the large width of the way, by the high authorized speed, and by the fact that it is the main inter-district road connecting Yopougon to other cities. The weakest traffic flow is observed in our backstreet check point. However, as “backstreets” represent 85% of roads in Yopougon and as they are used mainly as access roads to residential areas, they are often crowded and associated with low speeds inducing high fuel consumption and consequently, high emissions. This phenomenon is also observed on idle roads where daytime traffic leads to an increase in traffic congestion and of fuel consumption [45].
Figure 5a,b represents the traffic flows per hour over each road type. In general, important traffic flows are observed at 6–11 a.m. and 5–6 p.m. and correspond to peak times. The maximum number of vehicles is observed at 9–10 a.m. on the highway (8099 vehicles) while the minimum is noted at 10–11 a.m. on the backstreet (7 vehicles). These values also show structures with two peaks over backstreet (at 6–7 a.m. and 5–6 p.m.), main road (high at 10–11 a.m. and 4–5 p.m.) and boulevard (at 11 a.m.–12 p.m. and 5–6 p.m.). While a three-peak (two high peaks and one middle peak) pattern is observed over the highway (high at 9–10 a.m. and 5–6 p.m. and moderate at 1–2 p.m.) and the secondary road (at 4–5 p.m. and 5–6 p.m. and moderate at 1–2 p.m.) with sharper peaks in the morning and evening than the afternoon. These two peaks can be explained by periods when most people go to work (morning) and back to home (evening) inducing high traffic volume as observed in previous studies (at 7–10 a.m. and 5–7 p.m. in Aveiro (Portugal), and 7–9 a.m. and 4–6 p.m. in Almelo in Netherlands [46,47]). Also, the middle peak at 1–2 p.m. can be explained by the fact that we have no canteen system on site and people use their cars to go to eat (home or restaurant), or for food delivery during this time. As the minimum number of vehicles were observed at 10–11 a.m. in the backstreet, it can be assumed that at this time, all users of personal cars (workers) have already left their homes.
Figure 6 shows the number of each vehicle type per hour per type of road. Figure 6a shows a similar evolution of traffic flows on the highway for the personal car and inter-communal taxi. From 2–3 p.m., a decrease in traffic is observed for different vehicle types with the exception of intra-communal sedan taxis. It is important to note that from 2 p.m., all professional and school activities resume after the lunch break (12 p.m.–2 p.m.), leading to the drop in traffic on the highway between 2 and 3 p.m. Also, sedan taxis do not often use the highway, with the particularity of running throughout the day. Traffic flow on main roads is more important than secondary roads for personal cars, minibuses, and heavy cars (Figure 6b). The opposite trend is observed for intra-communal sedan taxis. Furthermore, an important personal car flow over each road type is observed at 6–7 a.m. and 5–6 p.m. and corresponds to peak hours. Intra-communal sedan taxi corresponds to both peak and off-peak hours (10–11 a.m., 4–5 p.m., 6–7 a.m., and 5–6 p.m.).
Table 2 summarizes the total traffic flow per class of road and per type of vehicle. The minimum and maximum of total traffic flows are, respectively, 700 vehicles on the backstreet and 78,360 vehicles on the highway per half-day (6 a.m. to 6 p.m.). Personal cars contribute to the high traffic flows over the highway, boulevards, and backstreets, while intra-communal sedan taxis are more important in the main and secondary roads. The relatively higher number of personal cars on the highway compared to the other vehicle types may be explained by the fact that the highway remains the main and fastest road that links Yopougon to the other parts of Abidjan, and is the main route to the central and northern parts of the country. The interest of sedan taxis to serve destinations within Yopougon are highly evident on the highway, while their continuous attempts to avoid traffic jams and pick up eventual customers near to their houses, justifies their important presence on the main and secondary roads.
The data indicate that road traffic emissions are highly dependent on traffic flow, driving patterns, and road traffic congestion. For example, sedan taxi and minibus driving patterns characterized by frequent stops for picking up and dropping off passengers may induce more fuel consumption and therefore increase emissions due to additional starting of the ignition [48,49,50]. Kan et al. [45] indicate that the spatial-temporal patterns of fuel consumption of taxis are highly related to their activities, especially idling stops, traffic congestion, and non-service stopping activities, such as refueling or waiting for passengers, which have a notable impact on fuel consumption and emissions. A good characteristic of traffic flow on different types of road will therefore lead to a better classification of traffic emissions. Traffic flow diurnal cycle is strongly correlated to diurnal cycle of emissions which will impact the boundary layer chemical composition. During the daytime, turbulence in the boundary layer induces vertical mixing between the air moving horizontally at a given level and the air immediately above and below, which is important for pollutant dispersion. This complex mixture of pollutants and atmospheric transport mechanisms affecting pollutant dispersion near the highway is likely to impact pollutant concentrations and dispersion near the road [51]. Thus, in the emission and dispersion processes of on-road air pollutants, spatio-temporal characterization of traffic flow, the high emitting vehicles, and the street ventilation will contribute to better characterizations of related road concentrations recommended for air pollution studies [52].

3.3. Composition and Information of Fleets from Survey

The survey revealed that for each class of vehicle (personal cars, intra-communal sedan taxis “Woro-woro”, inter-communal taxis, minibuses “Gbaka”, and heavy vehicles), more than 60% of vehicles are older than 10 years (Table 3). The age of some vehicles, such as personal cars (6%) and heavy vehicles (1%), are sometimes beyond 30 years old. Vehicle fleet composition recorded here in the present work is in agreement with previous works suggesting that sub-Saharan countries’ vehicle fleets are dominated by old vehicles imported from western countries, which are important sources of traffic-related pollution [6,53,54,55]. Moreover, the survey revealed that 100% of the intra-communal sedan taxis, inter-communal taxis, minibuses, and heavy vehicles use 74% gasoil, while personal cars use gasoline at 26%. However, at the country level, reports estimated 58% of vehicles used gasoil against 39% using gasoline [36]. In Senegal, for example, gasoline vehicles are estimated to be 60% of the national fleet [40]. Since the Societé Ivoirienne de Contrôle Automobile (SICTA) values are based on the number of vehicles controlled, the difference in fuel proportions could be explained by not taking into account uncontrolled or non-conventional vehicles.
In West Africa, vehicle age tends to be somewhat higher with some minibuses being 20 years old [6]. These old age vehicles are associated with poor maintenance and may enhance emissions and therefore increase air pollution. Indeed, previous studies [3,9,10,56,57,58] have shown that older engines with a lack of emission reduction technology can lead to poorly burnt fuel, which may further induce higher fuel consumption and more traffic emissions. Also, gasoil use by transportation cars, such as intra-communal sedan taxis, minibuses, and buses, may be explained by its relatively low cost compared to gasoline. This difference in price contributes to higher usage of gasoil in many West African countries where poverty is high, and ecological and environmental concerns are not yet well spread in the population. However, over the last 10 years, gasoline and gasoil prices have become very similar [59,60,61] and the SICTA has underlined an increase in gasoline vehicles (see SICTA report, [36]).

3.4. Fuel Consumption (Cday) and Travelling Time (tp)

The quantity and type of fuel consumed per type of vehicle was collected during the survey. Since vehicles are not running continuously throughout a given day (24 h), the daily consumption (Cday) of a car is defined as the amount of fuel consumed by the vehicle during its travelling time (tp). Given the key importance of the travelling time or the actual period in which the vehicle is running to estimate Cday, the starting and stopping times for each vehicle type were recorded during the field campaign. Depending on the activity of each driver, travel time varies. A summary is provided in Table 4. It is also worth noting that the starting and stopping times may vary from one driver to another, but we assumed the same travel time means per each vehicle class. For example, the public transport vehicles such as intra-communal sedan taxis, inter-communal taxis, minibuses, and buses, start between 4 a.m. and 5 a.m., and end at 9 p.m. and 1 p.m. The highest tp is recorded for inter-communal taxis (19 h), while the lowest tp belongs to personal cars (3 h). Similar tp is observed for heavy vehicles, minibuses, and intra-communal sedan taxis. The range of tp is estimated between 12 and 19 h for minibuses, 14 and 21 h for intra-communal sedan taxis, 13 and 22 h for inter-communal taxis, 1 and 4 h for personal cars, and 6 and 24 h for heavy vehicles. The tp of intra-communal sedan taxis, inter-communal taxis, minibuses, and heavy vehicles are important because of their strong presence on the roads. The intra-communal sedan taxis, inter-communal taxis, and minibuses are public transport vehicles which move at any time of the day. The same vehicle is driven by two or more drivers. Heavy vehicles, in their missions to drive passengers or luggage, are present day and night. Personal cars operate between work and home, which explains their reduced travel time. High variability is observed in the Cday of heavy vehicles compared to public transport vehicles, such as intra-communal sedan taxis, inter-communal taxis, and minibuses, underlined by their high difference between maximum and minimum values. The range of Cday (in liters per day, hereafter L day−1) for intra-communal sedan taxis, inter-communal taxis, and minibuses is recorded between 23 and 35 L day−1, 35 and 62 L day−1, and 30 and 60 L day−1, respectively. Highest Cday value is 56 L day−1 and corresponds to heavy vehicles. The range of heavy vehicles is estimated between 5 and 100 L day−1, which is explained by their weight and powerful engines. The lowest value of 15 L day−1 is observed in personal cars using gasoline and the range is estimated between 2 and 53 L day−1. The lowest Cday found in personal cars is in agreement with the fact that diesel engines consume more than gasoline engines [54,60,62]. Fuel consumption in Yopougon is related to vehicle type, travelling time, and the vehicle’s age. In addition, fuel-consumption rate increases with its weight and decreases with vehicle’s technology and electronic diesel engine control [63,64,65,66]. Moreover, several kinematic parameters such as average speed, instantaneous speed, and acceleration as well as driving condition characteristics, impact fuel consumption and thus emissions [16,45,67,68]. Previous works showed that higher levels of acceleration correspond to an increase in fuel consumption which leads to higher carbon monoxide (CO) and hydrocarbon (HC) emissions [45,69,70]. Though this driving pattern greatly impacts fuel consumption and therefore emissions, this study did not investigate this parameter.

3.5. Implications for Emission Estimates in African Cities

The inventory of emissions in Africa, especially across West Africa, still have uncertainties related to the methodology applied (“bottom-up” and “top down”), the emission factors, the fuel consumption, the spatial keys, and the annual registrations of vehicle by country [11,12,14]. Many works focusing on the inventory of African anthropogenic emissions [3,11,12] by lack of local and well-documented information have relied on national, regional, and international reports, which have significant limitations. Often, information is collected by non-scientists who are not aware of the importance and accuracy in data and the implications for research. This study aimed to provide a novel approach of investigating the key parameters, such as fuel consumption and quality, traffic flow, and vehicle age, that impact the estimation of anthropogenic emissions. This pioneering information about the age of vehicles, the quantity and quality of fuel consumed, the traffic flow, and the type of the road, recorded in the field by scientists, improves the inventory of emissions and reduces the uncertainties in the existing database all over Africa. Though this study did not investigate emission factors (one of the key points in emission inventories establishment), our study showed that the proportion of vehicles using gasoil may be underestimated in the available traffic emission inventories. Also, this present study recorded a higher number of vehicles on the highway than the national database of BNETD. Moreover, peaks in vehicle flow coinciding with peak hours Implies high fuel consumption and emissions. Our results are in agreement with the study by Kan et al. [45] in Wuhan (China), who found that the number of vehicles significantly influences the relative fuel consumption and emissions during the morning (4–6 a.m.) and evening (4–6 p.m.) peak hours. In addition, daily fuel consumption and activity are crucial parameters in emission estimation. In estimating traffic emissions using the “bottom-up” methodology, daily fuel consumption and activity are required [3,11,71]. Information about daily fuel consumption and activity, especially in the West African region, may contribute to reducing uncertainties and help to provide accurate daily emission estimates [11,12]. Additional information about vehicle age underlined the significant proportion of aged cars in West African vehicle fleets. This information may help countries to implement regulations aiming to limit imported old vehicles in sub-Saharan Africa. Despite the limited period of measurement (22 February to 7 April 2016) and shortcomings related to the manual hourly vehicle counting methodology, the non-consideration of weekend and holidays during measurement, basic statistics and survey information that are the limitations of this study, preliminary results presented here will surely be useful for building and correcting emission inventories for African cities. Future work assessing the impacts and implications of the present work on vehicle fleet and fuel consumption on traffic emission is ongoing. This future work will point out traffic emission improvement and reduction of uncertainties using the present information for local traffic emission inventories.

4. Conclusions

This study is based on a combination of survey and vehicle counting, during a field campaign in an urban area of Yopougon (Abidjan, Cote d’Ivoire) from 22 to 26 February 2016. Our results at this site are the first detailed, local information on some of the key parameters that are used to measure and quantify vehicular emissions for incorporation into an urban emission inventory. The present study recorded a higher number of vehicles on highways than that from the national database of BNETD. Moreover, a classification of vehicles was carried out, in order to know each vehicle flow or volume type contribution by traffic road type. The presence of all vehicle types is observed over all classes of road. Also, highway, boulevard, and backstreet contribute to the high traffic flows for personal cars, whereas high flows of intra-communal sedan taxis are recorded on the main and secondary roads. Minimum and maximum of hourly traffic flows are 7 vehicles per hour at 10 to 11 a.m. and 8099 vehicles per hour at 9 to 10 a.m., respectively, on the backstreet and highway. Structures with two peaks (backstreet at 6–7 a.m. and 5–6 p.m., main road at 10–11 a.m. and 4–5 p.m., and boulevard at 11 a.m.–12 p.m. and 5–6 p.m.) or three peaks (highway: high at 9–10 a.m. and 5–6 p.m., and moderate at 1–2 p.m.; and secondary road: at 4–5 p.m. and 5–6 p.m., and moderate at 1–2 p.m.) are observed in the traffic flows of each road type and hour. The proportion of vehicles using diesel is underestimated, compared to the national fleet. This survey revealed that 100% of the intra-communal sedan taxis, inter-communal taxis, minibuses, and heavy vehicles use gasoil, while personal cars use gasoline at 26% and 74% gasoil. The highest daily fuel consumption value of 56 L day−1 is observed in heavy vehicles, while the lowest value of 15 L day−1 is recorded for personal cars using gasoline. In addition, the highest tp is recorded for public transport vehicles such as inter-communal taxis (19 h), while the lowest tp belongs to personal cars (3 h). This study may be useful for the improvement of uncertainties related to the different databases used to estimate emissions either in national or international reports. It may also be useful for decision makers to consider particularly the importation of aged vehicles, as well as vehicular emission reduction policy for Abidjan and in West African cites at large. Furthermore, the results of this study can improve air quality dispersion modeling of vehicle sources, and air quality monitoring and exposure.

Author Contributions

A.D. and M.D. conceived and designed the experiments and analyzed the data. M.D., N.E.T. and S.S. contributed to the analysis and the paper organization and writing. C.H. and V.Y. read and followed us in the work.

Funding

This study is partly funded by the Centre d’Excellence Africain sur le Changement Climatique, la Biodiversité et l’Agriculture Durable of University Felix Houphouêt Boigny (Abidjan, Côte d’Ivoire), by a complementary grant from Non-WASCAL-Sponsored West African Nationals, by Programme d’Appui Stratégique à la Recherche Scientifique (PASRES) and by Chaire Ecosanté Pollution de l’air santé (CHAIREPOL). The authors thank also IRD and the Institute of Geosciences for Environment (IGE, University Grenoble Alpes) for providing support via the grant number “UMR IGE Imputation 252RA5”.

Acknowledgments

This work is dedicated to the memory of Abdourahamane Konaré with whom we started this assessment. This research is based on field measurements and we would like to thank all the investigators for their endurance. This study is a contribution to the project PASMU (Atmospheric Pollution in Urban Areas and Impact on Health) funded by the Education and Research Ministry of Côte d’Ivoire, in the frame of the Debt Reduction-Development Contracts (C2Ds) managed by the Institute of Research for Development (IRD, France).

Conflicts of Interest

The authors declare no conflict of interests.

References

  1. The World Meteorological Organization (WMO). Impacts of Megacities on Air Pollution and Climate; WMO: Geneva, Switzerland, 2012. [Google Scholar]
  2. United Nations (UN). The World’s Cities in 2016, Data Booklet; Economic and Social Affairs: New York, NY, USA, 2016. [Google Scholar]
  3. Assamoi, E.-M.; Liousse, C. A new inventory for two-wheel vehicle emissions in West Africa for 2002. Atmos. Environ. 2010, 44, 3985–3996. [Google Scholar] [CrossRef]
  4. Liousse, C.; Galy-Lacaux, C. Pollution Urbaine en Afrique de l’Ouest; Société Météorologique de France: Paris, France, 2010. [Google Scholar]
  5. Doumbia, E.H.T.; Liousse, C.; Galy-Lacaux, C.; Ndiaye, S.A.; Diop, B.; Ouafo, M.; Assamoi, E.M.; Gardrat, E.; Castera, P.; Rosset, R.; et al. Real time black carbon measurements in West and Central Africa urban sites. Atmos. Environ. 2012, 54, 529–537. [Google Scholar] [CrossRef]
  6. Kumar, A.; Barrett, F. Stuck in Traffic: Urban Transport in Africa; AICD Background Paper; Africa Infrastructure Country Diagnostic, Final Report. 2008. Available online: http://siteresources.worldbank.org/EXTAFRSUBSAHTRA/Resources/Stuck-in-Traffic.pdf (accessed on 2 May 2018).
  7. Sieg, C.; Senegal, H.A. (Eds.) West Africa. Lonely Planet; Lonely Planet Publications Pty. Ltd.: Footscray, Australia; Oakland, CA, USA; London, UK, 2013. [Google Scholar]
  8. Shafik, N. Prospects for Middle Eastern and North African Economies; Springer: Berlin, Germany, 2016. [Google Scholar]
  9. Ndoke, P.N.; Akpan, U.G.; Kato, M.E. Contribution of Vehicular traffic to carbon dioxide emission in Kaduna and Abuja, Northern Nigeria. Leonardo Electron. J. Pract. Technol. 2006, 5, 81–90. [Google Scholar]
  10. Naidja, L.; Ali-Khodja, H.; Khardi, S. Particulate matter from road traffic in Africa. J. Earth Sci. Geotech. Eng. 2017, 7, 289–304. [Google Scholar]
  11. Liousse, C.; Assamoi, E.; Criqui, P.; Granier, C.; Rosset, R. Explosive growth in African combustion emissions from 2005 to 2030. Environ. Res. Lett. 2014, 9, 35003. [Google Scholar] [CrossRef] [Green Version]
  12. Bond, T.C.; Doherty, S.J.; Fahey, D.W.; Forster, P.M.; Berntsen, T.; DeAngelo, B.J.; Flanner, M.G.; Ghan, S.; Kärcher, B.; Koch, D.; et al. Bounding the role of black carbon in the climate system: A scientific assessment. J. Geophys. Res. Atmos. 2013, 118, 5380–5552. [Google Scholar] [CrossRef] [Green Version]
  13. Brioude, J.; Angevine, W.M.; Ahmadov, R.; Kim, S.-W.; Evan, S.; McKeen, S.A.; Hsie, E.-Y.; Frost, G.J.; Neuman, J.A.; Pollack, I.B.; et al. Top-down estimate of surface flux in the Los Angeles Basin using a mesoscale inverse modeling technique: Assessing anthropogenic emissions of CO, NOx and CO2 and their impacts. Atmos. Chem. Phys. 2013, 13, 3661–3677. [Google Scholar] [CrossRef]
  14. Zhao, Y.; Nielsen, C.P.; Lei, Y.; McElroy, M.B.; Hao, J. Quantifying the uncertainties of a bottom-up emission inventory of anthropogenic atmospheric pollutants in China. Atmos. Chem. Phys. 2011, 11, 2295–2308. [Google Scholar] [CrossRef] [Green Version]
  15. Iodice, P.; Senatore, A. Atmospheric pollution from point and diffuse sources in a National Interest Priority Site located in Italy. Energy Environ. 2016, 27, 586–596. [Google Scholar] [CrossRef]
  16. Abagnale, C.; Cardone, M.; Iodice, P.; Strano, S.; Terzo, M.; Vorraro, G. Power requirements and environmental impact of a pedelec. A case study based on real-life applications. Environ. Impact Assess. Rev. 2015, 53, 1–7. [Google Scholar] [CrossRef]
  17. Bellasio, R.; Bianconi, R.; Corda, G.; Cucca, P. Emission inventory for the road transport sector in Sardinia (Italy). Atmos. Environ. 2007, 41, 677–691. [Google Scholar] [CrossRef]
  18. Mellios, G.; Vanaalst, R.; Samaras, Z. Validation of road traffic urban emission inventories by means of concentration data measured at air quality monitoring stations in Europe. Atmos. Environ. 2006, 40, 7362–7377. [Google Scholar] [CrossRef]
  19. Ponche, J.-L.; Vinuesa, J.-F. Emission scenarios for air quality management and applications at local and regional scales including the effects of the future European emission regulation (2015) for the upper Rhine valley. Atmos. Chem. Phys. 2005, 5, 999–1014. [Google Scholar] [CrossRef] [Green Version]
  20. Jing, B.; Wu, L.; Mao, H.; Gong, S.; He, J.; Zou, C.; Song, G.; Li, X.; Wu, Z. Development of a vehicle emission inventory with high temporal–spatial resolution based on NRT traffic data and its impact on air pollution in Beijing—Part 1: Development and evaluation of vehicle emission inventory. Atmos. Chem. Phys. 2016, 16, 3161–3170. [Google Scholar] [CrossRef]
  21. Zhou, Y.; Zhao, Y.; Mao, P.; Zhang, Q.; Zhang, J.; Qiu, L.; Yang, Y. Development of a high-resolution emission inventory and its evaluation and application through air quality modeling for Jiangsu Province, China. Atmos. Chem. Phys. 2017, 17, 211–233. [Google Scholar] [CrossRef]
  22. Bond, T.C. A technology-based global inventory of black and organic carbon emissions from combustion. J. Geophys. Res. 2004, 109. [Google Scholar] [CrossRef] [Green Version]
  23. Junker, C.; Liousse, C. A global emission inventory of carbonaceous aerosol from historic records of fossil fuel and biofuel consumption for the period 1860–1997. Atmos. Chem. Phys. 2008, 8, 1195–1207. [Google Scholar] [CrossRef] [Green Version]
  24. Kouadio, A.J.-F. Memoire Online > Arts, Philosophie et Sociologie > Sociologie Culture, économie et Société: Approche Socio-Anthropologique du Rapport à l’argent chez les Ivoiriens (cas de la Population de YAHSEI dans la Commune de Yopougon), Abidjan, Côte d’Ivoire. 2005. Available online: https://www.memoireonline.com/10/07/657/m_rapport-a-l-argent-chez-les-ivoiriens-yahsei-yopougon0.html (accessed on 24 November 2017).
  25. Olahan, A. Urbanisation et Dynamique des Transports Collectifs Urbains: Cas des wôrô-wôrô et Gbakas dans la Commune de Yopougon; Abidjan, Côte d’Ivoire. 2007. Available online: http://www.revue-geotrope.com/update/root_revue/20061229/6-URBANISATON-OK.pdf (accessed on 24 November 2017).
  26. BNETD; d’Ivoire, C.A.C. Rapport Provisoire Revision 01; Rapport Provisoire D’EIES–Décembre 2013-BNETD–DEAH/SEE: Abidjan, Côte d’Ivoire, 2015. [Google Scholar]
  27. Traoré, Y.; Diaby, B.; Coulibaly, D.; Ekra, K.D.; Zengbe-Acray, P. Apport de l’échographie dans la surveillance de la grossesse dans un établissement sanitaire de premier contact à Yopougon en Côte d’Ivoire. Santé Publique 2013, 25, 95–100. [Google Scholar]
  28. National de l’Institut National de la Statistique Côte d’Ivoire. RGPH-2014 Résultats Globaux; Secrétariat Technique Permanent du Comité Technique du RGPH, Institut National de la Statistique: Abidjan, Côte d’Ivoire, 2014. [Google Scholar]
  29. Dongo, K.R.; Niamke, B.F.; Adje, A.F.; Britton, B.G.H.; Nama, L.A.; Anoh, K.P.; Adima, A.A.; Atta, K. Impacts des effluents liquides industriels sur l’environnement urbain d’Abidjan-Côte D’Ivoire. Int. J. Biol. Chem. Sci. 2013, 7, 404–420. [Google Scholar] [CrossRef]
  30. United National International Children’s Emergency Fund (UNICEF). Enfants en Circonstances Extrêmement Difficiles. Intervention en Milieu Urbain Pauvre; Rapport d’étude: Abidjan, Côte d’Ivoire, 2001; p. 18. [Google Scholar]
  31. Pochet, P.; Olvera, L.D.; Plat, D.; Adolehoume, A. L’usage Privé et Public des motos dans les villes d’Afrique Sub-Saharienne; UITP, Ed.; Public Transport Trends 2017: Bruxelles, Belgique, 2016; pp. 103–105. [Google Scholar]
  32. Olvera, L.D.; Plat, D.; Pochet, P.; Maïdadi, S. Motorbike Taxis in the Transport Crisis of West and Central African Cities; EchoGéo, Pôle de Recherche pour L’organisation et la Diffusion de l’information Géographique (CNRS UMR 8586): Paris, France, 2012. [Google Scholar]
  33. Abiodun, B.J.; Adegoke, J.; Abatan, A.A.; Ibe, C.A.; Egbebiyi, T.S.; Engelbrecht, F.; Pinto, I. Potential impacts of climate change on extreme precipitation over four African coastal cities. Clim. Chang. 2017, 143, 399–413. [Google Scholar] [CrossRef]
  34. Tabutin, D.; Schoumaker, B. La démographie de l’Afrique au sud du Sahara des années 1950 aux années 2000. Population 2004, 59, 521–622. [Google Scholar] [CrossRef]
  35. Attahi, K. Problematique de L’urbanisation et les Defis de la Gestion Municipale en Afrique Occidentale et Centrale; BNETD: Abidjan, Côte d’Ivoire, 2001. [Google Scholar]
  36. Societé Ivoirienne de Contrôle Automobile (SICTA). Évolution de L’Activité de Contrôle Technique Automobile; Communication: Abidjan, Côte d’Ivoire, 2016. [Google Scholar]
  37. Societé Ivoirienne de Contrôle Automobile (SICTA). Rapport de L’enquête sur le taux de Couverture de la Visite Technique; Société Ivoirienne de Contrôles Techniques Automobiles et Industriels: Abidjan, Côte d’Ivoire, 1999. [Google Scholar]
  38. Désiré, E.A. Le Transport Urbain à Abidjan Face aux défis du Développement Durable; EDUCI: Yamoussokro, Côte d’Ivoire, 2012. [Google Scholar]
  39. Direction du Guichet Unique Automobile (DGUA). Atelier Sous Régional de Partage des Résultats des Stratégies Politiques D’économie de Carburant: Communication sur L’évolution du parc Automobile de la Côte d’Ivoire de 2005 à 2016; Abidjan, Côte d’Ivoire. 2017. Available online: https://wedocs.unep.org/bitstream/handle/20.500.11822/21405/Evolution%20du%20parc%20Automobile%20de%20la%20Cote%20d%20Ivoire%20de%202005%20a%202016%2C%20M.%20Nagnonta%20kone%2C%20Direction%20du%20Guichet%20Unique%20Automobile.pdf?sequence=1&isAllowed=y (accessed on 24 November 2017).
  40. Samba Wade, C.; Tremblay, R.; Mamadou Ndiaye, E.H. Etude de la Complexité de la Gestion des Espaces Publics à Vocation de Transport à Dakar (Sénégal); Études Caribéennes: Dakar, Sénégal, 2010. [Google Scholar]
  41. International Energy Agency (IEA). Available online: http://www.iea.org/statistics/statisticssearch/report/?year=2015&country=COTEIVOIRE&product=Oil (accessed on 17 January 2018).
  42. Ernest, A. Traffic congestion: The Bane of a Bus Rapid Transit System in Accra, Ghana? Master’s Thesis, Norges Teknisk-Naturvitenskapelige Universitet, Trondheim, Norway, 2009. [Google Scholar]
  43. Saghir, J. Sustainable Infrastructure Development in Sub Saharan Africa: A View from the Ground; Institute for the Study of International Development (ISID): Quebec, QC, Canada, 2017. [Google Scholar]
  44. Dagnelie, P. Statistiques Théoriques et Appliquées, 2nd ed.; De Boeck et Larcier: Bruxelles, Belgique, 1998; p. 659. [Google Scholar]
  45. Kan, Z.; Tang, L.; Kwan, M.-P.; Zhang, X. Estimating Vehicle Fuel Consumption and Emissions Using GPS Big Data. Int. J. Environ. Res. Public. Health 2018, 15, 566. [Google Scholar] [CrossRef] [PubMed]
  46. Borrego, C.; Amorim, J.H.; Tchepel, O.; Dias, D.; Rafael, S.; Sá, E.; Pimentel, C.; Fontes, T.; Fernandes, P.; Pereira, S.R.; et al. Urban scale air quality modelling using detailed traffic emissions estimates. Atmos. Environ. 2016, 131, 341–351. [Google Scholar] [CrossRef]
  47. Weijermars, W.A.M.; van Berkum, E.C. Daily flow profiles of urban traffic. WIT Trans. Built Environ. 2004, 75, 10. [Google Scholar]
  48. Coric, V.; Gruteser, M. Crowdsensing maps of on-street parking spaces. In Proceedings of the 2013 IEEE International Conference on Distributed Computing in Sensor Systems (DCOSS), Cambridge, MA, USA, 20–23 May 2013; pp. 115–122. [Google Scholar]
  49. Chinrungrueng, J.; Sunantachaikul, U.; Triamlumlerd, S. Smart parking: An application of optical wireless sensor network. In Proceedings of the 2007 International Symposium on Applications and the Internet Workshops, Hiroshima, Japan, 15–19 January 2007; p. 66. [Google Scholar]
  50. Höglund, P.G. Parking, energy consumption and air pollution. Sci. Total Environ. 2004, 334, 39–45. [Google Scholar] [CrossRef] [PubMed]
  51. Baldauf, R.; Thoma, E.; Hays, M.; Shores, R.; Kinsey, J.; Gullett, B.; Kimbrough, S.; Isakov, V.; Long, T.; Snow, R.; et al. Traffic and Meteorological Impacts on Near-Road Air Quality: Summary of Methods and Trends from the Raleigh Near-Road Study. J. Air Waste Manag. Assoc. 2008, 58, 865–878. [Google Scholar] [CrossRef] [PubMed]
  52. Kwak, K.-H.; Woo, S.; Kim, K.; Lee, S.-B.; Bae, G.-N.; Ma, Y.-I.; Sunwoo, Y.; Baik, J.-J. On-Road Air Quality Associated with Traffic Composition and Street-Canyon Ventilation: Mobile Monitoring and CFD Modeling. Atmosphere 2018, 9, 92. [Google Scholar] [CrossRef]
  53. Doumbia, E.H.T. Caractérisation Physico-Chimique de la Pollution Atmosphérique en Afrique de l’Ouest et étude D’impact sur la Santé; Université de Toulouse, Université Toulouse III-Paul Sabatier: Toulouse, France, 2012. [Google Scholar]
  54. Kablan, N. L’invasion des véhicules d’occasion en transit par le port d’Abidjan: Le dynamisme ambivalent d’une activité en plein essor. Cah. D’Outre-Mer Rev. Géographie Bordx. 2010, 63, 365–390. [Google Scholar] [CrossRef]
  55. Val, S.; Liousse, C.; Doumbia, E.H.T.; Galy-Lacaux, C.; Cachier, H.; Marchand, N.; Badel, A.; Gardrat, E.; Sylvestre, A.; Baeza-Squiban, A. Physico-chemical characterization of African urban aerosols (Bamako in Mali and Dakar in Senegal) and their toxic effects in human bronchial epithelial cells: Description of a worrying situation. Part. Fibre Toxicol. 2013, 10, 10. [Google Scholar] [CrossRef] [PubMed] [Green Version]
  56. Oguntoke, O.; Yussuf, A.S. Air pollution arising from Vehicular Emissions and the Associated Human Health Problems in Abeokuta Metropolis, Nigeria. ASSET Int. J. Ser. A 2008, 8, 119–132. [Google Scholar]
  57. Ekpenyong, C.E.; Ettebong, E.O.; Akpan, E.E.; Samson, T.K.; Daniel, N.E. Urban city transportation mode and respiratory health effect of air pollution: A cross-sectional study among transit and non-transit workers in Nigeria. BMJ Open 2012, 2, e001253. [Google Scholar] [CrossRef] [PubMed]
  58. Matcheubou, A.; Yamba, J.; Tatietse, T.T. Impact du parc automobile sur la congestion du trafic et la pollution de l’air dans la ville de Yaoundé. In Ghardaïa. In Proceedings of the Colloque International Environnement et Transports Dans des Contextes Différents, Algeria, Côte d’Ivoire, 16–18 February 2009; pp. 245–252. [Google Scholar]
  59. Roussel, I.; Charles, L. Les Carburants: Essence, Gasoil, Ethanol? Carburants, Transports, Santé en France: Quelle Cohérence? 2013, pp. 2268–3798. Available online: http://lodel.irevues.inist.fr/pollution-atmospherique/index.php?id=783 (accessed on 16 February 2018).
  60. Gagnon, M.-O. Les déterminants de L’évolution du Prix du Carburant Diesel: Au Canada, en Amérique du Nord et en Europe; Rapport D’étude, Chaire de Gestion du Secteur de L’énergie: Montréal, QC, Canada, 2015. [Google Scholar]
  61. Ollivier-Trigalo, M. Composante Carbone, Rapprochement Diesel-Essence, Réforme de la TICPE: Transition Energétique ou Fiscale? Ph.D. Thesis, Université Paris-Est, Champs-sur-Marne, France, 2017. [Google Scholar]
  62. Fontan, M.J. Pollution de l’air: Moteurs Diesel et Cheminés Ouvertes en Accusation; Communication: Toulouse, France, 2015. [Google Scholar]
  63. Hausberger, S.; Rodler, J.; Sturm, P.; Rexeis, M. Emission factors for heavy-duty vehicles and validation by tunnel measurements. Atmos. Environ. 2003, 37, 5237–5245. [Google Scholar] [CrossRef]
  64. Tolouei, R.; Titheridge, H. Vehicle mass as a determinant of fuel consumption and secondary safety performance. Transp. Res. Part Transp. Environ. 2009, 14, 385–399. [Google Scholar] [CrossRef]
  65. Huo, H.; Zhang, Q.; He, K.; Yao, Z.; Wang, X.; Zheng, B.; Streets, D.G.; Wang, Q.; Ding, Y. Modeling vehicle emissions in different types of Chinese cities: Importance of vehicle fleet and local features. Environ. Pollut. 2011, 159, 2954–2960. [Google Scholar] [CrossRef] [PubMed]
  66. Lammert, M.P.; Duran, A.; Diez, J.; Burton, K.; Nicholson, A. Effect of platooning on fuel consumption of class 8 vehicles over a range of speeds, following distances, and mass. SAE Int. J. Commer. Veh. 2014, 7, 626–639. [Google Scholar] [CrossRef]
  67. Iodice, P.; Cardone, M.; Senatore, A.; Migliaccio, M. Emission Inventory for the Road Transport Sector in the Urban Area of Naples: Methodology and Results. In Highway and Urban Environment; Rauch, S., Morrison, G.M., Monzón, A., Eds.; Springer: Dordrecht, The Netherlands, 2009; Volume 17, pp. 387–395. ISBN 978-90-481-3042-9. [Google Scholar]
  68. Iodice, P.; Senatore, A.; Meccariello, G.; Prati, M.V. Methodology for the analysis of a 4-stroke moped emission behaviour. SAE Int. J. Engines 2009, 2, 617–626. [Google Scholar] [CrossRef]
  69. Shridhar Bokare, P.; Kumar Maurya, A. Study of effect of speed; acceleration and deceleration of small petrol car on its tail pipe emission. Int. J. Traffic Transp. Eng. 2013, 3, 465–478. [Google Scholar] [CrossRef]
  70. Rakha, H.; Ding, Y. Impact of stops on vehicle fuel consumption and emissions. J. Transp. Eng. 2003, 129, 23–32. [Google Scholar] [CrossRef]
  71. Naré, H.; Kamagaté, F.H. Developing a Roadmap for the Adoption of Clean Fuel and Vehicle Standards in Southern and Western Africa; Communication, International Council on Clean Transportation: Washington, DC, USA, 2017. [Google Scholar]
Figure 1. Map of the study area (Yopougon in red) showing the 23 administrative districts or sub-areas. Yopougon is one of the 10 communes of the city of Abidjan. Yopougon, a coastal municipality, is the largest and most extensive of the 10 communes.
Energies 11 02300 g001
Figure 2. (a) Population growth in Yopougon; (b) Population growth in Abidjan and (c) Evolution of vehicle fleet in Abidjan [36,37,38] (Désiré, 2012; SICTA, 2008, 2016). Missing data (Not available (NA)) between 2008 and 2014.
Energies 11 02300 g002
Figure 3. (a) Different road types of road network in Yopougon. Red line represents the highway, blue line is for backstreet, pink line is the main road, green and orange are the secondary road and boulevard, respectively. Number of road segments of each road type are in brackets; (b) Location of counting point of vehicle fleet composition over several road type in Yopougon.
Energies 11 02300 g003
Figure 4. Traffic flow rates on various road types in Yopougon. Red line represents the highway, blue line is for backstreet, orange, pink, and green lines are the boulevard, main road, and secondary road.
Energies 11 02300 g004
Figure 5. Average total traffic flow per highway and boulevard (a); main road and secondary road (b).
Energies 11 02300 g005
Figure 6. Traffic flow of each vehicle class per type of road. Highway (a), and boulevard, main road, and secondary road (b). From top to bottom, respectively, personal car, intercommunal sedan taxi, intercommunal taxi, minibus, and heavy vehicle.
Energies 11 02300 g006
Table 1. Comparison study with Bureau National d’Etudes Techniques et de Développement (BNETD) data collected in August 2014 over a highway in Yopougon.
DateCounting TimePersonal CarIntra-Communal Sedan Taxi “Wôro Wôro”Inter-Communal TaxiMinibus “Gbaka”Heavy Vehicle (Car, Bus and Truck)Total
February 201606–18 h40,86393720,9798363721878,360
August 201406–20 h28,539014,6319281770760,158
Table 2. Characterization of traffic flow total per class of road and type of vehicle (in bold is the contribution of vehicle type for each road class).
Road TypeTotalPersonal CarIntra-Communal Sedan Taxi “Wôro wôro”Inter-Communal TaxiMinibus “Gbaka”Heavy Vehicle (Car, Bus and Truck)
Highway78,36040,86393720,97983637218
Boulevard196,21059,96058,36334,57131,97511,341
Main road91,32923,19228,18620,00914,9075035
Secondary road39,276846419,060578249591011
Backstreet700370502452510
Table 3. Repartition of the vehicle fleet and percentage by motorization type and age.
Vehicle TypeEnginesAge (%)
0–10 YearsMore Than 10 Years
Personal car74% Diesel and 26% Gasoline3862
Intra-communal sedan taxi100% Diesel3367
Inter-communal Taxi100% Diesel2972
Minibus100% Diesel4159
Heavy vehicle100% Diesel3565
Table 4. Daily fuel consumption (Cday) and traveling time (tp) for vehicle type, MIN and MAX represent the minimum and maximum of (Cday) and (tp) respectively.
Vehicle TypePersonal CarIntra-Communal Sedan TaxiInter-Communal TaxiMinibusHeavy Car
G: Gasoline; D: Diesel(74%D)(26%G)(100%D)(100%D)(100%D)(100%D)
Number of questionnaires sampled14249752414537
Daily fuel consumption for a given vehicles251527434756
Cday (MIN)222335305
Cday (MAX)7053356262100
Daily average traveling time (hour) (tp)3316191616
tp (MIN)111413126
tp (MAX)4421221924

