Investigating West African Monsoon Features in Warm Years Using the Regional Climate Model RegCM4


1
Laboratoire d’Océanographie, des Sciences de l’Environnement et du Climat (LOSEC), UFR Sciences et Technologies, Université Assane SECK de Ziguinchor, Ziguinchor 270000, Senegal
2
Université Grenoble Alpes, IRD, CNRS, Grenoble INP, IGE, F-38000 Grenoble, France
3
UFHB-IRD Joint International Laboratory of Research on NEXUS Climate, Water, Energy and Agriculture and Development of Climate Services, African Centre of Excellence CCBAD (Climate Change, Biodiversity and Sustainable Agriculture); Université Félix Houphouet Boigny, 22 BP 582 Abidjan 22, Cote D'Ivoire
*
Author to whom correspondence should be addressed.
Atmosphere 2019, 10(1), 23; https://doi.org/10.3390/atmos10010023
Submission received: 12 November 2018
/
Revised: 27 December 2018
/
Accepted: 2 January 2019
/
Published: 10 January 2019
(This article belongs to the Special Issue Monsoons)
Abstract
:This study investigates the changes in West African monsoon features during warm years using the Regional Climate Model version 4.5 (RegCM4.5). The analysis uses 30 years of datasets of rainfall, surface temperature and wind parameters (from 1980 to 2009). We performed a simulation at a spatial resolution of 50 km with the RegCM4.5 model driven by ERA-Interim reanalysis. The rainfall amount is weaker over the Sahel (western and central) and the Guinea region for the warmest years compared to the coldest ones. The analysis of heat fluxes show that the sensible (latent) heat flux is stronger (weaker) during the warmest (coldest) years. When considering the rainfall events, there is a decrease of the number of rainy days over the Guinea Coast (in the South of Cote d’Ivoire, of Ghana and of Benin) and the western and eastern Sahel during warm years. The maximum length of consecutive wet days decreases over the western and eastern Sahel, while the consecutive dry days increase mainly over the Sahel band during the warm years. The percentage of very warm days and warm nights increase mainly over the Sahel domain and the Guinea region. The model also simulates an increase of the warm spell duration index in the whole Sahel domain and over the Guinea Coast in warm years. The analysis of the wind dynamic exhibits during warm years a weakening of the monsoon flow in the lower levels, a strengthening in the magnitude of the African Easterly Jet (AEJ) in the mid-troposphere and a slight increase of the Tropical Easterly Jet (TEJ) in the upper levels of the atmosphere during warm years.
1. Introduction
In the boreal summer, the West African climate is influenced by the monsoon system, which is organized around key elements such as the monsoon flow in the lower layers (a southwesterly wind), the African Easterly Jet (AEJ) in the middle layers (an east–west wind at 700 hPa), the Tropical Easterly Jet (TEJ) in the upper troposphere (an east–west wind at 200 hPa), and the Saharan heat low [1]. This monsoon system is an ensemble of complex scale interactions between land and ocean surface and atmospheric features. The beginning of the monsoon season over the region corresponds to the rapid northward movement of the InterTropical convergence zone (ITCZ) at the end of June [2]. The monsoon flow provides the low-level moisture necessary for the formation of cloud convection over land area. The African Easterly Jet is a thermal wind between the Sahara and the Gulf of Guinea [3]. According to [4], this Jet (AEJ) transports moisture over the Sahelian regions, structures and reinforces the convective systems that generate much of the rainfall in the Sahel. It is essential in the monsoon circulation. The instabilities around the AEJ create the African Easterly Waves (AEWs), which are associated with the variability of convective systems and thus with the variability of precipitation over West Africa [5,6,7]. The Tropical Easterly Jet (TEJ) is a zonal wind generally located around 5–10° N; it is fed on a large scale by the Indian monsoon via the upper branch of Walker’s cell (zonal transport of energy, from east to west), and reinforced over Africa by the upper branch of Hadley’s cell [8,9]. It results from the thermal gradient between the Indian Ocean and Southeast Asia [10]. This jet (TEJ) structures the high altitude divergence circulation. The presence of this jet favors also vertical shear over West Africa, and therefore the generation of convective systems. Furthermore, most of the rainfall over the West African region is provided by these convective systems [1]. The circulation of the West African monsoon is therefore very complex because it involves different elements interacting with each other. In the past, the Global Climate Models (GCMs) have been extensively used to simulate this complex West African monsoon system [11,12]. However, these GCMs often have problems in resolving fine scale features (vegetation variations, coastlines, complex topography), which are the main factors for the physical response of the climate [13,14,15,16,17] because of their coarse resolution. These models (GCMs) are generally supplemented by regional climate models (RCMs) known for their high spatial resolution [18,19,20]. These regional climate models (RCMs) allow a better representation of fine scale forcing and land surface heterogeneity (vegetation variations, coastlines, complex topography), which are important aspects governing the variability of the West African climate [1,17]. Numerous studies [1,9] show that these models (RCMs) reproduce well the dynamical features and their relation to precipitation and temperatures patterns over West Africa, despite some uncertainties related to model physics parameterization. After the 21st Conference of Parties, the Paris Agreement committed the countries to hold the global temperature increases to “well below 2 degrees” and to pursue efforts to limit warming to 1.5 °C above pre-industrial levels. However, the questions of how a warm year is in West Africa or what are the implications of a 1.5 °C global warming at regional scale remain unsolved in West Africa [21]. Understanding West African climate features in warm years is fundamental for the region to implement sustainable mitigation and adaptation measures to limit and combat adverse effects of climate change. This work is oriented in this perspective. It investigates the West African monsoon behavior in warm years using the regional climate model RegCM4.5. The overall question addressed is to know how the RegCM4.5 regional climate model can help us to improve our understanding of the West African Monsoon (WAM) dynamics during warm years. The paper is structured as follows. Section 2 describes the experimental design, methods and the climate indices used following the guidelines of the Expert Team on Climate Change Detection and Indices (ETCCDI) [22]. The results are presented in Section 3. The findings and conclusions are summarized in Section 4.
2. Model Description, Experimental Set Up and Data Used
2.1. Model Description and Experimental Set Up
The model description and the experimental setup are extensively described in [23]. Briefly, we used the default version of the International Center for Theoretical Physics (ICTP-Italy-Trieste) regional climate model RegCM4.5 as described in [24]. The RegCM4.5 is a hydrostatic, compressible, sigma-p vertical coordinate model, which includes various options of physics parameterizations. The radiative transfer calculations are carried out with the radiative transfer scheme of the Community Climate Model (CCM3) [25], as implemented by [18]. Land surface processes are simulated using the Biosphere Atmosphere Transfer Scheme 1E (BATS1E, [26]). The scheme of [27] is used to simulate fluxes from ocean surfaces. Holtslag et al. [28] model is used to parameterize the planetary boundary layer. Large scale precipitation processes have been solved using the subgrid explicit moisture scheme (SUBEX) of [29]. Convection schemes used are those of [30] with the closure of [31] for the main land and [32] for the ocean as in [23]. Horizontal and vertical resolutions are respectively 50 km and 18 vertical levels. The simulation domain (West Africa) as well as the considered subdomains (western Sahel, central Sahel and the Guinea region) and the topography are represented in Figure 1. The simulation domain mixes several climatic and ecological zones. Moreover, the three considered subdomains (western Sahel, central Sahel and the Guinea region) have different surface conditions (forest over Guinea region, arid and semiarid areas with short and tall grass savanna and trees over the western and central Sahel). These regions are characterized by different rainfall regimes when considering the annual cycle. The Guinea region is characterized by two rainy seasons, while the western and eastern Sahel are characterized by a single wet season [2].
The simulation domain was large enough to properly minimize inconsistencies between boundary conditions and the model. The model has been integrated from November 1979 to December 2009. The RegCM4 model has been extensively used for the simulations of the West African monsoon spatiotemporal variability [17,33,34,35].
2.2. Data and Methods
To initialize and drive the model, we used several datasets. The prescribed global sea-ice and sea surface temperature (GISST) are from the Hadley Center for Climate Prediction and Research Optimum Interpolation weekly 1° × 1° grid dataset [36], while the atmospheric initial and boundary conditions (air temperature, relative humidity, geopotential height and horizontal wind component) are from the European Center for Medium range Weather Forecast (ECMWF) reanalysis ERA-Interim, available at the spatial resolution of 1.5° × 1.5° [37,38] over 32 pressure levels. These meteorological reanalysis are used to describe the state of the atmosphere in areas such as West Africa where in situ observations are insufficient. The ERA-Interim reanalysis have been used previously for various studies [39,40,41]. Numerous studies show a good ability of these reanalysis products to reproduce the main components of the West African monsoon system [42,43].
The Global Precipitation Climatology Project (GPCP, [44]) observation data, with a spatial resolution of 2.5° × 2.5°, were used to assess the performance of the regional climate model RegCM4.5 experiment in simulating the summer precipitation. These datasets are a combination of in situ measurements and satellite estimates.
We used three (3) hydroclimatic indices and three (3) thermal indices recommended by the World Meteorological Organization (WMO) Expert Team on Climate Change Detection and Indices [22] summarized in Table 1. The method of [45] is used to calculate the rainfall and temperature normalized anomalies over the West African domain (20° W–20° E; 5° N–17.5° N). This latter method is presented in details in [23].
3. Results
We first validated the simulation of the standard version of the RegCM4 model before investigating the West African monsoon behavior in warm years. For this step, the summer rainfall and the mean surface temperature simulated by the model are respectively compared with the GPCP observation data and the ERA-Interim reanalysis.
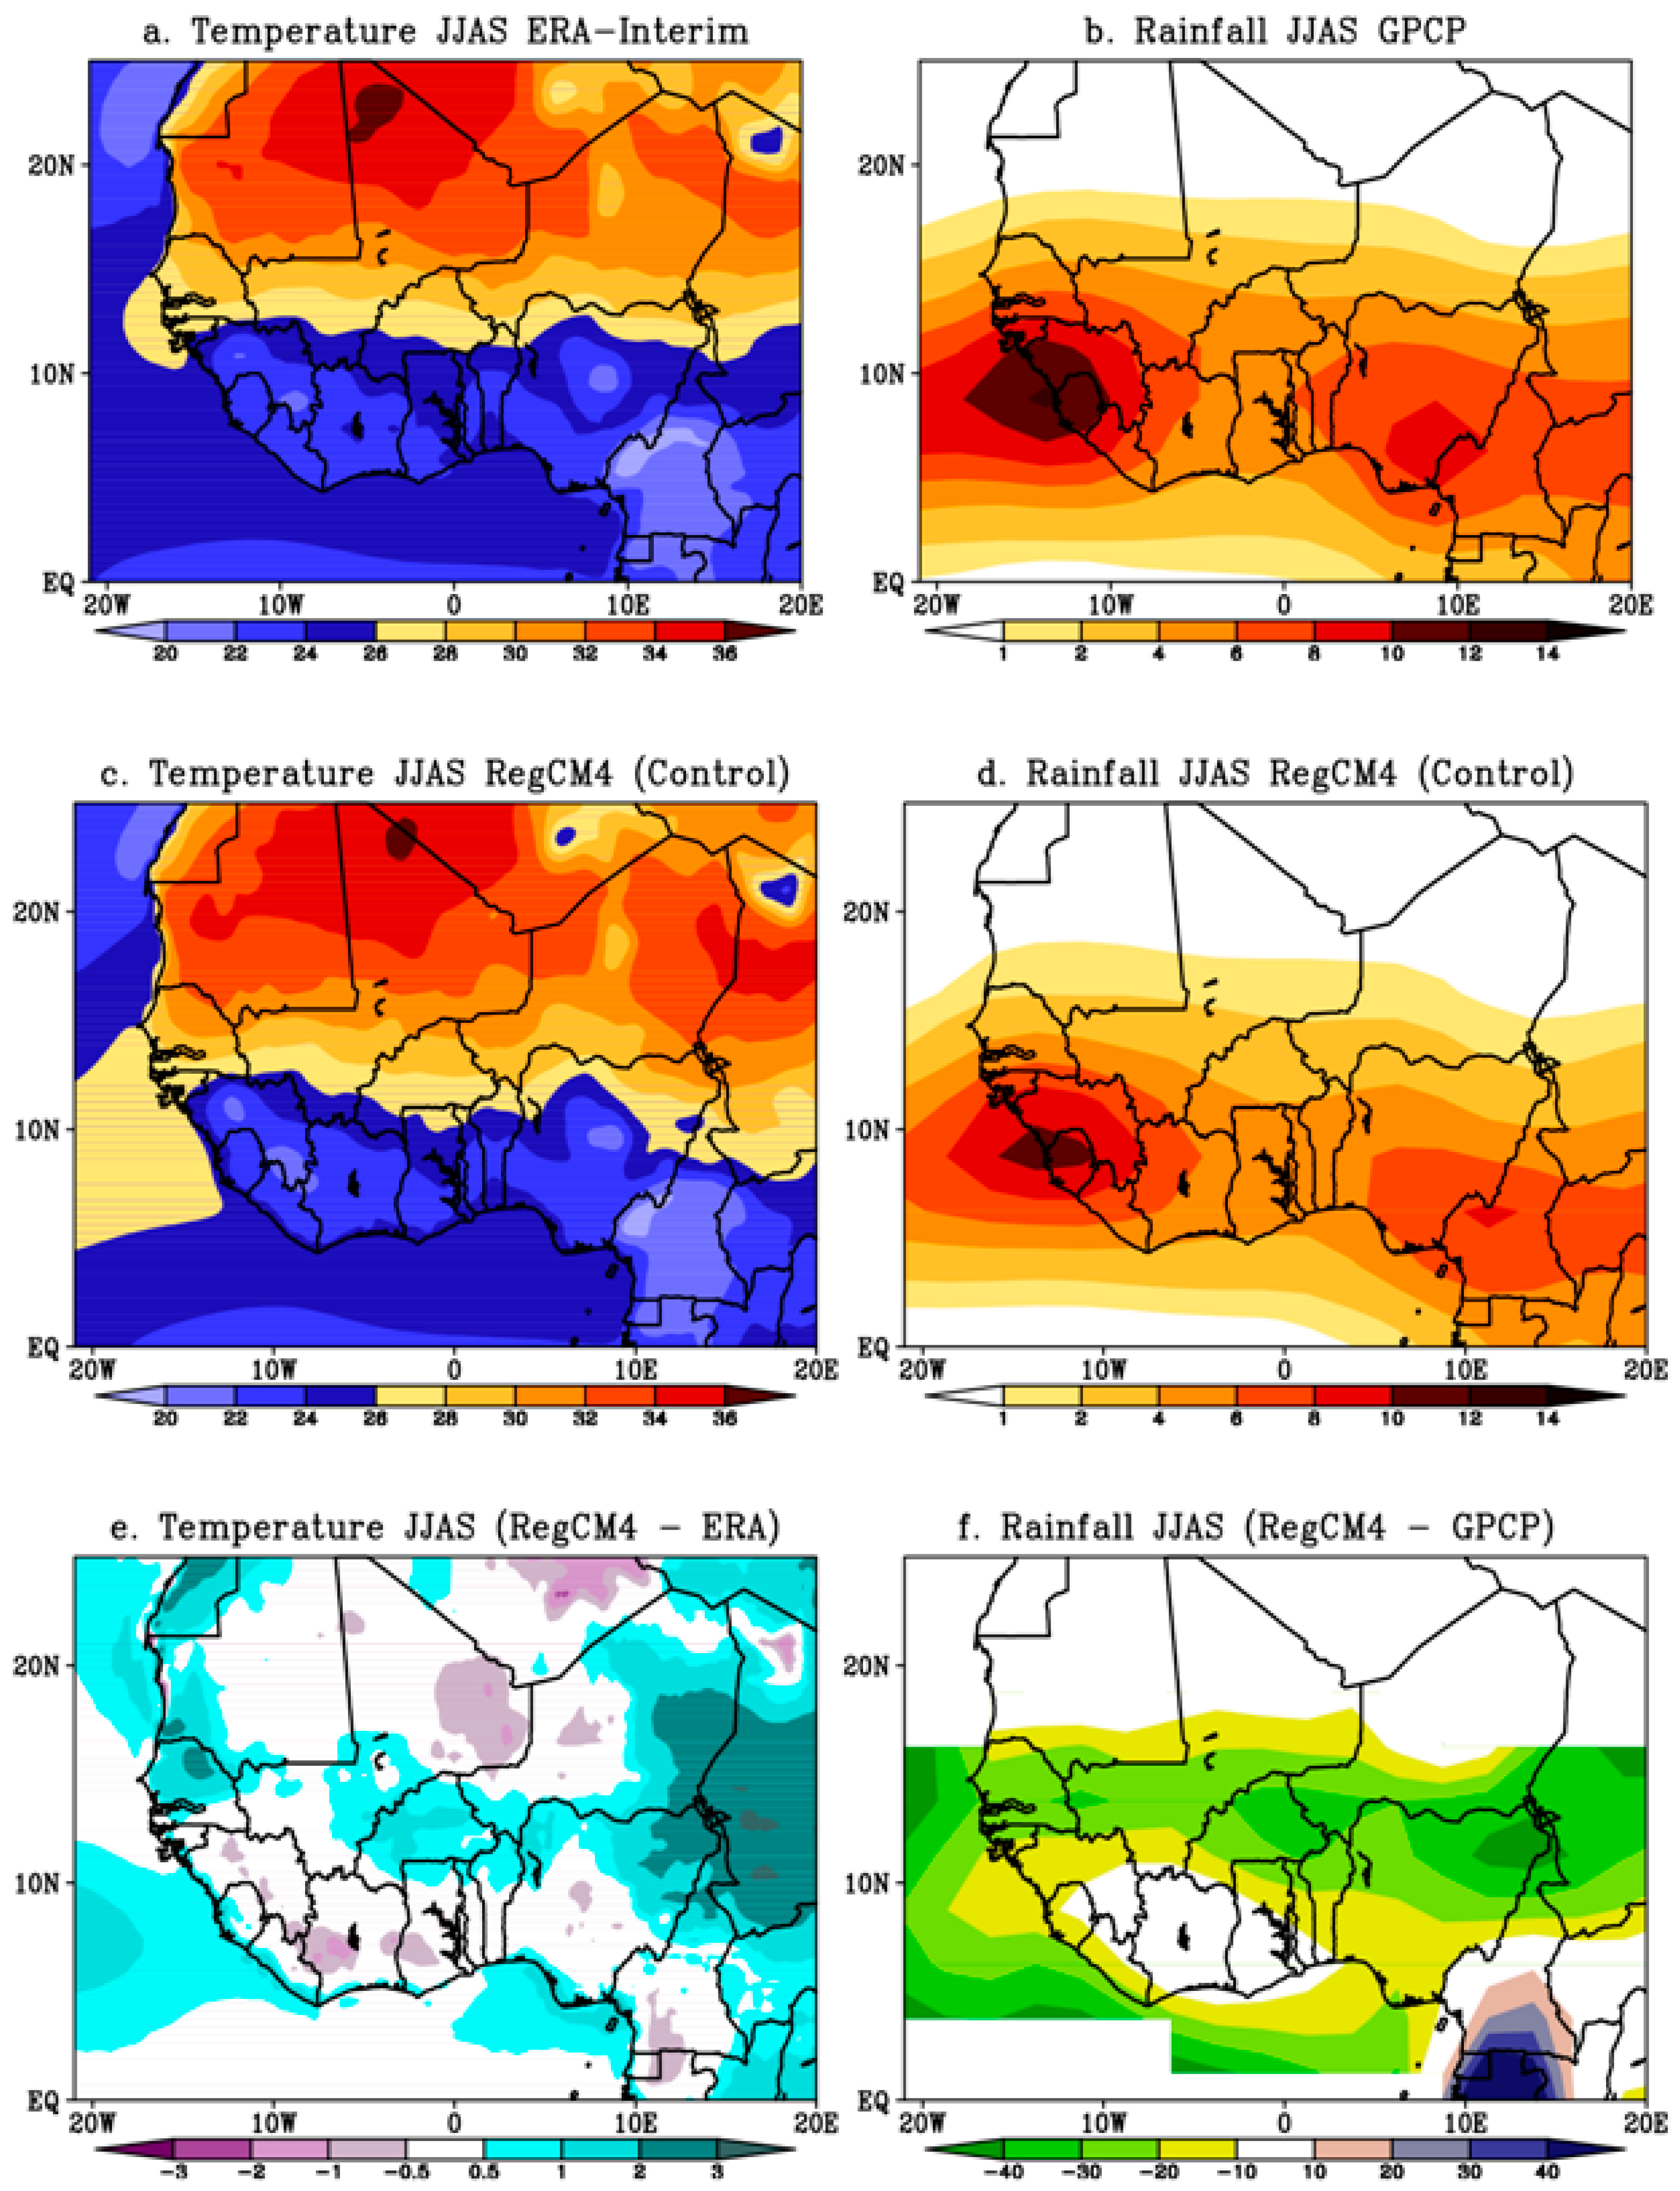
Figure 2 shows the mean surface temperature from June to September averaged over the period 1980–2009 for the ERA-Interim reanalysis and the standard version of RegCM4 model and their difference (left) and the mean summer rainfall from June to September averaged over the period 1980–2009 for the GPCP observation and the standard version of RegCM4 model and their difference (right). The ERA-Interim reanalysis exhibit a zonal distribution of the surface temperature (Figure 2a) with the coldest temperatures (below 22°C) located over the orographic regions (Guinean Highlands (10° N, 13° W), Jos plateau (10° N, 7.5° E) and Cameroon Mountains (6° N, 12° E) and the highest values found over the western part of the Sahara desert (above 34 °C). The RegCM4 model simulates well the minima over the Guinean Highlands (10° N, 13° W), Jos plateau (10° N, 7.5° E) and Cameroon Mountains (6° N, 12° E))(Figure 2c). The cold biases are simulated over the Guinean coast and the central Sahel and the northern part of the Sahara desert. However the warmest bias is simulated over the western and eastern Sahel (about 2.5 °C) (Figure 2e).
The low temperature biases simulated by the RegCM4 model show its ability to fully represent the West African summer surface temperature.
The GPCP climatology exhibits a North–South gradient rainfall distribution. Additionally, rainfall maxima are located in orographic regions: Fouta Jallon Mountains, Jos Plateau, and Cameroon Highlands and minima are observed in the northern Sahel and over the Sahara desert (Figure 2b). The RegCM4 model simulates well the summer rainfall spatial distribution especially the maxima and minima positions (Figure 2d). The difference between the model and the GPCP observation is generally weak over West Africa especially in the Western Sahel and the Guinea region (Figure 2f). These low rainfall and surface temperature biases show the good ability of the RegCM4 model to simulate realistically the West African climate during the summer period.
The next step is to investigate changes in the West African monsoon features in warm years over West Africa.
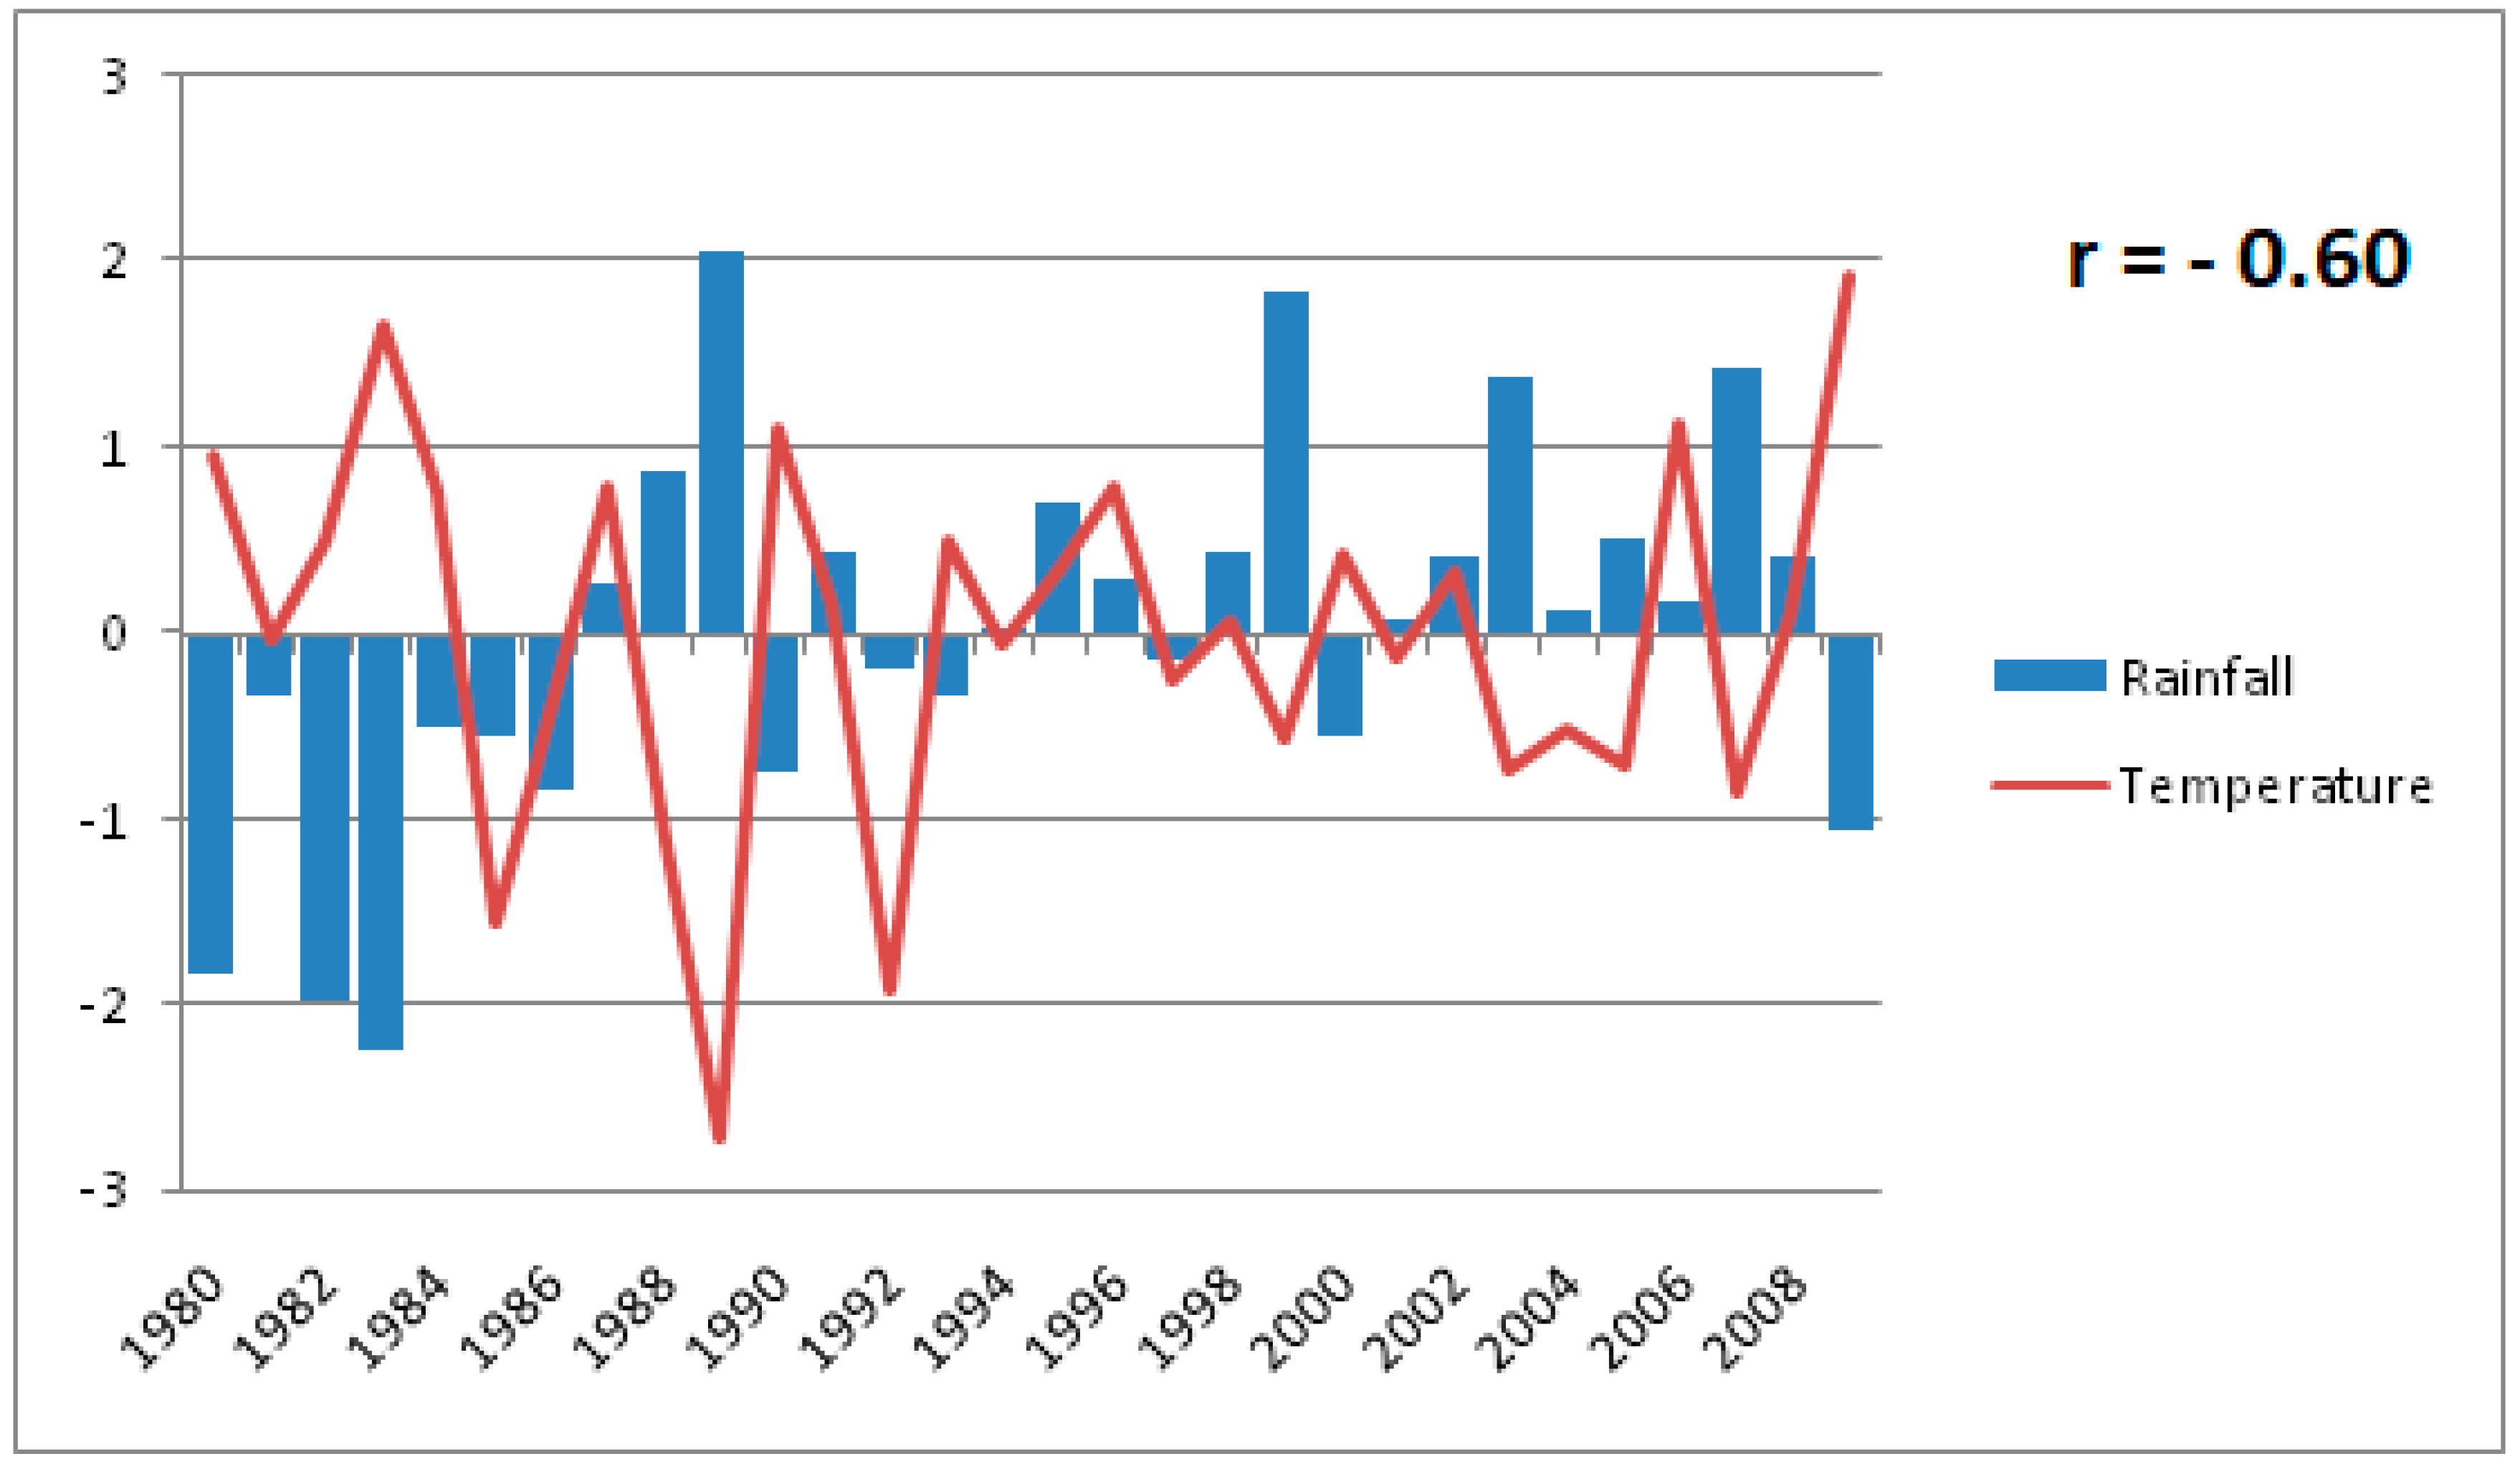
Figure 3 shows the temporal evolution of the standardized anomalies of summer surface temperature and rainfall averaged between June and September (JJAS) over West Africa (20° W–20° E; 5° N–17.5° N) from the RegCM4 model. The anomalies are relative to the reference period 1980–2009 (summer mean of the 1980–2009 period). Regarding the surface temperature anomalies, the model exhibits two phases: a hot period from 1980 to 1987 followed by an alternation between hot years and cold years from 1988 to 2009. For the purpose of this study, we chose the nine warmest years (1980; 1982; 1983; 1984; 1987; 1990; 1996; 2006 and 2009) and the nine coldest years (1985; 1988; 1989; 1992; 1999; 2003; 2004; 2005 and 2007) over West Africa as diagnosed in Figure 3. A Warm/Cold year refers to a year with temperatures anomalies above/below 0.5° Cover West Africa (Figure 3). When considering the rainfall anomalies, a persistence of dry years is noted from 1980 to 1986 followed by a wet period from 1988 to 1989 and then, there is an alternation between very wet years and very dry years in the region from 1990 to 2000 followed by a second wet period from 2001 to 2008. This confirms previous results of [46,47,48]. These authors showed that the period after 1993 seems to be a turning point for the Sahel with the succession of very wet years and very dry years. Moreover, [46] noted that while there is a tendency of persisting drought in the western Sahel, the eastern Sahel is experiencing a gradual return to wetter conditions. Furthermore, [49] showed that over West Africa, the rainfall deficits are associated partly with a decrease of the number of rainy events during the core of the rainy season. Rainfall over West Africa is also strongly linked to patterns of land and ocean surface temperature [50,51,52].
There is a strong negative correlation (r = −0.60) between rainfall and temperature anomalies time series (Figure 3). This implicates that rainfall and surface temperature are in opposite phase: years with stronger surface temperature correspond generally to dry years with less precipitation; while years with lower surface temperature anomalies are associated with wet years.
The intraseasonal variability of rainfall over West Africa is mainly due to the south–north movement of the intertropical convergence zone (ITCZ). The rainy season over West Africa has three distinct phases: the pre-onset (installation phase), the onset (period of heavy rain over the Sahel region) and the withdrawal to the south of the rain band [53,54].
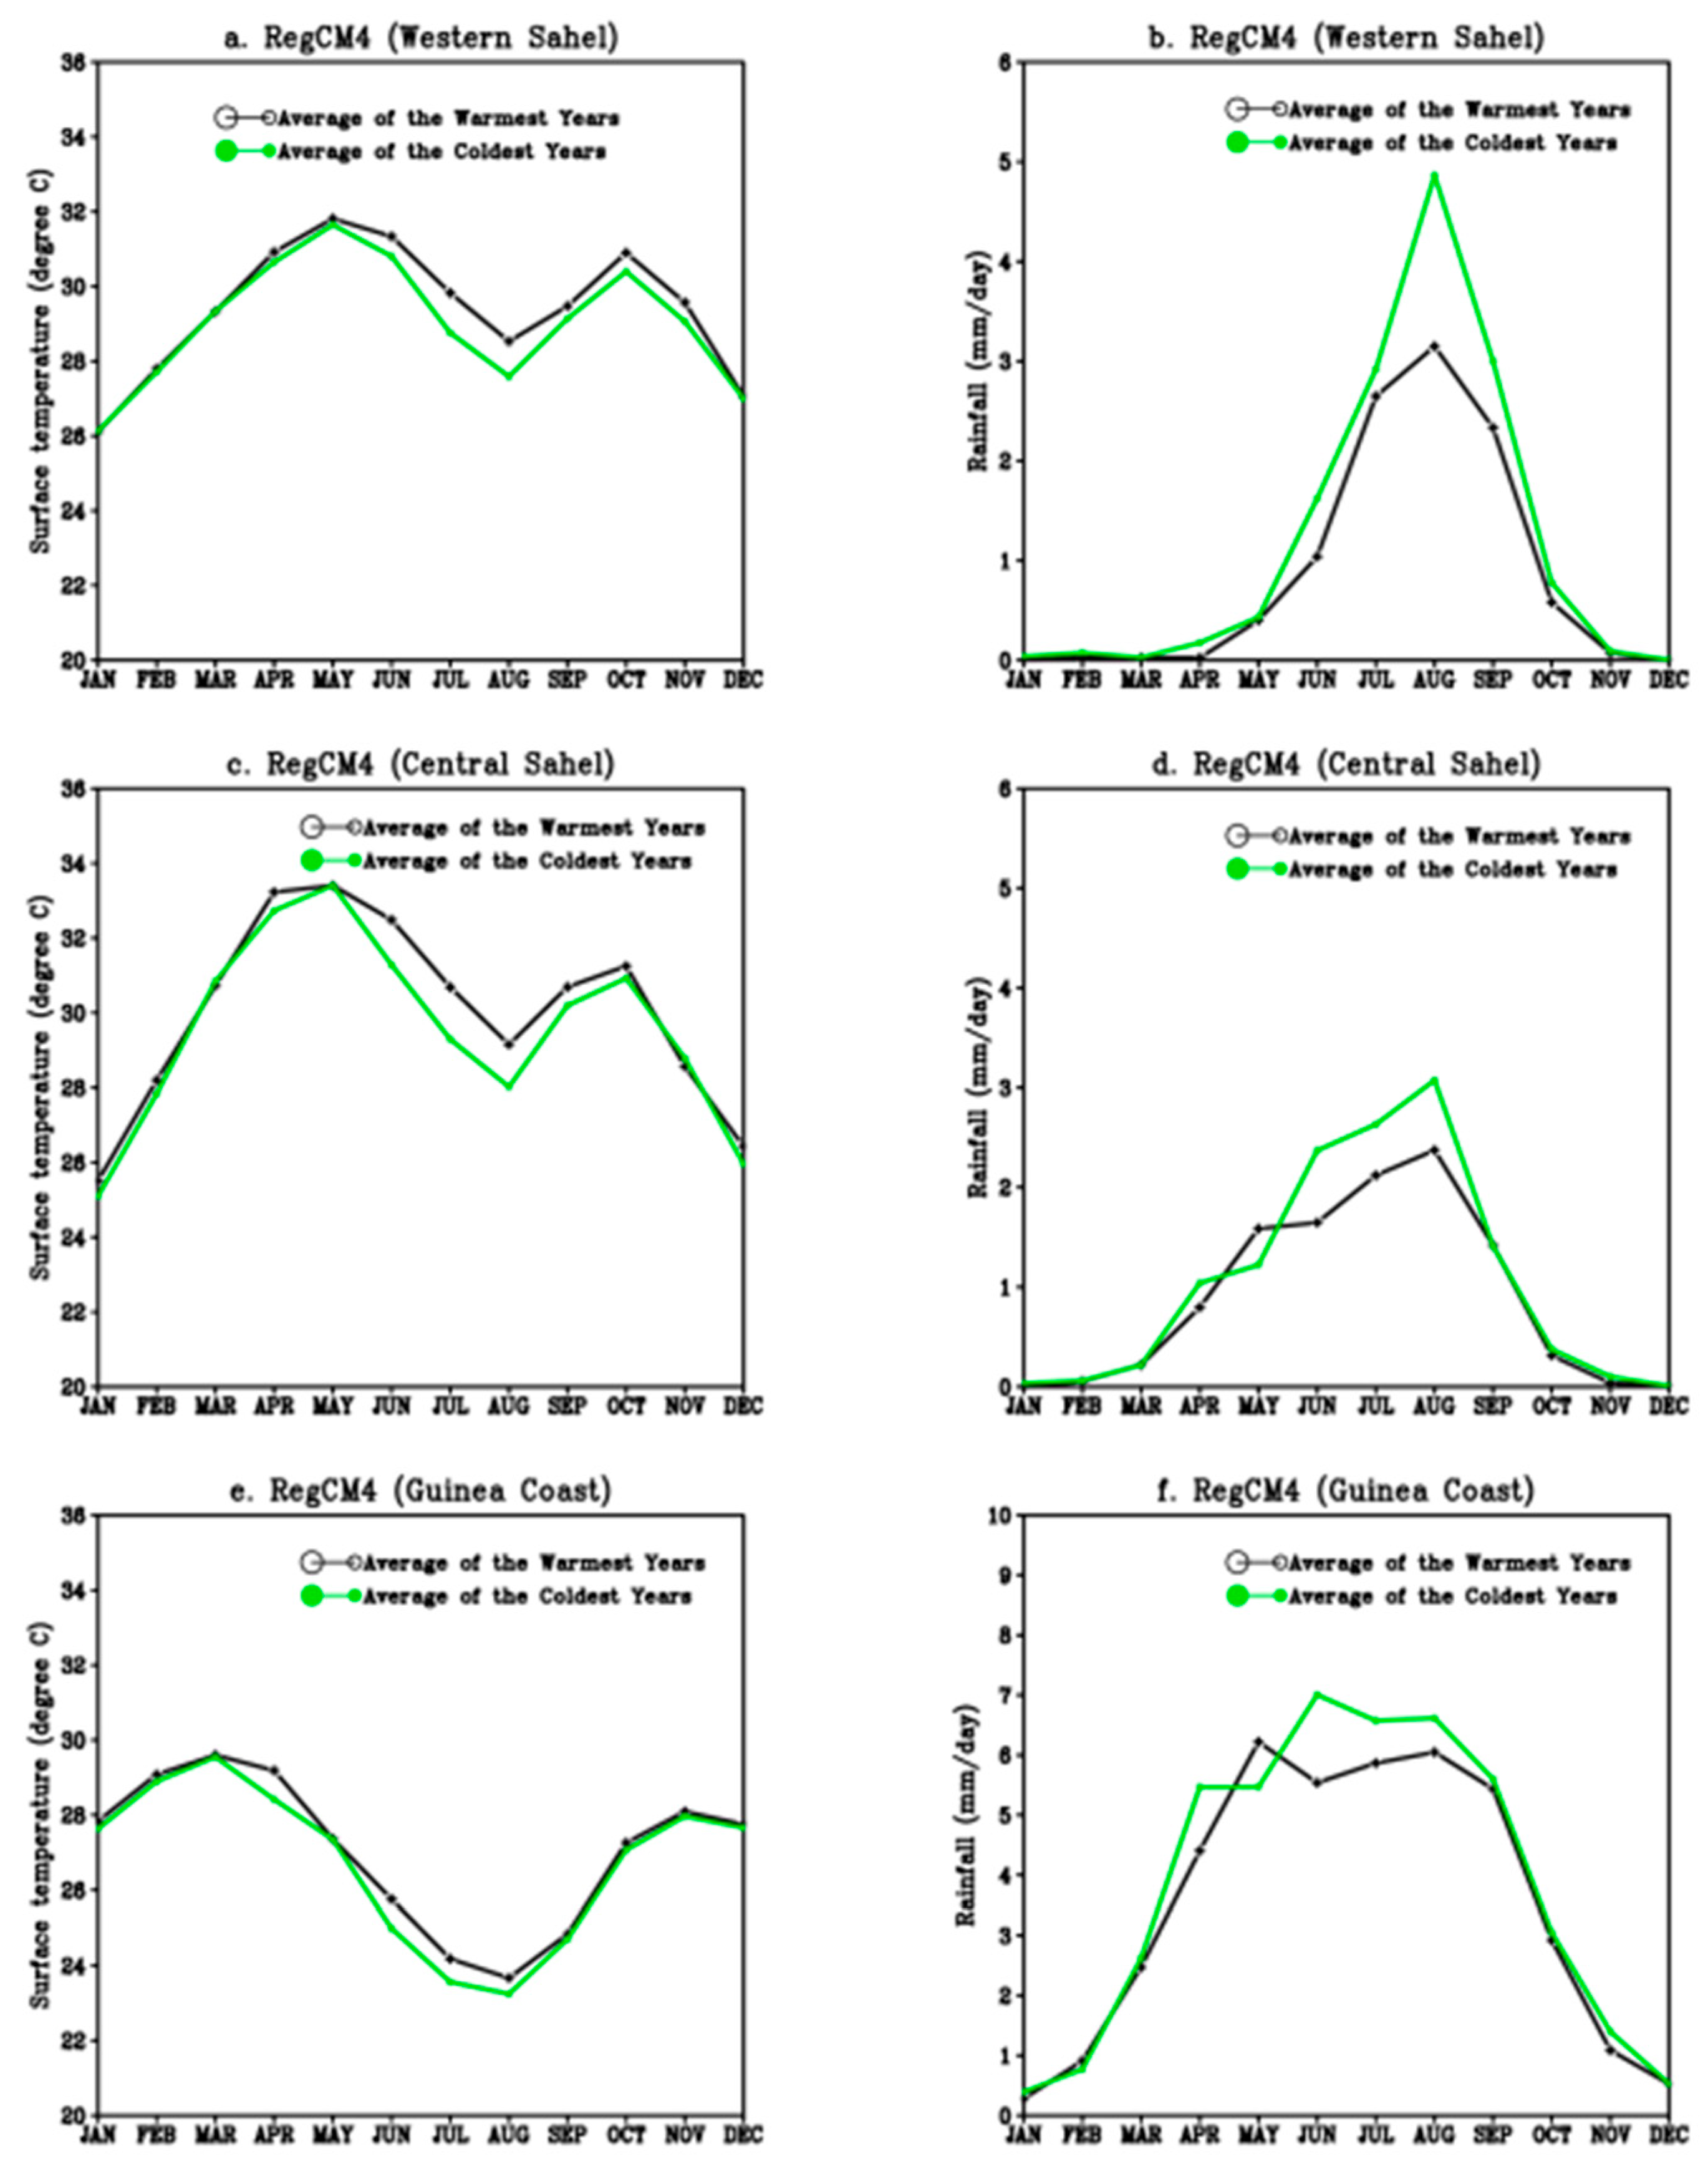
Figure 4 displayed the annual cycle of surface temperature (left) and rainfall (right) over the western Sahel (18° W–10° W; 12.5° N–17.5° N), the central Sahel (10° W–10° E; 12.5° N–17.5° N) and the Guinea Coast (10° W–10° E; 5° N–12.5° N) for the average of the warmest years and the average of the coldest years from the RegCM4 model. The model simulates a bimodal regime of surface temperature with maxima (above 30 °C) in April–May and October over the Sahel (western and central) (Figure 4a,c). In the Guinea Coast, the maxima are found in February–March–April and October–November (Figure 4e). There is a minimum simulated in August over the three regions (Figure 4a,c,e). Higher temperatures are recorded during the warmest years over the three subdomains in March–April–May.
The annual cycle of rainfall shows a rainfall peak in August over the Sahel and a rainy season which starts early (in April) over the western Sahel and central Sahel (Figure 4b,d). Over the Guinea Coast (Figure 4f); the annual rainfall cycle has two peaks (two rainy seasons) around May and August. The second rainy season (around July–September) is the wettest (Figure 4f). The rainfall amount is weaker over the three subdomains for the warmest years compared to the coldest years. Moreover, the rainy season seems to start and end at the same period for the warm period and the cold period over the Guinea Coast (Figure 4f).
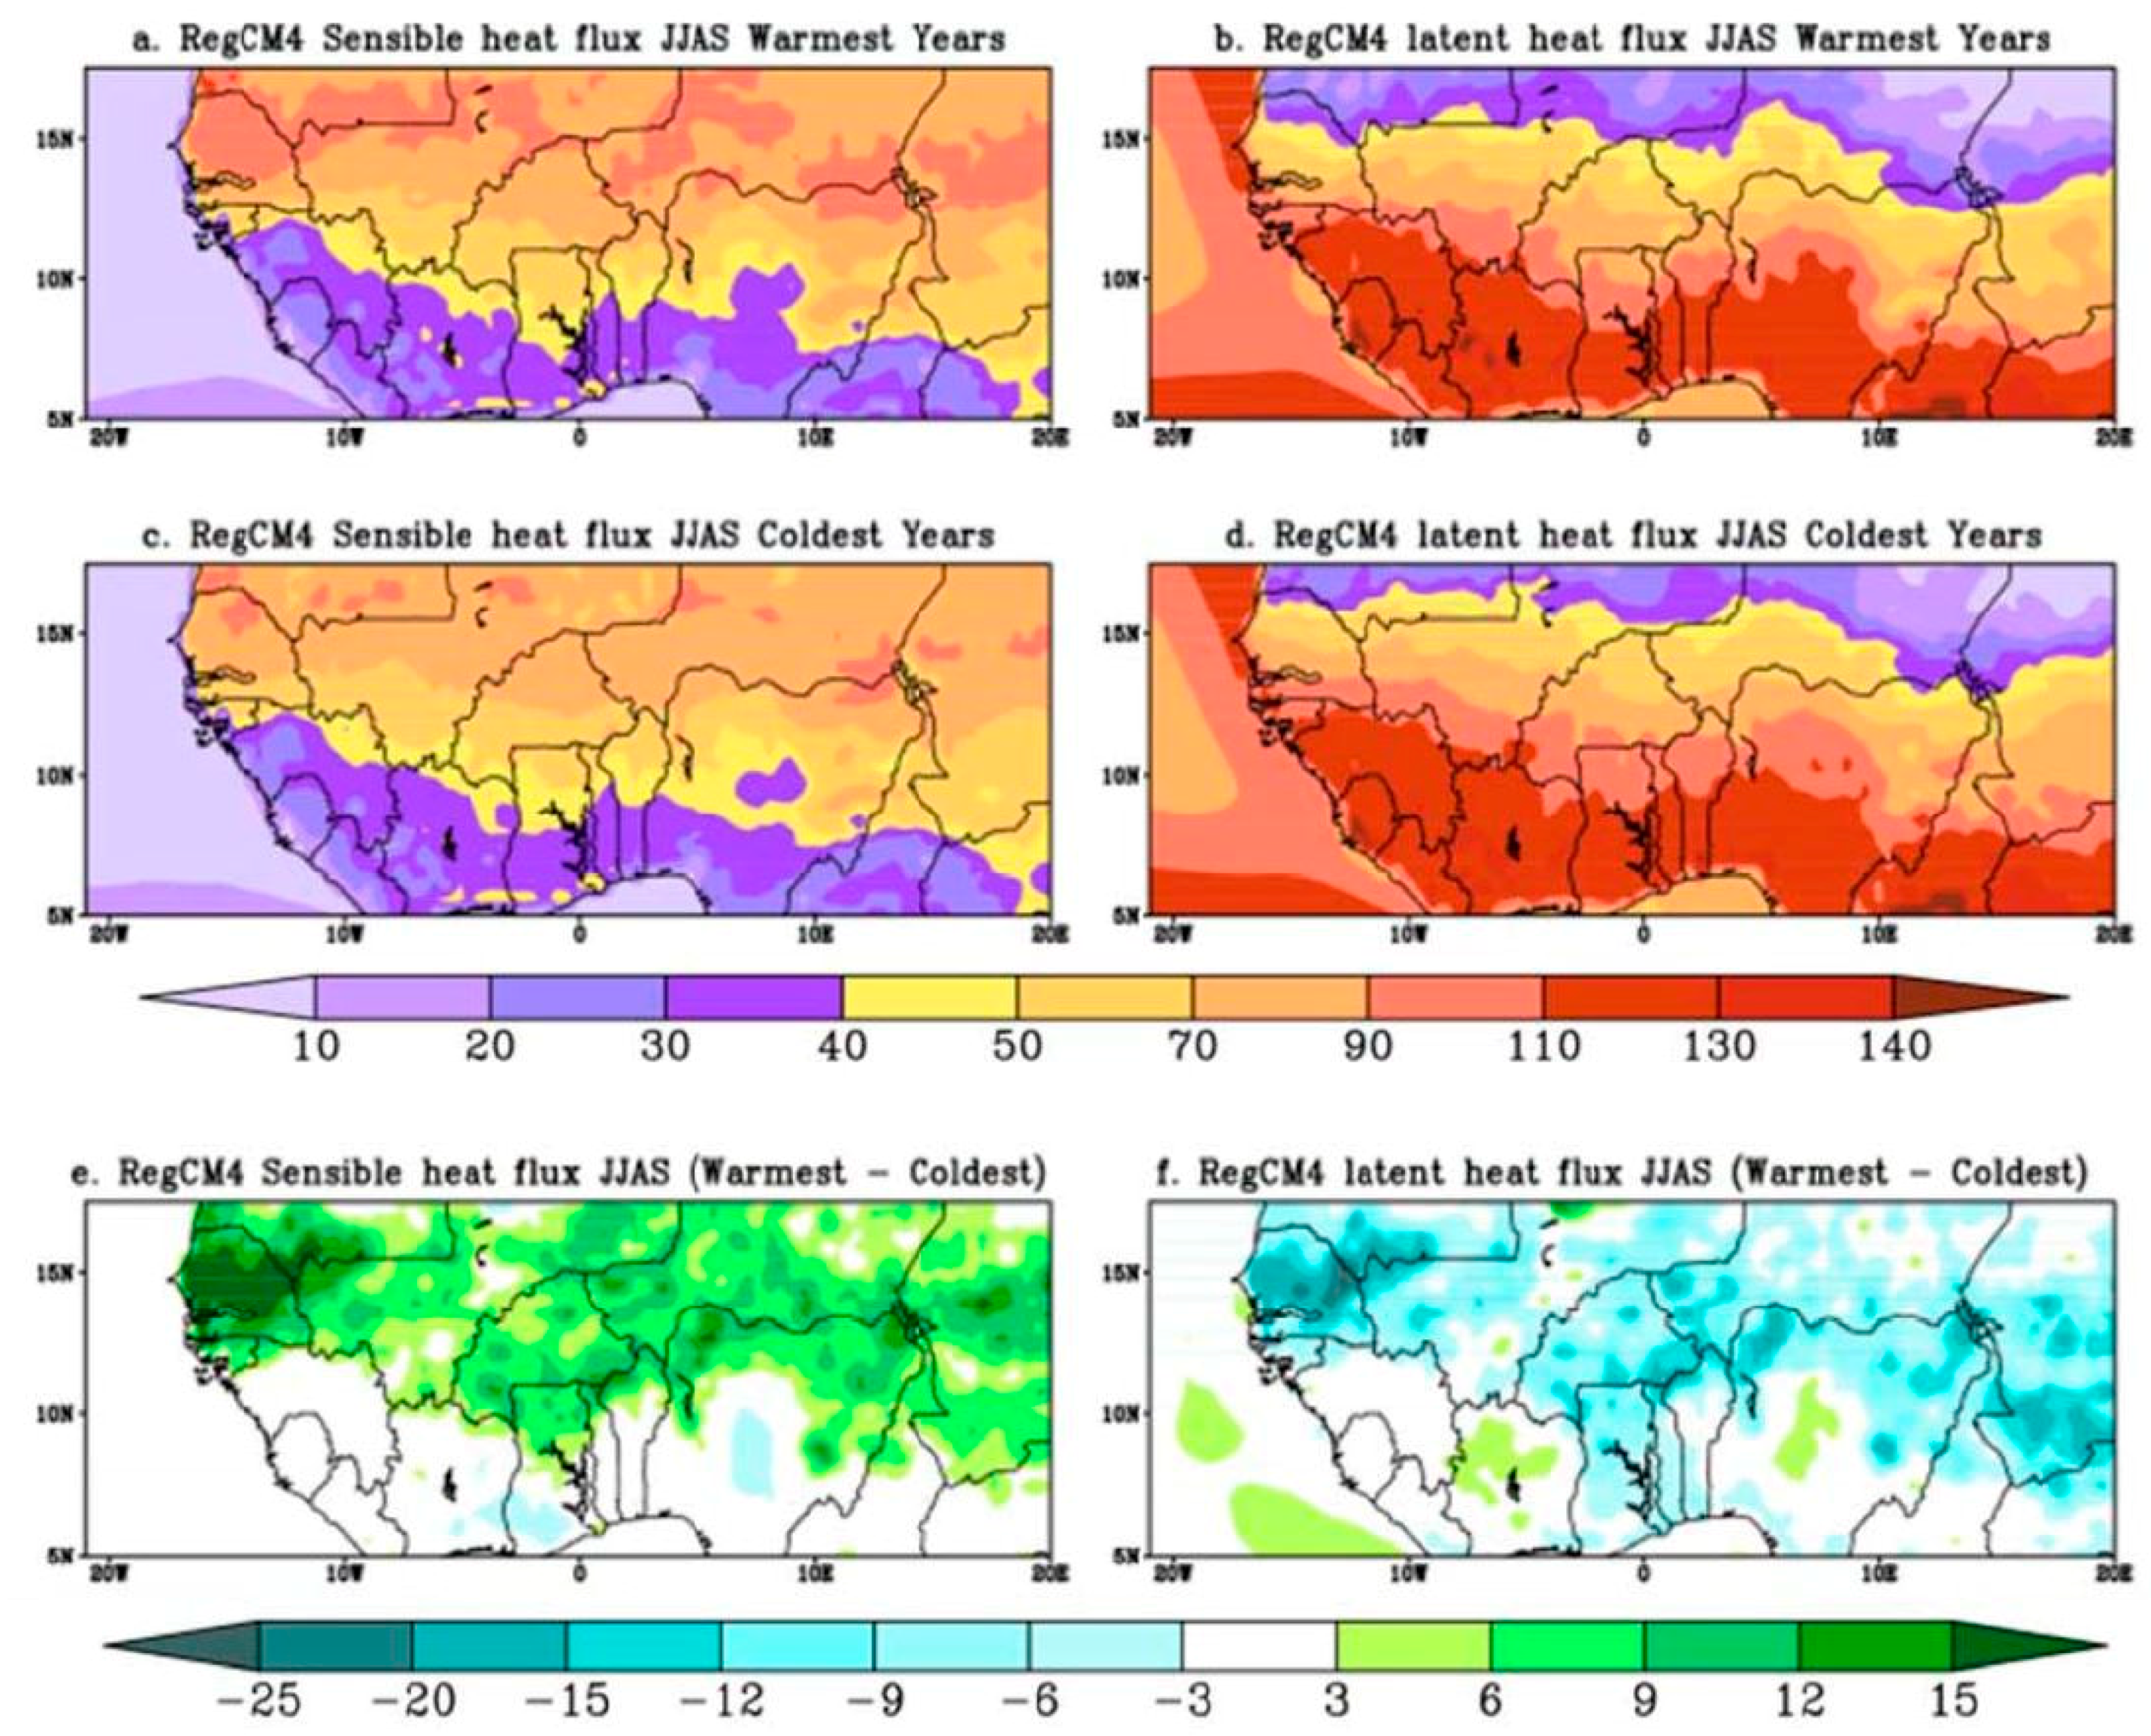
To better explain changes on surface temperature and rainfall, the spatial distribution of sensible heat flux and latent heat flux are displayed in Figure 5. The maxima of sensible heat flux (≥90 W·m−2) are found over the Sahel (Figure 5a,c). The minima (<50 W·m−2) are simulated over the Guinea Coast and the Atlantic Ocean (Figure 5a,c). The sensible heat flux is stronger during the warmest years, in coherence with the surface temperature increase.
The spatial distribution of latent heat flux shows the maxima (≥90 W·m−2) over the southern Sahel and the Guinea region (Figure 5b,d). The latent heat flux is weaker over the northern Sahel for both warmest and coldest years (Figure 5b,d). The analysis of the difference between the contrasted years shows generally a strengthening (weakening) of the sensible (latent) heat flux over the Sahel and the Guinea region (Figure 5e,f) during the warmest years in consistence with the surface temperature and rainfall variability over these regions (Figure 4). Overall, the sensible heat flux tends to increase (decrease) during warm (cold) years; while the latent heat flux decreases (increases) during warm (cold) years. Increase (decrease) of sensible (latent) heat flux over the Sahel and the Northern part of the continent in warm years may contribute to decrease the meridional gradient of boundary-layer entropy leading to a weak monsoon circulation [55,56] in the warmest years.
The Climate Change Science Program (CCSP, [57]) concluded that the changes in extreme weather had significant impacts to the society and the natural environment in coping with a changing climate. The Intergovernmental Panel on Climate Change [58] concluded that the global warming will cause an increase of extreme weather events which will affect the populations with an increase of their vulnerability particularly in low income countries such as those of West Africa. Likewise, the human health is sensitive to high values of warm extreme [59].
The temperature and precipitation events and extremes analyzed in this study are based on indices from ETCCDI and are shown in the Table 1. The precipitation indices are: R1mm (the rainy days), CWD (the consecutive wet days) and CDD (the consecutive dry days). The maximum duration of the consecutive wet days (CWD) and the consecutive dry days (CDD) are known to be crucial for agriculture in the West African regions. Figure 6 shows the changes in the precipitations extremes during warmest years. The analysis shows a decrease of the number of rainy days (R1mm) during warm years over the Sahel (western, central and eastern) and over the Guinea Coast (Figure 6a). The length of consecutive wet days (CWD) decreases over the western and eastern Sahel (Figure 6b), while the consecutive dry days (CDD) increase mainly over the Sahel (western, central and eastern) (Figure 6c) in consistence with [60]. These results are consistent with recent studies comparing incidences of 1.5 °C and 2 °C global warming level [61,62] and showing a reduction in mean rainfall for the models with enhanced warming level. They confirm also the significant increase of the length of consecutive dry days over the Western Sahel (Senegal) found in most global models [61] and regional models [62].
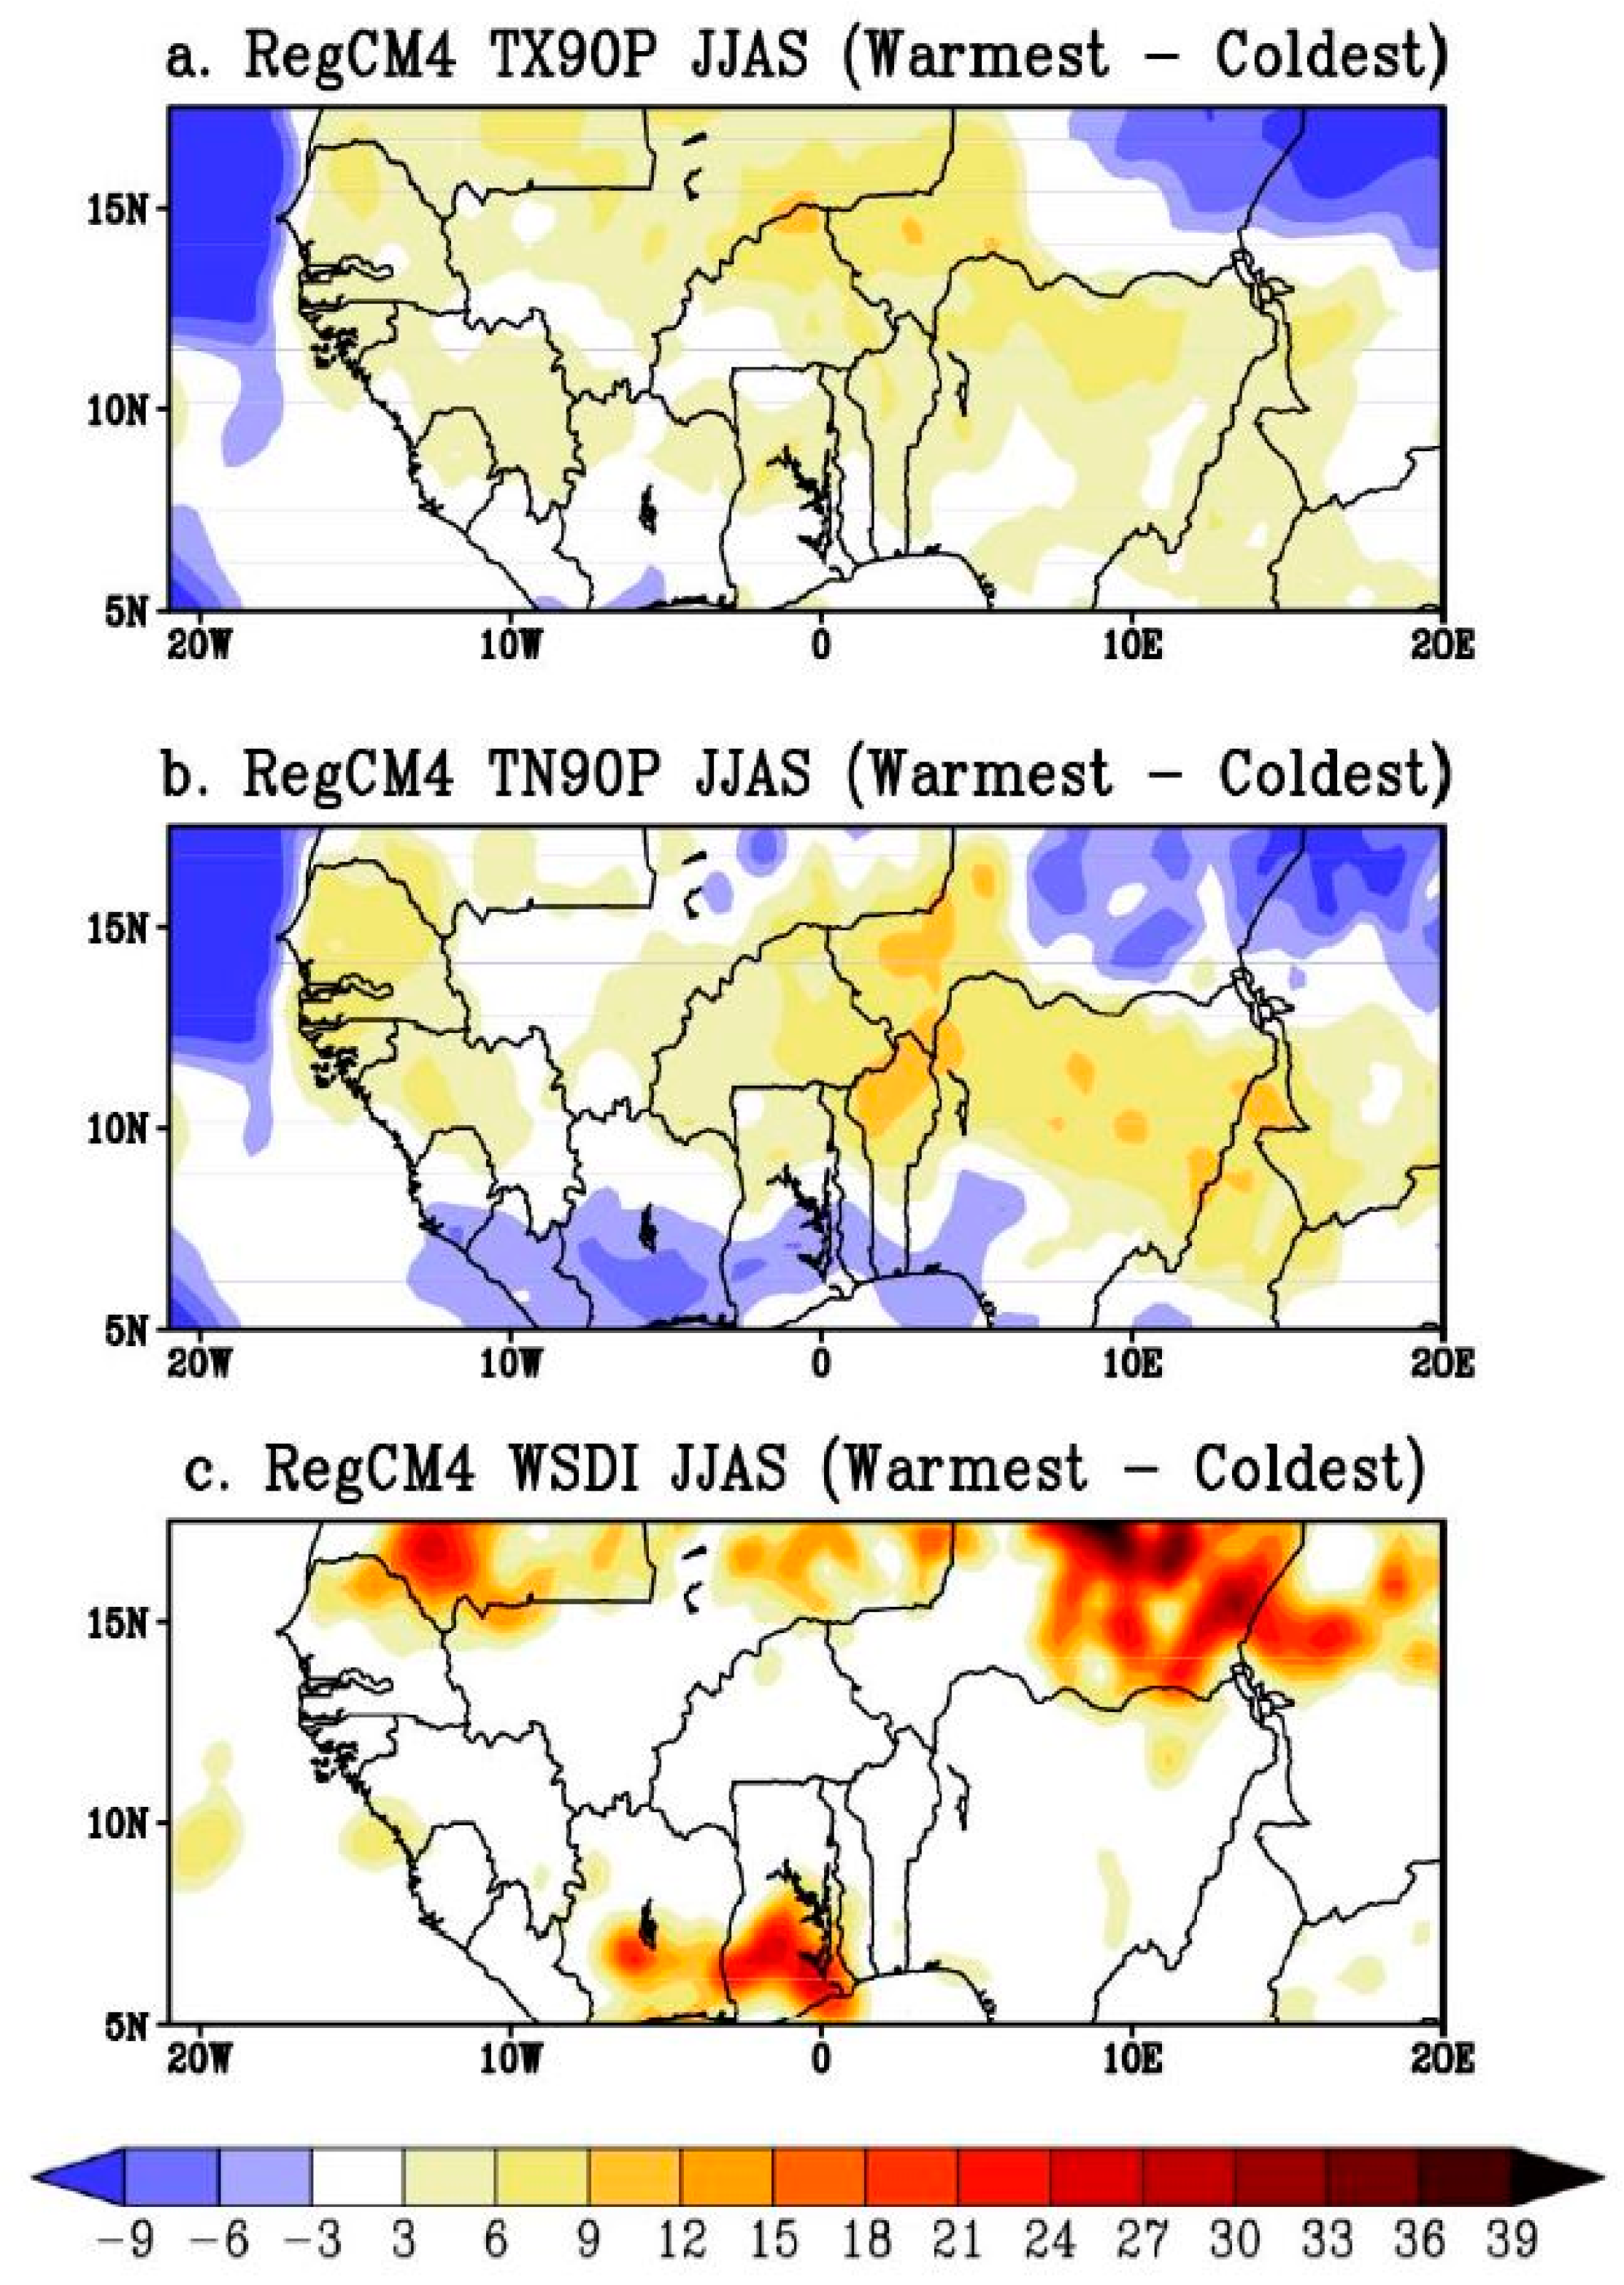
The temperature indices considered in this study are: TX90P (the very warm days), TN90P (the warm nights) and WSDI (the warm spell duration index). The warm days, warm nights and warm spell duration index pose a serious threat to human health and welfare. Figure 7 shows the changes in the temperature extremes during warm years. There is an increase of the percentage of the very warm days (Figure 7a) and of the warm nights (Figure 7b) over the Sahel and the Guinea Coast during warm years. Over the Atlantic Ocean (Figure 7b,d), the model also simulates a slight decrease of the frequency of these two warm extremes. The RegCM4 model simulates an increase of the Warm Spell Duration Index in the whole Sahel domain and over the Guinea Coast (Figure 7f). These results are in agreement with intensification of thermal extremes over Sahel and of heat waves in the Guinea Coast with increase of global temperature found in [61] and comparing changes in temperature extremes between 1.5 °C and 2 °C global warming over West Africa.
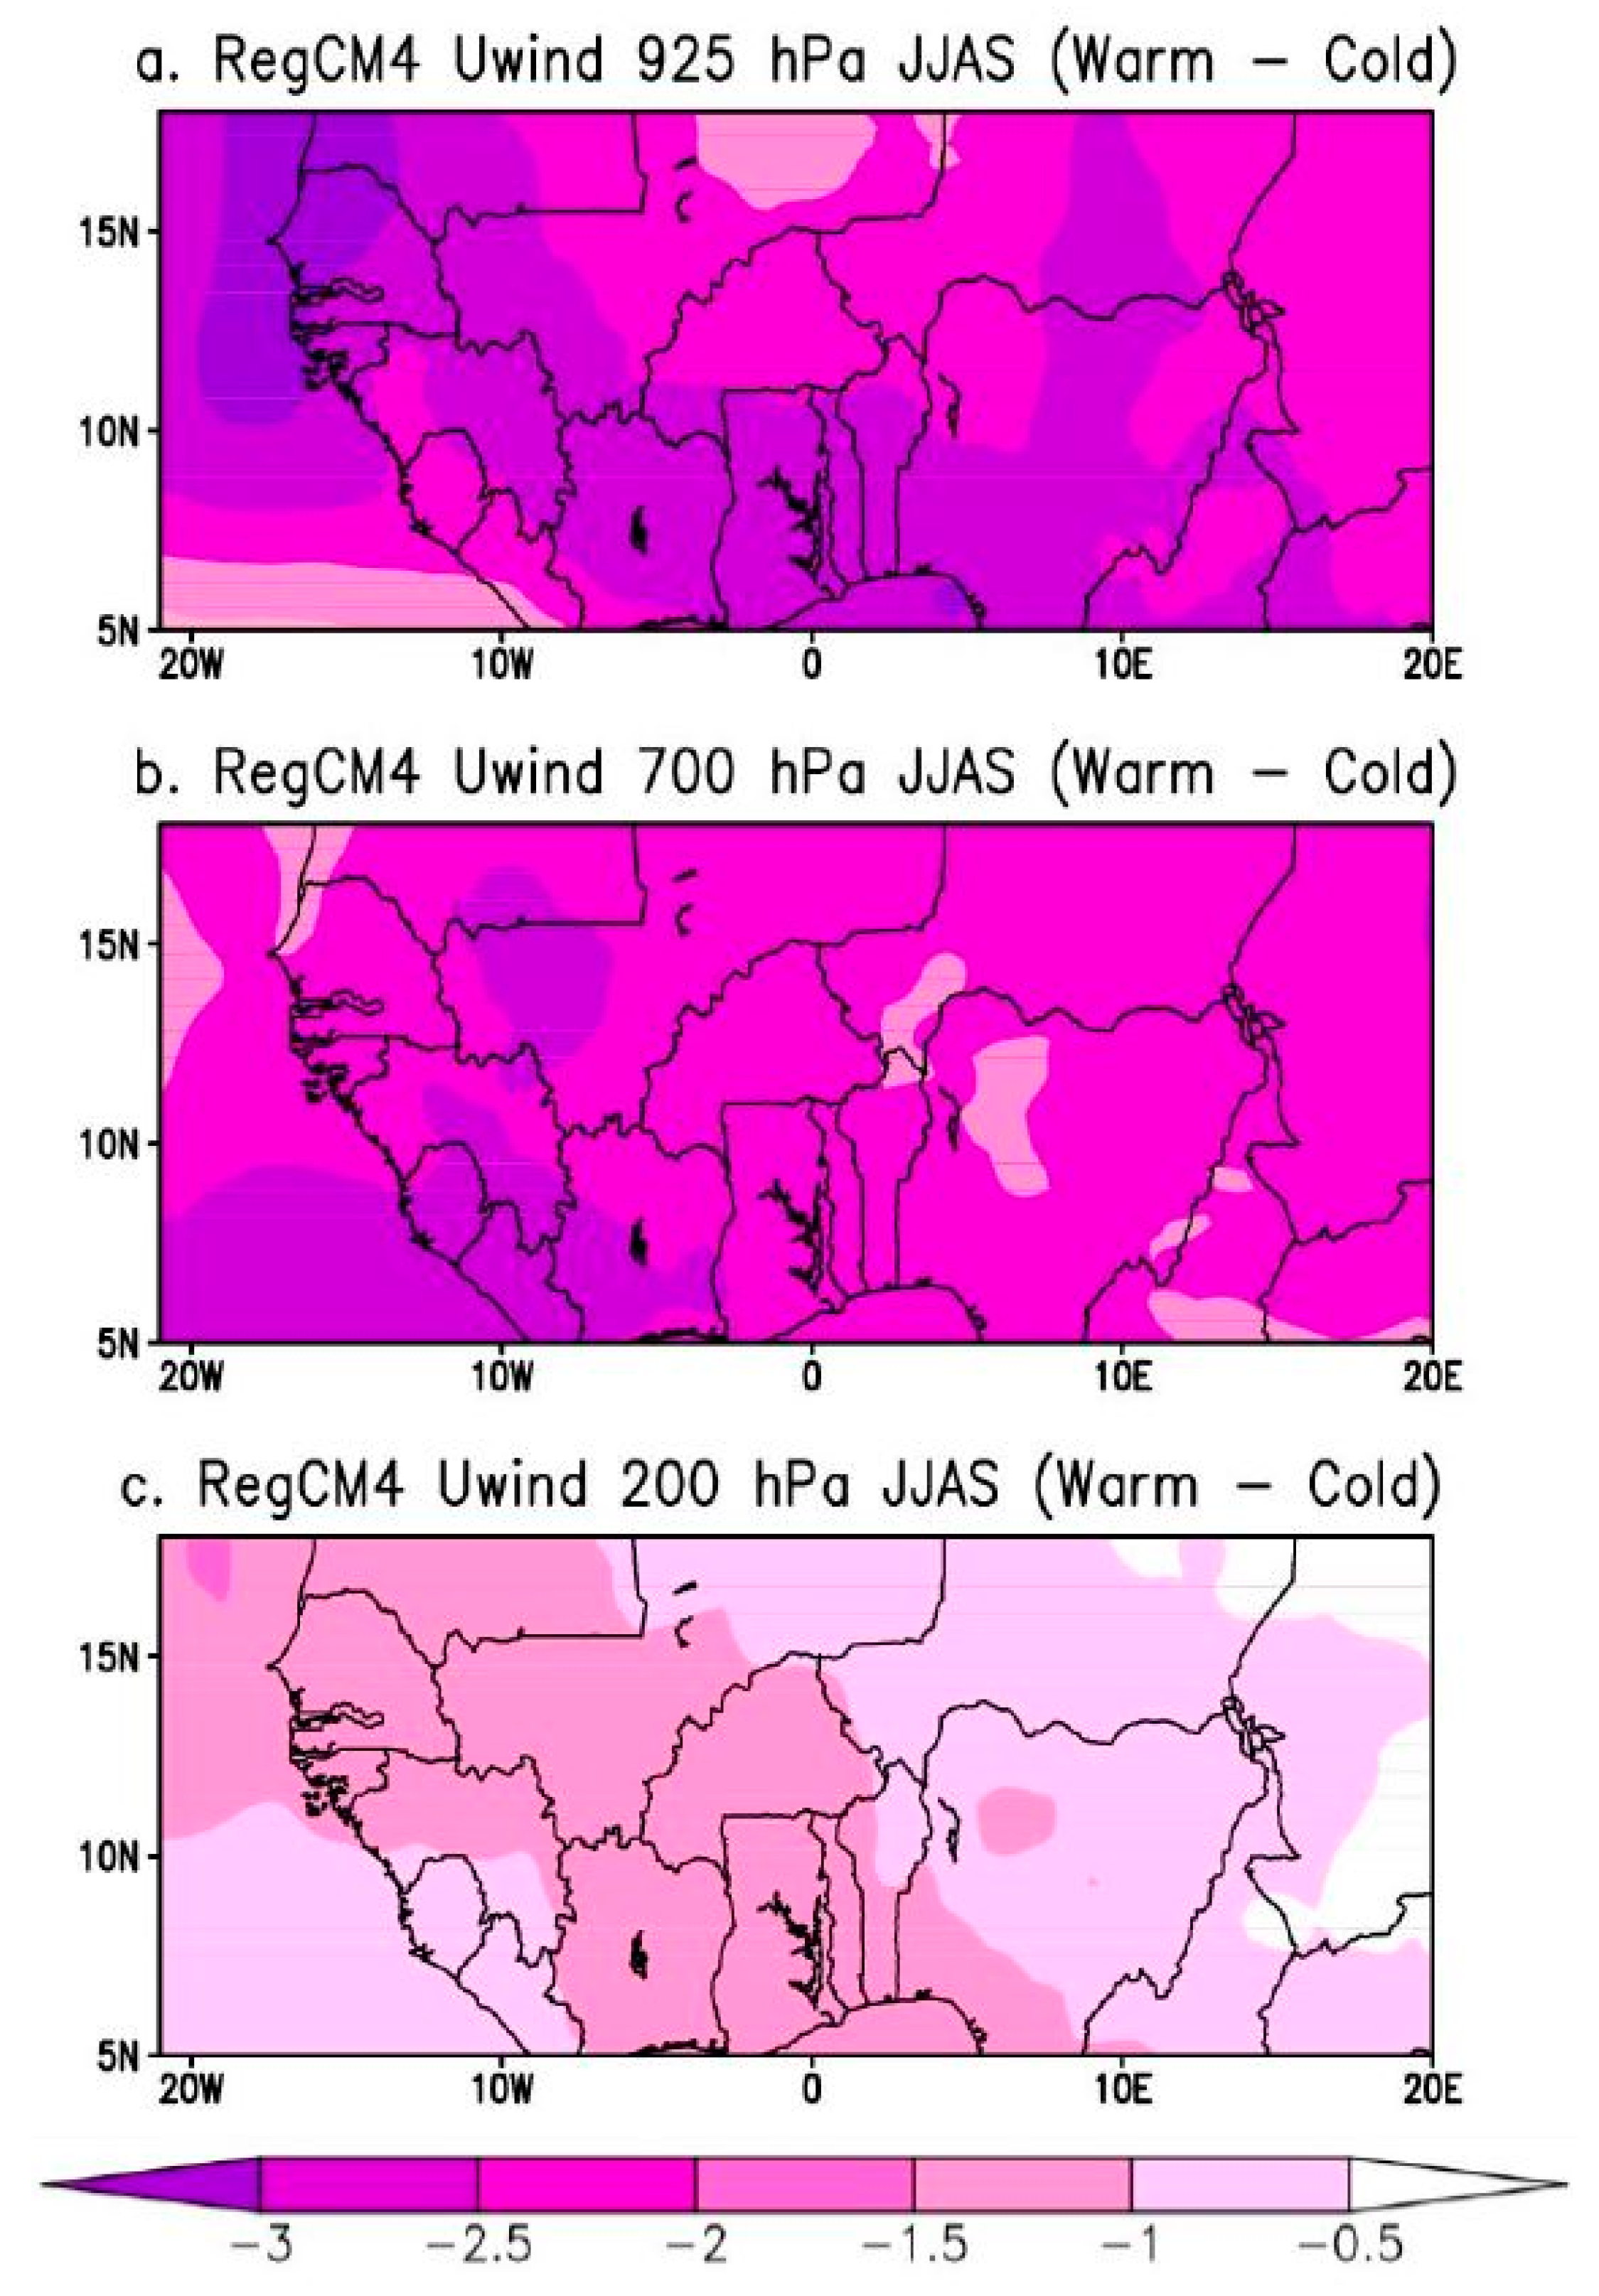
In the following section, the wind dynamics are analyzed in order to better interpret the synoptic variability associated with the changes in precipitation and temperature events and extremes during warm years. Figure 8 shows the June to September (JJAS) difference between the average of the warmest years and the average of the coldest years for the zonal wind at the monsoon level (925 hPa), at the African Easterly Jet level (700 hPa) and at the Tropical Easterly Jet level (200 hPa) over West Africa. The RegCM4 model simulates a decrease of the monsoon flow over the Guinea Coast and over the whole Sahel region during the warmest years (Figure 8a). At 700 hPa, the model simulates an increase in the magnitude of the African Easterly Jet (AEJ) over the whole Sahel band (Figure 8b) in consistence with previous studies [63] that showed a strengthening of the AEJ during dry years. At 200 hPa, an increase of the Tropical Easterly Jet (TEJ) is noted during warm years (Figure 8c). There is a significant difference between wet and dry years in the atmospheric circulation over the Sahel [64,65]: in wet (dry) years the AEJ tends to be weaker (stronger) than normal and is located more northward (southward), while the TEJ and the low-level monsoon flow tend to be stronger (weaker). Warm years lead to dryer Sahel conditions.
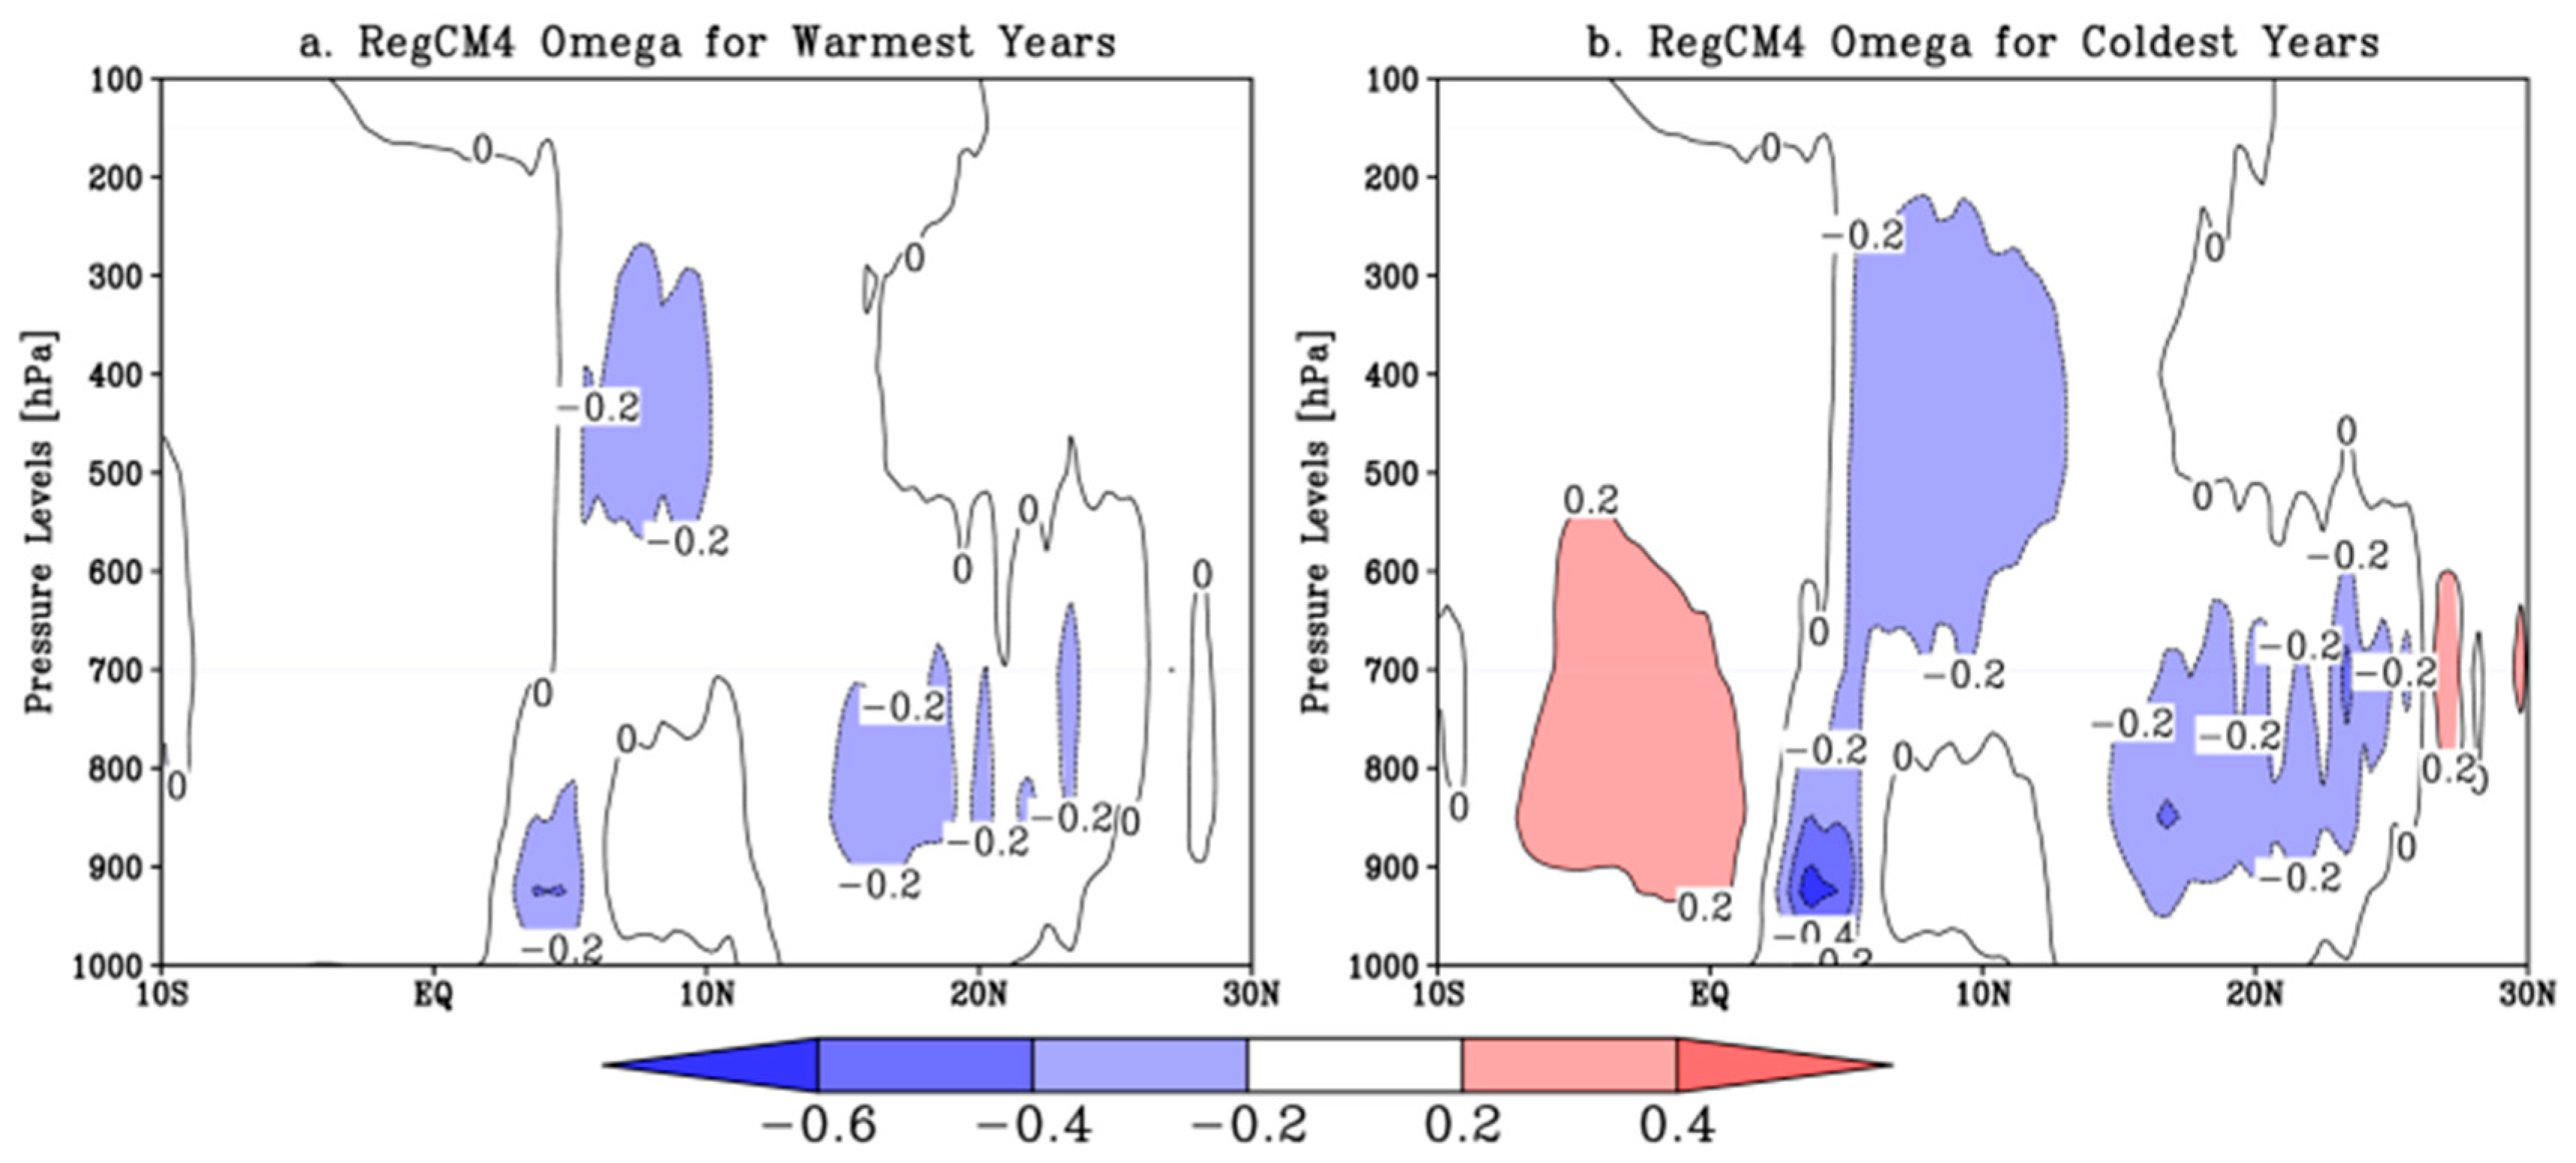
Figure 9 shows the vertical cross-section of the JJAS vertical velocity (omega) for the warmest years and the coldest years, averaged over the Sahel (between 10° W and 10° E). The first updraft region (Figure 9a) was observed over the Guinea region in the lower and middle layers (between 925 hPa and 600 hPa) and the second area is located in the middle layers between 25° N and 30° N during the coldest years. The first updraft corresponded to the InterTropical Convergence Zone (ITCZ), while the second referred to the heat low [66]. Downdraft is observed between the equator and the latitude 20° N for both warmest and coldest years. The convection tends to be stronger in both updarft regions during the coldest years suggesting that this period may be favorable for convection and then a rainfall increase.
In summary, this study shows an increase (a decrease) of thermal extremes indices (rainfall) during warmest years over the Sahel and the Guinea region in consistence with the IPCC special report on the regional impacts of global warming at 1.5 °C and 2 °C [21]. This special report concluded that climate-related risks for natural and human systems are higher for global warming of 1.5 °C than at present.
4. Conclusions
This work investigates the West African monsoon features in warm years using the Regional Climate Model RegCM4.5. Regarding the temperature variability, the RegCM4.5 model shows two phases: a hot period from 1980 to 1987 followed by an alternation between hot years and cold years from 1988 to 2009. The observed interannual rainfall anomalies show a persistence of dry years from 1980 to 1986 and a wet period from 2001 to 2008.The rainfall amount is weaker over the three subdomains for the warmest years compared to the coldest years. The analysis of energy fluxes shows that the maxima of the sensible heat flux are found over the Sahel region. The minima are simulated over the Guinea Coast and the Atlantic Ocean. The sensible heat flux is stronger during the warmest years in agreement with the surface temperature increase. The spatial distribution of the latent heat flux shows the maxima over the southern Sahel and the Guinea region. This flux tends to be weaker during the warmest years. Overall, the sensible heat flux tends to increase (decrease) during warm (cold) years; while the latent heat flux decreases (increases) during warm (cold) years.
A decrease in the number of rainy days is noted during warm years over the Sahel (western, central and eastern) and over the Guinea Coast. The length of consecutive wet days decreases over the western and eastern Sahel while the consecutive dry days increase mainly over the Sahel (western, central and eastern).
The percentage of very warm days and of warm nights increases over the Sahel and the Guinea Coast during warm years. The model also simulates an increase of the warm spell duration index in the whole Sahel domain and over the Guinea Coast in warm years. Regarding the synoptic variability, warm years are associated with a weak monsoon flow, an increase of the AEJ and the TEJ. This configuration at synoptic scales associated with warm years is known to lead to drier conditions over the Sahel.
Changes noted in warm years may have serious implications on the economies of countries of the West African region, which are not strong enough to cope with adverse climate effects. Indeed, an increase in the frequency of thermal indices and extreme rainfall events may induce a higher demand on domestic energy consumption for cooling and a lower performance of agricultural crops. This study can be considered as a support for the West Africa policymakers to implement measures contributing to the mitigation and adaptation of the global warming especially in the context of what the 1.5 °C or 2 °C global temperature reduction goals can really mean for the regional climate conditions as in West Africa. Despite the results obtained, additional works are needed to better understand the West African monsoon features in warm years for the present-day but also in the future using climate change scenarios.
Author Contributions
I.D., A.D. and M.C. performed the design of experiments. I.D. processed the data. All authors discussed the results and contributed to the manuscript.
Funding
This research is partly funded by the IRD (Institut de Recherche pour le Développement; France) grant number UMR IGE Imputation 252RA5”. The APC was funded by the IRD (Institut de Recherche pour le Développement; France) grant number UMR IGE Imputation 252RA5”.
Acknowledgments
The authors would like to thank the Assane SECK University of Ziguinchor (Senegal), the SCAC of the French Embassy in Senegal and the “Fonds d’Impulsion de la Recherche Scientifique (FIRST) du MESRI/Senegal” for their financial support.
Conflicts of Interest
The authors declare no conflict of interest.
References
- Sylla, M.B.; Diallo, I.; Pal, J.S. West African Monsoon in State-of-the-Science Regional Climate Models, Climate Variability-Regional and Thematic Patterns; InTech: London, UK, 2013; ISBN 978-953-51-1187-0. [Google Scholar]
- Sultan, B.; Janicot, S. Abrupt shift of the ITCZ over West Africa and intra-seasonal variability. Geophys. Res. Lett. 2000, 27, 3353–3356. [Google Scholar] [CrossRef] [Green Version]
- Cook, K.H. Generation of the African easterly jet and its role in determining West African precipitation. J. Clim. 1999, 12, 1165–1184. [Google Scholar] [CrossRef]
- Cadet, D.L.; Nnoli, O. Water vapor transport over Africa and the Atlantic Ocean during summer 1979. Q. J. R. Meteorol. Soc. 1987, 113, 581–602. [Google Scholar] [CrossRef]
- Mathon, V.; Laurent, H. Life cycle of Sahelian mesoscale convective cloud systems. Q. J. R. Meteorol. Soc. 2001, 127, 377–406. [Google Scholar] [CrossRef]
- Fink, A.H.; Reiner, A. Spatio-temporal variability of the relation between African easterly waves and West African squall lines in 1998 and 1999. J. Geophys. Res. 2003, 108, 4332. [Google Scholar] [CrossRef]
- Thorncroft, C.; Hodges, K. African easterly wave activity and its relationship to Atlantic tropical cyclone activity. J. Clim. 2001, 14, 1166–1179. [Google Scholar] [CrossRef]
- Burpee, R.W. The origin and structure of easterly waves in the lower troposphere of North Africa. J. Atmos. Sci. 1972, 29, 77–90. [Google Scholar] [CrossRef]
- Jenkins, G.S.; Gaye, A.T.; Sylla, B. Late 20th century attribution of drying trends in the Sahel from the Regional Climate Model (RegCM3). Geophys. Res. Lett. 2005, 32, L22705. [Google Scholar] [CrossRef]
- Kanamitsu, M.; Krishnamurty, T.N. Northern summer tropical circulation during drought and normal rainfall months. Mon. Weather Rev. 1978, 106, 331–347. [Google Scholar] [CrossRef]
- James, R.; Washington, R.; Rowell, D.P. African Climate Change Uncertainty in Perturbed Physics Ensembles: Implications of Global Warming to 4 °C and Beyond. J. Clim. 2014, 27, 4677–4692. [Google Scholar] [CrossRef]
- Skinner, C.B.; Diffenbaugh, N.S. Projected Changes in African Easterly Wave Intensity and Track in Response to Greenhouse Forcing. Proc. Natl. Acad. Sci. USA 2014, 111, 6882–6887. [Google Scholar] [CrossRef] [PubMed]
- IPCC. Climate change. The physical science basis. In Contribution of Working Group I to the Fourth Assessment Report of the Intergovernmental Panel on Climate Change; Solomon, S., Qin, D., Manning, M., Chen, Z., Marquis, M., Averyt, K.B., Tignor, M., Miller, H.L., Eds.; Cambridge University Press: Cambridge, UK, 2007; 996p. [Google Scholar]
- Druyan, L.M.; Fulakeza, M.; Lonergan, P.; Noble, E. Regional climate model simulation of the AMMA special observing period and the pre-Helene easterly wave. Meteorol. Atmos. Phys. 2009, 105, 191–210. [Google Scholar] [CrossRef]
- Hourdin, F.; Mustat, I.; Guichard, F.; Ruti, P.M.; Favot, F.; Pham, M.M.A.; Grandpeix, J.Y.; Polcher, J.; Marquet, P.; Boone, A.; et al. AMMA-Model intercomparison project. Bull. Am. Meteorol. Soc. 2010. [Google Scholar] [CrossRef]
- Sylla, M.B.; Dell’Aquila, A.; Ruti, P.M.; Giorgi, F. Simulation of the Intraseasonal and the Interannual Variability of Rainfall over West Africa with a Regional Climate Model (RegCM3) during the Monsoon Period. Int. J. Climatol. 2010, 30, 1865–1883. [Google Scholar]
- Camara, M.; Diedhiou, A.; Sow, B.A.; Diallo, M.D.; Diatta, S.; Mbaye, I.; Diallo, I. Analyse de la pluie simulée par les modèles climatiques régionaux de CORDEX en Afrique del’Ouest. Sécheresse 2013, 24, 14–28. [Google Scholar] [CrossRef]
- Giorgi, F.; Mearns, L.O.; Shields, C.; McDaniel, L. Regional nested model simulations of present day and 2 × CO2 climate over the Central Plains of the US. Clim. Chang. 1998, 40, 457–493. [Google Scholar] [CrossRef]
- Paeth, H.; Capo-Chichi, A.; Endlicher, W. Climate Change and Food Security in Tropical West Africa-A Dynamic-Statistical Modelling Approach. Erdkunde 2008, 62, 101–115. [Google Scholar] [CrossRef]
- Philippon, N.; Martiny, N.; Camberlin, P. Forecasting the Vegetation Photosynthetic Activity over the Sahel: A Model Output Statistics Approach. Int. J. Climatol. 2009, 29, 1463–1477. [Google Scholar] [CrossRef]
- IPCC. Summary for Policymakers. In Global Warming of 1.5 °C. An IPCC Special Report on the Impacts of Global Warming of 1.5 °C Above Pre-Industrial Levels and Related Global Greenhouse Gas Emission Pathways, in the Context of Strengthening the Global Response to the Threat of Climate Change, Sustainable Development, and Efforts to Eradicate Poverty; World Meteorological Organization: Geneva, Switzerland, 2018; 32p. [Google Scholar]
- Peterson, T.C.; Folland, C.; Gruza, G.; Hogg, W.; Mokssit, A.; Plummer, N. Report on the Activities of the Working Group on Climate Change Detection and Related Rapporteurs 1998-2001; WMO: Geneva, Switzerland, 2001. [Google Scholar]
- Diba, I.; Camara, M.; Sarr, A.B.; Diedhhiou, A. Potential Impacts of Land Cover Change on the Interannual Variability of Rainfall and Surface Temperature over West Africa. Atmosphere 2018, 9, 376. [Google Scholar] [CrossRef]
- Giorgi, F.; Coppola, E.; Solmon, F.; Mariotti, L.; Sylla, M.B.; Bi, X.; Elguindi, N.; Diro, G.T.; Nair, V.; Giuliani, G.; et al. RegCM4: Model description and preliminary tests over multiple CORDEX domains. Clim. Res. 2012, 52, 7–29. [Google Scholar] [CrossRef]
- Kiehl, J.T.; Hack, J.J.; Bonan, G.B.; Boville, B.A.; Briegleb, B.P.; Williamson, D.L.; Rasch, P.J. Description of the NCAR Community Climate Model (CCM3); NCAR: Boulder, CO, USA, 1996; p. 152. [Google Scholar]
- Dickinson, R.E.; Henderson, S.A.; Kennedy, P.J. Biosphere-Atmosphere Transfer Scheme (BATS) Version 1E as Coupled to the NCAR Community Climate Model; NCAR: Boulder, CO, USA, 1993. [Google Scholar]
- Zeng, X.; Zhao, M.; Dickinson, R.E. Intercomparison of bulk aerodynamic algorithms for the computation of sea surface fluxes using TOGA COARE and TAO data. J. Clim. 1998, 11, 2628–2644. [Google Scholar] [CrossRef]
- Holtslag, A.A.M.; de Bruijn, E.I.F.; Pan, H.L. A high resolution air mass transformation model for short-range weather forecasting. Mon. Weather Rev. 1990, 118, 1561–1575. [Google Scholar] [CrossRef]
- Pal, J.S.; Small, E.; Eltahir, E.A.B. Simulation of regional-scale water and energy budgets: Representation of subgrid cloud and precipitation processes withinRegCM. J. Geophys. Res. 2000, 105, 29579–29594. [Google Scholar] [CrossRef]
- Grell, G.A. Prognostic evaluation of assumptions used by cumulus parameterizations. Mon. Weather Rev. 1993, 121, 764–787. [Google Scholar] [CrossRef]
- Fritsch, J.M.; Chappell, C.F. Numerical prediction of convectively driven mesoscale pressure systems. Part I: Convective parameterization. J. Atmos. Sci. 1980, 37, 1722–1733. [Google Scholar] [CrossRef]
- Emanuel, K.A. A scheme for representing cumulus convection in large-scale models. J. Atmos. Sci. 1991, 48, 2313–2335. [Google Scholar] [CrossRef]
- Mariotti, L.; Coppolla, E.; Sylla, M.B.; Giorgi, F.; Piani, C. Regional climate model simulation of projected 21st century climate over an all-African domain: Comparison analysis of nested and driving model result. J. Geophys. Res. 2011, 116, D15111. [Google Scholar] [CrossRef]
- Abiodun, B.J.; Pal, J.S.; Afiesimama, E.A.; Gutowski, W.J.; Adedoyin, A. Simulation of West African monsoon using RegCM3 Part II: Impacts of deforestation and desertification. Theor. Appl. Climatol. 2008, 93, 245–261. [Google Scholar] [CrossRef]
- Sylla, M.B.; Gaye, A.T.; Jenkins, G.S.; Pal, J.S.; Giorgi, F. Consistency of projected drought over the Sahel with changes in the monsoon circulation and extremes in a regional climate model projections. J. Geophys. Res. 2010, 115, D16108. [Google Scholar] [CrossRef]
- Rayner, N.A.; Horton, E.B.; Parker, D.E.; Folland, C.K.; Hackett, R.B. Version 2.2 of the Global Sea-Ice and Sea Surface Temperature Data Set; Hadley Centre Meteorological Official: London, UK, 1996. [Google Scholar]
- Simmons, A.S.; Uppala, D.; Kobayashi, S. ERA-Interim: New ECMWF reanalysis products from 1989 onwards. ECMWF Newsl. 2007, 110, 29–35. [Google Scholar]
- Uppala, S.; Dee, D.; Kobayashi, S.; Berrisford, P.; Simmons, A. Towards a climate data assimilation system: Status update of ERA-Interim. ECMWF Newsl. 2008, 115, 12–18. [Google Scholar]
- Paeth, H.; Hall, N.M.; Gaertner, M.A. Progress in regional downscaling of West African precipitation. Atmos. Sci. Lett. 2011, 12, 75–82. [Google Scholar] [CrossRef]
- Oettli, P.; Sultan, B.; Baron, C.; Vrac, M. Are regional climate models relevant for crop yield prediction in West Africa? Environ. Res. Lett. 2011, 6, 014008. [Google Scholar] [CrossRef] [Green Version]
- Kothe, S.; Ahrens, B. On the radiation budget in regional climate simulations for West Africa. J. Geophys. Res. 2010, 115, D23120. [Google Scholar] [CrossRef]
- Dee, D.P. The ERA-Interim reanalysis: Configuration and performance of the data assimilation system. Q. J. R. Meteorol. Soc. 2011, 137, 553–597. [Google Scholar] [CrossRef]
- Diallo, I.; Bain, C.L.; Gaye, A.T.; Moufouma-Okia, W.; Niang, C.; Dieng, M.D.B.; Graham, R. Simulation of the West African monsoon onset using the HadGEM3-RA regional climate model. Clim Dyn. 2014, 43, 575–594. [Google Scholar] [CrossRef] [Green Version]
- Adler, R.F.; Huffman, G.J.; Chang, A.; Ferraro, R.; Xie, P.; Janowiak, J. The version-2 global precipitation climatology project (GPCP) monthly precipitation analysis (1979-present). J. Hydrometeorol. 2003, 4, 1147–1167. [Google Scholar] [CrossRef]
- Kraus, E.B. Subtropical droughts and cross equatorial energy transports. Mon. Weather Rev. 1977, 105, 1009–1018. [Google Scholar] [CrossRef]
- Ali, A. Climate variability and change in the Sahel. Understanding the current situation by observing Climate change in the Sahel. A challenge for sustainable development. AGRHYMET Mon. Bull. 2011, 17–20. Available online: http://www.agrhymet.ne/PDF/Bulletin%20mensuel/specialChCang.pdf (accessed on 6 January 2019).
- Nicholson, S.E.; Some, B.; Kone, B. An analysis of recent rainfall conditions in West Africa, including the rainy seasons of the 1997 E1 Nino and the 1998 La Nina years. J. Clim. 2000, 13, 2628–2640. [Google Scholar] [CrossRef]
- Tarhule, A.; Lamb, P.J. Climate research and seasonal forecasting for West Africans: Perceptions, dissemination, and use. Bull. Am. Meteorol. Soc. 2003, 84, 1741–1759. [Google Scholar] [CrossRef]
- Le Barbé, L.; Lebel, T. Rainfall climatology of the Hapex-Sahel region during the years 1950–1990. J. Hydrol. 1997, 188, 43–73. [Google Scholar] [CrossRef]
- Giannini, A.; Saravanan, R.; Chang, P. Oceanic forcing of Sahel rainfall on interannual to interdecadal time scales. Science 2003, 302, 102730. [Google Scholar] [CrossRef]
- Lu, J.; Delworth, R. Oceanic forcing of the late 20th century Sahel drought. Geophys. Res. Lett. 2005, 32, L22706. [Google Scholar] [CrossRef]
- Biasutti, M.; Held, I.M.; Sobel, A.H.; Giannini, A. SST forcings and Sahel rainfall variability in simulations of the twentieth and twenty first centuries. J. Clim. 2008, 21, 3471–3486. [Google Scholar] [CrossRef]
- Sultan, B.; Janicot, S.; Diedhiou, A. The West African monsoon dynamics. Part I: Documentation of intraseasonal variability. J. Clim. 2003, 16, 3389–3406. [Google Scholar] [CrossRef]
- Sultan, B.; Janicot, S. The West African monsoon dynamics–part II: The ‘preonset’ and ‘onset’ of the summer monsoon. J. Clim. 2003, 16, 3407–3427. [Google Scholar] [CrossRef]
- Zheng, X.; Eltahir, E.A. The role of vegetation in the dynamics of West African monsoons. J. Clim. 1998, 11, 2078–2096. [Google Scholar] [CrossRef]
- Eltahir, E.A.; Gong, C. Dynamics of wet and dry years in West Africa. J. Clim. 1996, 9, 1030–1042. [Google Scholar] [CrossRef]
- CCSP. Weather and Climate Extremes in a Changing Climate. Regions of Focus: North America, Hawaii, Caribbean, and U.S. Pacific Islands. A Report by the U.S. Climate Change Science Program and the subcommittee on Global Change Research. Department of Commerce; NOAA’s National Climatic Data Center: Washington, DC, USA, 2008; 164p.
- IPCC. 2013: Summary for Policymakers. Climate Change. The Physical Science Basis. Contribution of Working Group I to the Fifth Assessment Report of the Intergovernmental Panel on Climate Change; Stocker, F.T., Qin, D., Plattner, G.-K., Tignor, M., Allen, S.K., Boschung, J., Nauels, A., Xia, Y., Bex, V., Midgley, P.M., Eds.; Cambridge University Press: Cambridge, UK; New York, NY, USA, 2013. [Google Scholar]
- Luber, G.; Knowlton, K.; Balbus, J.; Frumkin, H.; Hayden, M.; Hess, J.; McGeehin, M.; Sheats, N.; Backer, L.; Beard, C.B.; et al. Ch. 9: Human Health. Climate Change Impacts in the United States: The Third National Climate Assessment; U.S. Global Change Research Program: Washington, DC, USA, 2014; pp. 220–256.
- Sylla, M.B.; Nikiema, P.M.; Gibba, P.; Kebe, I.; Klutse, N.A.B. Climate Change over West Africa: Recent Trends and Future Projections. In Adaptation to Climate Change and Variability in Rural West Africa; Springer: Berlin/Heidelberg, Germany, 2016. [Google Scholar]
- Diedhiou, A.; Bichet, A.; Wartenburger, R.; Seneviratne, S.I.; Rowell, D.P.; Sylla, M.B.; Kane, N.A. Changes in climate extremes over West and Central Africa at 1.5 °C and 2 °C global warming. Environ. Res. Lett. 2018, 13, 6. [Google Scholar] [CrossRef]
- Klutse, N.A.B.; Ajayi, V.O.; Gbobaniyi, E.O.; Egbebiyi, T.S.; Kouadio, K.; Nkrumah, F.; Lawal, K. Potential impact of 1.5 °C and 2 °C global warming on consecutive dry and wet days over West Africa. Environ. Res. Lett. 2018, 13, 055013. [Google Scholar] [CrossRef] [Green Version]
- Janicot, S.; Thorncroft, C.D.; Ali, A.; Asencio, N.; Berry, G.; Bock, O.; Bourles, B.; Caniaux, G.; Chauvin, F.; Deme, A.; et al. Large-scale overview of the summer monsoon over West Africa during the AMMA field experiment in 2006. Ann. Geophys. Eur. Geosci. Union 2008, 26, 2569–2595. [Google Scholar] [CrossRef] [Green Version]
- Fontaine, B.; Janicot, S.; Moron, V. Rainfall anomaly patterns and wind field signals over West Africa in August (1958–1989). J. Clim. 1995, 8, 1503–1510. [Google Scholar] [CrossRef]
- Grist, J.P.; Nicholson, S.E. A study of the dynamic factors influencing the rainfall variability in the West African Sahel. J. Clim. 2001, 14, 1337–1359. [Google Scholar] [CrossRef]
- Lavaysse, C.; Flamant, C.; Janicot, S.; Parker, D.J.; Lafore, J.P.; Sultan, B.; Pelon, J. Seasonal evolution of the West African heat low: A climatological perspective. Clim. Dyn. 2009, 33, 313. [Google Scholar] [CrossRef]
Figure 1.
Topography (m) of the simulation domain (West Africa) and the considered subdomains (western Sahel, central Sahel and the Guinea Coast) from the Regional Climate Model RegCM4.
Figure 1.
Topography (m) of the simulation domain (West Africa) and the considered subdomains (western Sahel, central Sahel and the Guinea Coast) from the Regional Climate Model RegCM4.

Figure 2.
Mean summer surface temperature (left) and rainfall (mm/day) (right) averaged from 1980 to 2009 over West Africa: (a) ERA-Interim, (b) Global Precipitation Climatology Project (GPCP), (c,d) RegCM4, (e) RegCM4–ERA-Interim and (f) Relative bias of RegCM4 with respect to GPCP from June to September (JJAS).

Figure 3.
Interannual variability of June to September (JJAS) rainfall and surface temperature normalized anomalies from 1980 to 2009 for the RegCM4 model over West Africa (20° W–20° E; 5° N–17.5° N).
Figure 3.
Interannual variability of June to September (JJAS) rainfall and surface temperature normalized anomalies from 1980 to 2009 for the RegCM4 model over West Africa (20° W–20° E; 5° N–17.5° N).

Figure 4.
Annual cycle of monthly surface temperature (left) and precipitation (right) from RegCM4 model averaged over: (a,b) the western Sahel, (c,d) the central Sahel and (e,f) the Guinea coast for the averages of the warmest years and the coldest years.
Figure 4.
Annual cycle of monthly surface temperature (left) and precipitation (right) from RegCM4 model averaged over: (a,b) the western Sahel, (c,d) the central Sahel and (e,f) the Guinea coast for the averages of the warmest years and the coldest years.

Figure 5.
Sensible heat flux (left) and latent heat flux (right) from RegCM4 model, June to September (JJAS) mean: (a,b) average of the warmest years, (c,d) average of the coldest years (e,f) differences between the average of the warmest years and the average of the coldest years.
Figure 5.
Sensible heat flux (left) and latent heat flux (right) from RegCM4 model, June to September (JJAS) mean: (a,b) average of the warmest years, (c,d) average of the coldest years (e,f) differences between the average of the warmest years and the average of the coldest years.

Figure 6.
Climate indices over West Africa from RegCM4 model: (average of the warmest years—average of the coldest years) for JJAS mean; (a) the number of rainy days (R1mm), (b) the consecutive wet days (CWD), and (c) the consecutive dry days (CDD).
Figure 6.
Climate indices over West Africa from RegCM4 model: (average of the warmest years—average of the coldest years) for JJAS mean; (a) the number of rainy days (R1mm), (b) the consecutive wet days (CWD), and (c) the consecutive dry days (CDD).

Figure 7.
Climate indices over West Africa from the RegCM4 model (Average of the warmest years—Average of the coldest years) for JJAS mean; (a) the very warm days (TX90P), (b) the warm nights (TN90P), and (c) the warm spell days index (WSDI).
Figure 7.
Climate indices over West Africa from the RegCM4 model (Average of the warmest years—Average of the coldest years) for JJAS mean; (a) the very warm days (TX90P), (b) the warm nights (TN90P), and (c) the warm spell days index (WSDI).

Figure 8.
June to September (JJAS) zonal wind anomalies from the RegCM4 model over West Africa: difference between the average of the warmest years and the average of the coldest years, (a) at 925 hPa; (b) at 700 hPa and (c) at 200 hPa.
Figure 8.
June to September (JJAS) zonal wind anomalies from the RegCM4 model over West Africa: difference between the average of the warmest years and the average of the coldest years, (a) at 925 hPa; (b) at 700 hPa and (c) at 200 hPa.

Figure 9.
Averaged June to September (JJAS) of the vertical velocity over the Sahel for the warmest years and the coldest years from RegCM4.
Figure 9.
Averaged June to September (JJAS) of the vertical velocity over the Sahel for the warmest years and the coldest years from RegCM4.


Table 1.
Definition of climate indices [22].
Table 1.
Definition of climate indices [22].
| Indices | Indices Abbreviate | Unit |
|---|---|---|
| Number of days with daily cumulative precipitation greater than 1mm (number of wet days: R > 1 mm) | R1mm | Days |
| Maximum length of the consecutive wet days with daily rainfall greater than 1 mm (maximum wet spell length) | CWD | Days |
| Maximum length of the consecutive dry days with daily rainfall below 1 mm (maximum dry spell length) | CDD | Days |
| Percentage of days with daily TX (maximum temperature) > 90th percentile on running 5 day windows (=very warm days) | TX90P | % |
| Percentage of days with daily TN (minimum temperature) > 90th percentile on running 5 day windows (=warm nights) | TN90P | % |
| Warm spell duration index: Annual count of days with at least 6 consecutive days when TX > 90th percentile | WSDI | Days |
© 2019 by the authors. Licensee MDPI, Basel, Switzerland. This article is an open access article distributed under the terms and conditions of the Creative Commons Attribution (CC BY) license (http://creativecommons.org/licenses/by/4.0/).
Share and Cite
MDPI and ACS Style
Diba, I.; Camara, M.; Diedhiou, A. Investigating West African Monsoon Features in Warm Years Using the Regional Climate Model RegCM4. Atmosphere 2019, 10, 23. https://doi.org/10.3390/atmos10010023
AMA Style
Diba I, Camara M, Diedhiou A. Investigating West African Monsoon Features in Warm Years Using the Regional Climate Model RegCM4. Atmosphere. 2019; 10(1):23. https://doi.org/10.3390/atmos10010023
Chicago/Turabian StyleDiba, Ibrahima, Moctar Camara, and Arona Diedhiou. 2019. "Investigating West African Monsoon Features in Warm Years Using the Regional Climate Model RegCM4" Atmosphere 10, no. 1: 23. https://doi.org/10.3390/atmos10010023
Note that from the first issue of 2016, this journal uses article numbers instead of page numbers. See further details here.