the Creative Commons Attribution 4.0 License.
the Creative Commons Attribution 4.0 License.
 | 18 Jun 2018
Technical note: A low-cost albedometer for snow and ice measurements – theoretical results and application on a tropical mountain in Bolivia
Thomas Condom
Marie Dumont
Lise Mourre
Jean Emmanuel Sicart
Antoine Rabatel
Alessandra Viani
Alvaro Soruco
This study presents a new instrument called a low-cost albedometer (LCA) composed of two illuminance sensors that are used to measure in situ incident and reflected illuminance values on a daily timescale. The ratio between reflected vs. incident illuminances is called the albedo index and can be compared with actual albedo values. Due to the shape of the sensor, the direct radiation for zenith angles ranging from 55 to 90∘ is not measured. The spectral response of the LCA varies with the solar irradiance wavelengths within the range 0.26 to 1.195 µm, and the LCA detects 85 % of the total spectral solar irradiance for clear sky conditions. We first consider the theoretical results obtained for 10 different ice and snow surfaces with clear sky and cloudy sky incident solar irradiance that show that the LCA spectral response may be responsible for an overestimation of the theoretical albedo values by roughly 9 % at most. Then, the LCA values are compared with two “traditional” albedometers, which are CM3 pyranometers (Kipp & Zonen), in the shortwave domain from 0.305 to 2.800 µm over a 1-year measurement period (2013) for two sites in a tropical mountainous catchment in Bolivia. One site is located on the Zongo Glacier (i.e., snow and ice surfaces) and the second one is found on the crest of the lateral moraine (bare soil and snow surfaces), which present a horizontal surface and a sky view factor of 0.98. The results, at daily time steps (256 days), given by the LCA are in good agreement with the classic albedo measurements taken with pyranometers with R2=0.83 (RMSD = 0.10) and R2=0.92 (RMSD = 0.08) for the Zongo Glacier and the right-hand side lateral moraine, respectively. This demonstrates that our system performs well and thus provides relevant opportunities to document spatiotemporal changes in the surface albedo from direct observations at the scale of an entire catchment at a low cost. Finally, during the period from September 2015 to June 2016, direct observations were collected with 15 LCAs on the Zongo Glacier and successfully compared with LANDSAT images showing the surface conditions of the glacier (i.e., snow or ice). This comparison illustrates the efficiency of this system to monitor the daily time step changes in the snow and ice coverage distributed on the glacier. Despite the limits imposed by the angle view restrictions, the LCA can be used between 45∘ N and 45∘ S during the ablation season (spring and summer) when the melt rate related to the albedo is the most important.


Albedo is a key variable controlling the surface energy balance through the shortwave radiation budget. Documenting the spatiotemporal changes in this variable is a major concern in hydrological modeling, particularly in mountainous regions where the seasonal snow and glacier covers induce significant and rapid changes in the surface state with subsequent impacts on the energy budget. Hereafter, the spectral albedo is defined as the ratio between the amount of energy reflected by the surface and the incident energy for each wavelength of the solar spectrum (between 0.3 and 2.5 µm), and the broadband albedo is the integration of the spectral albedo weighted by the incident energy over the entire solar spectrum (0.3-2.5 µm). The amount of shortwave radiation absorbed by the surface depends on the spectral and angular distribution of the incident shortwave radiation and the surface characteristics, both of which are highly variable in space and time (Stroeve et al., 1997; Klok et al., 2003). Clouds alter the angular and spectral properties of the incident radiation. With respect to the snow and ice surfaces, the albedo in the visible wavelength depends on the snow and ice properties, the impurity amount (e.g., black carbon, dust, algae, etc.), and the snow depth for the shallow snowpack. In the infrared portion of the spectrum, the albedo is mainly controlled by the snow microstructure and is moderately sensitive to the solar zenith angle (Warren, 1982). Liquid water and land have relatively low albedos (roughly 0.1 to 0.4), while snow and ice have higher albedos that can typically reach 0.9 for fresh snow. It is still challenging to measure the temporal and spatial changes in the surface albedo from the scale of specific points up to a regional scale. Different methods are commonly used to retrieve albedo values from satellite images, ground photographs, or point measurements with pyranometers. Satellite-derived albedo maps provide spatially continuous datasets but are limited to clear sky conditions; these maps may contain significant uncertainties, especially over complex topographies (Stroeve et al., 1997; Klok et al., 2003; Dumont et al., 2012), and provide averaged data over a pixel size of hundreds of square meters. Ground photography using pairs of photographs in the visible and infrared wavelengths is used to collect albedo maps that have a higher spatial resolution than satellite images but which are limited by cloudy conditions, the possible masking of the relief, an irregular grid due to the projection, and more complex ortho-rectification processes in mountainous regions (e.g., Corripio, 2004; Dumont et al., 2011). Finally, direct in situ snow and ice albedo measurements are sparse, relatively expensive, often discontinuous, and may contain large uncertainties if the sensor is not regularly checked (Sicart et al., 2001; van den Broeke et al., 2004).
A study published by Brock et al. (2000) aimed to document the spatial and temporal variations of surface albedo on the Haut Glacier d'Arolla, Switzerland during the 1993 and 1994 ablation seasons (from mid-May to the end of August). They used a traditional Kipp & Zonen CM7B albedometer (that is expensive) and relied on the temporal variations of albedo with surface conditions as snow depth, surface snow density, and surface snow grain size. One of their conclusions underlined the importance of conducting in situ field measurements continuously at a daily timescale across a glacier throughout the ablation season, as the measurements are crucial to developing albedo parameterization into hydro-glaciological models.
This article analyzes the efficiency of a low-cost albedometer (hereafter called LCA) that measures the time series of in situ incident and reflected illuminance values that are used to calculate an accurate proxy of the albedo values called the albedo index. The illuminance is the total luminous flux incident on a surface per unit area. It is a measure of how much the incident light illuminates the surface, wavelength-weighted by the luminosity function to correlate with the human perception of brightness. In Sect. 2, we present the characteristics of and uncertainties in the LCA measurements along with a comparison with the theoretical values for 10 different ice and snow states and for two different incident irradiance spectra (cloudy or clear sky). Then, Sect. 3 presents two experiments carried out on a high-altitude tropical mountain site in Bolivia (Zongo glacierized catchment). A first application for punctual in situ measurements validates the LCA in the field via a comparison with traditional radiometers for two contrasting surfaces: snow and ice on the glacier or snow and bare soil on the moraine. After that, a second application on the same glacier documents the snow–ice changes on the surface of the glacier during the period that extends from September 2015 to June 2016.
Table 1Characteristics of the HOBO® Pendant Temperature/Light Data Logger as per the manufacturer.
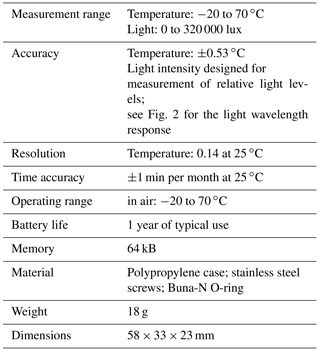
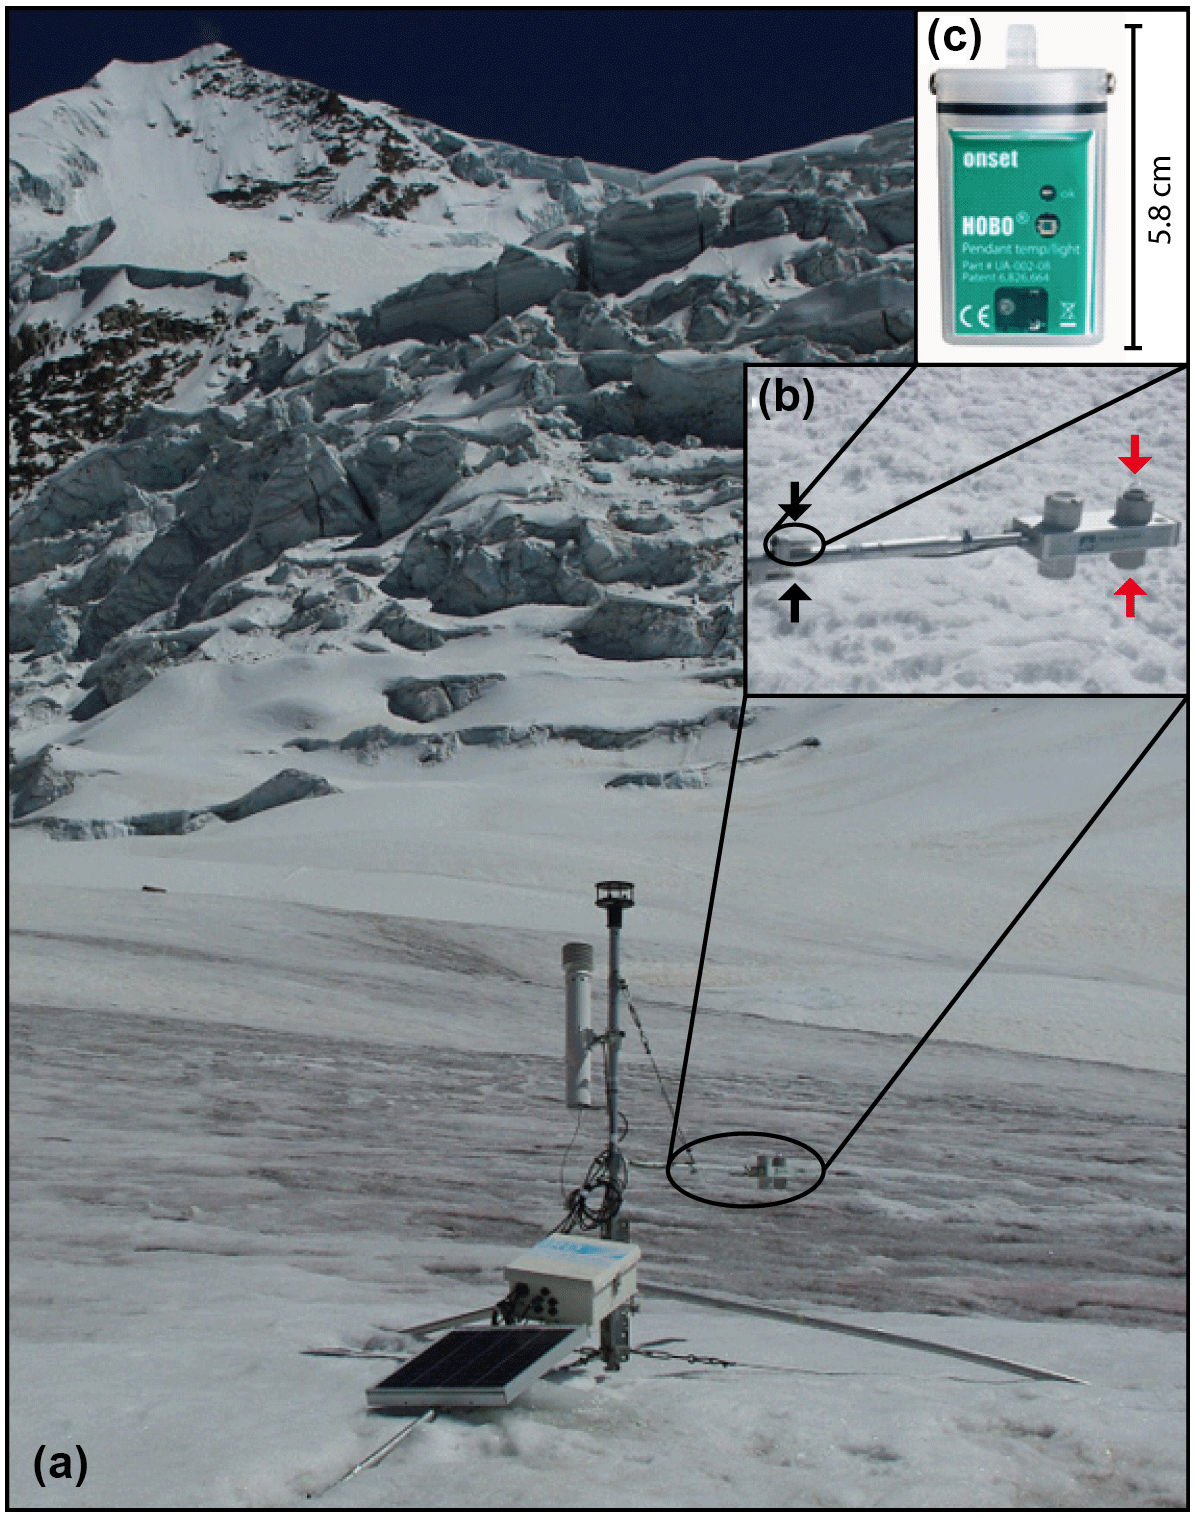
Figure 1(a) Meteorological station on the Zongo Glacier; (b) CNR1 radiometer (Kipp & Zonen) installed at the SAMA meteorological station (the CM3 pyranometers are the two sensors on the right, red arrows) and the LCA comprised of two HOBO® Pendant Temperature/Light Data Loggers (black arrows); (c) zoomed-in view of a HOBO® Pendant Temperature/Light Data Logger (see Table 1 for detailed characteristics).
The LCA is comprised of two HOBO® Pendant Temperature/Light Data Loggers: one for the incident illuminance and the other for the reflected illuminance (Fig. 1). The sensor characteristics are given in Table 1. This sensor measures the illuminance in lux and the measurement range is between 0 and 320 000 lux. The lux quantifies the light incident flux per unit area. One lux equals one lumen per square meter with a uniform distribution. In photometry, this unit is used as a measure of the intensity of the light hitting or passing through a surface as perceived by the human eye. The illuminance may be related to an energy quantified in watts per square meter (W m−2), but the conversion factor differs depending on the wavelength considered according to the luminosity function, a standardized model of the human visual perception of brightness. As a consequence, the illuminance depends on the spectral distribution of the incident light. Due to its operating temperature range (see Table 1), the use of the LCA is limited at very cold locations where the temperature continuously falls below −20 ∘C for long periods of time. However, this may not be too critical since the main purpose of the device is to document albedo surface changes during melt periods when such low temperature conditions are not typical.
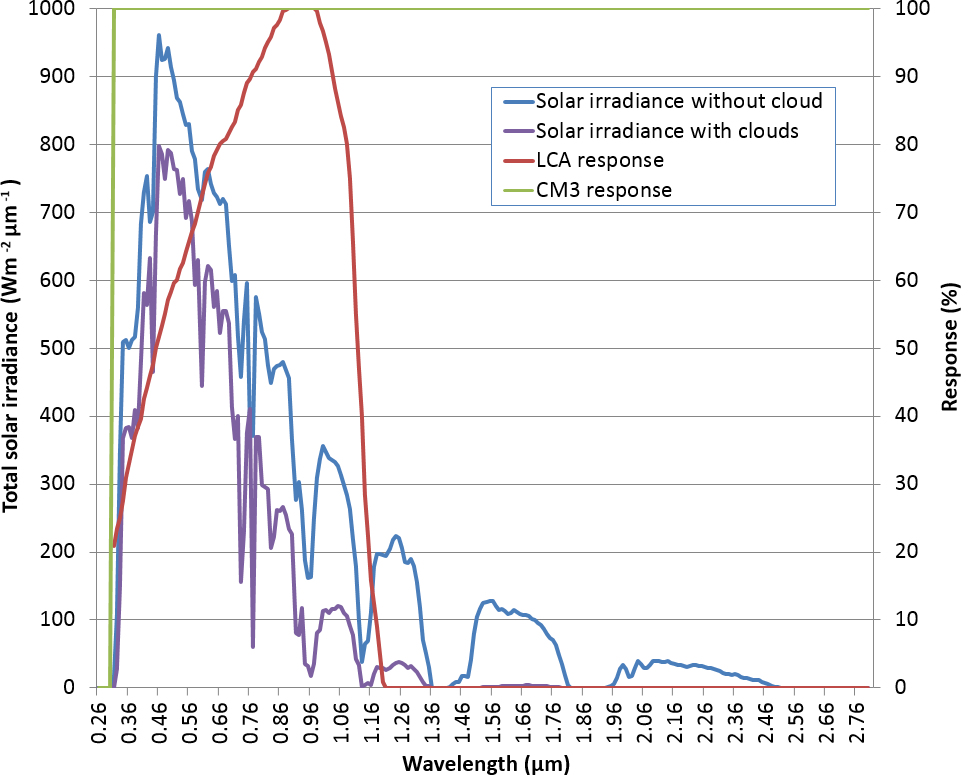
Figure 2HOBO® Pendant Temperature/Light Data Logger and CM3 responses as a function of the wavelength and two examples of total solar irradiances for a clear sky (in blue) and for a cloudy sky (in purple) given by the DISORT model (Stamnes et al., 1988; W m−2 µm−1).
The spectral range of the HOBO® Pendant Temperature/Light Data Logger is 0.26 to 1.195 µm (see Fig. 2). The spectral response of the sensor represents the amount of incoming signal recorded by the sensor for any given wavelength and is reported in Fig. 2. This figure shows that the spectral response of the sensor increases from 20 to 100 % between 0.26 and 0.915 µm and then decreases until the upper limit of the sensor sensitivity (i.e.. 1.195 µm). The sensor detects roughly 85 % of the total solar irradiance for clear sky conditions (Fig. 2). Laboratory tests conducted with a goniometer showed that the HOBO® Pendant Temperature/Light Data Logger cannot measure the irradiance for incident zenith angles ranging from 55 to 90∘ (±2∘, where 0∘ is the vertical illumination). This is due to the design of the sensor (Fig. 1c). Traditionally, the in situ albedo is measured using a CM3 pyranometer (Kipp & Zonen) in the shortwave domain from 0.305 to 2.800 µm (Fig. 1b). The CM3 is part of the CNR1/CNR4 net radiometer, which is intended for the analysis of the radiation balance of solar and thermal infrared radiation. The design of the CM3 is such that the upward-facing and downward-facing sensors measure the energy received from the entire hemisphere (a field of view of almost 180 degrees). The output is expressed in W m−2. The CM3 sensor has a 100 % response for wavelengths between 0.305 and 2.8 µm (Fig. 2).

Figure 3Semi-infinite diffuse beam albedo of pure ice as a function of the effective air bubble radius (mm) with a constant effective bubble concentration mm−3. Here 0.3 mm−3 is the mean bubble concentration determined from 28 Greenland and Antarctica ice core samples (Gardner and Sharp, 2010); the semi-infinite diffuse beam albedo of dusty and pure snow is from DISORT modeling with or without dust and with a specific surface area (SSA) equal to 40 or 5 m2 kg−1 (Stamnes et al., 1988; Carmagnola et al., 2013). The red line shows the LCA response in percent.
It is noteworthy that the LCA contains an internal memory; this is not the case for the CM3 pyranometers, which need to be connected to an external module for data acquisition programming and data storage. The LCA cannot provide direct access to the albedo as its response is not constant depending on the wavelength in the solar spectrum. Finally, the conversion from illuminance to radiation in W m−2 is not straightforward since it depends on the spectral distribution of the incident and reflected light.
Figure 3 shows 10 simulated spectral albedo curves for different glacier surfaces: 4 for snow (with dusty or pure snow and with a specific surface area (SSA) equal to 5 or 40 m2 kg−1) and 6 for ice with different bubble concentrations (see Gardner and Sharp, 2010, for details). These 10 different surface types are used below to calculate the theoretical uncertainty of the LCA measurements.
In the visible domain, the spectral albedo of pure snow is high (0.95) and the albedo decreases in the infrared towards 0.1 for longer wavelengths (1.5–2 µm; Fig. 3). For dusty snow, the spectral albedo is lower than for pure snow. To calculate the uncertainty for the ice covers, we chose pure ice that only contains air bubbles and no impurity taken from the study of Gardner and Sharp (2010). In this case, all of the photon absorption events will occur within the ice and all of the scattering will occur at the ice–bubble boundaries, thereby neglecting all surface reflection as well as internal scattering and absorption by the interstitial air (Mullen and Warren, 1988; Warren et al., 2002).
Two types of incident radiation are tested (clear sky and cloudy conditions given by the SBDART model for the tropical Zongo latitude at 5000 m a.s.l., 23∘ solar zenith angle, 0.1 atmospheric optical depth; see Richiazzi et al., 1998, for details concerning the model). The cloudy conditions are fully overcast with an optical depth of 64.
The theoretical broadband albedo and LCA albedo indexes are calculated over the 0.205–3.9 µm range using the theoretical solar irradiance, the LCA spectral response from Fig. 2, and the semi-infinite diffuse beam albedo from Fig. 3. The total incident radiation flux for LCA, Sinc (in W m−2), is obtained by summing the theoretical incident radiation fluxes, Sinc-th(λ) (in W m−2 µm−1), weighted by the LCA response, Rλ(−), at each spectral increment of 5.10−3 µm for both cloudy and clear sky conditions (Eq. 1).
Similarly, the reflected radiation flux for the LCA, Sref (in W m−2), is obtained by summing the theoretical reflected radiation fluxes, Sref-th(λ) (in W m−2 µm−1), weighted by the LCA response, at each spectral increment of 5 µm for each snow or ice class considered (Eq. 2).
Then, the LCA albedo index, Albedoindex (-), is the ratio between the reflected and incident LCA radiation fluxes for each type of snow and ice surface and for cloudy or clear sky conditions (Eq. 3).
Finally, this LCA albedo index is compared with the theoretical broadband albedo when we consider the spectral variations. Note that the results are presented with the incoming radiation corresponding to the total solar irradiances for clear sky and cloudy sky conditions and without testing the effect of the angular limitation of the LCA.
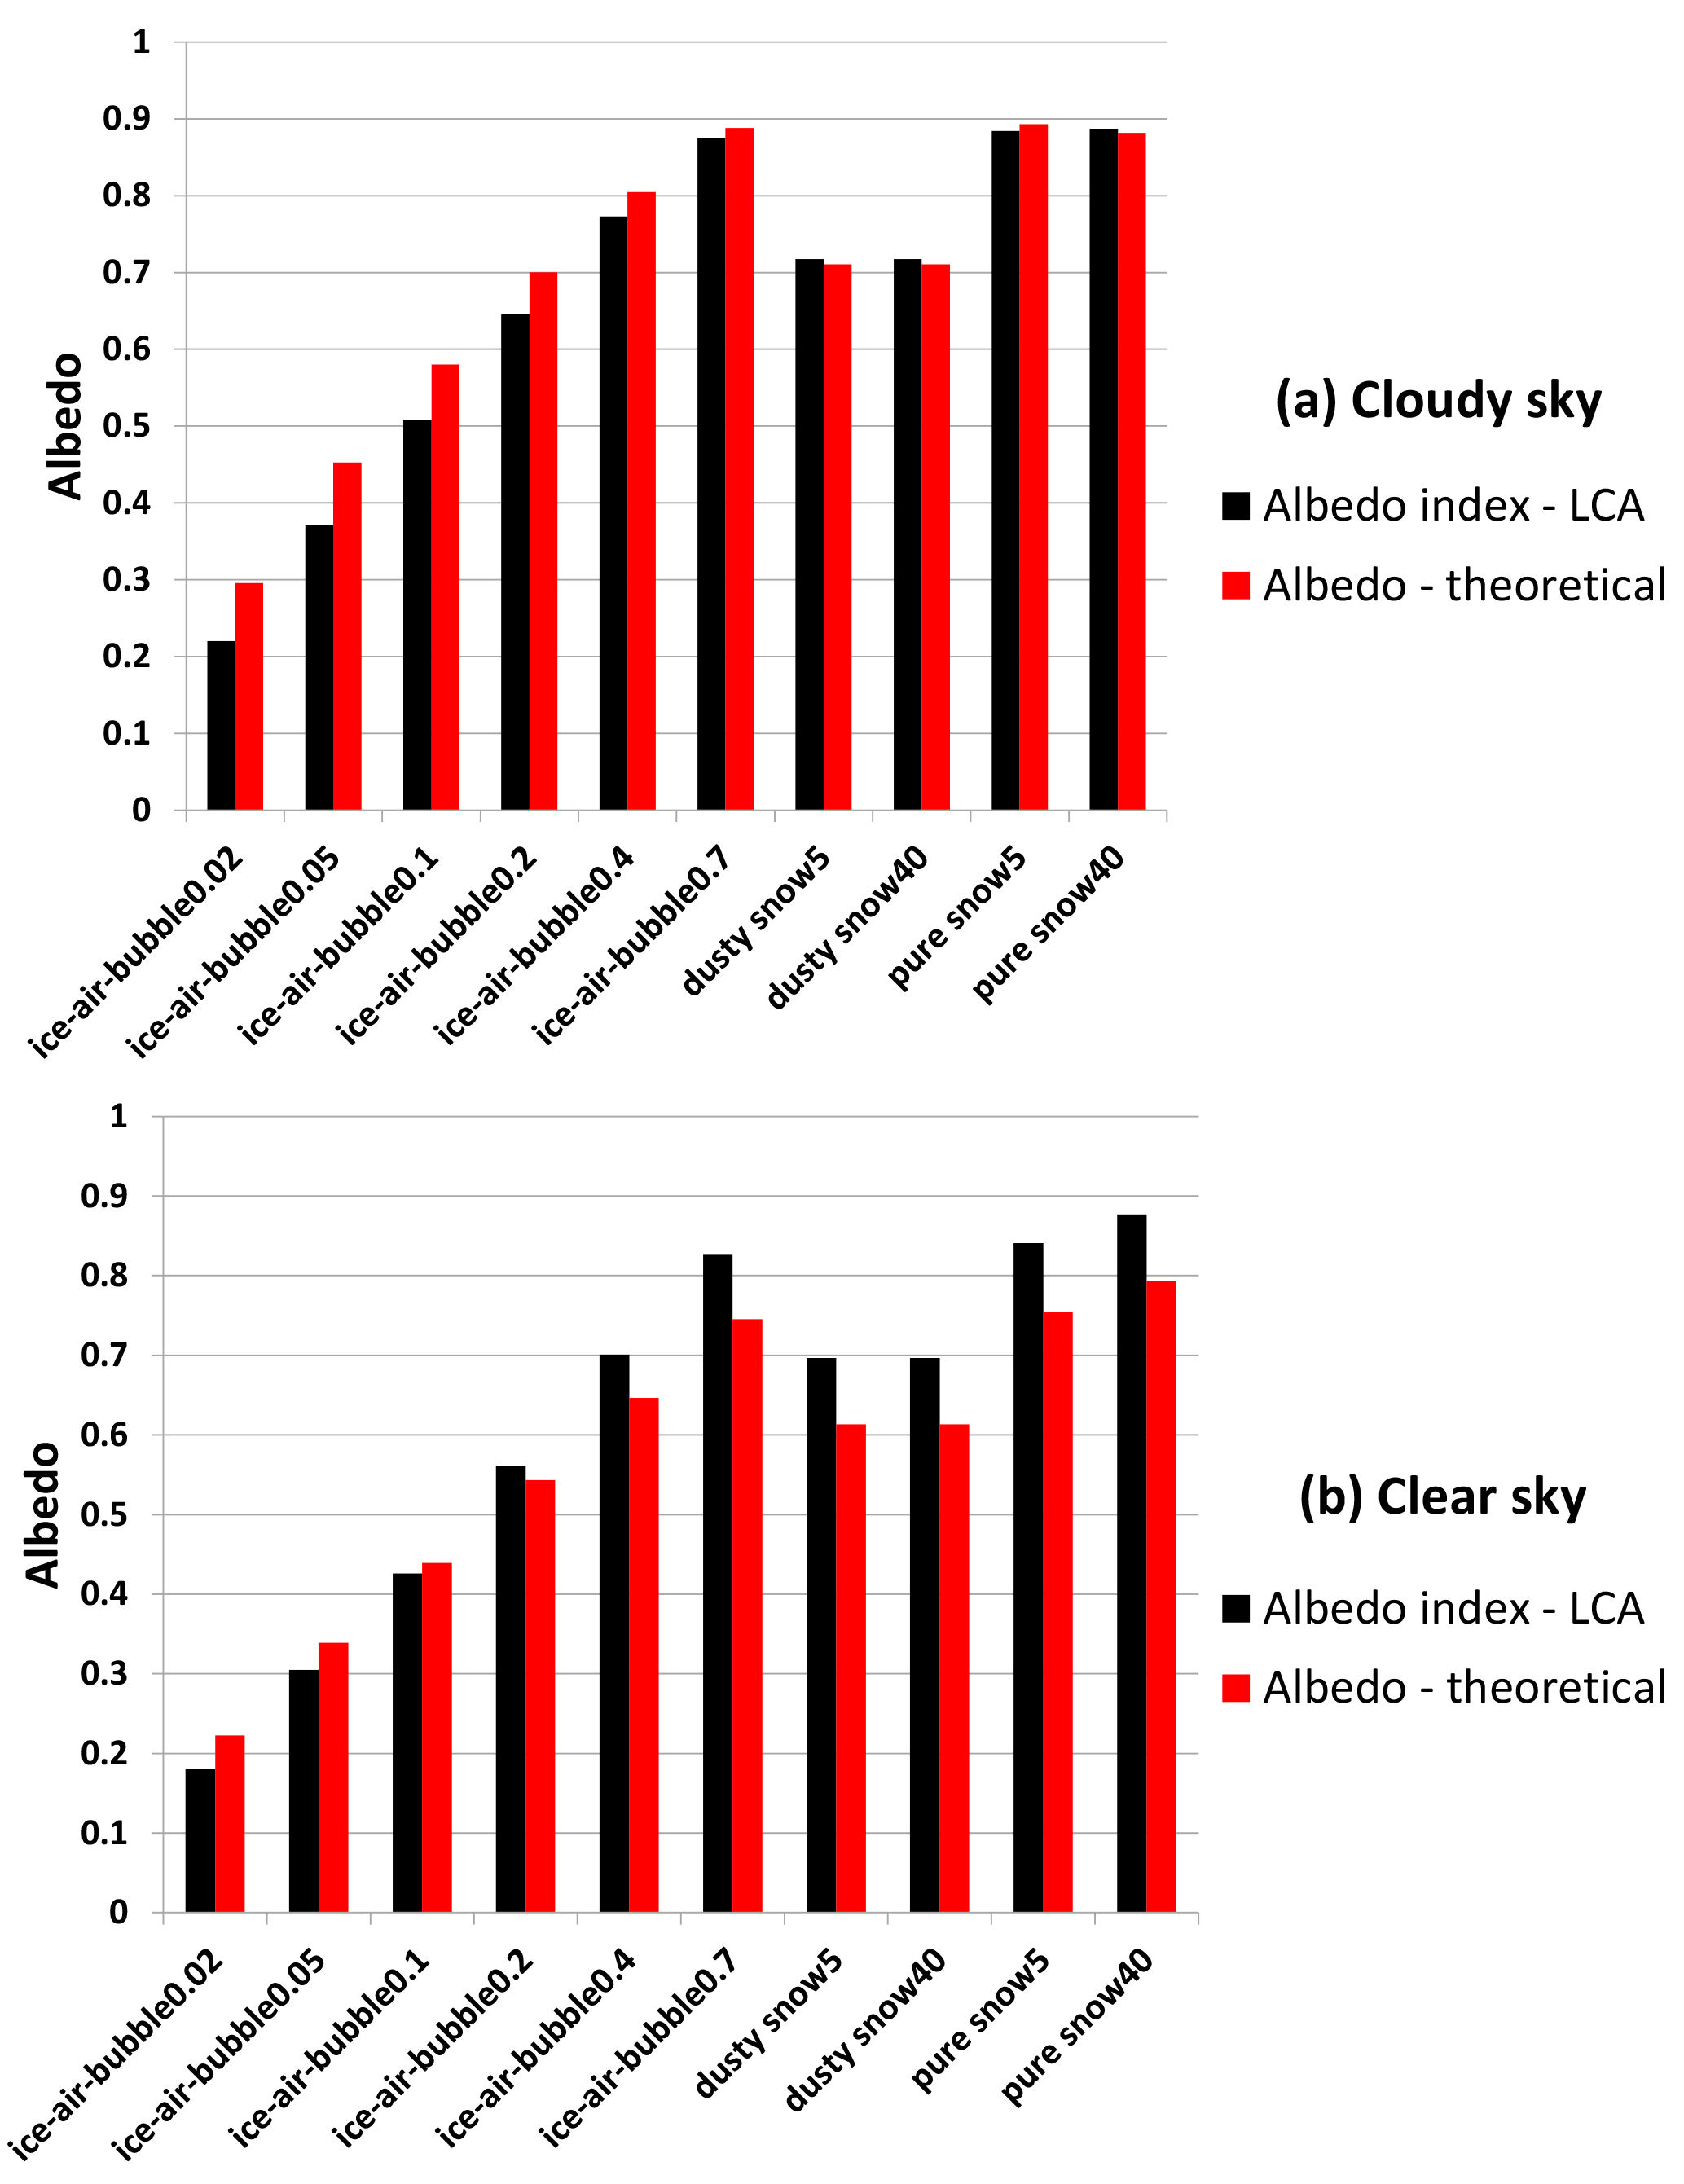
Figure 4Comparison between the theoretical semi-infinite diffuse beam broadband albedo and LCA albedo index theoretically estimated based on spectral response of the LCA for 10 different surfaces calculated with two kinds of total solar irradiance (see the text for the calculation). Cloudy sky (panel a) and clear sky (panel b) conditions (spectra are represented in Fig. 2). From left to right along the bottom axes: ice air bubble 0.02; ice air bubble 0.05; ice air bubble 0.1; ice air bubble 0.2; ice air bubble 0.4; ice air bubble 0.7; dusty snow SSA 5 m2 kg−1; dusty snow SSA 40 m2 kg−1; pure snow SSA 5 m2 kg−1; pure snow SSA 40 m2 kg−1.
Figure 4 compares the theoretical albedos and the LCA albedo index with the theoretical perfect albedo for the 10 surface configurations and for clear and cloudy skies. Slight differences exist for ice with a bubble radius between 0.02 and 0.2 mm with an underestimation of the LCA by 4 % for a clear sky. For ice with an air bubble radius of 0.4 or 0.7 mm and for the two snow types (dusty and pure), the LCA tends to overestimate the albedo by 8 % on average for clear sky conditions. The LCA tends to overestimate for albedo values higher than 0.5 (typically for snow) and to underestimate for low values (i.e., for ice). A better agreement between the theoretical albedos and the LCA albedo index is given in the cloudy case with an overall underestimation of 5 % compared with 9 % for the clear sky case. This is explained by the response of the LCA based on the wavelength, which is null for the 1.20–2.30 µm range (see Fig. 2).
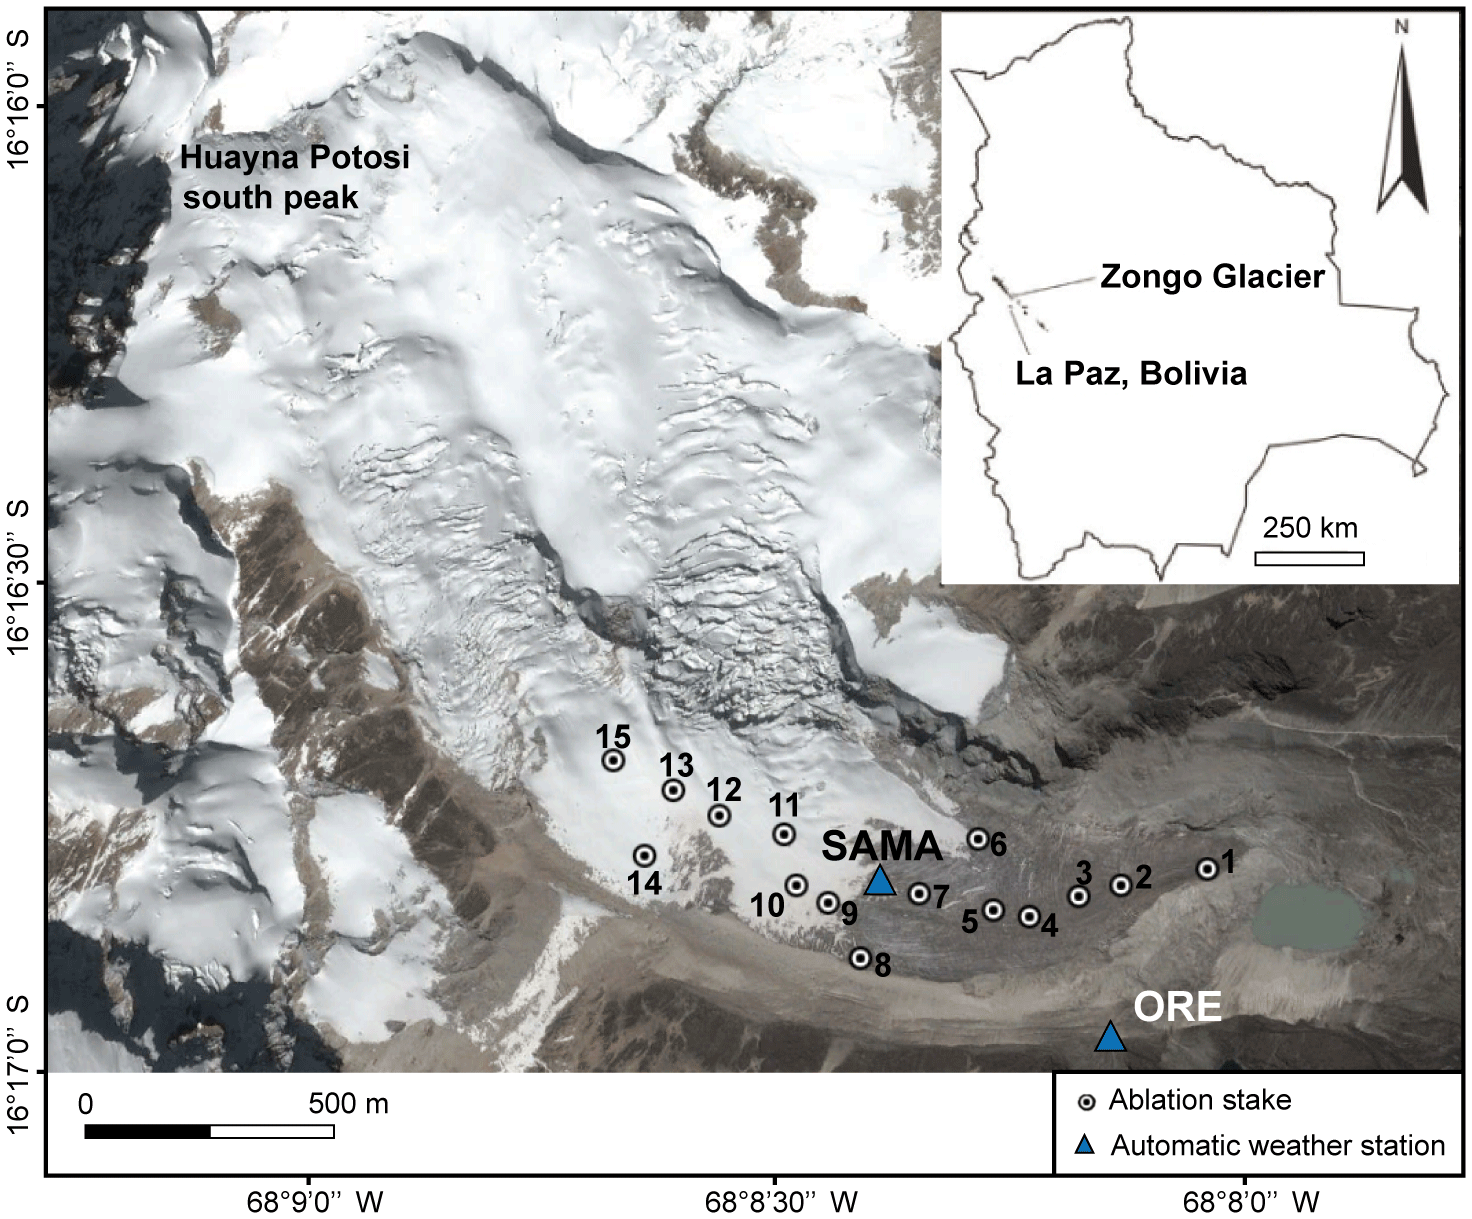
Figure 5Study site with the Zongo Glacier and the location of the meteorological stations: ORE (5050 m a.s.l.) outside of the glacier and SAMA (5056 m a.s.l.) on the glacier. The numbers indicate the position of each in situ LCA on ablation stakes.
The Zongo Glacier (16∘15′ S, 68∘10′ W) is located in the Bolivian Cordillera Real (Fig. 5) between the Altiplano Plateau in the west and the Amazon Basin in the east. In 2006, the glacier covered an area of 1.96 km2 extending from 6100 to 4900 m a.s.l. (Rabatel et al., 2012). For the whole glacier, the main precipitation type is solid and the albedo increases after each snowfall with a snow line that could reach the front of the glacier. After that, during dry consecutive days the snow line rises up due to the snow melting processes. The Bolivian Cordillera Real is located in the outer tropical zone, which forms a transition zone between the tropics (continuously humid conditions) and the subtropics (dry conditions). The climate of the outer tropics is characterized by low seasonal temperature variability, high solar radiation influx all year round, and marked seasonal humidity and precipitation. The hydrological year (from 1 September to 31 August) can be divided into three periods: (1) September–December, with a progressive increase in moisture and precipitation; (2) January–April, which is the core period of the rainy season (approximately two-thirds of the total annual precipitation); and (3) May–August, when dry conditions prevail (e.g., Sicart et al., 2011). However, precipitation can also occur during the dry period due to Southern Hemisphere midlatitude disturbances that track much further north of their usual path (e.g., Vuille and Ammann, 1997; Sicart et al., 2016).
Two contrasting sites with different characteristics were chosen in order to evaluate the efficiency of the LCA (Fig. 5). These two sites belong to the GLACIOCLIM observatory (https://glacioclim.osug.fr/, last access: 15 March 2018), which has maintained a permanent glacio-meteo-hydrological monitoring program on the Zongo Glacier since 1991 (Rabatel et al., 2013). The SAMA station is an automatic weather station (AWS) located on the Zongo Glacier (Figs. 1, 5) and the ORE station is a similar AWS located on the crest of the lateral moraine. In order to capture the sky view for each station, ORE and SAMA, a digital elevation model (DEM) at 30 m resolution taken from ASTER images (Tachikawa et al., 2011) was used. The sky view factor, which is the fraction of the celestial hemisphere visible from the surface defined by the local slope, was calculated with the SAGA GIS software (System for Automated Geoscientific Analyses, version 2.0.8) using the code provided by Boehner and Antonic (2009). The sky view factors obtained are 0.92 and 0.98 for the SAMA and ORE stations, respectively.
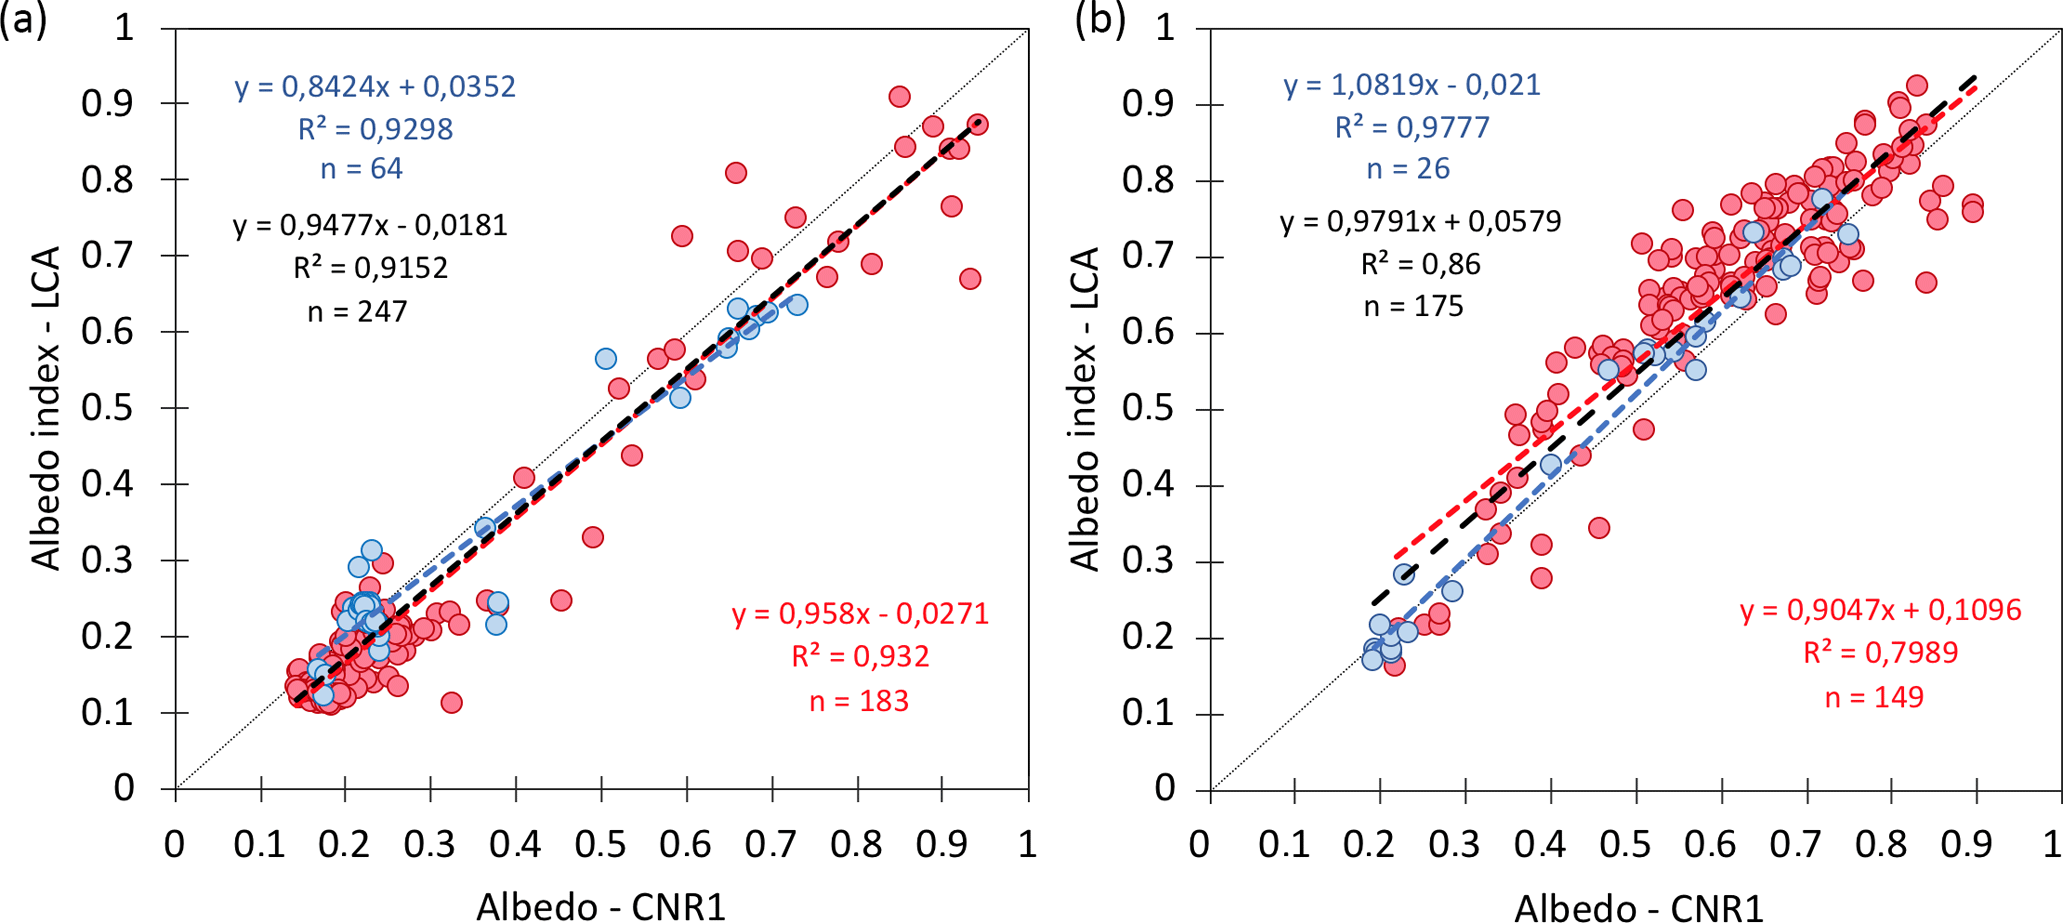
Figure 6(a) Comparison of the daily measured albedo at the ORE site using the CNR1 radiometer and the LCA for the period from 7 November 2012 to 6 March 2013; daily data calculated from 11:00 to 15:00; RMSD = 0.1; n = 247. (b) Comparison of the daily measured albedo at the SAMA site on the Zongo Glacier using the CM3 sensor and LCA for the period from 1 December 2012 to 9 October 2013; daily data calculated from 11:00 to 15:00; RMSD = 0.08; n = 175. The red dots are for cloudy conditions and the white dots are for sunny conditions, as per the classification given by Sicart et al. (2016). The calculated regression lines are shown in red for cloudy conditions, blue for sunny conditions, and black for all conditions. The dotted lines represent the bisectors.
Considering the limited field of view of the HOBO® Pendant Temperature/Light Data Logger, daily albedo values are calculated between 11:00 and 15:00 local time, ensuring that direct solar irradiance is caught by the two sensors. The albedo index is calculated in two steps: (i) the sum of the hourly data for the incident illuminance and the reflected illuminance between 11:00 and 15:00 and (ii) the calculation of the daily albedo index by dividing the sum of reflected values by the sum of incident illuminance values. The time series used for the ORE and SAMA stations are 7 November 2012–6 March 2013 and 1 December 2012–9 October 2013, respectively. Figure 6a and b show the comparison between the CM3 albedo and LCA albedo indexes for the daily values that range between 0.15 (dirty ice or bare soil) and 0.95 (fresh snow).
At the ORE site (Fig. 6a), two groups of points can be distinguished. The lower group (albedo close to 0.25) corresponds to measurements over bare soil. For the second group, the broadband albedo and albedo indexes range from 0.3 to 0.9, corresponding to several snow cover conditions: (i) thin and dirty snow; (ii) homogeneous fresh snow; and (iii) patchy snow covers. There is good agreement between the CM3 broadband albedos and LCA broadband albedo indexes (R2=0.90 and RMSD = 0.08, with 256 days). The distribution for the albedos at the SAMA site (Fig. 6b) is more homogeneous. For the SAMA site, the albedo variations are due to surface changes from ice to fresh snow. At this second site, there is also good agreement between the CM3 and LCA albedo (R2=0.93 and RMSD = 0.08, with 256 days).
The measurements are separated into two groups according to the sky conditions, cloudy or sunny, as per the classification provided by Sicart et al. (2016). If we consider the theoretical results from Sect. 2, the LCA should give better results for cloudy conditions; however, there are not enough measurements for clear sky conditions compared with the number of measurements for cloudy conditions to be able to come to a conclusion. In both cases, the LCA tends to slightly overestimate the albedo values by 5 %. This result is in good agreement with the theoretical results presented in Sect. 2 (Fig. 4), showing that the LCA tends to overestimate the theoretical albedo values for ice with bubbles and snow by less than 10 %. The results are in good agreement with the theoretical results obtained in Sect. 2, with an overestimation for the high albedos and an underestimation for the low albedos.
Table 2Date of the LANDSAT images used in the present study (path 001, row 071; images from the website: https://landsatlook.usgs.gov/viewer.html, last access: 15 March 2018).
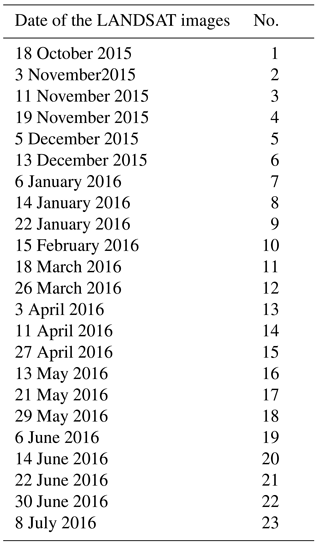
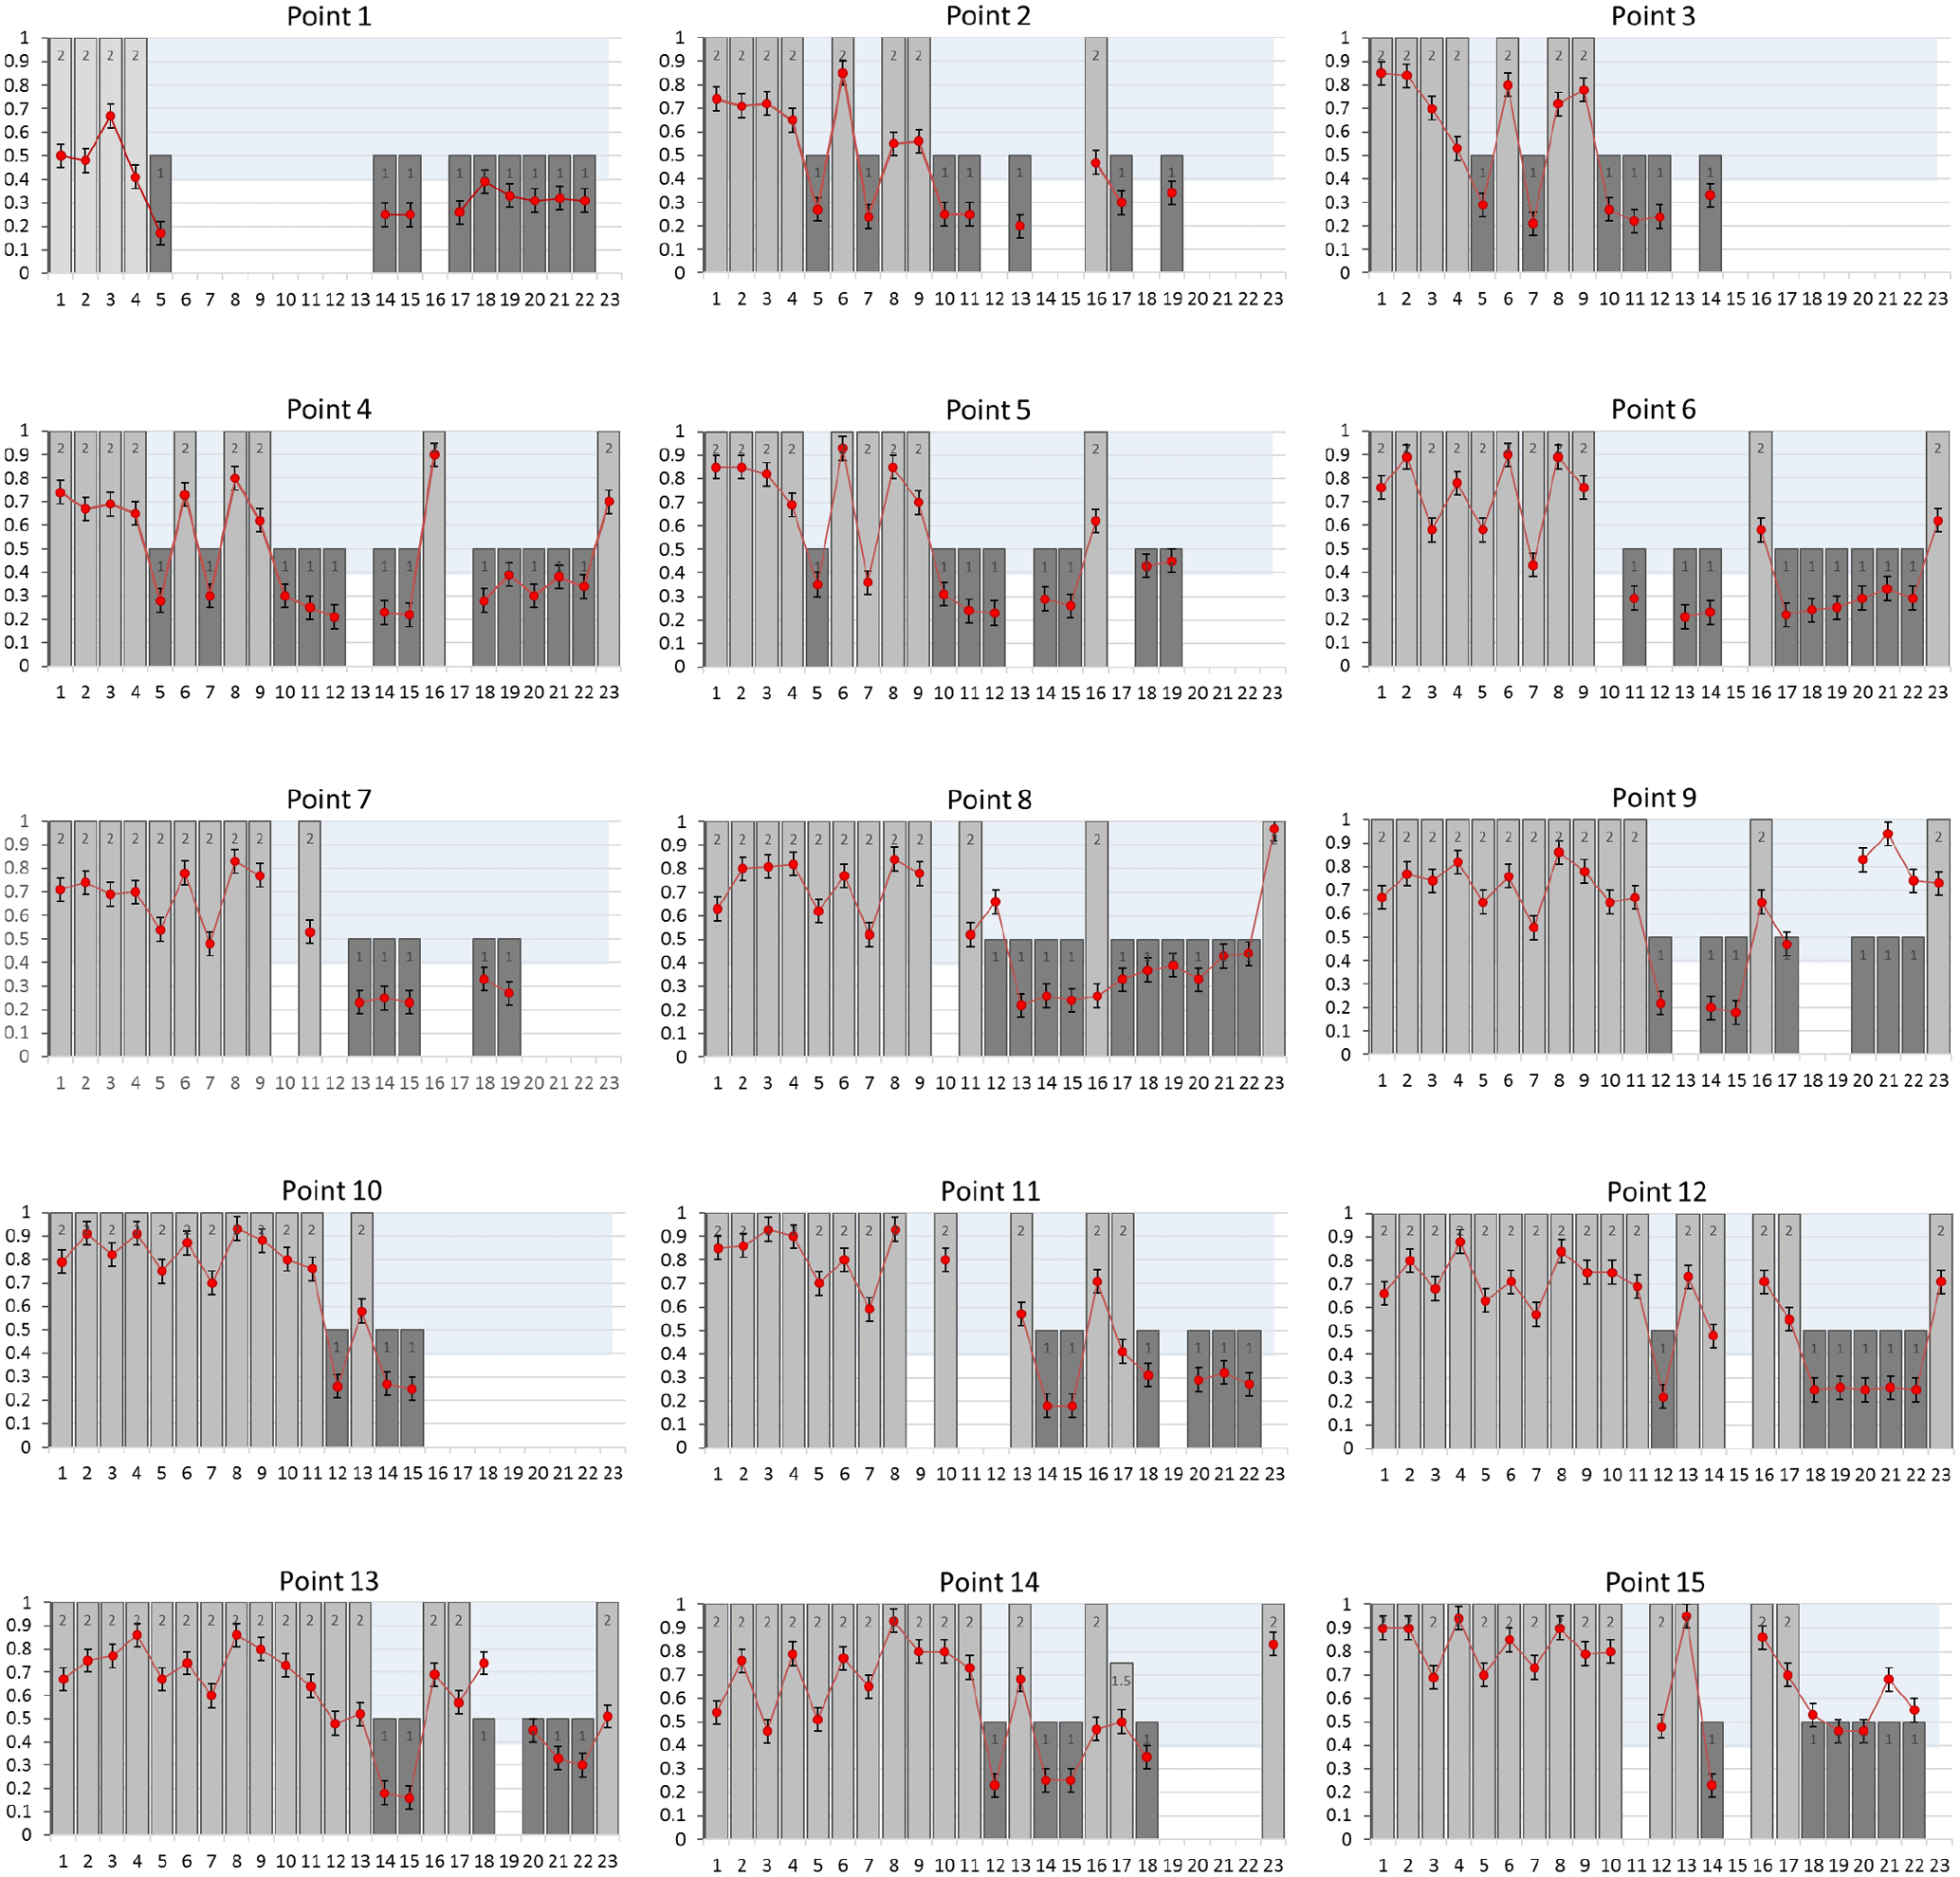
Figure 7Comparison between the LCA measurements and the 23 LANDSAT images (from 18 October 2015 to 30 June 2016, the numbers for the x axis are the image numbers; see Table 2 for the correspondence) for the 15 points on the Zongo Glacier (see Fig. 5 for the locations of the LCA). The red points represent the albedo index value calculated with the LCA and the grey bars indicate the surface state for the corresponding pixel (1: ice and 2: snow). A value of 1.5 was chosen for stake number 14 as the pixel showed patchy snow cover.
After the comparison between the CM3 and LCA, a second field experiment was carried out in order to determine the spatiotemporal variability of the snow cover on the Zongo Glacier during the period from 21 September 2015 to 30 June 2016. Fifteen LCA stations were installed on ablation stakes distributed in the lower and middle part of the glacier at altitudes ranging between 4929 and 5184 m a.s.l. (Fig. 5). In order to evaluate whether the LCA provides coherent information on the spatiotemporal changes in the surface state of the glacier (fresh snow, old snow, ice), we compared the LCA data with information retrieved from the LANDSAT images. With regards to the LANDSAT images (30 m resolution), we first selected, within the archive, the cloud-free images recorded within the period when the LCA data were available (a list of the 23 images used here is provided in Table 2). On the LANDSAT images, we used a spectral band combination involving green, near-infrared (NIR), and middle infrared (MIR) wavelengths (spectral bands 2, 4, and 5 for LANDSAT images 5 and 7), which are used to make a clear differentiation between snow and ice surfaces (Rabatel et al., 2012). Then, according to the values in the NIR and MIR bands, the pixels where the LCA are located were classified as snow covered (value of 2 in Fig. 7) or ice covered (value of 1 in Fig. 7). In one case, the chosen value was 1.5 as the pixel showed patchy snow cover. This can be explained if we consider that the spatial resolution of the LANDSAT is equal to 900 m2 and the surface view by the sensor is less than 1 m2.
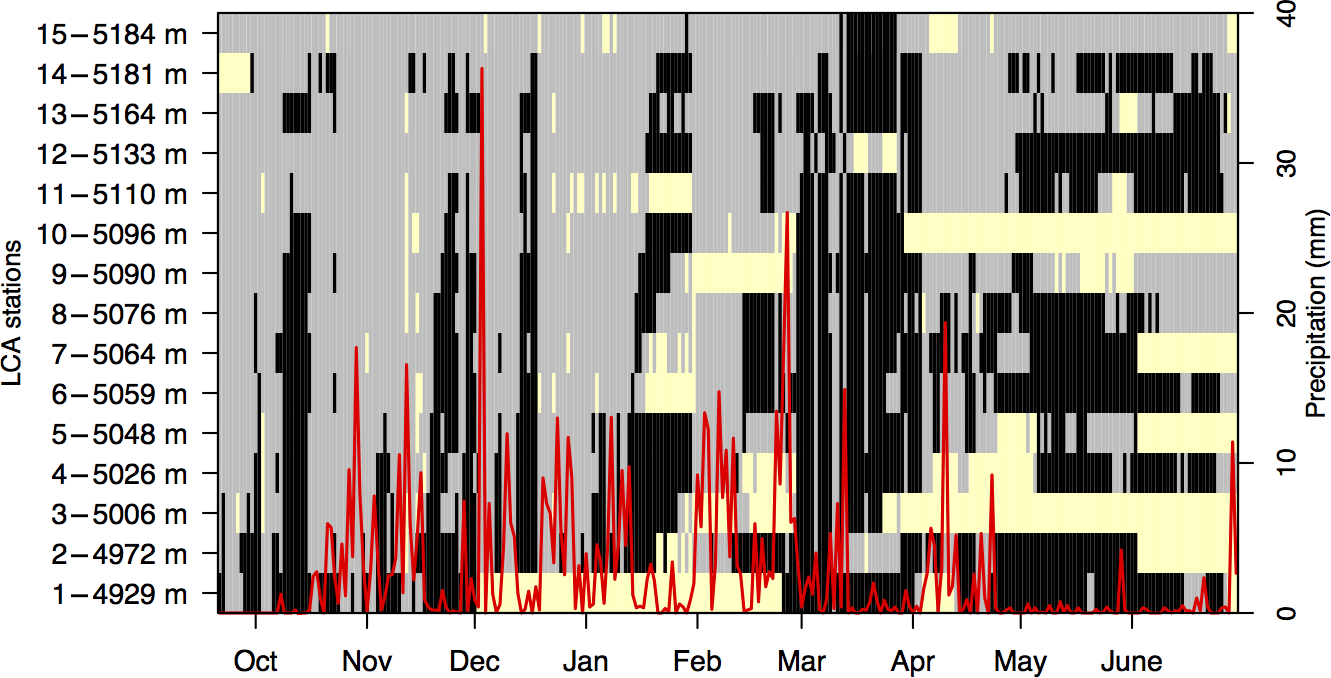
Figure 8Daily albedo index for the 15 LCA stations during the period from 21 September 2015 to 30 June 2016. In yellow: missing data; binary values considering the separation between ice (1: in black) and snow (2: in grey) with a threshold equal to 0.39. In red: the daily precipitation amount measured by the GEONOR rain gauge at the ORE station (mm day−1).
The LCA network was deployed in the lower and middle part of the Zongo Glacier (Fig. 5), which is the zone where the snow line altitude goes up or down depending on the snowfall events and ablation processes. For all of the points, we identified a first period (18 October 2015 to 11 November 2015) with high albedo values between 0.40 and 0.92. These values are in agreement with the surface state of the glacier on the LANDSAT images in which the pixels of the glacier tongue are all snow covered. During the second period, the glacier surface is covered by ice or by snow depending on the altitude. In further detail, we identified three groups organized by altitude ranges depending on the changes in the surface state of the glacier with a first group in the lower part of the glacier (LCA numbers 1, 2, 3, 4, 5), a second group in the middle part of the glacier (LCA numbers 6, 7, 8, 9, 10, 11, 12), and a third group with LCA numbers 13, 14, and 15 (see Fig. 5 for the location). Finally, the comparisons between the in situ LCA measurements and the surface state given by the LANDSAT images were used to visually identify a threshold for the albedo index equal to 0.39 between snow and ice. These results are in agreement with those obtained by Sicart et al. (2001), which showed that the albedo for the Zongo Glacier ranges from 0.3 for dirty ice to 0.9 for fresh snow. Using this threshold, it is possible to plot the evolution of the glacier cover (even ice or snow) over time for different altitudes ranging from 4929 to 5184 m a.s.l. (Fig. 8).
Figure 8 gives the evolution of the albedo for the 15 points during the period 21 September 2015–30 June 2016 and the precipitation amount measured by a GEONOR precipitation gauge at the ORE station (Fig. 5). We can clearly identify the snowfall events and see how the snow disappears, thus leaving the glacier ice exposed. As a result, the snow line altitude variations can be defined and vary between 4929 and 5184 m a.s.l. depending on the period of the year. In further detail, it can be noted that at the beginning of the study period (i.e., between September and November), the snow line quickly rises up and goes down due to intermittent precipitation events. Then, during the rainy season (from December to March), the glacier is mostly snow covered (mainly above 5000 m a.s.l.). Finally, during the dry season (April to June), the snow line rises up to 5150 m a.s.l. and the glacier tongue is mainly snow free.
In this study we developed, evaluated, and tested a new low-cost albedometer (LCA) comprised of two HOBO® Pendant Temperature/Light Data Loggers measuring downward and upward illuminances. The measurements of the field of view of the LCA in the laboratory with a goniometer showed that the LCA cannot capture the radiation for zenith angles ranging from 55 to 90∘ (±2∘). The angle of view of the sensor is 55∘, which limits where and when it can be used. To determine these limits, we calculated what the solar angle is at noon for different latitudes throughout the year. Considering the LCA is operational when the solar angle is greater than 55∘ at noon, it may be used all year long at latitudes between 12∘ N and 12∘ S, from March to October between 12 and 30∘ N, and from September to March between 12 and 30∘ S. The sensor cannot be used at latitudes higher than 60∘ N or 60∘ S at any time throughout the year. Between 45∘ N and 45∘ S the sensors can be operated during the ablation season when the glacier surface changes are the most important. Using the LCA spectral response (0.205 to 1.2 µm), we evaluated the simulated albedo index of the LCA over different types of snow and ice surfaces. The results showed that the LCA albedo indexes are within −4 to +8 % of the theoretical broadband albedo values, while considering that cloudy or clear sky incident irradiances only account for the spectral response of the LCA and not for the angular response of the LCA with respect to the ideal response. In the second part of the study, we evaluated the LCA albedo indexes in the field using CM3 broadband albedo values at two different sites on a tropical mountain in Bolivia: on the Zongo Glacier, at one station located on the glacier and another one located on the moraine. Data were recorded at hourly time steps and then the albedo indices were calculated on a daily timescale (from 11:00 to 15:00). The daily albedo indexes from the LCA are in good agreement with the broadband albedo values derived from the CM3 pyranometer. By comparing the LCA albedo estimates with the CM3 broadband albedo over a period of approximately 260 days at the two sites, we conclude that the efficiency of the albedo indexes given by the LCA is ±0.1 compared with classic CNR1 sensors. Future applications are certainly possible, especially considering the low cost, the autonomy of the LCA in terms of energy, and the very small size of the sensors. For example, the LCA could be useful to spatialize in situ albedos in glacierized catchments both on the glacier, where the evolution of the snow cover can be monitored, and in the non-glacierized part for the evolution of the seasonal snow cover and, more generally, the changes in the ground albedo due to, for example, variations in the soil moisture (Gascoin et al., 2009). The comparison between the LCA measurements and LANDSAT images during the period extending from 18 October 2015 to 30 June 2016 showed that the LCA is a powerful tool that can be used to quantify the evolution of the albedo index and characterize the surface state of the glacier by distinguishing between fresh snow, dirty snow, and ice. In order to have good results for the albedo index calculated with the LCA, a certain degree of caution is required: for example, snow particles should not stay on the sensor and the sensor must be kept horizontal. Therefore, we recommend a frequency of about 15 days between each field visit and data download. This new system has demonstrated its usefulness for a tropical glacier, and future studies in other climatic contexts should be conducted.
All data presented in the paper are available by request through the corresponding author (thomas.condom@ird.fr).
The authors declare that they have no conflict of interest.
This study was funded by the French Institut de Recherche pour le Développement
(IRD) through the Andean part of the
French glacier observatory service, GLACIOCLIM
(http://www-lgge.ujf-grenoble.fr/ServiceObs/SiteWebAndes/index.htm, last access: 2 May 2018), and was
carried out within the framework of the International Joint Laboratory
GREAT-ICE, a joint initiative of the IRD as well as universities and
institutions in Bolivia, Peru, Ecuador, and Colombia. All of the contributing
authors acknowledge the contribution of LABEX OSUG@2020, ANR grant no.
ANR-10-LABX-56. The Pléiades satellite image used for Fig. 1 was
obtained from the CNES-ISIS FC18473 program funded by the BIOTHAW project
(AAP-SCEN-2011-II). The authors would like to thank everyone who
participated in the field campaigns: Patrick Ginot, Maxime Harter, and Pierre
Vincent. We thank Sara Mullin and Lance Brooks for the correction of the English
text in a previous version of the paper.
Edited by: Jean Dumoulin
Reviewed by: two anonymous referees
Boehner, J. and Antonic, O.: 'Land-surface parameters specific to topo-climatology', Software, Applications', in: Geomorphometry – Concepts, edited by: Hengl, T. and Reuter, H., Developments in Soil Science, Vol. 33, 195–226, Elsevier, 2009.
Brock, B., Willis, I., Sharp, M.: Measurement and parametrization of albedo variations at Haut Glacier d'arolla, Swizerland, J. Glaciol., 46, 675–688, https://doi.org/10.3189/172756500781832675, 2000.
Carmagnola, C. M., Domine, F., Dumont, M., Wright, P., Strellis, B., Bergin, M., Dibb, J., Picard, G., Libois, Q., Arnaud, L., and Morin, S.: Snow spectral albedo at Summit, Greenland: measurements and numerical simulations based on physical and chemical properties of the snowpack, The Cryosphere, 7, 1139–1160, https://doi.org/10.5194/tc-7-1139-2013, 2013.
Corripio, J.: Snow surface albedo estimation using terrestrial photography, Int. J. Remote Sens., 24, 5705–5729, 2004.
Dumont, M., Sirguey, P., Arnaud, Y., and Six, D.: Monitoring spatial and temporal variations of surface albedo on Saint Sorlin Glacier (French Alps) using terrestrial photography, The Cryosphere, 5, 759–771, https://doi.org/10.5194/tc-5-759-2011, 2011.
Dumont, M., Gardelle, J., Sirguey, P., Guillot, A., Six, D., Rabatel, A., and Arnaud, Y.: Linking glacier annual mass balance and glacier albedo retrieved from MODIS data, The Cryosphere, 6, 1527–1539, https://doi.org/10.5194/tc-6-1527-2012, 2012.
Gascoin, S., Ducharne, A., Ribstein, P., Perroy, E., and Wagnon, P.: Sensitivity of bare soil albedo to surface soil moisture on the moraine of the Zongo glacier (Bolivia), Geophys. Res. Lett., 36, L02405, https://doi.org/10.1029/2008GL036377, 2009.
Gardner, A. S. and Sharp, M. J.: A review of snow and ice albedo and the development of a new physically based broadband albedo parameterization, J. Geophys. Res., 115, F01009, https://doi.org/10.1029/2009JF001444, 2010.
Klok, E. J., Greuell, W., and Oerlemans, J.: Temporal and spatial variation of the surface albedo of Morteratschgletscher, Switzerland, as derived from 12 Landsat images, J. Glaciol., 49, 491–502, https://doi.org/10.3189/172756503781830395, 2003.
Mullen, P. C. and Warren, S. G.: Theory of the optical properties of lake ice, J. Geophys. Res., 93, 8403–8414, https://doi.org/10.1029/JD093iD07p08403, 1988.
Rabatel, A., Bermejo, A., Loarte, E., Soruco, A., Gomez, J., Leonardini, G., Vincent, C., and Sicart, J.-E.: Can the snowline be used as an indicator of the equilibrium line and mass balance for glaciers in the outer tropics?, J. Glaciol., 58, 1027–1036, https://doi.org/10.3189/2012JoG12J027, 2012.
Rabatel, A., Francou, B., Soruco, A., Gomez, J., Cáceres, B., Ceballos, J. L., Basantes, R., Vuille, M., Sicart, J.-E., Huggel, C., Scheel, M., Lejeune, Y., Arnaud, Y., Collet, M., Condom, T., Consoli, G., Favier, V., Jomelli, V., Galarraga, R., Ginot, P., Maisincho, L., Mendoza, J., Ménégoz, M., Ramirez, E., Ribstein, P., Suarez, W., Villacis, M., and Wagnon, P.: Current state of glaciers in the tropical Andes: a multi-century perspective on glacier evolution and climate change, The Cryosphere, 7, 81–102, https://doi.org/10.5194/tc-7-81-2013, 2013.
Ricchiazzi, P., Yang, S. R., Gautier, C., and Sowle, D.: SBDART: A research and teaching software tool for plane-parallell radiative transfer in the Earth's atmosphere, B. Am. Meteorol. Soc., 79, 2101–2114, https://doi.org/10.1175/1520-0477(1998)079<2101:SARATS>2.0.CO;2, 1998.
Stamnes, K., Tsay, S.-C., Wiscombe, W., and Jayaweera, K.: Numerically stable algorithm for discrete-ordinate-method radiative transfer in multiple scattering and emitting layered media, Appl. Opt., 27, 2502–2509, 1988.
Sicart, J. E., Ribstein, P., Wagnon, P., and Brunstein, D.: Clear sky albedo measurements on a sloping glacier surface. A case study in the Bolivian Andes, J. Geophys. Res., 106, 31729–31738, 2001.
Sicart, J. E., Hock, R., Ribstein, P., Litt, M., and Ramirez E.: Analysis of seasonal variations in mass balance and meltwater discharge of the tropical Zongo Glacier by application of a distributed energy balance model, J. Geophys. Res., 116, D13105, https://doi.org/10.1029/2010JD015105, 2011.
Sicart, J. E., Espinoza, J. C., Quéno, L., and Medina, M.: Radiative properties of clouds over a tropical Bolivian glacier: seasonal variations and relationship with regional atmospheric circulation, Int. J. Climatol., 36, 3116–3128, https://doi.org/10.1002/joc.4540, 2016.
Stroeve, J., Nolin, A., and Steffen, K.: Comparison of AVHRRderived and in situ surface albedo over the Greenland Ice Sheet, Remote Sens. Environ., 62, 262–276, https://doi.org/10.1016/S0034-4257(97)00107-7, 1997.
Stamnes, K., Tsay, S.-C., Wiscombe, W., and Jayaweera, K.: Numerically stable algorithm for discrete-ordinate-methodradiative transfer in multiple scattering and emitting layered media, Appl. Opt., 27, 2502–2509, 1988.
Tachikawa, T., Kaku, M., Iwasaki, A., Gesch, D., Oimoen, M., Zhang, Z., Danielson, J., Krieger, T., Curtis, B., Haase, J., Abrams,M., Crippen, R., and Carabajal, C.: ASTER Global Digital Elevation Model Version 2 – Summary of validation results, METI & NASA, 28 pp., 2011.
van den Broeke, M., van As, D., Reijmer, C., and van de Wal, R.: Assessing and improving the quality of unattended radiation observations in Antarctica, J. Atmos. Ocean. Technol., 21, 1417– 1431, https://doi.org/10.1175/1520-0426(2004)021<1417:AAITQO>2.0.CO;2, 2004.
Vuille, M. and Ammann, C.: Regional snowfall patterns in the high, arid Andes, Clim. Change, 36, 413–423, https://doi.org/10.1023/A:1005330802974, 1997.
Warren, S. G.: Optical-properties of snow, Rev. Geophys., 20, 67–89, 1982.
Warren, S. G., Brandt, R. E., Grenfell, T. C., and McKay, C. P.: Snowball Earth: Ice thickness on the tropical ocean, J. Geophys. Res., 107, 3167, https://doi.org/10.1029/2001JC001123, 2002.