The Phylogeny of Quasars and the Ontogeny of Their Central Black Holes
 Didier Fraix-Burnet
 Paola Marziani
 Mauro D'Onofrio
 Deborah Dultzin
- 1Univ. Grenoble Alpes, CNRS, IPAG, Grenoble, France
- 2INAF, Osservatorio Astronomico di Padova, Padova, Italy
- 3Dipartimento di Fisica and Astronomia, Università di Padova, Padova, Italy
- 4Instituto de Astronomía, UNAM, Mexico City, Mexico
The connection between multifrequency quasar observational and physical parameters related to accretion processes is still open to debate. In the last 20 year, Eigenvector 1-based approaches developed since the early papers by Boroson and Green (1992) and Sulentic et al. (2000b) have been proven to be a remarkably powerful tool to investigate this issue, and have led to the definition of a quasar “main sequence.” In this paper we perform a cladistic analysis on two samples of 215 and 85 low-z quasars (z ≲ 0.7) which were studied in several previous works and which offer a satisfactory coverage of the Eigenvector 1-derived main sequence. The data encompass accurate measurements of observational parameters which represent key aspects associated with the structural diversity of quasars. Cladistics is able to group sources radiating at higher Eddington ratios, as well as to separate radio-quiet (RQ) and radio-loud (RL) quasars. The analysis suggests a black hole mass threshold for powerful radio emission and also properly distinguishes core-dominated and lobe-dominated quasars, in accordance with the basic tenet of RL unification schemes. Considering that black hole mass provides a sort of “arrow of time” of nuclear activity, a phylogenetic interpretation becomes possible if cladistic trees are rooted on black hole mass: the ontogeny of black holes is represented by their monotonic increase in mass. More massive radio-quiet Population B sources at low-z become a more evolved counterpart of Population A i.e., wind dominated sources to which the “local” Narrow-Line Seyfert 1s belong.
1. Introduction
Quasars represent the most luminous stable sources in the Universe (e.g., D'Onofrio et al., 2012, 2016), and it is disturbing that some basic issues still remain unsolved in spite of decade-long efforts (e.g., Sulentic et al., 2012; Antonucci, 2013, and references therein). The overall most pressing issue is perhaps the inability to connect physical parameters (such as black hole mass; Marziani and Sulentic, 2012; Shen, 2013; Peterson, 2014, for recent reviews) to the observational properties of individual quasars. This involves a comprehensive structural and dynamical modeling of the broad line emitting regions (e.g., Netzer, 2013, and references therein) which is still missing. In addition, there is no clear explanation of the existence of a RL and a RQ quasar population (see e.g., Padovani, 2016, for a recent review).
During the last two decades it has become clear that one single model cannot fit all type-1 RQ quasars, and that the diversity of most observational properties cannot be associated only with a viewing angle (i.e., the orientation angle between the accretion disk axis and the line-of-sight). The landmark work of Boroson and Green (1992) identified two main Eigenvectors in a space of parameters defined by radio, optical, UV and X quasars properties of Palomar-Green quasars. The second eigenvector was found to be correlated with luminosity i.e., a reformulation of the well-known Baldwin effect, the anti-correlation between high-ionization line equivalent width and luminosity (Baldwin et al., 1978; Bian et al., 2012). The interpretation of the first eigenvector (hereafter E1), dominated by an anti-correlation between full-width at half-maximum FWHM(Hβ) and [OIII]λλ4959,5007 and Fe IIopt prominence, was however not so clear since the beginning, and has fostered speculations on the role of black hole mass, chemical composition, black hole spin, Eddington ratio, and orientation (see Sulentic and Marziani, 2015, for a recent review). While orientation effects are probably present in RQ quasars (Netzer et al., 1992), they cannot account for the great diversity of observational properties of the line emitting regions, some of them pointing to differences in physical condition, chemical composition and dynamics (e.g., Elvis, 2000; Marziani et al., 2001; Chelouche and Netzer, 2003; Nagao et al., 2006; Netzer and Trakhtenbrot, 2007; Shen and Ho, 2014).
Figure 1 shows the main sequence (MS) in the plane Fe IIopt prominence (RFeII = I(FeIIλ4570)/I(Hβ)) and FWHM of broad Hβ(Boroson and Green, 1992; Sulentic et al., 2000a; Shen and Ho, 2014). Several radio, IR, optical, UV, and X properties of low-z quasars (listed in Table 1) can be organized along the MS. To focus on the main physical aspects, Sulentic et al. (2000b) defined a 4D parameter spaces with parameters that are observationally orthogonal: in addition to RFeII and FWHM(Hβ) which are indicators of the low-ionization emitting gas physical conditions and dynamics, they considered the high-ionization line CIVλ1549 shift with respect to the systemic reference of quasars (a tracer of powerful outflows, Richards et al., 2011), and the soft X-ray photon index ΓS, related to the accretion mode (e.g., Pounds et al., 1995; Grupe, 2004).
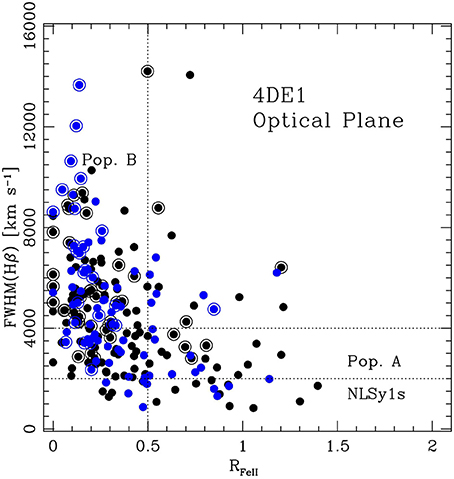
Figure 1. The optical plane of the 4DE1, FWHM(Hβ) vs. RFell for the M215 sample. Sources belonging to M85 are in blue, and radio loud sources are represented by circled symbols. The limit of Pop. A and B are marked, as well as the conventional limit of narrow-line Seyfert 1s (NLSy1).
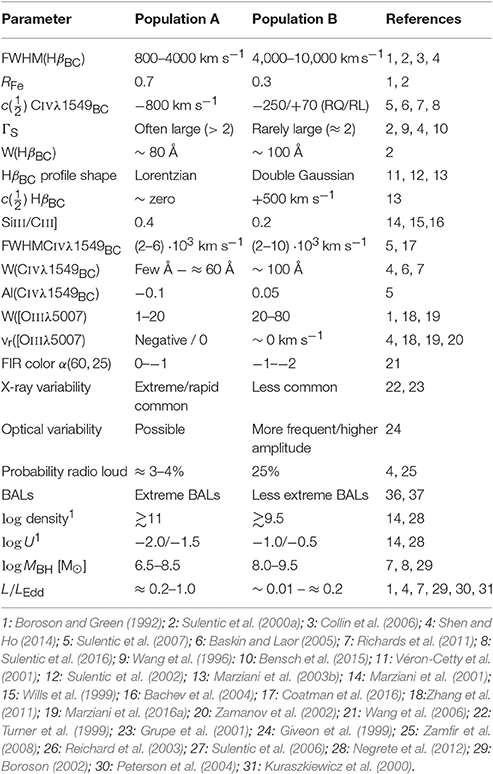
Table 1. Main trends along the 4DE1 sequence.
The data in Table 1 are reported for typical Population A (FWHM ≲ 4,000 km s−1) and Population B (broader) sources following the definition of Sulentic et al. (2000a). The separation into two populations was originally proposed on the basis of a rather abrupt discontinuity in the shape of the Balmer line profiles (e.g., Sulentic et al., 2002; Collin et al., 2006). Systematic changes at FWHM ~ 4,000 km s−1 are probably associated with a discontinuity in accretion mode (Marziani et al., 2003b, 2014), as the most relevant physical parameter governing the MS and the differences summarized in Table 1 is likely Eddington ratio (Marziani et al., 2001; Shen and Ho, 2014).
Observational differences for sources belonging to the two Populations become obvious looking at the extremes of the MS. At the top left positions on the sequence shown in Figure 1 (Population B), lines are very broad (often with composite and couple peaked profiles, Strateva et al., 2003), redward asymmetric, Fe IIopt is weak, the spectral energy distribution (SED) is hard (Laor et al., 1997; Shang et al., 2007), [OIII]λλ4959,5007 is strong and symmetric with a blueward asymmetry close to the line base. At the other end, extreme Pop. A sources (RFeII ≳ 1) are high accretors which show evidence of strong radiation driven winds (Sulentic et al., 2007; Richards et al., 2011; Coatman et al., 2016).
All these developments in the study of quasars strongly indicate that statistical multivariate analyses could be useful. They should bring a more powerful capacity to determine the relevant properties that explain the observed diversity. In this paper, since quasars are known to be evolving objects, we have chosen to use a phylogenetic approach which establishes evolutionary relationships. Among the possible tools, cladistics is certainly the most general and simplest to implement.
In the following, we first describe the cladistic method (Section 2). The method is then applied to a set of optical and UV parameters that include the four parameters of the Sulentic et al. (2000b) 4D space, as well as several additional key parameters (Section 2.3). They are available for a sample of 85 sources (Section 2.2) which is as subsample of 215 sources for which only the optical spectral range is available and that is also considered in this study. The cladistic analysis resolves the difference between Pop. A and B and indicates that RL sources are the most evolved Population B sources (Section 3). The results are briefly discusses in terms of quasar populations at low-z as well as of evolution over cosmic age (Section 4.2), and in light of our present understanding of the RQ/RL dichotomy (Section 4.3).
2. Methods
2.1. Cladistic Analysis
Astrocladistics aims at introducing phylogenetic tools in astrophysics. A phylogeny shows the evolutionary relationships between groups, species or classes, while a genealogy shows the relationships between individuals with parents and offsprings. Ontogeny is the evolution of a single individual. In astrophysics, the observations only allow for phylogenetic reconstructions. Consequently, in this paper, each quasar supposedly represents a species (or sub-species, class…). Nevertheless, for simple objects, like a black hole or a star, it is possible to observe identical objects at different stages of evolution, so that their ontogeny can be derived. Among the tools developed for phylogenetic analyses, cladistics, also called Maximum Parsimony, is the most general and the simplest to implement. It uses parameters, and not distances, to establish the relationships between the species by minimizing the total evolutionary cost depicted on a phylogenetic tree.
2.1.1. Outline of the Astrocladistics Approach
The cladistic analysis is a phylogenetic method for classification, an unsupervised multivariate classification technique that establishes the relationships between the taxa under study. A taxon is a class, a species, or an individual supposedly representing a class. The relationships are depicted on a phylogenetic tree that represents the simplest evolutionary scenario given the data.
Contrarily to many clustering and phylogenetic techniques, cladistics does not compute distances between the taxa, but uses the parameters themselves. These parameters ideally must bear an information of evolution, so that they can be discretized into evolutionary stages. In this case they are called “characters,” and the number of changes in stages (steps) represents an evolutionary cost. For a given tree, the total number of steps, considering all the characters and all the taxa, defines the complexity of the evolutionary scenario depicted by the tree. The cladistic algorithm aims at finding the simplest evolutionary scenario which is given by the most parsimonious tree, the one that has the lowest total number of steps, among all possible tree topologies that can be constructed with the taxa in the sample. This kind of tree is called a cladogram. Because it is not based on distances, the cladistic algorithm accepts undocumented values.
The reader is referred to Fraix-Burnet et al. (2015) for a review on unsupervised classification techniques in extragalactic astronomy, and to Fraix-Burnet et al. (2006a,b, 2012) and Fraix-Burnet (2016) for more details on the use of cladistics in astrophysics. More explanations are available at https://astrocladistics.org.
2.1.2. Implementation of the Cladistic Analyses
As usual in astrocladistics, we discretized each parameter in each sample into 32 bins in order to keep its continuous and quantative nature. The optimization criterion that we use considers that the evolutionary cost between two states is the absolute value of their difference (l1-norm). The computation used the heuristic search algorithm implemented in Phylogenetic Analysis Using Parsimony PAUP*4.0b10 (Swofford, 2003), with a ratchet method to avoid as much as possible local minima (Nixon, 1999).
2.1.3. Reliability Assessment
The reliability (“robustness”) of the cladistic analysis has been estimated through several complementary analyses taking slightly different subsets of quasars and parameters. The two samples presented in this paper are the best ones for two reasons. Firstly, the consensus tree obtained from all the most parsimonious trees found for each sample is nearly entirely resolved, showing that they are all in excellent agreement. This indicates that the tree structure corresponds very probably to a global minimum. Secondly, the results with these two samples agree very well with the complementary analyses, some slight disagreement occurring at the relative placement of some groups on the trees. This does not affect the main interpretation of the proposed phylogeny of quasars.
2.1.4. Interpretation of the Tree
The phylogenetic tree depicts the shortest path to relate all the objects of the sample through an evolutionary history. Starting from any taxon (a leave on the tree), one can estimate the cost to transform this object into any other one.
The tree is a hierarchical organization of the taxa, and there is no objective way to define species or classes. The substructures of the tree are a good indication that the related objects may be close from an evolutionary point of view. Ideally, a clade is composed of all the taxa that are the descendants emerging from an internal node (i.e., an unlabeled node). These taxa are supposed to have inherited a property from a common (unknown) ancestor placed at the internal node. Hence each substructure has some chance to correspond to a clade and are used here to define the evolutionary groups of quasars.
The detailed structure of the tree depends somewhat on whether the sense of evolution has been imposed. This is made by defining a root, i.e., a taxon or a clade, which is the closest to the ancestor common to all the object of the sample. This is of course not an easy choice to make in a multivariate pattern. One may use a few parameters that are known to evolve in a monotonic fashion, such as the mass of the black hole which cannot decrease easily if at all. One must be careful that this approach does not lead to a conflict with other parameters.
In any case, once the tree is built and can be trusted statistically, it should be seen as a phylogenetic hypothesis extracted from the data, an hypothesis to be confronted with the current astrophysical knowledge.
2.2. Sample Selection
The selected samples have the non-negligible advantages to cover relatively well the spectral bins of largest occupation along the E1 MS (Figure 1), i.e., to provide a fair representation of the quasar spectroscopic diversity at low-z. The evolution of the quasar luminosity function derived by Boyle et al. (2000) for z ≲ 0.7 is modest. Quasars with RFeII ≲ 1.5 are 98% of all low-z quasars (Marziani et al., 2013). It is worth noting that both samples are strongly biased in favor of RL quasars. This is not really a hindrance since an optically-selected, flux-limited complete sample of 85 sources should include only 6–7 RL sources, encompassing both core-dominated (CD) and lobe-dominated (LD) quasars. The main results related to the MS have been confirmed by the eventual analysis of large Sloan Digital Sky Survey (SDSS)-based samples (e.g., Zamfir et al., 2010; Shen and Ho, 2014).
The larger sample (M215) includes 215 low-z quasars (z ≲ 0.7) presented by Marziani et al. (2003a). Measurements of [OIII]λ5007 are available for most of these sources in addition to FWHM(Hβ) and RFeII but the sample lacks UV and soft-X ray information. A second sample (M85) includes 85 sources, and is obtained from the intersection of the Marziani et al. (2003a, 215 sources covering the Hβ spectral range) and the Sulentic et al. (2007, 130 sources with CIVλ1549 covered from Hubble Space Telescope Faint Object Spectrograph (HST/FOS) observations) samples. The measurements used in this paper are available on Vizier for both Marziani et al. (2003a)1 and Sulentic et al. (2007)2. The two samples provide reliable measurements on high S/N, moderate dispersion spectra that are unmatched by the automated measurements obtained on the SDSS spectra by other authors. M85 is necessary for characterizing the dynamics of the line emitting regions, as there is strong evidence that a virialized component (traced by Hβ) is coexisting with an outflowing component traced by CIVλ1549(e.g., Marziani et al., 2016a, Sulentic et al., in preparation). The black hole mass (MBH) has been estimated from Hβ FWHM using the Vestergaard and Peterson (2006) scaling law, and the Eddington ratio computed assuming a factor 10 bolometric correction for the measured specific flux at 5,100 Å i.e., applying a correction consistent with past and more recent estimates (Elvis et al., 1994; Richards et al., 2006).
2.3. Parameter Selection for the Cladistic Analysis
In a multivariate analysis such as classification, great care should be taken to avoid redundancies or uninformative parameters that could perturb the result. As already said, the characters are expected to trace out the evolution of the quasars, and obviously, correlated parameters may put too much weight on the underlying physical process. However, some correlations are not causal (Fraix-Burnet, 2011) and thus should not be eliminated. The disturbing parameters bring noise and can prevent the convergence of the analysis. It is thus important to understand well the parameters for the sample under study and then repeat the cladistics analysis with several subsets of parameters to test the robustness of the phylogenetic signal we are looking for. For the interpretation of the tree, naturally, all available information can be used and any parameters can be projected onto the tree.
Among the available parameters here, the absolute B magnitude MB and Lbol are both measures of luminosity and consequently are strongly correlated. We keep only Lbol for the analysis. The black hole mass MBH is a derived property and it is included in the results presented in this paper, but analyses performed without this parameter yields very similar results with a slightly less resolved tree. The Eddington ratio is also a derived quantity and was not included in the cladistic analysis presented in this paper. If we include the Eddington ratio in addition to MBH, then the trees become more linear, pointing to a correlation between two or more parameters. As a consequence, we prefer not to use it to establish the tree, and include it for the interpretation only.
The M215 sample finally includes seven parameters for the cladistic analysis: radio loudness parameter RK (coded as logRK in the Figures) following Kellermann et al. (1989), RFeII (RFE), FWHM(Hβ) (FWHMHb), the line centroid displacement of Hβ at quarter maximum (c1o4Hb), W([OIII]λ5007) (WOIII, in Å), the peak shift of [OIII]λ5007 (voIII), the decimal logarithms of bolometric luminosity Lbol (logLbol), MBH (logMBH). All radial velocity displacements are referred to the quasar rest frame, in units of km s−1. Note that voIII has 28 unknown values.
The M85 sample includes eleven parameters, that is four additional ones with respect to M215: the photon index ΓS (Gamma), the radial velocity centroid displacement of CIVλ1549 at half maximum (c1o2CIV), and the rest-frame equivalent width of CIVλ1549, W(CIVλ1549) (WCIV). There are twelve unknown values for voIII and four for Gamma.
3. Results
The result of a cladistic analysis is an unrooted tree. It is however convenient to root it for the definition of groups and for a possible evolutionary interpretation. In the case of quasars, a parameter that can root the cladistic trees is black hole mass, since MBH can only grow as a function of cosmic time: the only way a black hole can disappear is through emission of Hawking's radiation (Hawking, 1974) which is tremendously inefficient for massive black holes. A tree rooted in this way shows a clustering consistent with evolution from less massive to more massive sources. This evolution would represent the real diversification arrow of quasars if and only if the black hole mass is a reliable evolutionary clock. This would in particular imply that the common ancestor of all quasars has a small black hole. We do not make this assumption in this paper since this parameter is merely one part of the numerous and complex transformation processes of these objects. With this caution stated, the quasar sample contains a population of massive quasars which can be seen as “more evolved” than a population of less-massive quasars that are radiating at a higher L/LEdd.
The groups can be defined following the substructures of the tree. Formally, clades are (monophyletic) groups of taxa including an hypothetical ancestor (an internal node) and all its descendants. There is no constraint on the level of granularity of the classification, except for homogeneity of the groups and convenience for the interpretation.
We have chosen the groups as shown in Figures 2, 3. We find 20 groups on the M85 tree and 41 on the M215 one3. The relative homogeneity of the groups can be estimated from the barplots drawn in front of the trees, as well as some evolutionary trends along this phylogeny. In addition, there are individual terminal branches (or leaves, i.e., leading to only one quasar) that are identified with black color in this paper. Each can be considered as representative of a group, increasing the total number of identified groups. Note that the color progressions are identical in the two cases. The agreement between the two classifications can be estimated by comparing them with the M85 sample objects only, with the Adjusted Rand Index that measures the number of pairs of objects that belong or not to the same class in the two classifications. In a perfect match it should be 1, and 0 for random classifications. Here we find 0.42, that is quite good since the two classifications do not use the same set of parameters. This can also be verified on the boxplots.
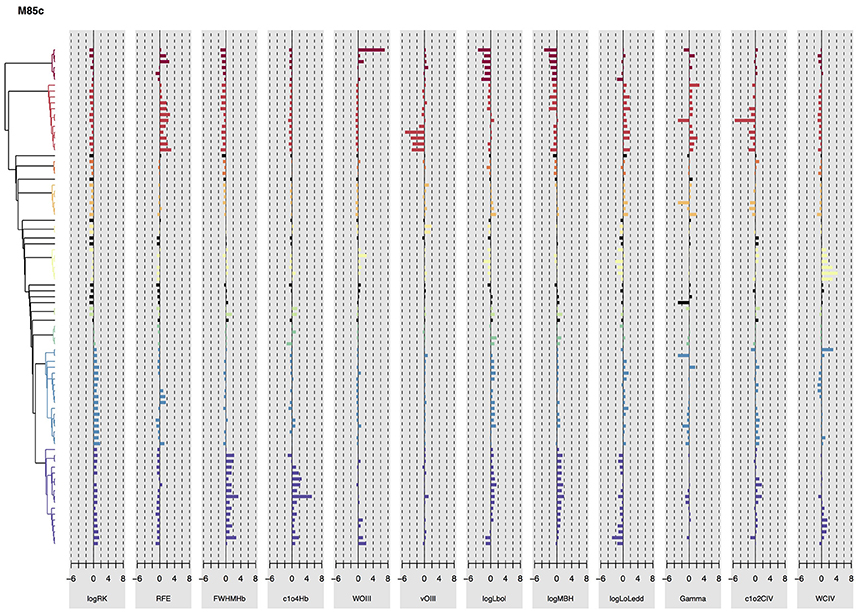
Figure 2. Cladograms for the M85 sample rooted with the lowest-MBH group, showing barplots for the Eddington ratio L/LEdd in addition to the eleven parameters used to find the tree. Colors correspond to the groups defined from the tree on the left.
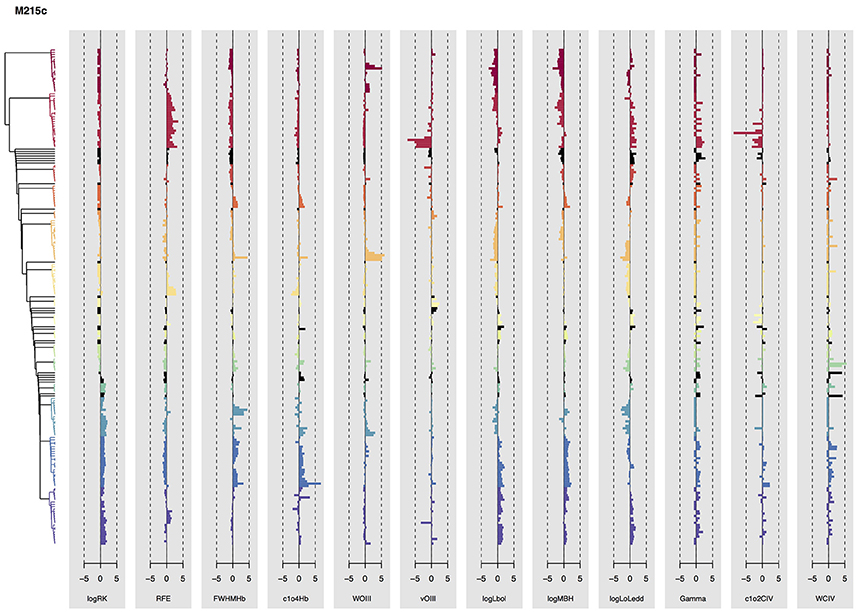
Figure 3. Cladogram for the M215 sample rooted with the lowest-MBH group, showing barplots for L/LEdd, ΓS, Civλ1549, , W(Civλ1549), in addition to the seven parameters used to find the tree. Colors correspond to the groups defined from the tree on the left. They do not match in any way the groups and colors for the M85 sample, except for the progression from red to deep blue.
Each group can be characterized by the statistics of the parameters and shown as boxplots (Figures 4, 5). From this, we can already identify known populations (Figure 6): in M85, group 1 is due to low-luminosity Pop. A sources, group 2 is dominated by extreme Pop. A, while groups 19 and 20 include almost exclusively radio-loud objects: mainly LDs (20) and CDs (19). Group 18 includes one core-bright LDs and three radio intermediate sources, 0 ≲ log RK ≲ 1.8. Radio-loud groups are from 39 to 41 in M215 (41 predominantly made of CDs, 40 of LDs). The intermediate groups include low-right corner Pop. A sources but are mainly Pop. B. The cladograms (Figures 2, 3) trace the relations among the groups. Even if no evolutionary inference should be inferred at this point, it is interesting to note that there is a sequence going from extreme Pop. A and Pop. B RQ, to Pop. B RL. The bottom groups are core-dominated and lobe-dominated RL sources, which are monophyletic groups in M85. In M85 and M215, the different groups appear to follow defined systematic trends, with FWHM(Hβ), RFeII and ΓS decreasing from the first group to the last. Large CIVλ1549 blueshifts seem to be restricted to the first group. The cladistic analysis therefore recovers the trends that define the quasars MS in 4DE1 parameter space involving FWHM(Hβ), RFeII, CIVλ1549, and ΓS. High values of the L/LEdd are restricted to the first groups with the smallest masses. Largest RK are associated with the largest MBH, and LD and CD are separated into two distinct groups (here group # 19 and 20 for M85).
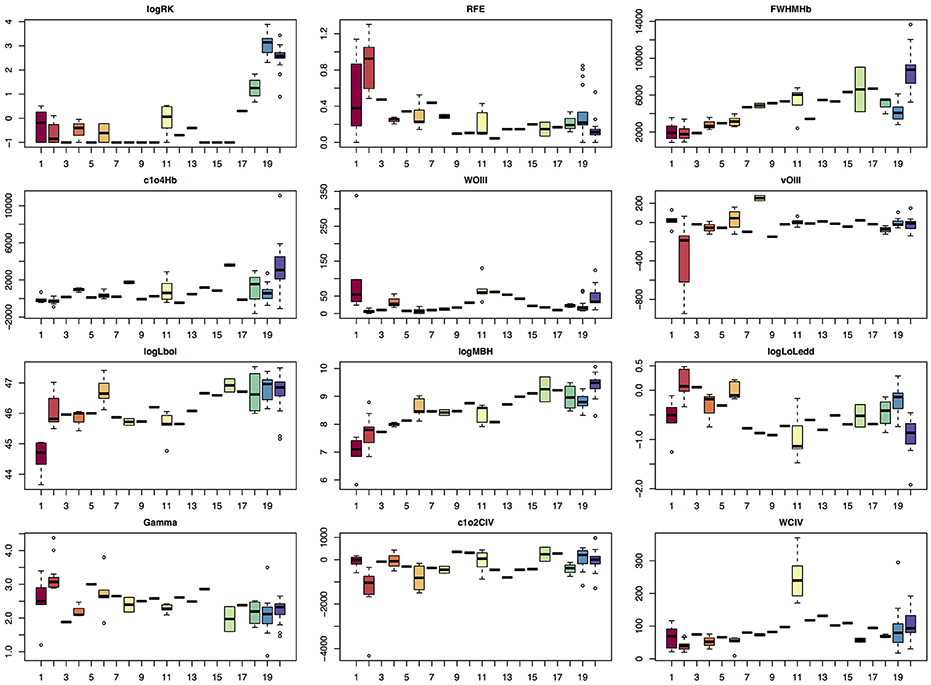
Figure 4. Box plots with identified groups for the M85 sample. The ordinate axis shows the parameter coded on top of the plot, with code meaning explained in Section 2.3. Medians are thick horizontal lines while boxes define limits from first to third interquartile range. Outliers are shown as open circles. Colors correspond to those in Figure 2.
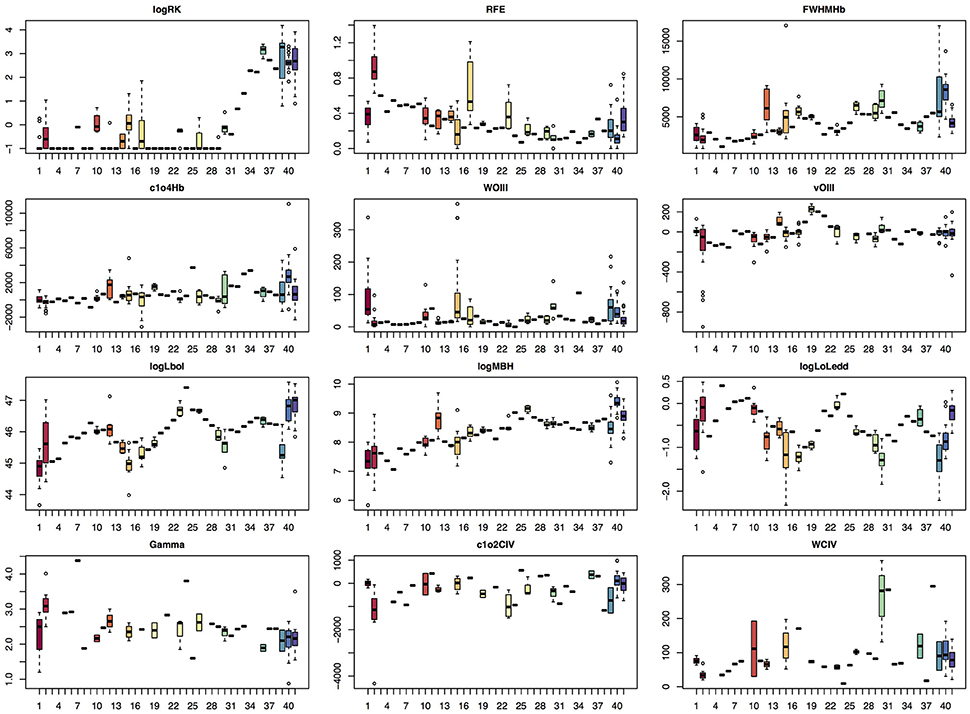
Figure 5. Box plots with identified groups for the M215 sample. Colors correspond to those in Figure 3, and the ordinate axis meaning is the same of Figure 4.
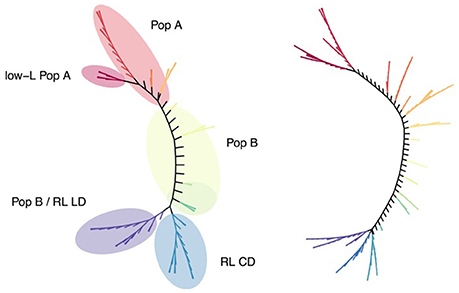
Figure 6. Unrooted cladistic trees for the M85 (left) and M215 (right) samples. The main groups are identified by shaded areas in the M85 diagram. Colors corresponds to those in Figure 2 (M85) and Figure 3 (M215).
At the same time MBH increases quite monotonically, this regularity being independent of the choice to root the tree with the lowest MBH. The trend of MBH along the trees is remarkable: there is a strong increase first and then a kind of plateau that may even be split from the first part. This behavior seems strongly related to the trend in RK, L/LEdd and FWHM(Hβ). The anomalous group 11 in M85 has large RK, W(CIVλ1549): most likely the reflection of large extinction internal to the quasars belonging to this small group. Apart from this, it is apparently not different from the rest of Population B groups.
3.1. A Threshold MBH for RLness
RL quasars are predominantly found among Pop. B, where RQ quasars are also found with similar accretion parameters (45 ≲ log Lbol ≲ 46 erg s−1, 8.5 ≲ log MBH ≲ 9.5, L/LEdd~ 0.1). Powerful RL sources appear in our low-z sample only for large MBH, and CD and LD are separated because of an intervening role of orientation (which affects FWHM(Hβ), and Lbol; in phylogenetic terms, CD and LD belong to different monophyletic groups). We insist on the fact that the other analyses that we have performed without MBH give the same results, so that this conclusion does not depend on the presence of this parameter in the analysis nor on its selection for the rooting of the tree. The MBH result is clearly dependent on sample properties. M215 and M85 contains only very powerful radio-loud sources, so that results from additional studies need to be considered to decide whether a mass threshold is appropriate (Section 4.3).
The most established tenet of radio-loud unification (Urry and Padovani, 1995) is that the difference between CDs and LDs is due to relativistic beaming and therefore strongly dependent on orientation. It is also known that CD and LD sources show differences in optical spectroscopic properties (e.g., Wills and Browne, 1986; Zamfir et al., 2008; Buttiglione et al., 2010). We do not really see a separation that may be ascribed to orientation effects in the other branches and trunk of the cladistic tree. Therefore, orientation appears to be an intervening physical parameter that differentiates the RL sources into CDs and LD staring from a common progenitor species.
4. Discussion
4.1. L/LEdd
Several observational parameters are strongly correlated with L/LEdd (Marziani et al., 2001; Kuraszkiewicz et al., 2004; Shen and Ho, 2014). L/LEdd expresses the ratio between radiation and gravitational forces (Marziani et al., 2010; Netzer and Marziani, 2010). The transition between Pop. A and B occurs at L/LEdd ≈ 0.2 ± 0.1 (Marziani et al., 2003b), which is consistent with the limit that corresponds to the transition from a geometrically thin to a geometrically thick accretion flow sustained by radiation pressure (Abramowicz and Straub, 2014, and references therein). Prominent winds are associated with high L/LEdd (Sulentic et al., 2007; Richards et al., 2011; Coatman et al., 2016). Therefore, we can think of two quasars populations, one with relatively modest MBH (7 ≲ log MBH ≲ 8 [M⊙]) radiating at high Eddington ratio and associated with strong wind, and one of more massive sources (8 ≲ log MBH ≲ 10 [M⊙]) radiating at L/LEdd ≲ 0.1. While L/LEdd appears to be the main physical factor governing E1, high-MBH quasars may have resembled low-MBH quasars in an earlier stage of their evolution when they were “wind-dominated” (as further discussed in Section 4.2).
4.2. Ontogenesis and Phylogenesis of Quasars
4.2.1. Population B as Evolved Population A Quasars
Every quasar is the direct descendant of a seed black hole. However, black holes of masses MBH ≲ 105 M⊙ are extremely difficult to detect if they are placed in the nuclei of external galaxies. Even if they are radiating at L/LEdd~ 1 (L/LEdd ≳ 2–3 may not be possible Mineshige et al., 2000), their apparent V magnitude will be ≈ 22 at redshift z ≈ 0.3. In flux-limited quasar samples at low-z, we detect quasars in the mass range 6 ≲ log MBH ≲ 8 radiating close to their Eddington limit. The masses of these sources are clearly not the masses of the fledgling seed BHs. Nonetheless, in the local Universe, the only sources radiating close to the Eddington limit are these relatively low-MBH quasars. It is easy to see that, if the most massive black holes were nowadays radiating at their maximum radiative power per unit mass (≈ 2 L/LEdd), they would be almost visible to the naked eye (with MBH ≈ 1010 M⊙ at z ≈ 0.15 it would be mV ≈ 6.7!). The absence of massive BHs radiating close to the Eddington limit is associated with the overall downsizing of the star formation and nuclear activity at recent cosmic epochs (e.g., Fontanot et al., 2009; Reviglio and Helfand, 2009; Hirschmann et al., 2014). The very massive black holes that were shining bright mostly belong now to spent systems (Lynden-Bell, 1969), accreting at a very low rate. In this respect sources like Messier 87 (which we consider a prototypical example of the “spent” quasars which is hosting one of the most massive BHs in the local Universe, Walsh et al., 2013) are very different from the Pop. B sources that we are considering in our sample. Pop. B sources are quasars accreting at a modest pace but high enough to be in a radiatively efficient accretion mode that can be modeled by a geometrically thin, optically thick α-disk with an efficiency η ~ 0.07 (Shakura and Sunyaev, 1973). Assuming that Pop. B sources are accreting at a constant mass rate, MBH grows in a linear regime, the time needed for a Pop. B source to have grown from a mass = 108 M⊙ is
where f is the ratio of the actual mass to the initial one and we have assumed η ≪ 1 (Netzer, 2013, p. 297). The Δt needed for a BH to grow from the typical masses of the highly accreting quasars at a typical luminosity of luminous low-z quasars is short relative to the expectation of the cosmic evolution of quasar accretion rates. For example, a Pop. A quasar with M⊙ at z ≈ 0.2 could be seen as a Pop. B source with MBH ≈ 109 M⊙ at z ≈ 0.15 since Δt ≈ 5.1·108 yr. Its spectroscopic appearance would change as well, moving the source from the bottom right toward the top left of the E1 MS, as schematically indicated in Figure 7. In other words, it is legitimate to assume that Pop. B are evolved Pop. A sources and not the same quasars that were once radiating at very high L at the cosmic peak of star formation rate and quasar activity.
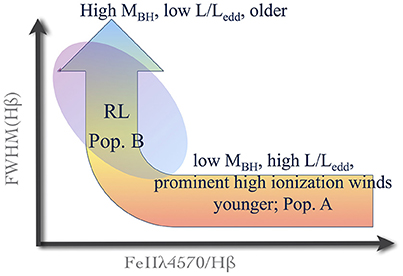
Figure 7. A possible evolutionary scheme for RQ quasars. As MBH increases, sources may move from the location of Population A sources radiating at relatively high Eddington ratio and with much evidence suggesting the presence of a radiation driven wind (Sulentic et al., 2007; Richards et al., 2011), to Population B sources in the optical plane of the 4DE1 parameter space.
This eventuality is rather unlikely also if we consider the expected comoving density of spent (dead) quasars in the local Universe. It is convenient to follow the Boyle et al. (2000) luminosity function parameterization:
where the evolution is given by the redshift dependence of the break magnitude , and a ≈ −3.41, b ≈ −1.58. The most luminous quasars are the ones with the most massive black holes radiating close to the Eddington limit (which were relatively rare at z ≈ 2 and have all but disappeared at z ≲ 0.7. It is reasonable to assume that all extremely luminous quasars have MBH ≲ 109.5 M⊙ (Sulentic et al., 2006; Natarajan and Treister, 2009; King, 2016), and that they may not radiate at highly super-Eddington ratios, the limit being close to a few times the Eddington ratio. For a typical quasar SED, log L ≈ 36.54 − 0.4MB. Therefore, with L⊙, MB,max ≈ −27.9 for MBH = 109 M⊙ and L/LEdd = 1. The comoving number density ñ of sources with MB below this absolute magnitude limit yields a number of sources dN in the comoving volume element dVt, and the number of sources Nlum which are supermassive (MBH ≳ 109 M⊙) and that were once radiating close to their Eddington limit can be obtained by integrating over 1.5 ≲ z ≲ 2.3:
where dC is the comoving distance, and . This number can be compared to the number NB of Pop. B sources up to z ≈ 0.75 i.e., to , with z1 ≈ 0.1 and z2 ≈ 0.75. Assuming that Pop. B are about of all type-1 quasars of all quasars within MB,max ≤ −21 (as suggested by flux-limited optically selected samples Zamfir et al., 2010), the number of very massive black holes that were once radiating above −27.9 in the redshift range 1.5 ≤ z ≤ 2.3 falls short by slightly less than two orders of magnitude to explain the density of the “present-day” (z ≲ 0.75) Population B quasars: Nlum ≈ 0.03NB. This is hardly surprising since the comoving number density of quasars at MB ≈ −28 and z ≳ 1.5 is logΦ(MB) ≈ −8.15 [Mpc−3 mag−1], and at z ≈ 0.5 and MB ≈ −23 is ≈ −6.25 [Mpc−3 mag−1]. If the integration limit used to compute Nlum from −27.9 is lowered down to MB ≈ −26 at high-z, and if the luminosity function is extrapolated to this absolute magnitude, the number of quasars Nlum becomes comparable to NB at low z. Thus, we cannot exclude that a quasar reached MBH ~ 109 M⊙ at z ~ 2, stopped accreting, and was then rejuvenated at recent cosmic times.
4.2.2. From Seed to Dead Supermassive Black Holes
Recent deep observations of faint quasars (mV ~ 22) obtained with GTC indicate the presence of a slowly evolving quasar Population at z ≈ 2, not dissimilar to the one observed at low-z as far as the frequency of Pop. B sources is concerned (Sulentic et al., 2014). This result is consistent with the existence of a population of sources that were evolving on timescales much shorter than the Hubble time, then (at a cosmic age of just ≈ 3 Gyr) and now, and with the relatively short lifetimes expected for quasars (Kelly et al., 2010). As mentioned earlier, the comoving density of the very luminous quasars is very low, since they appear at the high end of the luminosity function. Therefore, it may be that—if we exclude the most extreme sources—we are seeing a process going on systematically over cosmic epoch with quasar formation and evolution occurring in a way not so much different to the one expected for a human population (looking back in time, we can still identify adults and young adults as we see them at present).
Mathur (2000) and, independently, Sulentic et al. (2000a) suggested that the local-Universe NLSy1 sources accreting at a high rate are reminiscent of the early quasars. We are still far from detecting the first population of “infant” quasars without “adults” (a feat that may never become possible). Unfortunately, at high z it is still not possible to detect black holes of MBH ~ 107 M⊙, even if they are radiating at or slightly above L/LEdd, as there is a redshift-dependent cut-off in the detectable L/LEdd (Sulentic et al., 2014). Our view of quasars is biased. At intermediate to high-z we are “blinded” by the most luminous quasars in the Universe (such as the ones revealed by the Hamburg ESO survey, Wisotzki et al., 2000), objects whose luminosity may also be enhanced by anisotropic emission (Urry et al., 1991; DiPompeo et al., 2014). However, these sources are the ones expected to exert a feedback effect significant enough to affect the host galaxy.
Can we say that the local quasars are repeating the evolutionary patterns of these most luminous quasars? In the context of quasars, feedback effects significant enough to lead to the expulsion of matter on galactic scale may be possible only if the radiative and kinetic powers are extremely high (e.g., Wagner et al., 2013; King and Pounds, 2015, see also the discussions in Marziani et al., 2016a,b). A significant feedback effect of present-day luminous AGNs is proven only in their circumnuclear regions, as shown in the very detailed study of the outflow in NGC 5548 (Kaastra et al., 2014), and energies involved in dispersing the gas outside of the bulge and in a host disk may be beyond the reach of present-day quasars. Why today we do not see them as the more luminous? The answer is related to the lack of available gas to get high accretion rates, and to the dramatic decrease of the expected merger rate with cosmic epoch (e.g., Cavaliere and Vittorini, 2000; Hopkins et al., 2006). In keeping with a human population analogy, we can say that we see a population of young adults and adults which are similar, one close and one at a larger distance. At the larger distance we see a relatively rare population of quasars that are now extinguished. They grew so large that they destroyed their habitat and eventually starved to death.
The cladogram we find shows that if evolution there is, it is very probably along the increasing MBH, with a strong support from the physics and the demography of observed quasars. The difficulty is that the ontogeny describes the evolution of a single quasar. The demonstration in this section shows that a given quasar can only increase MBH and in a relatively short time. If it appears as a Pop. A member, then it will likely evolve toward the Pop. B population. But the cladogram is not supposed to show this; rather, it depicts the phylogeny: if the rooting corresponds to the smaller MBH, then the Pop. A quasars are closer to the most primitive quasars (as far as the diversity in our sample can tell of the diversity of the true population of quasars). This implies several things. First, a Pop. A quasars might not necessarily evolve toward Pop. B, there can be kind of dead-ends if for instance there is no more matter to accrete. These paths could be represented by (some of) the many branches of the trees. Second, and this is the main difference with ontogeny, there are many possible paths from the most ancestral groups. In other words, observing a “young adult” does not tell exactly how the “adult” will look like, even if physically, we can expect that a Pop. A member will have the typical Pop. B appearance. Finally, even if this possibility is probably not imaginable for local quasars, there is no element, from our study, to argue that a quasar cannot appear as such with a very high MBH and high luminosity.
This is the limitation of rooting the tree with only one parameter, since quasar appearance cannot be reduced to the mass of their black hole. However, the phylogeny of local quasars as revealed on our trees closely matches the ontogeny of their central black hole. This fact is supported, as mentioned at the end of the previous paragraph, by a physical motivation that emerges from the decrease of gas fraction and merger rate with increasing cosmic epoch.
4.3. Radio-Loud and Radio-Quiet Quasars
Our cladogram reveals a MBH threshold beyond which radio loudness could be triggered (Section 3.1). This is different from the threshold in the definition of RL quasars for which Zamfir et al. (2008) suggested a value that exceeds by an order of magnitude the canonical limit introduced by Kellermann et al. (1989): log RK ≳ 1.8, and/or log P ≳ 31.6 erg s−1 Hz−1. RL sources in our sample are very powerful non thermal emitters and strongly deviate from the correlation between far-infrared (FIR) and radio expected for non-active galaxies (Bonzini et al., 2015; Padovani, 2016). The threshold we find corresponds to the occurrence of RL among the most massive objects, as has been already proposed by several workers (e.g., Chiaberge and Marconi, 2011, and references therein), although this notion is apparently challenged by the discovery of the so-called RL narrow-line Seyfert 1s (e.g., Komossa et al., 2006; Berton et al., 2016).
At the same time, we cannot forget that in the optical plane of E1 we see sources that are both RQ and RL in the same area, in the radiatively-efficient domain associated with a thin accretion disk. Some features such as a strong redward asymmetry in the Hβ profile (Marziani et al., 2003b), are observed in RQ and RL sources alike. RL and RQ Pop. B occupy also the same range in MBH and L/LEdd, with modest L/LEdd, as shown in samples larger than the one of the present paper (Sikora et al., 2007). Therefore, assuming that there is a MBH threshold that makes it possible for an AGN to become RL, this condition is necessary but not sufficient. The threshold idea is appealing because it allows for the solution of the MCG 06-30-15 paradox: a maximally rotating black hole inferred from the Fe Kα profile (Iwasawa et al., 1996; Sulentic et al., 1998a) in a radio quiet quasar (actually an anonymous Seyfert 1 with an undistinguished spectrum, Sulentic et al., 1998b). The spin condition is therefore not a sufficient condition to guarantee radio loudness.
In the context of the Blandford-Znajek mechanism for relativistic jet creation (Blandford and Znajek, 1977), the jet power is related to MBH, the spin angular momentum J, and the magnetic field by:
where B is the magnetic field and . This equation indicates that even for a maximally rotating BH, and large mass ( M⊙), a strong magnetic field is needed (~ 102−104 G).
Recent theoretical work and numerical simulations indicate that jet collimation is occurring in a magnetically-arrested accretion disk (MAD) regime (Punsly, 2015) where magnetic flux is maximized near the black hole, after being dragged from the outer disk toward the center. A modest field strength expected to be present in the nuclei of galaxies (~ 1μ G) may yield a field strength close to the BH high enough to collimate the jet (Narayan et al., 2003). However, whether a MAD will actually develop, depends on how the magnetic fields associated with the disk behaves as it is dragged toward the central black hole, a still debated issue. It is not understood under which conditions the disk may be able to maintain its magnetization (e.g., Blandford and Payne, 1982; Riols et al., 2016).
Compact steep spectrum and Giga-Hertz peaked sources (O'Dea, 1998) which often show evidence of high L/LEdd from optical and UV properties (Wu, 2009) are accounted for if MAD conditions and jet collimation also occur in an advection-dominated accretion flow (ADAF) context (e.g., Czerny and You, 2016, and references therein) at high accretion rate i.e., for a geometrically thick, optically thick disk. A typical case may be 3C 57, which hosts a very massive BH (MBH ~ 109 M⊙, Sulentic et al., 2015), is very powerful at present and also shows evidence of relic radio emission, probably due to a past activity cycle (Punsly et al., 2016). Rejuvenated sources may be only a minority of cases, and hence account for the fact the radio-bright population is mostly due to massive black holes radiating at modest L/LEdd, as it is the case of the RL sources in M215 and M85.
Therefore, if the attention is restricted to the most powerful RL sources, jet collimation may be made possible by the concomitant occurrence of high mass, high J, strong and ordered magnetic field. A corollary is that the RQ sources in the same L/LEdd and MBH domain should have low values of J or of B. According to recent models, a relatively low L/LEdd (≲ 0.1) may not be a necessary condition, although it is highly unlikely to have high L/LEdd for very massive BHs at low-z.
5. Conclusion
The cladistic analysis presented a new view of the quasar correlation space based on the first eigenvector of Boroson and Green (1992) and of Sulentic et al. (2000a). In particular, it has been possible: (1) to identify the distinction between Pop. A and B, in a sequence of increasing MBH; (2) to isolate RL sources among the most massive (more evolved) sources; (3) to separate CD and LD as monophyletic groups having the same progenitor. We infer, from these and previous results, that Pop. B sources may indeed be seen as evolved Pop. A. We tentatively suggest that the radio quiet / radio loud dichotomy is influenced by differences in spin as well as by a different magnetization of the accretion disk.
Author Contributions
DF: statistical and cladistic analysis; wrote about 1/2 of text. PM: sample and measure definition; interpretation; wrote about 1/2 of text. MD: helped with interpretation, did critical revision. DD: read the paper and sent many helpful comments.
Funding
DD acknowledges support from grants PAPIIT108716, UNAM, and CONACyT221398.
Conflict of Interest Statement
The authors declare that the research was conducted in the absence of any commercial or financial relationships that could be construed as a potential conflict of interest.
The reviewer DB declared a shared affiliation, though no other collaboration, with the authors PM to the handling Editor, who ensured that the process nevertheless met the standards of a fair and objective review.
Supplementary Material
The Supplementary Material for this article can be found online at: https://www.frontiersin.org/article/10.3389/fspas.2017.00001/full#supplementary-material
Table 2. Group assignment of individual sources.
The columns of Table 2 provide in the following order: source identification, and group number for the M85c and M215c samples. Properties of groups and color used in the cladogram of Figures 2, 3 are shown in Figures 4, 5 for the M85c and M215c sample, respectively.
Footnotes
1. ^http://cdsarc.u-strasbg.fr/viz-bin/Cat?J/ApJS/145/199
2. ^http://cdsarc.u-strasbg.fr/viz-bin/Cat?J/ApJ/666/757
3. ^The group identification is reported for each quasar in the file quasargroups.csv appended to the paper, in Supplementary Material Table 2.
References
Abramowicz, M. A., and Straub, O. (2014). Accretion discs. Scholarpedia 9:2408. doi: 10.4249/scholarpedia.2408
Antonucci, R. (2013). Astrophysics: quasars still defy explanation. Nature 495, 165–167. doi: 10.1038/495165a
Bachev, R., Marziani, P., Sulentic, J. W., Zamanov, R., Calvani, M., and Dultzin-Hacyan, D. (2004). Average ultraviolet Quasar spectra in the context of eigenvector 1: a baldwin effect governed by the eddington ratio? Astrophys. J. 617, 171–183. doi: 10.1086/425210
Baldwin, J. A., Burke, W. L., Gaskell, C. M., and Wampler, E. J. (1978). Relative quasar luminosities determined from emission line strengths. Nature 273, 431–435. doi: 10.1038/273431a0
Baskin, A., and Laor, A. (2005). What controls the CIV line profile in active galactic nuclei? Monthly Notices R. Astron. Soc. 356, 1029–1044. doi: 10.1111/j.1365-2966.2004.08525.x
Bensch, K., del Olmo, A., Sulentic, J., Perea, J., and Marziani, P. (2015). Measures of the soft X-ray excess as an eigenvector 1 parameter for active galactic nuclei. J. Astrophys. Astron. 36, 467–474. doi: 10.1007/s12036-015-9355-8
Berton, M., Caccianiga, A., Foschini, L., Peterson, B. M., Mathur, S., Terreran, G., et al. (2016). Compact steep-spectrum sources as the parent population of flat-spectrum radio-loud narrow-line Seyfert 1 galaxies. Astron. Astrophys. 591:A98. doi: 10.1051/0004-6361/201628171
Bian, W.-H., Fang, L.-L., Huang, K.-L., and Wang, J.-M. (2012). The C IV Baldwin effect in quasi-stellar objects from seventh data release of the sloan digital sky survey. Monthly Notices R. Astron. Soc. 427, 2881–2888. doi: 10.1111/j.1365-2966.2012.22123.x
Blandford, R. D., and Payne, D. G. (1982). Hydromagnetic flows from accretion discs and the production of radio jets. Monthly Notices R. Astron. Soc. 199, 883–903. doi: 10.1093/mnras/199.4.883
Blandford, R. D., and Znajek, R. L. (1977). Electromagnetic extraction of energy from Kerr black holes. Monthly Notices R. Astron. Soc. 179, 433–456. doi: 10.1093/mnras/179.3.433
Bonzini, M., Mainieri, V., Padovani, P., Andreani, P., Berta, S., Bethermin, M., et al. (2015). Star formation properties of sub-mJy radio sources. Monthly Notices R. Astron. Soc. 453, 1079–1094. doi: 10.1093/mnras/stv1675
Boroson, T. A. (2002). Black hole mass and eddington ratio as drivers for the observable properties of radio-loud and radio-quiet QSOs. Astrophys. J. 565, 78–85. doi: 10.1086/324486
Boroson, T. A., and Green, R. F. (1992). The emission-line properties of low-redshift quasi-stellar objects. Astrophys. J. Suppl. Ser. 80, 109–135. doi: 10.1086/191661
Boyle, B. J., Shanks, T., Croom, S. M., Smith, R. J., Miller, L., Loaring, N., et al. (2000). The 2dF QSO Redshift Survey - I. The optical luminosity function of quasi-stellar objects. Monthly Notices R. Astron. Soc. 317, A29. doi: 10.1046/j.1365-8711.2000.03730.x
Buttiglione, S., Capetti, A., Celotti, A., Axon, D. J., Chiaberge, M., Macchetto, F. D., et al. (2010). An optical spectroscopic survey of the 3CR sample of radio galaxies with z ≲ 0.3 . II. Spectroscopic classes and accretion modes in radio-loud AGN. Astron. Astrophys. 509:A6. doi: 10.1051/0004-6361/200913290
Cavaliere, A., and Vittorini, V. (2000). The fall of the Quasar population. Astrophys. J. 543, 599–610. doi: 10.1086/317155
Chelouche, D., and Netzer, H. (2003). Continuum shielding and flow dynamics in active galactic nuclei. Monthly Notices R. Astron. Soc. 344, 233–241. doi: 10.1046/j.1365-8711.2003.06841.x
Chiaberge, M., and Marconi, A. (2011). On the origin of radio loudness in active galactic nuclei and its relationship with the properties of the central supermassive black hole. Monthly Notices R. Astron. Soc. 416, 917–926. doi: 10.1111/j.1365-2966.2011.19079.x
Coatman, L., Hewett, P. C., Banerji, M., and Richards, G. T. (2016). C iv emission-line properties and systematic trends in quasar black hole mass estimates. Monthly Notices R. Astron. Soc. 461, 647–665. doi: 10.1093/mnras/stw1360
Collin, S., Kawaguchi, T., Peterson, B. M., and Vestergaard, M. (2006). Systematic effects in measurement of black hole masses by emission-line reverberation of active galactic nuclei: Eddington ratio and inclination. Astron. Astrophys. 456, 75–90. doi: 10.1051/0004-6361:20064878
Czerny, B., and You, B. (2016). Accretion in active galactic nuclei and disk-jet coupling Astron. Nachr. 337:73. doi: 10.1002/asna.201512268
DiPompeo, M. A., Myers, A. D., Brotherton, M. S., Runnoe, J. C., and Green, R. F. (2014). The intrinsic quasar luminosity function: accounting for accretion disk anisotropy. Astrophys. J. 787:73. doi: 10.1088/0004-637X/787/1/73
D'Onofrio, M., Marziani, P., and Sulentic, J. W. (eds.) (2012). Fifty Years of Quasars From Early Observations and Ideas to Future Research, vol. 386 of Astrophysics and Space Science Library. Berlin; Heidelberg: Springer Verlag.
D'Onofrio, M., Zaggia, S., Rampazzo, R., Vallenari, A., Gilmore, G. F., Marziani, P., et al. (2016). “New Eyes for Galaxies Investigation,” in From the Realm of the Nebulae to Populations of Galaxies, eds M. D'Onofrio, R. Rampazzo, and S. Zaggia (Springer, Berlin), 697–737.
Elvis, M., Wilkes, B. J., McDowell, J. C., Green, R. F., Bechtold, J., Willner, S. P., et al. (1994). Atlas of quasar energy distributions. Astrophys. J. Suppl. Ser. 95, 1–68. doi: 10.1086/192093
Fontanot, F., De Lucia, G., Monaco, P., Somerville, R. S., and Santini, P. (2009). The many manifestations of downsizing: hierarchical galaxy formation models confront observations. Monthly Notices R. Astron. Soc. 397, 1776–1790. doi: 10.1111/j.1365-2966.2009.15058.x
Fraix-Burnet, D. (2011). The fundamental plane of early-type galaxies as a confounding correlation. Monthly Notices R. Astron. Soc. Lett. 416, L36–L40. doi: 10.1111/j.1745-3933.2011.01091.x
Fraix-Burnet, D. (2016). “Concepts of classification and taxonomy. Phylogenetic classification,” in Statistics for Astrophysics: Clustering and Classification, eds D. Fraix-Burnet and S. Girard (Paris: EAS Publications Series, EDP Sciences), 221–257. doi: 10.1051/eas/1677010
Fraix-Burnet, D., Chattopadhyay, T., Chattopadhyay, A. K., Davoust, E., and Thuillard, M. (2012). A six-parameter space to describe galaxy diversification. Astron. Astrophys. 545:A80. doi: 10.1051/0004-6361/201218769
Fraix-Burnet, D., Choler, P., Douzery, E., and Verhamme, A. (2006a). Astrocladistics: a phylogenetic analysis of galaxy evolution I. Character evolutions and galaxy histories. J. Classif. 23, 31–56. doi: 10.1007/s00357-006-0003-5
Fraix-Burnet, D., Douzery, E., Choler, P., and Verhamme, A. (2006b). Astrocladistics: a phylogenetic analysis of galaxy evolution II. Formation and diversification of galaxies. J. Classif. 23, 57–78. doi: 10.1007/s00357-006-0004-4
Fraix-Burnet, D., Thuillard, M., and Chattopadhyay, A. K. (2015). Multivariate approaches to classification in extragalactic astronomy. Front. Astron. Space Sci. 2:3. doi: 10.3389/fspas.2015.00003
Giveon, U., Maoz, D., Kaspi, S., Netzer, H., and Smith, P. S. (1999). Long-term optical variability properties of the Palomar-Green quasars. Monthly Notices R. Astron. Soc. 306, 637–654. doi: 10.1046/j.1365-8711.1999.02556.x
Grupe, D. (2004). A complete sample of soft X-ray-selected AGNs. II. Statistical analysis. Astron. J. 127, 1799–1810. doi: 10.1086/382516
Grupe, D., Thomas, H.-C., and Beuermann, K. (2001). X-ray variability in a complete sample of Soft X-ray selected AGN. Astron. Astrophys. 367, 470–486. doi: 10.1051/0004-6361:20000429
Hirschmann, M., Dolag, K., Saro, A., Bachmann, L., Borgani, S., and Burkert, A. (2014). Cosmological simulations of black hole growth: AGN luminosities and downsizing. Monthly Notices R. Astron. Soc. 442, 2304–2324. doi: 10.1093/mnras/stu1023
Hopkins, P. F., Hernquist, L., Cox, T. J., Di Matteo, T., Robertson, B., and Springel, V. (2006). A unified, merger-driven model of the origin of starbursts, quasars, the cosmic X-ray background, supermassive black holes, and galaxy spheroids. Astrophys. J. Suppl. Ser. 163, 1–49. doi: 10.1086/499298
Iwasawa, K., Fabian, A. C., Reynolds, C. S., Nandra, K., Otani, C., Inoue, H., et al. (1996). The variable iron K emission line in MCG-6-30-15. Monthly Notices R. Astron. Soc. 282, 1038–1048. doi: 10.1093/mnras/282.3.1038
Kaastra, J. S., Kriss, G. A., Cappi, M., Mehdipour, M., Petrucci, P.-O., Steenbrugge, K. C., et al. (2014). A fast and long-lived outflow from the supermassive black hole in NGC 5548. Science 345, 64–68. doi: 10.1126/science.1253787
Kellermann, K. I., Sramek, R., Schmidt, M., Shaffer, D. B., and Green, R. (1989). VLA observations of objects in the Palomar Bright Quasar Survey. Astron. J. 98, 1195–1207. doi: 10.1086/115207
Kelly, B. C., Vestergaard, M., Fan, X., Hopkins, P., Hernquist, L., and Siemiginowska, A. (2010). Constraints on black hole growth, quasar lifetimes, and eddington ratio distributions from the SDSS broad-line quasar black hole mass function. Astrophys. J. 719, 1315–1334. doi: 10.1088/0004-637X/719/2/1315
King, A. (2016). How big can a black hole grow? Monthly Notices R. Astron. Soc. 456, L109–L112. doi: 10.1093/mnrasl/slv186
King, A., and Pounds, K. (2015). Powerful outflows and feedback from active galactic nuclei. Ann. Rev. Astron. Astrophys. 53, 115–154. doi: 10.1146/annurev-astro-082214-122316
Komossa, S., Voges, W., Xu, D., Mathur, S., Adorf, H.-M., Lemson, G., et al. (2006). Radio-loud narrow-line type 1 quasars. Astron. J. 132, 531–545. doi: 10.1086/505043
Kuraszkiewicz, J., Wilkes, B. J., Czerny, B., and Mathur, S. (2000). What do the ultraviolet spectra of narrow-line seyfert 1 galaxies tell us about their broad-line regions? Astrophys. J. 542, 692–702. doi: 10.1086/317013
Kuraszkiewicz, J. K., Green, P. J., Crenshaw, D. M., Dunn, J., Forster, K., Vestergaard, M., et al. (2004). Emission line properties of active galactic nuclei from a post-COSTAR hubble space telescope faint object spectrograph spectral atlas. Astrophys. J. Suppl. Ser. 150, 165–180. doi: 10.1086/379809
Laor, A., Fiore, F., Elvis, M., Wilkes, B. J., and McDowell, J. C. (1997). The soft X-ray properties of a complete sample of optically selected quasars. II. Final results. Astrophys. J. 477, 93. doi: 10.1086/303696
Lynden-Bell, D. (1969). Galactic nuclei as collapsed old quasars. Nature 223, 690–694. doi: 10.1038/223690a0
Marziani, P., Martínez Carballo, M. A., Sulentic, J. W., Del Olmo, A., Stirpe, G. M., and Dultzin, D. (2016a). The most powerful quasar outflows as revealed by the Civ λ1549 resonance line. Astrophys. Space Sci. 361, 29. doi: 10.1007/s10509-015-2611-1
Marziani, P., and Sulentic, J. W. (2012). Estimating black hole masses in quasars using broad optical and UV emission lines. New Astron. Rev. 56, 49–63. doi: 10.1016/j.newar.2011.09.001
Marziani, P., Sulentic, J. W., Negrete, C. A., Dultzin, D., D'Onofrio, M., Del Olmo, A., et al. (2014). Low- and high-z highly accreting quasars in the 4D Eigenvector 1 context. Astronom. Rev. 9, 6–25. doi: 10.1080/21672857.2014.11519739
Marziani, P., Sulentic, J. W., Negrete, C. A., Dultzin, D., Zamfir, S., and Bachev, R. (2010). Broad-line region physical conditions along the quasar eigenvector 1 sequence. Monthly Notices R. Astron. Soc. 409, 1033–1048. doi: 10.1111/j.1365-2966.2010.17357.x
Marziani, P., Sulentic, J. W., Plauchu-Frayn, I., and del Olmo, A. (2013). Is Mg II 2800 a reliable virial broadening estimator for quasars? Astron. Astrophys. 555, 16. doi: 10.1051/0004-6361/201321374
Marziani, P., Sulentic, J. W., Stirpe, G. M., Dultzin, D., Del Olmo, A., and Martínez-Carballo, M. A. (2016b). Blue outliers among intermediate redshift quasars. Astrophys. Space Sci. 361, 3. doi: 10.1007/s10509-015-2590-2
Marziani, P., Sulentic, J. W., Zamanov, R., Calvani, M., Dultzin-Hacyan, D., Bachev, R., et al. (2003a). An optical spectroscopic atlas of low-redshift active galactic nuclei. Astrophys. J. Suppl. Ser. 145, 199–211. doi: 10.1086/346025
Marziani, P., Sulentic, J. W., Zwitter, T., Dultzin-Hacyan, D., and Calvani, M. (2001). Searching for the physical drivers of the eigenvector 1 correlation space. Astrophys. J. 558, 553–560. doi: 10.1086/322286
Marziani, P., Zamanov, R. K., Sulentic, J. W., and Calvani, M. (2003b). Searching for the physical drivers of eigenvector 1: influence of black hole mass and Eddington ratio. Monthly Notices R. Astron. Soc. 345, 1133–1144. doi: 10.1046/j.1365-2966.2003.07033.x
Mathur, S. (2000). Narrow-line Seyfert 1 galaxies and the evolution of galaxies and active galaxies. Monthly Notices R. Astron. Soc. 314, L17–L20. doi: 10.1046/j.1365-8711.2000.03530.x
Mineshige, S., Kawaguchi, T., Takeuchi, M., and Hayashida, K. (2000). Slim-disk model for soft X-ray excess and variability of narrow-line seyfert 1 galaxies. Publ. Astron. Soc. Jpn. 52, 499–508. doi: 10.1093/pasj/52.3.499
Nagao, T., Marconi, A., and Maiolino, R. (2006). The evolution of the broad-line region among SDSS quasars. Astron. Astrophys. 447, 157–172. doi: 10.1051/0004-6361:20054024
Narayan, R., Igumenshchev, I. V., and Abramowicz, M. A. (2003). Magnetically arrested disk: an energetically efficient accretion flow Publ. Astron. Soc. Jpn. 55, L69–L72. doi: 10.1093/pasj/55.6.L69
Natarajan, P., and Treister, E. (2009). Is there an upper limit to black hole masses? Monthly Notices R. Astron. Soc. 393, 838–845. doi: 10.1111/j.1365-2966.2008.13864.x
Negrete, A., Dultzin, D., Marziani, P., and Sulentic, J. (2012). BLR physical conditions in extreme population a quasars: a method to estimate central black hole mass at high redshift. Astrophys. J. 757:62. doi: 10.1088/0004-637X/757/1/62
Netzer, H. (2013). The Physics and Evolution of Active Galactic Nuclei. Cambridge: Cambridge University Press.
Netzer, H., Laor, A., and Gondhalekar, P. M. (1992). Quasar discs. III - Line and continuum correlations. Monthly Notices R. Astron. Soc. 254, 15–20. doi: 10.1093/mnras/254.1.15
Netzer, H., and Marziani, P. (2010). The effect of radiation pressure on emission-line profiles and black hole mass determination in active galactic nuclei. Astrophys. J. 724, 318–328. doi: 10.1088/0004-637X/724/1/318
Netzer, H., and Trakhtenbrot, B. (2007). Cosmic evolution of mass accretion rate and metallicity in active galactic nuclei. Astrophys. J. 654, 754–763. doi: 10.1086/509650
Nixon, K. C. (1999). The parsimony ratchet, a new method for rapid parsimony analysis. Cladistics 15, 407–414. doi: 10.1111/j.1096-0031.1999.tb00277.x
O'Dea, C. P. (1998). The compact steep-spectrum and gigahertz peaked-spectrum radio sources. Astron. Soc. Pacif. 110, 493–532.
Padovani, P. (2016). The faint radio sky: radio astronomy becomes mainstream. Astron. Astrophys. Rev. 24:13. doi: 10.1007/s00159-016-0098-6
Peterson, B. M. (2014). Measuring the masses of supermassive black holes. Space Sci. Rev. 183, 253–275. doi: 10.1007/s11214-013-9987-4
Peterson, B. M., Ferrarese, L., Gilbert, K. M., Kaspi, S., Malkan, M. A., Maoz, D., et al. (2004). Central masses and broad-line region sizes of active galactic nuclei. II. A homogeneous analysis of a large reverberation-mapping database. Astrophys. J. 613, 682–699. doi: 10.1086/423269
Pounds, K. A., Done, C., and Osborne, J. P. (1995). RE 1034+39: a high-state Seyfert galaxy? Monthly Notices R. Astron. Soc. 277, L5–L10.
Punsly, B. (2015). Evidence of the dynamics of relativistic jet launching in quasars. Astrophys. J. 806, 47. doi: 10.1088/0004-637X/806/1/47
Punsly, B., Reynolds, C., Marziani, P., and O'Dea, C. P. (2016). The extreme ultraviolet spectra of low-redshift radio-loud quasars. Monthly Notices R. Astron. Soc. 459, 4233–4239. doi: 10.1093/mnras/stw866
Reichard, T. A., Richards, G. T., Schneider, D. P., Hall, P. B., Tolea, A., Krolik, J. H., et al. (2003). A catalog of broad absorption line quasars from the sloan digital sky survey early data release. Astron. J. 125, 1711–1728. doi: 10.1086/368244
Reviglio, P. M., and Helfand, D. J. (2009). Active galaxies in the sloan digital sky survey II: galaxy and activity evolution. ArXiv e-prints.
Richards, G. T., Kruczek, N. E., Gallagher, S. C., Hall, P. B., Hewett, P. C., Leighly, K. M., et al. (2011). Unification of luminous type 1 quasars through C IV emission. Astron. J. 141:167. doi: 10.1088/0004-6256/141/5/167
Richards, G. T., Lacy, M., Storrie-Lombardi, L. J., Hall, P. B., Gallagher, S. C., Hines, D. C., et al. (2006). Spectral energy distributions and multiwavelength selection of type 1 quasars. Astrophys. J. Suppl. Ser. 166, 162. doi: 10.1086/506525
Riols, A., Ogilvie, G. I., Latter, H., and Ross, J. P. (2016). Magnetorotationally driven wind cycles in local disc models. Monthly Notices R. Astron. Soc. 463, 3096–3112. doi: 10.1093/mnras/stw2196
Shakura, N. I., and Sunyaev, R. A. (1973). Black holes in binary systems. Observational appearance. Astron. Astrophys. 24, 337–355. doi: 10.1017/s007418090010035x
Shang, Z., Wills, B. J., Wills, D., and Brotherton, M. S. (2007). Spectral properties from Lyα to Hα for an essentially complete sample of quasars. I. Data. Astron. J. 134, 294–393. doi: 10.1086/518505
Shen, Y., and Ho, L. C. (2014). The diversity of quasars unified by accretion and orientation. Nature 513, 210–213. doi: 10.1038/nature13712
Sikora, M., Stawarz, Ł., and Lasota, J.-P. (2007). Radio loudness of active galactic nuclei: observational facts and theoretical implications. Astrophys. J. 658, 815–828. doi: 10.1086/511972
Strateva, I. V., Strauss, M. A., Hao, L., Schlegel, D. J., Hall, P. B., Gunn, J. E., et al. (2003). Double-peaked low-ionization emission lines in active galactic nuclei. Astron. J. 126, 1720–1749. doi: 10.1086/378367
Sulentic, J., and Marziani, P. (2015). Quasars in the 4D Eigenvector 1 Context: a stroll down memory lane. Front. Astron. Space Sci. 2:6. doi: 10.3389/fspas.2015.00006
Sulentic, J. W., Bachev, R., Marziani, P., Negrete, C. A., and Dultzin, D. (2007). C IV λ1549 as an eigenvector 1 parameter for active galactic nuclei. Astrophys. J. 666, 757–777. doi: 10.1086/519916
Sulentic, J. W., Martínez-Carballo, M. A., Marziani, P., del Olmo, A., Stirpe, G. M., Zamfir, S., et al. (2015). 3C 57 as an atypical radio-loud quasar: implications for the radio-loud/radio-quiet dichotomy. ArXiv e-prints.
Sulentic, J. W., Marziani, P., and Calvani, M. (1998a). Disk models for MGC -06-30-15: the variability challenge. Astrophys. J. 497, L65–L68. doi: 10.1086/311277
Sulentic, J. W., Marziani, P., del Olmo, A., Dultzin, D., Perea, J., and Alenka Negrete, C. (2014). GTC spectra of z ≈ 2.3 quasars: comparison with local luminosity analogs. Astron. Astrophys. 570:A96. doi: 10.1051/0004-6361/201423975
Sulentic, J. W., Marziani, P., Del Olmo, A., and Zamfir, S. (2016). Balmer line shifts in quasars. Astrophys. Space Sci. 361, 55. doi: 10.1007/s10509-015-2637-4
Sulentic, J. W., Marziani, P., and Dultzin-Hacyan, D. (2000a). Phenomenology of broad emission lines in active galactic nuclei. Ann. Rev. Astron. Astrophys. 38, 521–571. doi: 10.1146/annurev.astro.38.1.521
Sulentic, J. W., Marziani, P., and D'Onofrio, M. (eds.). (2012). “Fifty years of quasars: current impressions and future perspectives,” in Fifty Years of Quasars: From Early Observations and Ideas to Future Research, Vol. 386 of Astrophysics and Space Science Library (Berlin; Heidelberg: Springer Verlag), 549.
Sulentic, J. W., Marziani, P., Zamanov, R., Bachev, R., Calvani, M., and Dultzin-Hacyan, D. (2002). Average quasar spectra in the context of eigenvector 1. Astrophys. J. 566, L71–L75. doi: 10.1086/339594
Sulentic, J. W., Marziani, P., Zwitter, T., Calvani, M., and Dultzin-Hacyan, D. (1998b). On the origin of broad Fe Kα and H I Hα lines in active galactic nuclei. Astrophys. J. 501, 54. doi: 10.1086/305795
Sulentic, J. W., Marziani, P., Zwitter, T., Dultzin-Hacyan, D., and Calvani, M. (2000b). The demise of the classical broad-line region in the luminous quasar PG 1416-129. Astrophys. J. 545, L15–L18. doi: 10.1086/317330
Sulentic, J. W., Repetto, P., Stirpe, G. M., Marziani, P., Dultzin-Hacyan, D., and Calvani, M. (2006). VLT/ISAAC spectra of the Hβ region in intermediate-redshift quasars. II. Black hole mass and Eddington ratio. Astron. Astrophys. 456, 929–939. doi: 10.1051/0004-6361:20054153
Swofford, D. L. (2003). PAUP*: Phylogenetic Analysis Using Parsimony (*and Other Methods). Sunderland, MA: Sinauer Associates. Available online at: http://paup.sc.fsu.edu/
Turner, T. J., George, I. M., Nandra, K., and Turcan, D. (1999). On X-ray variability in seyfert galaxies. Astrophys. J. 524, 667–673. doi: 10.1086/307834
Urry, C. M., Marziani, P., and Calvani, M. (1991). The effect of anisotropic emission from thick accretion disks on the luminosity functions of active galactic nuclei. Astrophys. J. 371, 510–514. doi: 10.1086/169914
Urry, C. M., and Padovani, P. (1995). Unified schemes for radio-loud active galactic nuclei. Astron. Soc. Pacif. 107, 803. doi: 10.1086/133630
Véron-Cetty, M.-P., Véron, P., and Gonçalves, A. C. (2001). A spectrophotometric atlas of Narrow-Line Seyfert 1 galaxies. Astron. Astrophys. 372, 730–754. doi: 10.1051/0004-6361:20010489
Vestergaard, M., and Peterson, B. M. (2006). Determining central black hole masses in distant active galaxies and quasars. II. Improved optical and UV scaling relationships. Astrophys. J. 641, 689–709. doi: 10.1086/500572
Wagner, A. Y., Umemura, M., and Bicknell, G. V. (2013). Ultrafast outflows: galaxy-scale active galactic nucleus feedback. Astrophys. J. 763:L18. doi: 10.1088/2041-8205/763/1/L18
Walsh, J. L., Barth, A. J., Ho, L. C., and Sarzi, M. (2013). The M87 black hole mass from gas-dynamical models of space telescope imaging spectrograph observations. Astrophys. J. 770:86. doi: 10.1088/0004-637X/770/2/86
Wang, J., Wei, J. Y., and He, X. T. (2006). A sample of IRAS infrared-selected seyfert 1.5 galaxies: infrared color α(60, 25)-dominated eigenvector 1. Astrophys. J. 638, 106–119. doi: 10.1086/498667
Wang, T., Brinkmann, W., and Bergeron, J. (1996). X-ray properties of active galactic nuclei with optical FeII emission. Astron. Astrophys. 309, 81–96.
Wills, B. J., and Browne, I. W. A. (1986). Relativistic beaming and quasar emission lines. Astrophys. J. 302, 56–63. doi: 10.1086/163973
Wills, B. J., Laor, A., Brotherton, M. S., Wills, D., Wilkes, B. J., Ferland, G. J., et al. (1999). The PG X-Ray QSO sample: links between the ultraviolet-X-ray continuum and emission lines. Astrophys. J. 515, L53–L56. doi: 10.1086/311980
Wisotzki, L., Christlieb, N., Bade, N., Beckmann, V., Köhler, T., Vanelle, C., et al. (2000). The Hamburg/ESO survey for bright QSOs. III. A large flux-limited sample of QSOs. Astron. Astrophys. 358, 77–87.
Wu, Q. (2009). The black hole mass, Eddington ratio and MBH-σ[OIII] relation in young radio galaxies. Monthly Notices R. Astron. Soc. 398, 1905–1914. doi: 10.1111/j.1365-2966.2009.15127.x
Zamanov, R., Marziani, P., Sulentic, J. W., Calvani, M., Dultzin-Hacyan, D., and Bachev, R. (2002). Kinematic linkage between the broad- and narrow-line-emitting gas in active galactic nuclei. Astrophys. J. 576, L9–L13. doi: 10.1086/342783
Zamfir, S., Sulentic, J. W., and Marziani, P. (2008). New insights on the QSO radio-loud/radio-quiet dichotomy: SDSS spectra in the context of the 4D eigenvector1 parameter space. Monthly Notices R. Astron. Soc. 387, 856–870. doi: 10.1111/j.1365-2966.2008.13290.x
Zamfir, S., Sulentic, J. W., Marziani, P., and Dultzin, D. (2010). Detailed characterization of Hβ emission line profile in low-z SDSS quasars. Monthly Notices R. Astron. Soc. 403, 1759. doi: 10.1111/j.1365-2966.2009.16236.x
Keywords: black hole physics, quasars: general, quasars: evolution, quasars: radio loud, radio jet formation, multivariate analysis, cladistics
Citation: Fraix-Burnet D, Marziani P, D'Onofrio M and Dultzin D (2017) The Phylogeny of Quasars and the Ontogeny of Their Central Black Holes. Front. Astron. Space Sci. 4:1. doi: 10.3389/fspas.2017.00001
Received: 30 December 2016; Accepted: 07 February 2017;
Published: 27 February 2017.
Edited by:
Jirong Mao, Yunnan Observatories (CAS), ChinaReviewed by:
Daniela Bettoni, Osservatorio Astronomico di Padova (INAF), ItalyMilan S. Dimitrijevic, Astronomical Observatory, Serbia
Copyright © 2017 Fraix-Burnet, Marziani, D'Onofrio and Dultzin. This is an open-access article distributed under the terms of the Creative Commons Attribution License (CC BY). The use, distribution or reproduction in other forums is permitted, provided the original author(s) or licensor are credited and that the original publication in this journal is cited, in accordance with accepted academic practice. No use, distribution or reproduction is permitted which does not comply with these terms.
*Correspondence: Didier Fraix-Burnet, didier.fraix-burnet@univ-grenoble-alpes.fr