


1. INTRODUCTION
In the context of global warming and sea-level rise, changes in the mass balance of the ice sheets must be carefully monitored, understood and anticipated, as they could become the main contributor of sea-level rise in the coming centuries (Church and others, Reference Church, Stocker, Qin, Plattner, Tignor, Allen, Boschung, Nauels, Xia, Bex and Midgley2013). The mass balance of an ice sheet is approximately the sum of the surface mass balance (SMB) and the grounding line mass balance, both terms being uncertain in the context of global warming (Bengtsson and others, Reference Bengtsson, Koumoutsaris and Hodges2011; Rignot and others, Reference Rignot, Mouginot, Morlighem, Seroussi and Scheuchl2014).
Present-day field monitoring and atmospheric reanalyses depict a year-round occurrence of rare snowfall events in central East Antarctica (e.g. Ekaykin, Reference Ekaykin2003; Fujita and Abe, Reference Fujita and Abe2006). Moisture back-trajectories identify ice core moisture sources located on average at 45°S today, but with a larger contribution of lower latitudes for the highest elevation, i.e. most inland sites (Masson-Delmotte and others, Reference Masson-Delmotte2008; Suzuki and others, Reference Suzuki, Yamanouchi and Motoyama2008; Sodemann and Stohl, Reference Sodemann and Stohl2009; Scarchilli and others, Reference Scarchilli, Frezzotti and Ruti2011). Different ice cores have different longitudinal origins of water vapor, depending on their location (Fig. 1). For instance, Dome C receives moisture predominantly from the Indian Ocean sector, while it is mostly advected from the Atlantic Ocean towards Dome F (e.g. Reijmer and others, Reference Reijmer, van den Broeke and Scheele2002; Suzuki and others, Reference Suzuki, Yamanouchi and Motoyama2008; Sodemann and Stohl, Reference Sodemann and Stohl2009). The SMB in Antarctica is also a function of the surface elevation of the ice sheet (e.g. Takahashi and others, Reference Takahashi, Ageta, Fujii and Vvataabe1994; Krinner and Genthon, Reference Krinner and Genthon1999) and is affected by the redeposition of snow by wind (Gallée and others, Reference Gallée2012). For example, it is known that SMB differs between the windward and leeward sides of ice divides for strong-wind events (Fujita and others, Reference Fujita2011). In addition, local variations in the SMB are governed by the local surface topography, which is influenced by the bedrock topography (Fujita and others, Reference Fujita2011). Above the Antarctic plateau, accumulation is not only driven by maritime intrusions and snowfall events, but also by clear sky condensation, possibly related to boundary layer dynamics. Finally, it may also be affected by exchanges of water vapor between surface snow and the surrounding air (Hoshina and others, Reference Hoshina2014). Such processes have been recently highlighted by diurnal variations in vapor isotopic composition both in Greenland (Steen-Larsen and others, Reference Steen-Larsen2014) and Antarctica (Ritter and others, Reference Ritter2016). Considering the exchanges of water vapor between surface snow and the surrounding air as well as snow transportation by wind, not only high-precipitation events associated with strong winds, but also daily exposure to prevailing wind, E-N-E at Dome Fuji (DF) and S at EPICA Dome C (EDC), may have significant effects on SMB, water stable isotope ratios and snow properties at these dome sites.

Fig. 1. Map of the Antarctic continent with elevation contours every 500 m. The two ice coring sites used in this study, Dome C and DF, are marked with stars. Other ice coring sites mentioned in this paper are marked with filled circles. The prevailing wind directions at surface for both the Dome C and DF sites are indicated with arrows.
Ice sheets also form a rich paleo-climatic archive. For dating (e.g. Kawamura and others, Reference Kawamura2007; Parrenin and others, Reference Durand2007) or interpreting the ice core records (e.g. transferring concentrations of species in ice into atmospheric fluxes; Wolff and others, Reference Wolff2006), an evaluation of the past SMB is needed. Indeed, the annual layer thickness along an ice core is the product of the initial SMB and the vertical thinning function accounting for the ice flow. Usually, past SMB is presumed to be exponentially related to the deuterium (δDice) or oxygen-18 (δ 18Oice) isotopic content of the ice. The underlying assumption is that condensation is proportional to the saturation vapor pressure of water in air, which itself is related to condensation temperature and therefore to precipitation isotopic composition (Jouzel and others, Reference Jouzel1987; Parrenin and others, Reference Parrenin, Rémy, Ritz, Siegert and Jouzel2004, Reference Parrenin2007; Masson-Delmotte and others, Reference Masson-Delmotte2008). This approach has been applied to obtain past SMB estimates for deep ice cores after correcting the water stable isotope records for variations in the isotopic composition of the ocean, and/or for artifacts due to changes in moisture sources, using the second-order deuterium excess information (Stenni and others, Reference Stenni2001; Parrenin and others, Reference Durand2007; Uemura and others, Reference Uemura2012).
Alternatively, constrains from ice core chronologies can be used to infer changes in layer thickness, which, after correction for thinning, provide information on past changes in SMB. For example, an alternative approach to estimating past SMB of polar ice sheets is to investigate ice-equivalent thickness between accurately dated reference horizons in the ice core stratigraphy, such as volcanic eruption markers, and to correct for vertical thinning. This approach is widely used to estimate the SMB of relatively shallow cores or snow pits (e.g. Frezzotti and others, Reference Frezzotti, Scarchilli, Becagli, Proposito and Urbini2013 and references therein). However, thus far, this approach has not been used for the enormous number of volcanic markers found in very deep ice cores because most of the volcanic markers in such ice cores have not been dated independently.
Here, we propose a similar approach to estimate the past ratio of SMB between DF and EDC, two remote dome sites in East Antarctica (Fig. 1). Deep ice cores drilled at the two sites were first synchronized by identifying 1401 volcanic tie points over a period covering the past 216 ka (Fujita and others, Reference Fujita, Parrenin, Severi, Motoyama and Wolff2015). Instead of dating these 1401 volcanic horizons independently, we derive changes in the relative thickness of the ice core sections covering the same time periods in the two cores. After correction of the mechanical thinning effects due to glacial flow, we are able to derive the SMB ratio between the two places. The thinning function is relatively straightforward to evaluate for these drilling sites located on domes, where horizontal advection is expected to be negligible. This new approach provides information on the relative SMB pattern of the East Antarctic ice sheet over glacial-interglacial cycles from the last 216 ka. We discuss how spatially inhomogeneous changes of the SMB may have occurred between the two remote dome sites.
2. METHODS
2.1. The two studied ice core drilling sites
DF and Dome C are two remote dome summits in East Antarctica located ~2000 km apart (Table 1; Fig. 1). DF is located on the polar plateau facing the Atlantic and Indian Ocean sectors and is surrounded by the Dronning Maud Mountains, a coastal escarpment in particular along longitudes ranging from ~20°W to ~35°E. At DF, prevailing wind direction is from the east (Table 1). Presently, DF shows a spatial gradient of SMB decreasing southwards (Fujita and others, Reference Fujita2011). High-precipitation events associated with strong winds from the NE direction have a major influence on the SMB (Fujita and Abe, Reference Fujita and Abe2006), but no seasonality of precipitation has been noted (Fujita and Abe, Reference Fujita and Abe2006; Kameda and others, Reference Kameda, Motoyama, Fujita and Takahashi2008).
Table 1. Information on the two drilling sites
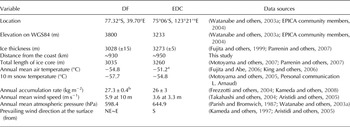
a Over the period 1984–2013.
b Snow stake farm.
Dome C is located at one of the dome summits in East Antarctica in the Indian Ocean sector and the moisture predominantly comes from the Indian Ocean. Its elevation is lower than that of DF by ~570 m. This part of the East Antarctic ice sheet has a gentler slope from the coast to polar plateau compared with the escarpment surrounding DF (Fig. 1). Reflecting the shape of the East Antarctic ice sheet, prevailing surface winds are from the south, that is, from continental inland; surface winds rarely occur from the west, north or east directions (Aristidi and others, Reference Aristidi2005).
It should first be noted that at present, DF is higher by 600 m, slightly colder, and has 30‰ more depleted surface snow δD than EDC (Table 1; Fig. 1). The EDC-DF isotopic differences cannot be explained by differences in surface temperature or relationships with accumulation, based on Rayleigh distillation relationships. The DF-EDC deuterium difference would require 6°C difference in condensation temperature to be accounted for, based on the spatial isotope/temperature relationship (Jouzel and Merlivat, Reference Jouzel and Merlivat1984). In fact, possible explanations for such an isotopic difference are linked with the origin of precipitation (Masson-Delmotte and others, Reference Masson-Delmotte2011), with differences in condensation temperature, with precipitation seasonality and/or intermittency (Masson-Delmotte and others, Reference Masson-Delmotte2011), with surface snow/vapor interactions (Hoshina and others, Reference Hoshina2014; Steen-Larsen and others, Reference Steen-Larsen2014) or with elevation differences between the two sites. The more depleted modern value of δDice at DF may for instance be explained by a higher proportion of precipitation occurring during winter at this site compared with EDC (but we have no observational evidence to confirm this hypothesis at the moment) or by a more remote moisture source, as expected from the wider winter expansion of sea ice in the Atlantic compared with the Indian Ocean sector (Gersonde and others, Reference Gersonde, Crosta, Abelmann and Armand2005).
At each of the two sites, two long ice cores have been drilled. At DF, the first core (DF1) was drilled in 1992–98 to a depth down to 2503 m (Watanabe and others, Reference Watanabe2003a). The second 3035 m long core (DF2), reaching almost to the ice-sheet bed, was drilled in 2004–07, at a site ~43 m from the DF1 borehole (Motoyama, Reference Motoyama2007). At Dome C, the first core (EDC96) was started in the 1996/97 season to a depth of 790 m. The second 3270 m long core (EDC99) reaching nearly the ice-sheet bed, was started during the 1999/2000 season at a site 10 m away from the EDC96 core (EPICA community members, 2004). Ice core signals from these four cores have been used here for volcanic synchronization.
Here we use as a reference chronology the DFO-2006 timescale established for the DF ice core (Kawamura and others, Reference Kawamura2007). This age scale is only used to plot quantities versus age, but has no impact on the reconstruction of the SMBEDC/SMBDF ratio. Comparisons between chronologies for DF and EDC cores are discussed by Fujita and others (Reference Fujita, Parrenin, Severi, Motoyama and Wolff2015).
2.2. EDC-DF volcanic synchronization and synchro-based SMBEDC/SMBDF ratio
The EDC-DF volcanic matching consists of 1401 depth tie points (Fujita and others, Reference Fujita, Parrenin, Severi, Motoyama and Wolff2015), down to a depth of 2184 m at DF and 2170 m at EDC, which roughly corresponds to an age of 216 ka in the DFO-2006 chronology (Kawamura and others, Reference Kawamura2007). On average, that makes one tie point every 154 a, although their distribution is irregular (Fig. 2). For the periods of MIS 3, 5a and 5b–5e, a large number of tie points were found, typically one every 50–100 a. Identifying unequivocal tie points was difficult in some cold periods such as MIS 2, 4, 5b and 6. For volcanic signals, ECM, DEP and sulfate data were used for EDC, and ECM and ACECM data were used for DF. More details on the synchronization are given by Fujita and others (Reference Fujita, Parrenin, Severi, Motoyama and Wolff2015). These tie points were then placed on an age scale (DFO2006) and re-interpolated every ka. The ratio of layer thickness at EDC and DF of these 1 ka-long intervals Δz EDC/Δz DF can be inferred (Figs 2 and 3). We refer to it as the layer thickness ratio.

Fig. 2. Ratio of layer thickness (green) or surface mass balance (red) after correcting for the EDC–DF thinning ratio (blue). The density of tie points (violet) is indicated in the lower panel (No. of tie points ka−1). The DFO-2006 (Kawamura and others, Reference Kawamura2007) and AICC2012 (Bazin and others, Reference Bazin2013; Veres and others, Reference Veres2013) age scales are indicated.

Fig. 3. Scheme illustrating the derivation of the ∆z EDC/∆z DF ratio from the volcanic links in between the EDC and DF ice cores.
Vertical thinning τ due to ice flow has been estimated both for the EDC and DF ice cores based on a one-dimensional (1-D) ice flow model (Parrenin and others, Reference Durand2007) with a prescribed analytical velocity profile (Lliboutry, Reference Lliboutry1979) and a prescribed ice thickness evolution based on a 3-D model of Antarctic evolution (Ritz and others, Reference Ritz, Rommelaere and Dumas2001). The thinning ratio between EDC and DF τ EDC/τ DF is 1 for the present-day and increases up to ~1.5 at 200 ka (high thinning ratios imply that EDC thins less than DF), which is mainly due to the fact that the ice thickness is larger at EDC than DF (Table 1). After correcting the layer thickness ratio Δz EDC/Δz DF by the vertical thinning effects, we obtain a synchro-based SMBEDC/SMBDF ratio (Fig. 2).
2.3. Surface temperature and mass balance at EDC and DF
A simple Rayleigh model can link the variations of the isotopic composition of vapor in an air mass with the variations of its temperature (Dansgaard, Reference Dansgaard1964). Estimates of surface temperature can therefore be evaluated from the isotopic content of the ice δ 18Oice and δDice, first corrected for the temporal variations in isotopic content of the ocean δ 18OSW and δDSW (Jouzel and others, Reference Jouzel2003):
 $${\delta ^{{\rm 18}}{\rm O}_{{\rm corr}} = \delta ^{{\rm 18}}{\rm O}_{{\rm ice}} - \delta ^{{\rm 18}}{\rm O}_{{\rm SW}}\displaystyle{{{\rm 1} + \delta ^{{\rm 18}}{\rm O}_{{\rm ice}}} \over {{\rm 1} + \delta ^{{\rm 18}}{\rm O}_{{\rm SW}}}}},$$
 $${\delta {\rm D}_{{\rm corr}} = \delta {\rm D}_{{\rm ice}} - \delta {\rm D}_{{\rm SW}}\displaystyle{{{\rm 1} + \delta {\rm D}_{{\rm ice}}} \over {{\rm 1} + \delta {\rm D}_{{\rm SW}}}}}.$$
δ 18OSW is taken as reconstructed by Bintanja and others (Reference Bintanja, de Wal and Oerlemans2005) based on the exhaustive LR04 oceanic stack (Lisiecki and Raymo, Reference Lisiecki and Raymo2005). δDSW is calculated on the assumption that δDSW = 8δ 18OSW. From this, we derive a first reconstruction of accumulation, called ocean-corrected (Fig. 4):
 $${a_{{\rm oc}} = A^{\rm 0}{\rm exp}\left( {\beta \left( {\delta {\rm D}_{{\rm corr}} - \delta {\rm D}_{{\rm corr}}^{\rm 0}} \right)} \right)}$$
with β = 0.015, δD0 corr = −390.9‰ and A 0 = 3.1 cm (ice) a−1 for EDC and β = 0.013, δD0 corr = −403.1‰ and A 0 = 3.8 cm (ice) a−1 for DF. The values of these parameters were chosen for a best fit (Fig. 4) with the published accumulation reconstructions that are compatible with the age scales of the two cores (Parrenin and others, Reference Durand2007). The ratio of these reconstructed SMB histories is hereafter named ocean-corrected SMBEDC/SMBDF ratio.

Fig. 4. Comparison of various accumulation reconstructions for the EDC and DF ice cores: ocean-corrected (light blue), source-corrected (green) and published (pink, Parrenin and others, Reference Durand2007).
SMB estimates can be refined by correcting the water stable isotope records for variations in the temperature of the ocean where the moisture forms and/or for artifacts due to changes in moisture sources using the second-order deuterium excess record. Site and source temperature estimates over time ΔT site and ΔT source can be deduced using a set of two linear equations (Stenni and others, Reference Stenni2001; Uemura and others, Reference Uemura2012):
 $${\delta {\rm D}_{{\rm corr}} - \delta {\rm D}_{{\rm corr}}^{\rm 0} = \gamma _{{\rm site}}{\rm \Delta} T_{{\rm site}} - \gamma _{{\rm source}}{\rm \Delta} T_{{\rm source}}},$$
 $${d_{{\rm corr}} - d_{{\rm corr}}^{\rm 0} = - \beta _{{\rm site}}{\rm \Delta} T_{{\rm site}} + \beta _{{\rm source}}{\rm \Delta} T_{{\rm source}}},$$
where d corr, the corrected deuterium excess, is d corr = δDcorr–8δ 18Ocorr. The coefficients of Eqs. (4, 5), namely γ site, γsource, β site and β source, have been previously inferred at both sites using a simple Rayleigh-based model, constrained with present-day surface data on the trajectories of air masses and their values can be found in Uemura and others (Reference Uemura2012). Site temperature is calculated from ΔT site using the 10 m snow temperature (Table 1) as the average temperature for the 0–1 ka b1950 interval. From this, we derive a second accumulation reconstruction, called source-corrected (Fig. 4), which is not based directly on δDice but on the source-corrected site temperature reconstruction:
 $${a_{{\rm sc}} = A^{\rm 0}{\rm exp}\left( {\beta \left( {\gamma _{{\rm site}} - \beta _{{\rm site}}\displaystyle{{\gamma _{{\rm source}}} \over {\beta _{{\rm source}}}}} \right){\rm \Delta} T_{{\rm site}}} \right)},$$
which translates into:
 $${a_{{\rm sc}} = A^{\rm 0}{\rm exp}\left( {\beta \left( {\left( {\delta {\rm D}_{{\rm corr}} - \delta {\rm D}_{{\rm corr}}^{\rm 0}} \right) + \displaystyle{{\gamma _{{\rm source}}} \over {\beta _{{\rm source}}}}\left( {d_{{\rm corr}} - d_{{\rm corr}}^{\rm 0}} \right)} \right)} \right)},$$
with β = 0.016, δD0 corr = −390.9‰, d 0 corr = 10.1‰ and A 0 = 3.2 cm (ice) a−1 for EDC and β = 0.015, δD0 corr = −403.1‰, d 0 corr = 13.4‰ and A 0 = 3.7 cm (ice) a−1 for DF. The values of these parameters were chosen for a best fit (Fig. 4) with the published accumulation reconstructions that are compatible with the age scales of the two cores (Parrenin and others, Reference Durand2007). The ratio of these reconstructed SMB histories is hereafter named source-corrected SMBEDC/SMBDF ratio.
The formulas that we used here for temperature reconstructions are the same as in Uemura and others (Reference Uemura2012), but slightly different from those used by Parrenin and others (Reference Durand2007). At the time of this second study, EDC deuterium excess was not available, and therefore the accumulation was only inferred from the deuterium data after ocean correction. Here, we use the EDC deuterium excess data (Stenni and others, Reference Stenni2010) to provide a coherent approach for the two sites.
2.4. Simplified ice thickness models at EDC and DF
Ice thickness variations on the East Antarctic plateau can be mainly explained by variations in surface accumulation (Parrenin and others, Reference Durand2007). To test the implications of various accumulation reconstructions on the ice thickness history at the two sites, we used a 1-D conceptual model (Parrenin and others, Reference Durand2007) fitted onto 3-D simulations (Ritz and others, Reference Ritz, Rommelaere and Dumas2001). This model is a simple linear perturbation model, where the vertical velocity of ice at surface with respect to bedrock is written:
 $${a - \displaystyle{{\partial H} \over {\partial t}} = k + k_{\rm H}H + k_{\rm S}S},$$
and where the bedrock follows a simple relaxation law to an equilibrium:
 $${\displaystyle{{\partial B} \over {\partial t}} = \displaystyle{{(B_{\rm 0} - H/k_{\rm B}) - B} \over {\tau _{\rm B}}}},$$
where a is the accumulation rate, B is the bedrock elevation, H is the ice thickness, S = B + H is the surface elevation of the ice sheet, and k, k H, k S, k B, B 0 and τ B are parameters, whose values for EDC and DF are given in Table 2 of Parrenin and others (Reference Durand2007). B 0 corresponds to a bedrock elevation without isostatic effect. There is a systematic bias of the model toward lower elevation. Therefore, we only consider the elevation changes with respect to the present.
3. RESULTS
3.1. Synchro-based SMBEDC/SMBDF ratio and comparison with the δD records
The ratio of layer thickness Δz EDC/Δz DF inferred from the volcanic synchronization (Fig. 2, green curve) exhibits an increasing trend towards the past. We correct the layer thickness ratio for the vertical thinning ratio as deduced from ice flow modeling at both sites (Fig. 2, blue curve) and obtain the SMBEDC/SMBDF ratio (Fig. 2, orange curve).
Our synchro-based SMBEDC/SMBDF ratio depicts large variations of up to 0.4. These variations resemble the variations of the δDice profiles. The correlation coefficient is 0.74 between the average deuterium profile at EDC and DF and the SMBEDC/SMBDF ratio for 1 ka re-sampled time series. Figure 5 suggests a correlation for minor troughs and peaks, as indicated by the thin black vertical dashed lines, although the correlation is not systematic. For example, during the early optimum of the last interglacial period occurring at ~128 ka on the DFO-2006 age scale, our method reconstructs SMBEDC/SMBDF ratio to be 1.1. However, there are also periods when no relationship between SMBEDC/SMBDF and δDice is observed. This is the case during the glacial inception cooling (MIS 5d and 5c). Indeed, the lowest values of the synchro-based SMBEDC/SMBDF ratio (0.7) are reached for MIS 5d–5c, while the lowest values of the δDice profiles are reached at the Last Glacial Maximum (LGM).
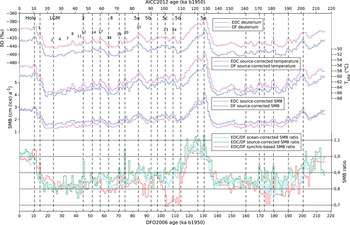
Fig. 5. (top) DF (Watanabe and others, Reference Watanabe2003a) (blue) and EDC (Jouzel and others, Reference Jouzel2007) (pink) δD ice variations. Top labels indicate the Marine Isotope Stages and bottom labels indicate the Antarctic Isotopic Maxima (AIMs) events. (middle top) DF (blue) and EDC (pink) source-corrected T site reconstructions (this study). (middle bottom) DF (blue) and EDC (pink) source-corrected surface accumulation rate (this study). (bottom) Ratio of ocean-corrected (light blue), source-corrected (green) and synchro-based (red) surface mass balances. The DFO-2006 (Kawamura and others, Reference Kawamura2007) and AICC2012 age scales (Bazin and others, Reference Bazin2013; Veres and others, Reference Veres2013) are used. The thin vertical black dashed lines mark correspondences in millennial scale events. Note that we did not plot the ratio of the published SMBs at EDC and DF (Parrenin and others, Reference Durand2007), since they used inconsistent formulas (Section 2).
We now focus on the present and last interglacial periods. We first observe that the synchro-based SMBEDC/SMBDF is stable during the late part of the interglacial periods (125–118 and 8–0 ka b1950), despite different δD trends (a long-term decrease at DF versus stable levels at EDC). Second, we note very similar levels in the synchro-based SMBEDC/SMBDF during the present and during the warmer last interglacial period.
3.2. Comparison of the synchro-based and isotope-based SMBEDC/SMBDF ratios
The synchro-based and isotope-based (ocean-corrected and source-corrected) SMBEDC/SMBDF ratios are compared in Figure 5. The large-scale variations of all SMB ratios display glacial-interglacial variations. The source correction has only a minor effect when compared with the ocean-corrected SMBEDC/SMBDF, with differences generally < 0.1. The differences are larger between the synchro-based and isotope-based SMBEDC/SMBDF ratios. In particular during MIS 5d and 5c, the difference reaches 0.2, the synchro-based SMBEDC/SMBDF ratio being less than what can be inferred based on water isotopes. The difference also reaches 0.1 for periods at 60 and 90 ka b1950. Another noticeable difference is that the synchro-based SMBEDC/SMBDF ratio displays peaks at the beginning of the Holocene and Eemian periods while the isotope-based SMBEDC/SMBDF ratios do not.
3.3. Consequences on elevation variations and thinning functions
As Parrenin and others (Reference Durand2007) have shown, the thinning function is influenced by the elevation variations at the drilling sites, which is itself influenced by accumulation variations. We can therefore ask ourselves how robust are the thinning functions that we used to calculate the synchro-based SMBEDC/SMBDF ratio. For EDC, we calculate an alternative accumulation reconstruction by multiplying the source-corrected SMBDF by our synchro-based SMBEDC/SMBDF ratio. We call this the synchro-based SMBEDC. Similarly, we calculate the synchro-based SMBDF by dividing the source-corrected SMBEDC by our synchro-based SMBEDC/SMBDF ratio. Then we calculate the elevation variations at EDC and DF from our conceptual model described in Section 2 and from the source-corrected or synchro-based SMB scenarios.
The results are displayed on Figure 6. For both EDC and DF, the two accumulation scenarios lead to the same qualitative features, with an ice thickness smaller during glacial periods and higher during interglacial periods. For EDC, the LGM ice thickness is ~160 m (resp. ~150 m) lower than the present-day thickness for the source-corrected (resp. synchro-based) SMB scenario. The standard deviation of the difference between both scenarios is ~10.5 m. The largest difference is ~35 m for MIS5d, i.e. ~1% of the ice thickness. For DF, the LGM ice thickness is ~145 m (resp. ~160 m) lower than the present-day thickness for the source-corrected (resp. synchro-based) SMB scenario. The standard deviation of the difference between both scenarios is ~14.5 m. The largest difference is ~60 m for MIS5d, i.e. ~2% of the ice thickness.

Fig. 6. Elevation variations at EDC (top) and DF (bottom) based on two different scenarios of SMB variations: source-corrected (blue) and synchro-based (pink).
4. DISCUSSIONS
4.1. Reliability of the thinning corrections and of the volcanic match
A first argument for the reliability of the thinning evaluation comes from the fact that the SMBEDC/SMBDF curve, after the thinning correction, has a negligible decreasing trend toward the past. Indeed, we do not expect the SMBEDC/SMBDF ratio to have a trend over several glacial-interglacial cycle. This suggests that the main trends of the thinning functions at EDC and DF have been captured by the ice flow models. The part of the Δz EDC/Δz DF curve that varies at the glacial/interglacial scale, could also be due in part to the vertical thinning, with glacial layers relatively more thinned at EDC, and not correctly accounted for in the ice flow modeling exercises that we used. There is indeed a correlation between climate and some ice physical properties, such as fabric (Durand and others, Reference Durand2009) or impurities (Watanabe and others, Reference Watanabe2003b; Fujita and others, Reference Fujita, Parrenin, Severi, Motoyama and Wolff2015), which can have an impact on ice flow properties. However, this hypothesis seems unlikely for several reasons. First, by mass conservation, an abnormally thinned layer at some place can only be explained if this layer is abnormally thickened at a neighboring place, but no irregularity is observed in the isochronal layers observed by ice sounding radars at DF (Fujita and others, Reference Fujita1999, Reference Fujita2012) or EDC (Siegert and others, Reference Siegert, Hodgkins and Dowdeswell1998; Tabacco and others, Reference Tabacco, Passerini, Corbelli and Gorman1998; Cavitte and others, Reference Cavitte2016). Second, if glacial ice is softer than interglacial ice, the relative difference in cumulated vertical thinning with interglacial ice should increase with the age of the ice layers, as is shown by mechanical simulations (Durand and others, Reference Durand2007), but no such effect is observed in the Δz EDC/Δz DF curve. Third, mechanical simulations do not suggest that ice layers with different viscosities can lead to a very irregular thinning function (Durand and others, Reference Durand2007). As outlined in Section 3, the ice thickness reconstructions at EDC and DF are also partially uncertain due in particular to uncertainties in the accumulation scenarios. These relative uncertainties on the ice thickness scenarios of ~1% for EDC and ~2% for DF lead to approximately the same relative uncertainties on the thinning functions. This can explain neither the glacial-interglacial variations of the synchro-based SMBEDC/SMBDF ratio of up to 0.4, nor the 0.2 difference between the source-corrected and synchro-based SMBEDC/SMBDF ratios at MIS5d. Finally, the interplay between the dome movement and the different strain rates at different locations could lead to irregularities in the thinning function. Indeed, the strain regime is different right at a dome than a few kilometers downstream on a flank due to the Raymond effect (Raymond, Reference Raymond1983) and the strain regime is also a function of the ice thickness. But there is no obvious reason why these effects would lead to a thinning function correlated with the deuterium profiles.
These elements therefore suggest that the main characteristics of our synchro-based SMBEDC/SMBDF ratio are not due to error in the evaluations of the thinning functions at both sites. However, we can expect some errors in the modeling of the thinning functions at both sites to affect the details of our synchro-based SMBEDC/SMBDF ratio. For example, as outlined previously, the error in the SMB reconstruction used at both sites to model the thinning functions (Parrenin and others, Reference Durand2007) can affect ice-sheet thickness evaluation by ~2% at maximum, which translates into a 2% error in the thinning function. Also, spatial variations in the ice thickness around both drilling sites can affect the thinning functions if the ice flow is not purely vertical (Parrenin and others, Reference Parrenin, Rémy, Ritz, Siegert and Jouzel2004). This is, however, difficult to assess since we do not have robust estimates of the dome movements during the past.
The robustness of the volcanic match used to deduce the synchro-based SMBEDC/SMBDF ratio can also be discussed, especially during the 105–113 ka b1950 time interval (MIS 5c and 5d), when the synchro-based and isotope-based SMBEDC/SMBDF ratios deviate by as much as 0.2. Given the number of tie points in this interval (95), it seems very unlikely that the volcanic match is entirely wrong. Moreover, if the low values of the synchro-based SMBEDC/SMBDF ratio during this time period were due to an incorrect volcanic match, it would be compensated by too high values before 105 ka b1950 or after 113 ka b1950. But no such high values are observed, suggesting that an incorrect volcanic match is not the cause of the synchro-based and isotope-based SMBEDC/SMBDF ratios difference during this time period. Moreover, we tried to guide our volcanic match during this time interval, so that the synchro-based SMBEDC/SMBDF ratio would be in agreement with the isotope-based SMBEDC/SMBDF ratios, but no satisfying volcanic match could be achieved.
Sulfate (Watanabe and others, Reference Watanabe2003b; Wolff and others, Reference Wolff2006; Iizuka and others, Reference Iizuka2012) and beryllium-10 (Cauquoin and others, Reference Cauquoin2015) have been proposed to have a nearly temporally constant flux above Antarctica and could be used for an independent check of our synchro-based SMBEDC/SMBDF ratio. Among those two, only sulfate is available for our studied time period and for both EDC (Wolff and others, Reference Wolff2006) and DF (Watanabe and others, Reference Watanabe2003b; Iizuka and others, Reference Iizuka2012). Unfortunately, it appears that the sulfate flux is not constant enough at DF (Iizuka and others, Reference Iizuka2012; Figure 2d) for sulfate dilution to be a useful SMB proxy.
4.2. Relative change of SMB and relative change of local temperature
Glacial climatic conditions coincide with a reduced synchro-based SMBEDC/SMBDF ratio. At the LGM, we note that the 20% lower accumulation at EDC than at DF roughly corresponds to 1/5 of the full magnitude of the Holocene-LGM relative accumulation variations (factor of 2; Fig. 5). How would this difference in SMB translate into temperature differences, assuming a constant accumulation/temperature relationship? It would correspond to a 2°C temperature anomaly, scaled to a 10°C Holocene-LGM contrast of surface temperature (Parrenin and others, Reference Parrenin2013). This is consistent with a recent estimate of 2.5°C for the difference in LGM-present precipitation-weighted temperature change between the two sites, with larger amplitude estimated at EDC than at DF (Uemura and others, Reference Uemura2012). We therefore conclude that our inferred synchro-based SMB ratio change may be a consequence of a difference of precipitation-weighted temperature change between both sites.
4.3. Relative change of SMB and relative change of δD, implications for ice-sheet modeling
The differences between the variations of SMBEDC/SMBDF ratio and the δD variations as well as the differences between the synchro-based and isotope-based SMB ratios, both described in Section 3, challenge the assumption of close relationships between water stable isotope and accumulation anomalies, especially during MIS5c and MIS5d. This feature has already been suggested during the early Holocene (Parrenin and others, Reference Durand2007), during the last deglaciation (WAIS Divide Project Members, 2013) and from climate simulations of the last interglacial (Sime and others, Reference Sime, Wolff, Oliver and Tindall2009). Our study also indicates that this decoupling is site dependent. During the late part of the Holocene and the Eemian, our synchro-based SMBEDC/SMBDF ratio is more constant than what is inferred from δD variations.
Clearly, the isotope-based SMB at either EDC or DF or both are associated with relative uncertainties of at least 10%. Indeed, larger uncertainty ranges as possible because our synchronization method cannot detect correlated errors. This was also suggested by Fujita and others (Reference Fujita, Parrenin, Severi, Motoyama and Wolff2015) based on the same volcanic synchronization. They hypothesize that a cause of the systematic DFO2006/AICC2012 age differences in MIS 5 are associated with differences in the dating approaches, either the age-markers-based dating or the glaciological dating. They further hypothesize that major sources of the discrepancies were systematic errors in SMB estimation.
Inaccurate estimates of SMB based on water stable isotope records can cause important errors for chemical flux reconstructions and ice core chronologies but also for firn (Goujon and others, Reference Goujon, Barnola and Ritz2003) and ice-sheet (Ritz and others, Reference Ritz, Rommelaere and Dumas2001) modeling. For example, if the SMB evaluation at one of the two sites is wrong by as much as 20%, this would lead to a 20% error in fluxes reconstructions, in events duration and in Δage evaluation (i.e. 500–1000 a error in the ice age/gas age difference). Concerning ice-sheet modeling, we showed (Fig. 6) that our ice thickness reconstructions may be wrong by as much as 35 m for EDC and 60 m for DF (the maximum error occurring for MIS5d). Taking into account a vertical gradient of temperature of 1°C (100 m)−1, such ice sheet thinning would lead to an underestimation of the magnitude of temperature decrease ‘at fixed elevation’ by ~0.5°C.
4.4. Atmospheric process, dome movement or elevation change artifact?
In the following, we discuss three different hypotheses to explain the changes in the SMBEDC/SMBDF ratio: regional differences in climate (at constant geometry of the ice sheet), changes of dome position affecting snow redeposition by wind, or differences in elevation changes.
Different atmospheric processes may explain the variations in the SMBEDC/SMBDF ratio: (1) effects related to moisture sources and distillation along transport paths; (2) different glacial sea ice expansions in the Atlantic and Indian Ocean sectors (Gersonde and others, Reference Gersonde, Crosta, Abelmann and Armand2005), enhancing accumulation and temperature changes at EDC compared with those at DF; (3) effects associated with precipitation intermittency and/or seasonality (e.g. Suzuki and others, Reference Suzuki, Yamanouchi, Kawamura and Motoyama2013), precipitation amounts being expected to be reduced during cold periods; (4) less frequent blocking events at EDC (Massom and others, Reference Massom2004) than at DF (Hirasawa and others, Reference Hirasawa, Nakamura and Yamanouchi2000) during glacial periods, these warm events being responsible of a large proportion of the total annual accumulation today (Hirasawa and others, Reference Hirasawa, Nakamura and Yamanouchi2000); and (5) differences in sublimation, which is an important process since surface snow/vapor exchanges can alter the snowfall signal in-between snowfall events (Hoshina and others, Reference Hoshina2014; Steen-Larsen and others, Reference Steen-Larsen2014).
We now explore the dome movement hypothesis. Today, we observe a spatial gradient of accumulation at Dome C (Urbini and others, Reference Urbini2008) and DF (Fujita and others, Reference Fujita2011), due to orographic precipitation or to snow redeposition by winds linked with surface curvature. Under glacial/interglacial climatic changes (e.g. migration of the grounding line), it seems natural that the ice divides locations migrate. A movement of the domes (Saito, Reference Saito2002, provides information on the movement of DF during the past) could therefore create an apparent change of accumulation in the ice core records. A movement of the domes can also modify the trajectories and therefore the upstream origin of ice particles in the ice cores. Given that accumulation varies spatially, in particular due to surface topographic variations related to bedrock reliefs (Fujita and others, Reference Fujita2011), this second process can also create an apparent change of accumulation in the ice cores. In this case, we would not expect any constant relationship between water stable isotopes and accumulation rate, except if the dome movement is itself correlated to processes affecting the isotopic composition of water vapor and precipitation (e.g. via sea-level changes and grounding line migration).
Concerning the elevation hypothesis, it is not impossible that EDC and DF experienced different changes in elevation, since the ice flow at those two sites should not react in the same way to sea-level changes (Saito and Abe-Ouchi, Reference Saito and Abe-Ouchi2010). On one hand, DF is relatively insensitive to sea-level changes since it is well protected by the Dronning Maud Mountains. On the other hand, EDC is very sensitive to sea-level changes since grounding lines in Wilkes Lands can advance and retreat over large distances (Mengel and Levermann, Reference Mengel and Levermann2014). Therefore, it is expected that elevation change should be different at EDC and DF. Quantitatively, if inter-site temperature differences are driven only by ice thickness change, then using a vertical temperature gradient of 1°C (100 m)−1 (Krinner and Genthon, Reference Krinner and Genthon1999), 2°C colder glacial conditions at EDC will translate into a 200 m relative elevation difference at the LGM between EDC and DF. This is quite large compared with the current estimates of the central East Antarctic ice sheet LGM topography, as ice-sheet simulations suggest an overall lowering of surface elevation by ~120 m (Ritz and others, Reference Ritz, Rommelaere and Dumas2001), driven by the lower glacial accumulation. We however stress that these ice-sheet simulations were driven by a homogeneous scenario of accumulation changes (a hypothesis challenged by our findings), and that they have intrinsic limitations in the representation of dynamical effects associated with grounding line migration (Pattyn and others, Reference Pattyn2012). Moreover, we remark that there are abrupt variations of the SMB ratio, for example ~0.2 during just 1 ka at 113 ka b1950, which cannot be due to elevation variations since the later are a slow integrator of surface accumulation variations and dynamical effects.
5. CONCLUSIONS
Our study suggests that the vertical thinning functions evaluated by ice flow models at EDC and DF are valid for the depth range covered here (the past 216 ka). We produce a new paleoclimatic record, the SMBEDC/SMBDF ratio, which varies at the glacial/interglacial scale. Regional differences in climate are identified, with EDC characterized by an enhanced (+20%) amplitude of glacial cooling and drying, compared with DF. The data show that interglacial changes in SMBEDC/SMBDF ratio do not always scale with those of water stable isotopes, challenging classical hypotheses used for ice core chronologies and for ice-sheet modeling. The SMB ratio reduces strongly in MIS 5d and 5c, 20% lower than what would be deduced from the isotopes. Moreover, the SMB ratio is almost constant during the late parts of the current and last interglacial periods, in contradiction with contrasting isotopic trends at EDC and DF. Our reconstructions of SMB at EDC and DF might be improved in the future by using new aerosols records with nearly constant fluxes above Antarctica, for example, beryllium-10 (Cauquoin and others, Reference Cauquoin2015). Changes in the SMBEDC/SMBDF ratio may be due to regional climate differences at the two sites, to an artifact of dome movement influencing snow redistribution by wind, or to a different change of elevation at the two sites. Further studies are necessary to discriminate between these three hypotheses. In particular, new simulations of Antarctic ice sheet evolution using a new generation of ice-sheet models with a realistic representation of grounding line migrations (e.g. Pollard and DeConto, Reference Pollard and DeConto2012) will allow exploration of the movements and elevation variations of the domes. There is also a need for more accurate atmospheric models able to reproduce the measured present or past spatial pattern of accumulation. Expanding this approach towards other sites will also give more regional information on the past SMB pattern. The inferred regional differences in SMB variations should also be taken into account in glacial-interglacial Antarctic ice sheet modeling.
AUTHOR CONTRIBUTION
The writing of this paper was led by the two first authors: F. Parrenin and S. Fujita. They contributed equally and share the responsibilities for this paper. They carried out the synchronization work, led discussions and oversaw the writing of this paper. E. Wolff and M. Severi provided the EDC electrical profile data and EDC sulfate data, respectively. S. Fujita and H. Motoyama provided the entire electrical profile data of the DF core. All authors joined in the scientific discussions.
ACKNOWLEDGEMENTS
We thank Gerhard Krinner, Catherine Ritz, Kazue Suzuki, Jean Jouzel, Michiel Van Den Broeke and the GLACE team at LGGE for helpful discussions. We wish to also thank all participants to the field seasons at Dome C. The main logistic support was provided by IPEV and PNRA at Dome C. This work is a contribution to the European Project for Ice Coring in Antarctica (EPICA), a joint European Science Foundation/European Commission scientific program, funded by the EU and by national contributions from Belgium, Denmark, France, Germany, Italy, The Netherlands, Norway, Sweden, Switzerland and the UK. This is EPICA publication nb 305. This study was supported by a grant from the CNRS/INSU/LEFE program (‘IceChrono’ proposal). We also thank all the Dome Fuji Deep Ice Core Project members who contributed to obtaining the ice core samples, either through logistics, drilling or core processing. The main logistics support was provided by the Japanese Antarctic Research Expedition (JARE), managed by the Ministry of Education, Culture, Sports, Science and Technology (MEXT). This study was supported in part by a Grant-in-Aid for Scientific Research (A) (20241007) and a Grant-in-Aid for Young Scientists (S) (21671001) from the Japan Society for the Promotion of Science (JSPS). The manuscript was prepared with the support of National Institute of Polar Research (NIPR) publication subsidy.


 Open access