1. Introduction
Glaciers and ice sheets around the world contain information about a broad variety of environmental conditions during the Earth’s past. Analyses of polar ice cores not only provide insights into forcing factors affecting past climate (e.g. greenhouse gases, volcanic and solar activity), but also allow temperature reconstructions going back several hundred thousand years (EPICA Community Members, 2004; Reference BrookBrook, 2005; Reference Bard and FrankBard and Frank, 2006; Reference Muscheler, Joos, Beer, Müller, Vonmoos and SnowballMuscheler and others, 2007; Reference Masson-DelmotteMasson-Delmotte and others, 2009). High-alpine ice cores from mid- and low-latitude glaciers and ice caps provide complementary information, as they are able to capture regional climate signals (e.g. aerosol forcing) in areas inhabited by the majority of the world’s population (Reference ThompsonThompson and others, 2006a).
Appropriate and precise depth–age models are essential for any such palaeo-environmental studies. In polar ice cores this can be achieved using a combination of annual-layer counting on seasonally varying parameters (e.g. δ18O), matching signals to well-established chronologies and ice-flow modelling (Reference MeeseMeese and others, 1997; Reference VintherVinther and others, 2006; Reference ParreninParrenin and others, 2007). Those techniques are, however, often inapplicable for high-alpine ice cores where glacier flow is dominated by the small-scale geometry of bedrock, resulting in a strongly non-linear depth–age relationship. These difficulties cannot be resolved fully using ice-flow models (Reference Lüthi and FunkLüthi and Funk, 2001). In addition, the formation of clear annual signals within the archive is often hampered by the strongly varying distribution of snowfall as well as by post-depositional changes (e.g. wind erosion) that frequently occur in high-alpine environments (Reference Wagenbach, Geis, Leinen and SarntheinWagenbach and Geis, 1989; Reference Maupetit, Wagenbach, Weddeking and DelmasMaupetit and others, 1995; Reference Döscher, Gäggeler, Schotterer and SchwikowskiDöscher and others, 1996). Reference horizons (e.g. bomb peaks, volcanic eruptions) give additional dating constraints, but their identification is not always straightforward given the higher background level of most chemical compounds in the atmosphere of the mid-latitudes. To our knowledge, volcanic eruptions have not yet been identified in non-polar ice cores prior to AD 1258. Radiometric methods such as 210Pb offer an alternative independent option as they are not affected by such limitations, but they are restricted temporally to about only 200 years back (Reference Gäggeler, von Gunten, Rössler, Oeschger and SchottererGäggeler and others, 1983; Reference EichlerEichler and others, 2000). For longer timescales, radiocarbon dating has been applied successfully to several ice cores, where sufficient carbon-containing material was incorporated. Suitable material included wood fragments or insects (Reference ThompsonThompson and others, 1998, Reference Thompson2002, Reference Thompson2006b), although it is emphasized that macrofossils in ice cores appear rather rarely.
Carbonaceous particles are a major component of naturally occurring aerosols that are emitted ubiquitously or formed in the atmosphere, and that reach potential ice-core sites (Reference Seinfeld and PandisSeinfeld and Pandis, 1998; Reference Lavanchy, Gäggeler, Schotterer, Schwikowski and BaltenspergerLavanchy and others, 1999; Reference JenkJenk and others, 2006; Reference LegrandLegrand and others, 2007; Reference McConnellMcConnell and others, 2007). According to their thermal and optical properties, the particles are classified as organic carbon (OC, hydrocarbons of low to medium molecular weight) or elemental carbon (EC, highly polymerized hydrocarbons). OC and EC have different sources. In preindustrial times, OC was emitted predominantly from the terrestrial biosphere as primary aerosol or formed in the atmosphere as secondary aerosol from gaseous precursors, whereas the main source of EC was pyrolysis during combustion. Residence times of aerosols in the atmosphere are in the order of several days. Therefore, altering of the 14C signature of the aerosols between emission and their deposition is unlikely. This reduces potential reservoir effects to a minimum. Concentrations of water-insoluble OC and EC have been analysed in various snow-pit samples and ice cores. In Greenland, concentrations of OC vary about 4 μg kg−1 (Reference Hagler, Bergin, Smith, Dibb, Anderson and SteigHagler and others, 2007) while for the Alps concentrations of up to 60 μg kg−1 were determined (Reference JenkJenk and others, 2006). Differences were explained by the distances of the archive from major source regions. Concentrations of EC are generally lower, and range between 0.2 and 2.0 μg kg−1 in Greenland (Reference Chýlek, Johnson, Damiano, Taylor and ClementChýlek and others, 1995; Reference Hagler, Bergin, Smith, Dibb, Anderson and SteigHagler and others, 2007) and ∼30 μg kg−1 in the Alps (Reference JenkJenk and others, 2006). In the recent past a strong temporal variability of carbon concentrations is observed in ice cores, related to anthropogenic emissions (Reference Lavanchy, Gäggeler, Schotterer, Schwikowski and BaltenspergerLavanchy and others, 1999; Reference JenkJenk and others, 2006; Reference McConnellMcConnell and others, 2007). By determining the 14C/12C ratios of subsequent samples of OC for the period AD 1650–1900 from a well-dated ice core from the Swiss Alps (Fiescherhorn, 3900 m a.s.l.), it was shown that the OC incorporated in ice is almost of purely biogenic origin before about AD 1850 (Reference JenkJenk and others, 2006), making this fraction a valuable target for age determination. The applied method, based on accelerator mass spectrometry (AMS) 14C dating on samples at a microgram carbon level after previous thermal separation of OC from EC, is described in detail elsewhere and has been thoroughly validated (Reference JenkJenk and others, 2007).
In this study we discuss the application of the 14C dating technique to an ice core from Nevado Illimani (Andes, 6300 m a.s.l.) and the previously dated ice core from Colle Gnifetti (Alps, 4450 m a.s.l.) (Reference JenkJenk and others, 2009). For validation purposes we analysed various individual samples from Greenland (GRIP, Greenland Ice Core Project) with good independent age control (Reference VintherVinther and others, 2006). Low OC concentrations and potential sample contamination during processing are the major challenges of the method. The latter can be quantified, and a blank estimation for correction is presented here. Finally, 14C/12C ratios from the separated EC fractions are compared with those of OC, to evaluate the potential to use total carbon (TC = OC + EC) for dating as proposed by Reference SteierSteier and others (2006). The aim of this paper is to give a critical evaluation of the potential of this new dating method. Developing final depth–age models for both ice cores requires the integration of various sources of site-specific chronological information, which is done elsewhere (Reference KellerhalsKellerhals, 2008; Reference JenkJenk and others, 2009).
2. Study Sites and Sample Selection
Sample sequences from two ice cores are analysed in this study. The first study site is Nevado Illimani (16.62° S, 67.77° W), a permanently covered ice cap in the Bolivian Andes, where two parallel ice cores (to depths of 136.7 and 138.7 m) were drilled in 1999 in a joint expedition of the Paul Scherrer Institut (PSI, Switzerland) and the Institut de Recherche pour le Développement (IRD, France). Description of site characteristics, first dating models and climatic interpretations exist for both cores (Reference De Angelis, Simões, Bonnaveira, Taupin and DelmasDe Angelis and others, 2003; Reference KnüselKnüsel and others, 2003; Reference RamirezRamirez and others, 2003; Reference Knüsel, Brütsch, Henderson, Palmer and SchwikowskiKnüsel and others, 2005). The Amazon basin upwind of the ice-core site is considered to be a main source of carbonaceous aerosols (Reference GrahamGraham and others, 2003; Reference GuyonGuyon and others, 2004). Starting at bedrock, a continuous sequence of nine samples from the 138.7 m (113.2 m w.e.) long core was analysed for 14C. Additionally, three samples also include a well-known dating horizon (volcanic eruption, AD 1258) for cross-validation. Length and masses of the ice sections range from 0.2 to 0.7 m and 0.3 to 1.2 kg, respectively. The variations are due to varying ice quality, limited sample amounts and unknown a priori information about the actual carbon concentrations.
The second study site is Colle Gnifetti, a cold glacier saddle in the Swiss/Italian Alps (45.93° N, 7.88° E), intensively studied and characterized during past decades (Reference Oeschger, Schotterer, Stauffer, Haeberli and RöthlisbergerOeschger and others, 1977; Reference Alean, Haeberli and SchädlerAlean and others, 1983; Reference Haeberli and AleanHaeberli and Alean, 1985; Reference Wagenbach, Geis, Leinen and SarntheinWagenbach and Geis, 1989; Reference Wagner, Haeberli and StaufferWagner, 1994; Reference Döscher, Gäggeler, Schotterer and SchwikowskiDöscher and others, 1996; Reference Schwikowski, Döscher, Gäggeler and SchottererSchwikowski and others, 1999; Reference Lüthi and FunkLüthi and Funk, 2001; Reference Eisen, Nixdorf, Keck and WagenbachEisen and others, 2003; Reference BarbanteBarbante and others, 2004). It was shown that the study site preferentially accumulates summer snow, whereas winter snow is likely to be eroded by strong winds. During summer, the impurities scavenged from precipitation mainly derive from terrestrial sources around southern central Europe (Reference LugauerLugauer and others, 1998). These aerosol sources could also be tracked by chemical transport models (ECHAM5) (Reference Fagerli, Legrand, Preunkert, Vestreng, Simpson and CerqueiraFagerli and others, 2007). Long-range transport is dominated by episodic airborne dust events, the source of which is the Saharan region (Reference Wagenbach, Geis, Leinen and SarntheinWagenbach and Geis, 1989; Reference Sodemann, Palmer, Schwierz, Schwikowski and WernliSodemann and others, 2006). Carbonaceous aerosols are expected to have similar source regions and pathways. From an 82 m (62.8 m w.e.) long ice core drilled in 2003 on a location where the oldest ice was expected, a nearly continuous sequence of the deepest 15 m was analysed for this study. Sizes of the 13 samples range between 0.5 and 1.1 kg. Nine of these samples were used for a first dating application of the method discussed here (Reference JenkJenk and others, 2009).
For method validation, ice sections from Greenland (GRIP, 3230 m a.s.l.; 72.58° N, 37.64° W) were analysed. Eight time windows covering most of the Holocene were selected and two consecutive sections each of about 0.5 m ice were processed as one sample of approximately 2 kg mass. A larger sample amount was chosen, as OC concentrations are expected to be low at Summit in Greenland (Reference Hagler, Bergin, Smith, Dibb, Anderson and SteigHagler and others, 2007).
We also discuss two 14C samples from another Andean ice core (Mercedario, 6100 m a.s.l.; 31.97° S, 70.12° W, drilled in 2005) with an estimated age of 100 ± 10 years using conventional annual-layer counting. Sample details together with the results are listed in Tables 1–3.
Table 1. Summary of the Colle Gnifetti 2003 ice-core samples, which were analysed by 14C dating including the samples previously analysed and discussed (Reference JenkJenk and others, 2009). Absolute uncertainties indicate the 1σ range

Table 2. Summary of the Illimani 1999 ice-core samples, which were analysed by 14C dating. Absolute uncertainties indicate the 1σ range

Table 3. Summary of the Mercedario and GRIP ice-core samples, which were analysed by 14C dating. Absolute uncertainties indicate the 1σ range

3. Methods
3.1. Carbonaceous particle extraction and OC/EC separation
The method used in this study relies on techniques that were primarily developed to attribute sources of ambient aerosols from air filters by tracking their carbon contents isotopically (Reference SzidatSzidat and others, 2004a,Reference Szidatb). A two-step combustion performed with the THEODORE system (Reference SzidatSzidat and others, 2004c) allows a separation of OC from EC. By measuring the 14C/12C ratios of the two particulate carbon fractions, the contribution of fossil vs biogenic sources can be estimated, assuming a contemporary 14C/12C ratio for biogenic and a 14C extinct signal for anthropogenic (fossil) carbon (Reference ReddyReddy and others, 2002; Reference SzidatSzidat and others, 2006). First applications on snow and ice samples were realized by Reference Biegalski, Currie, Fletcher, Klouda and WeissenbökBiegalski and others (1998) and Reference Slater, Currie, Dibb and BennerSlater and others (2002). For the adaptation to ice-core samples the original method was modified. A detailed description of the method and a complete overview of essential corrections are presented by Reference JenkJenk and others (2007). All steps described below were carried out under clean-room conditions (<100 particles per ft3 (i.e. per 2.83 × 10⁻² m3) with size >0.5 μm; US FED STD 209E class 100) in a laminar flow box using material of quartz, glass, stainless steel or Teflon. Filtration material was cleaned prior to use by rinsing several times with ultra-pure water (18 MΩcm quality) and preheating. In brief, ice-core sections were decontaminated by removing the outer parts with a bandsaw before rinsing the samples with ultra-pure water. After filtration of the liquid samples using freshly preheated quartz fibre filters (Pallflex Tissuquartz, 2500QAO-UP), carbonates were removed by acidifying three times with 50 μL of 0.2 M HCl. During a stepwise combustion in an oxygen stream (10 min at 340°C; 12 min at 650°C) OC is separated from EC and the resulting CO2 of each fraction is trapped cryogenically and quantified manometrically. The detection limit is ∼0.2 μg. The CO2 samples are sealed in glass ampoules for final 14C determination by accelerator mass spectrometry (AMS) at the ETH Laboratory of Ion Beam Physics.
3.2. 14C analysis
Analyses were performed between December 2005 and September 2008. Some of the early samples were measured on a 500 kV pelletron compact system ‘TANDY’ (Reference Synal, Jacob and SuterSynal and others, 2000) after reduction of the CO2 sample to a solid graphite target. Although there are suitable catalysts available for reducing small to ultra-small CO2 samples (Reference Santos, Moore, Southon, Griffin, Hinger and ZhangSantos and others, 2007a), reduction of CO2 from ice samples often showed low efficiencies. In particular, samples with a high dust load were characterized by low yields of carbon due to interfering sulfur species during graphitization (Reference JenkJenk and others, 2007). As significant fractionation occurred as a consequence of incomplete graphitization, additional corrections had to be applied using δ13C measured by isotope ratio mass spectrometry on sample aliquots. On an individual ice-core sample from Colle Gnifetti, sources and magnitudes of errors leading to the final dating uncertainty were stepwise estimated and quantified (Reference JenkJenk and others, 2007; Reference Wacker, Christl and SynalWacker and others, in press). To overcome such limitations, since December 2006 samples have been analysed using the 200 kV compact radiocarbon system ‘MICADAS’ with a gas ion source (Reference Ruff, Wacker, Gäggeler, Suter, Synal and SzidatRuff and others, 2007; Reference Synal, Stocker and SuterSynal and others, 2007), allowing direct measurement of gaseous samples of 3–30 μg with an uncertainty level as low as 1%. Where sample sizes were above 30 μg, which is the limit of the syringe used in the gas-handling system, the CO2 was split into several glass ampoules and measured consecutively. Performance tests of the AMS system were run with various reference materials in which reproducible values, in agreement with the consensus values, could be achieved for solid and gaseous targets (Reference JenkJenk and others, 2007; Reference Ruff, Wacker, Gäggeler, Suter, Synal and SzidatRuff and others, 2007). The novel AMS system has an approximately four times lower blank than typical blanks of solid targets (Reference Ruff, Szidat, Gäggeler, Suter, Synal and WackerRuff and others, in press). Additionally, the gas blanks seem to be independent of the sample sizes in the range 5–30 μg. This means that the current-dependent blank and standard corrections of AMS measurements applied in the past for small graphite targets (Reference JenkJenk and others, 2007) are no longer necessary, thus further reducing the final dating uncertainty (Reference Ruff, Wacker, Gäggeler, Suter, Synal and SzidatRuff and others, 2007, in press).
While recent developments in AMS techniques allow measurements down to below 2 μg with a precision as high as 1% for 10 μg samples (Reference Santos, Moore, Southon, Griffin, Hinger and ZhangSantos and others, 2007a,Reference Santos, Southon, Griffin, Beaupre and Druffelb), the most important limitation remains the overall procedural blank (involving all steps starting with the cutting of the ice until the final AMS analysis), which is often one to two orders of magnitude higher than the machine background (Reference CurrieCurrie, 2000). Contamination with either modern or fossil carbon, in principle possible at each step of sample processing, will influence the final results, especially considering the low carbon concentrations expected in ice-core samples (Reference Slater, Currie, Dibb and BennerSlater and others, 2002; Reference SteierSteier and others, 2006). Therefore, a low and reproducible procedural blank is required to minimize uncertainties of the obtained radiocarbon ages (Reference JenkJenk and others, 2007). A procedural blank was estimated using artificial ice blocks of frozen ultra-pure water which have been treated the same way as real ice samples. However, reliable 14C measurements require a minimum sample amount of at least 3 μg at the actual performance level of our AMS system (Reference Ruff, Wacker, Gäggeler, Suter, Synal and SzidatRuff and others, 2007). Accordingly, filters from two to four blank ice filtrations were pooled for a single AMS measurement. Before any series of ice samples was processed, one procedural blank was determined to assure the quality of the THEODORE system. Including the previously reported values (Reference JenkJenk and others, 2007), the procedural blank was reevaluated in this study and is now based on a total of 20 measurements of the mass of carbon contamination and nine determinations of its isotopic composition. The correction we finally applied to the AMS results due to the procedural blank is:

where fM denotes the 14C/12C ratio observed relative to the ratio of the reference year 1950 and m C denotes the carbon mass separated for AMS analysis. Modern carbon is defined as fM = 1, while fossil carbon is noted with fM = 0. For detailed information on the definition of fM see Reference Donahue, Linick and JullDonahue and others (1990).
All conventional 14C ages were calibrated using OxCal 4.1 software (Reference Bronk RamseyBronk Ramsey, 2001) with the IntCal04 calibration curve (Reference ReimerReimer and others, 2004). As the Southern Hemispheric calibration curve is temporally restricted to the last 11 000 years (Reference McCormac, Hogg, Blackwell, Buck, Higham and ReimerMcCormac and others, 2004), samples from the Andean ice core were calibrated using the IntCal04 calibration curve. Considering the location of the drilling site with its carbon sources near the Equator and the small age deviation between the two calibration curves at 10 000 BP of about 30 years, this is not regarded as important with respect to the final dating uncertainties of the ice samples.
All radiocarbon-derived dates are presented as calibrated ages (cal BP = 1950) with a 1σ range as defined by Reference Stuiver and PolachStuiver and Polach (1977), if not quoted otherwise. When comparing radiocarbon-derived ages with historical events (e.g. volcanic eruptions) we use calendar ages (AD).
4. Results and Discussion
4.1. OC and EC concentrations
OC and EC concentrations of the water-insoluble carbon fractions for Nevado Illimani and Colle Gnifetti ice cores are shown in Tables 1 and 2. For Colle Gnifetti, OC concentrations vary about a mean of 33 μg kg−1 (range: 14–66 μg kg−1), which is similar to previously reported values for Fiescherhorn (Reference JenkJenk and others, 2006) and somewhat lower than the preindustrial background determined for Colle Gnifetti on a previous ice core (Reference Lavanchy, Gäggeler, Schotterer, Schwikowski and BaltenspergerLavanchy and others, 1999). EC concentrations are in general lower than OC concentrations. With mean values of about 22 μg kg−1, they cover a range of 14–66 μg kg−1, resulting in a mean OC/EC ratio of 1.6.
For Illimani, an abrupt shift is observed in the concentration records. Down to about 2 m above bedrock, concentrations show high and abrupt fluctuations about a mean of 132 μg kg−1 (range: 80–242 μg kg−1), which is substantially higher than the Colle Gnifetti average. However, the four lowermost samples show low concentrations of about 25 μg kg−1. This points to massive changes in source strengths, related to large-scale changes within the climate system (see also section 4.5). EC concentrations are about 36 μg kg−1 for the upper part and 10 μg kg−1 close to the bedrock. This results in a mean OC/EC ratio of 3.1, which is significantly higher than ratios obtained from the European mid-latitudes. The Amazon basin, as the largest single emitter of biogenic gases and particles from plants, is responsible for the increased burden of the aerosols with OC (Reference GuyonGuyon and others, 2003).
For the Greenland ice-core samples, six of eight measured concentrations are in the range 0.9–5.1 μg kg−1 after procedural blank subtraction (see section 4.2 for details). Quantification uncertainties for these concentrations are 0.8–1.0 μg kg−1. Two samples show significantly higher concentrations of 19 and 42 μg kg−1. While the latter was visibly contaminated by small particles, no such contamination was detected for the former. EC was not determined for the GRIP samples, as concentrations are thought to be <0.2–2.0 μg kg−1 (Reference Chýlek, Johnson, Damiano, Taylor and ClementChÿlek and others, 1995; Reference Hagler, Bergin, Smith, Dibb, Anderson and SteigHagler and others, 2007).
4.2. Procedural blank estimation
Procedural blanks accounting for contamination during sample processing were reproducible and resulted in a mean carbon mass of 1.5 ± 1 0.8 μg OC (n = 20, standard deviation of the samples) per filter. This result matches the previously reported blank value of 1.3 ± 0.6 μg OC (Reference JenkJenk and others, 2007). Carbon masses of the blanks are independent of the masses of the artificial ice used. A procedural blank value of similar magnitude (1.3 mg for TC, not including filter and graphitization blank) is reported by Reference Drosg, Kutschera, Scholz, Steier, Wagenbach and WildDrosg and others (2007), using a similar filtration technique to extract carbonaceous particles from glacier ice for radiocarbon determination. Although carbon masses show a slightly asymmetric distribution, we take the arithmetic mean and standard deviation for corrections. Uncertainties obtained with an asymmetric blank correction do not differ substantially. The fM for the OC blank was 0.64 ± 0.11 (n = 9). Recent aerosol samples from Zürich, Switzerland, give fM values of ∼0.6 (Reference SzidatSzidat and others, 2004a). The contamination may therefore originate from the atmosphere, though the pathway into the sample is as yet unclear.
For EC, the procedural blank is 0.3 ± 0.1 μg (n = 6) per filter. An fM of the blank of 0.3 ± 0.3 obtained by Reference JenkJenk and others (2007) is used in this study.
fM is independent of the mass of carbon, thus allowing use of the arithmetic mean for correction. The relative contribution of the blank correction to the final dating uncertainty is strongly dependent on the size of the samples. While for the smallest GRIP sample (2.7 μg) 60% of the total age uncertainty is due to the procedural blank correction, the relative contribution for the largest Illimani sample (103.8 μg) is only 4%.
4.3. Ages derived from 14C analysis of OC
Ages derived after radiocarbon calibration show in general a continuous increase with depth (Figs 1 and 2; Tables 1 and 2). Deviations from this trend exist between 50 and 53 m w.e. at Colle Gnifetti and between 110 and 115 m w.e. at Illimani. This is not unexpected. Outliers typically occur with a probability of 5–10%, when measuring small samples of well-characterized organic material (Reference ScottScott, 2003; Reference Blaauw and ChristenBlaauw and Christen, 2005). When measuring carbonaceous particles at a microgram level, an even higher fraction of outliers must be expected. Outliers are likely explained by additional contamination. For Colle Gnifetti ice core, 2 of 12 samples were regarded as outliers. Sample CG107 gave a result indistinguishable from modern values. The large uncertainty is, on the one hand, due to the low carbon content (7.3 μg) of the sample and, on the other hand, to a period of recurring 14C ages in the calibration curve during the last 500 years (Reference ReimerReimer and others, 2004). CG115/16 was dated 2000 years older than the two surrounding samples, and the slightly enhanced OC/EC ratio of 1.9 points to an additional contamination within the OC fraction. Also not shown in Figure 1 is the lowermost sample (CG125) of the Colle Gnifetti ice core. As described by Reference JenkJenk and others (2009), a low yield was observed for the graphitization process, leading to high overall dating uncertainties. Thus only a conservative upper age limit of >15.3 ka BP based on the 14C/12C ratio plus 2σ could be defined for this sample, as suggested by Reference Stuiver and PolachStuiver and Polach (1977). For the Illimani ice core, 1 of 11 samples (IL205) was regarded as an outlier, because of its too young radiocarbon age compared with the surrounding samples.
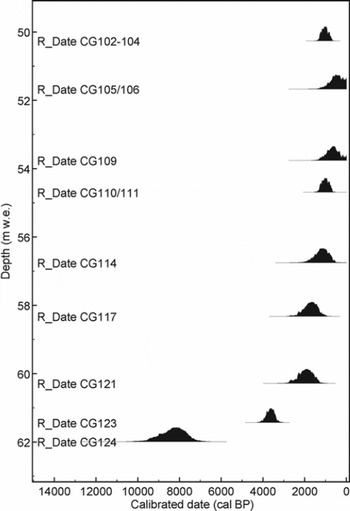
Fig. 1. Depth–age model for Colle Gnifetti ice-core 14C data using OxCal 4.1 (Reference Bronk RamseyBronk Ramsey, 2001). The black distributions are probability density functions using the IntCal4.0 calibration curve (Reference ReimerReimer and others, 2004). The ages are calibrated years BP. The lowermost sample with a minimum age of >15300 years cal BP (Table 1) is not shown here.

Fig. 2. Depth–age model for Nevado Illimani ice-core 14C data using OxCal 4.1 (Reference Bronk RamseyBronk Ramsey, 2001). The series is based on the IntCal04 calibration curve (Reference ReimerReimer and others, 2004). Results for IL168 and IL169 are shown in Figure 5.
For both ice cores the ages cover a time-span from 1000 to >10 000 years. A strongly non-linear depth–age relationship is prominent in the lowermost part of the ice core, in agreement with the expected strong annual-layer thinning gradients towards bedrock typical for ice cores (Reference ThompsonThompson and others, 1998). Samples close to bedrock are of Late Pleistocene age. Additional independent dating constraints corroborate that finding and assure the accuracy of the method (see section 4.5).
4.4. Ages derived from 14C analysis of EC: is it necessary to separate the fractions?
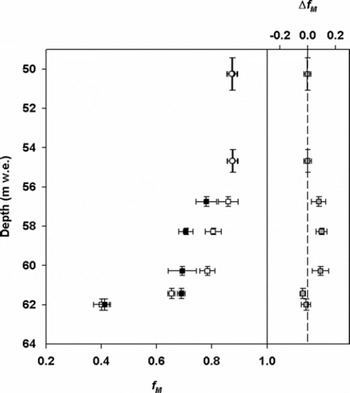
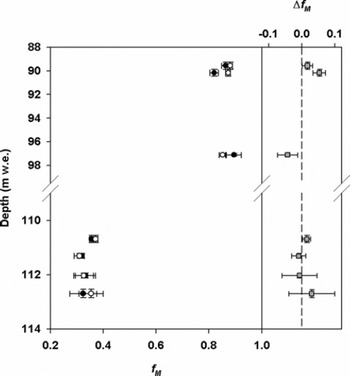
The need to separate both fractions of particulate total OC prior to the radiocarbon determination was deduced from a previous study on Fiescherhorn ice core, consistently with EC fraction ages that are too old, even in time periods not affected by anthropogenic input of fossil carbon to the atmosphere (Reference JenkJenk and others, 2006). Processes leading to the observed differences were poorly understood at that time. We therefore continued to determine 14C/12C ratios of EC for most of the ice-core samples analysed for OC. Results are shown in Figures 3 and 4. They corroborate that there are indeed samples with EC-derived ages older than the corresponding OC age. Some of the most pronounced age offsets of >1000 years resulted from the earliest measurements of Colle Gnifetti samples (e.g. CG114, CG117, CG121) on solid graphite targets using the same method set-up that has been used for the Fiescherhorn ice-core data. After excluding the ‘outliers’ mentioned above (CG107/109, CG115/116 and CG125) from the analysis, the total mean offset in the fM values (ΔfM = fM OC − fM EC) is 0.007 ± 0.031 for Illimani and 0.030 ± 0.056 for Colle Gnifetti. Note that the means of the errors for the OC and EC fractions are ∼0.025. To evaluate whether the observed offset is significant and related to either the drilling site (Illimani/Colle Gnifetti) or the applied method (MICADAS/TANDY), we used two-tailed Student’s t and chi-square (X 2) tests. Mean ΔfM values of Illimani are not found to be different from mean ΔfM values of Colle Gnifetti (p = 0.35, two-sample assuming unequal variances). Accordingly, no significant differences in the mean between samples measured with the MICADAS or TANDY system can be observed (p = 0.25). To test the hypothesis that there is no difference between fM of OC and fM of EC we use χ 2 test statistics. The null hypothesis being tested is that OfM is different from zero. Reduced chi-square values χ2 red (χ 2/df) are 2.15 (N = 7; p = 0.01−0.05) for Colle Gnifetti, 1.89 (N = 7; p = 0.05−0.20) for Illimani, 1.47 (N = 9; r samples determined with the MICADAS system and 3.01 (N = 5; p = 0.01−0.05) for the TANDY system. Therefore, the difference between the observed results (ΔfM ) and expected results (ΔfM = 0) is not statistically significant on a 95% significance level for the Illimani and the MICADAS samples. Conversely, we conclude that for Colle Gnifetti and the TANDY samples the results could have been obtained by chance <5% of the time, and we reject the hypothesis that chance alone is responsible for the results.

Fig. 3. fM OC (white) and fM EC (black) determined in seven sample pairs for Colle Gnifetti (circle: MICADAS CO2 samples; squares: TANDY graphite samples), together with 1σ uncertainty ranges; grey squares mark the difference ΔfM (fM OC − fM EC), with the dotted line indicating a perfect match. Error bars on the depth axis describe the depth ranges for the single ice segments.

Fig. 4. fM OC (white) and fM EC (black) determined in seven sample pairs for Illimani, together with 1 a uncertainty ranges; grey squares mark the difference ΔfM (fM OC − fM EC). Error bars on the depth axis describe the depth ranges for the single ice segments.
We therefore ascribe the observed variations to two factors:
-
1. A systematic component may exist with small offset values arising from differences between the isotopic signature of OC and EC in atmospheric aerosols. While OC is thought to be emitted directly, the EC fraction is formed by pyrolysis and therefore exhibits the 14C/12C ratio inherent to the biomass at the time of combustion. Depending on the actual sources of EC, this ‘age reservoir’ can account for age offsets of decades to centuries (Reference GavinGavin, 2001).
-
2. Dominating the variability is a random component that is controlled by either measuring artefacts produced by incomplete carbonate destruction, or additional contamination of OC or EC with either modern or fossil carbon. Direction and magnitude of those offsets are highly variable and not predictable.
Concerning the overall dating precision, it is desirable to use TC instead of the separated OC fraction, because of the higher carbon mass. If OC and EC resulted in the same ages, this would be justified. For Illimani, dating the ice core using EC (or TC) will result in similar depth–age models. However, due to some deviations for Colle Gnifetti not being sufficiently understood, we rely here solely on the ages derived from OC and we point out the need to always measure series of samples to correctly identify outliers as well as offsets.
4.5. Validation
Two possibilities exist to validate this new method: (1) an independently dated ice core can be dated accurately by applying our method; or (2) the measured ice cores offer independent dating options, in the best case overlapping with the 14C-determined ice segments and matching their ages. Both approaches were followed, although several limitations obviously exist. Well-dated ice cores are rare and predominantly exist in polar regions, which are generally characterized by low atmospheric OC concentrations (Reference Hagler, Bergin, Smith, Dibb, Anderson and SteigHagler and others, 2007). The 14C results for the GRIP samples (Reference VintherVinther and others, 2006) are shown in Table 3. In most cases, concentrations of OC are too low to yield meaningful dating results. Overall, results tend to be biased towards the procedural blank value (fM = 0.64 ± 0.11). Old samples are dated too young; in contrast, young samples give ages that are too old. This indicates that the correction used may not be appropriate for these types of sample (large ice volumes, longer processing times). Therefore, although the results do not allow validation, the GRIP samples may serve to estimate the upper limit of the procedural blank, as they combine low carbon concentrations with physical properties of real ice samples.
As attempts to date the Greenland ice-core samples have so far failed, we base the validation of the new method on the following three lines of evidence.
4.5.1. Agreement between dating by annual-layer counting and radiocarbon
OC-derived ages calculated for the Fiescherhorn ice core (Reference JenkJenk and others, 2006) before ∼AD 1800 range from modern values to 1000 years, thus reasonably matching the depth–age model based on annual-layer counting. In the last 200 years the values are biased by the anthropogenic input of fossil carbon in the atmosphere. For Colle Gnifetti, dating based on annual-layer counting was only achievable for the last 200 years so that no overlap with unbiased radiocarbon-derived dating points was possible. The first two radiocarbon measurements of an ice core from Mercedario (31.97° S, 70.12° W; 6100 m a.s.l.) show ages well in line with a tentative chronology, based on annual-layer counting (Table 3). In contrast to the Alps, no anthropogenic bias is expected for the ∼100 year old samples, since the ice-core site is remote from pollution sources.
4.5.2. Agreement between dating by a volcanic horizon (AD 1258) and radiocarbon
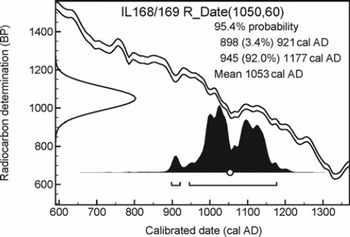
In the Illimani ice core an exceptionally strong volcanic signature was detected at 90.26 m w.e. characterized by high concentrations of fluoride, sulfate and thallium (Reference KellerhalsKellerhals, 2008) and attributed to the major volcanic eruption in AD 1258 visible in various ice-core records (Reference ClausenClausen and others, 1997). Additional age control is given by an age based on annual-layer counting of AD 1250 ± 50 at this depth using the ECM record and by additional volcanic time markers throughout the ice-core archive (AD 1815, 1883, 1453). Two samples bracketing the AD 1258 time marker were analysed for their 14C/12C ratios (IL168 and IL169 in Table 2). The samples were measured very precisely, due to their large carbon contents of >70 mg each. Other than for the sample sequence shown in Figure 2, the Southern Hemispheric calibration curve (Reference McCormac, Hogg, Blackwell, Buck, Higham and ReimerMcCormac and others, 2004) was used for calibration. As both results were equal within their errors, they were combined in a weighted average and compared with the reference horizon. With a calibrated age of AD 10500 ± 70, the real age of AD 1258 is overestimated by only 200 ± 70 years (Fig. 5), which is an acceptable dating accuracy on the Holocene timescale. Possible explanations for the offset are summarized below.

Fig. 5. Radiocarbon date of the combined Illimani samples IL168/169 (mean depth: 89.87 m w.e.) that include the volcanic signal of the unknown AD 1258 eruption (depth: 90.26 m w.e.) using OxCal 4.1 (Reference Bronk RamseyBronk Ramsey, 2001), based on the SHCal04 calibration curve (Reference McCormac, Hogg, Blackwell, Buck, Higham and ReimerMcCormac and others, 2004). The 2σ range spans AD 900–1180.
4.5.3. Matching the Pleistocene/Holocene transition to independent ice-core chronologies
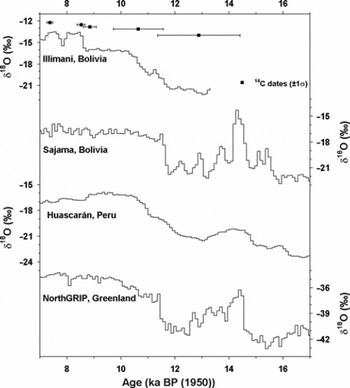
The last line of evidence arises from the presence of Last Glacial Stage ice in the Illimani ice core (Fig. 6). This is indicated by stronger depleted values in the record of stable isotopes (e.g. δ 18O), which are coherent in several Andean ice-core archives (e.g. Huascarán, Peru (6048 m a.s.l.), and Sajama, Bolivia (6542 m a.s.l.)), and which were attributed to large-scale temperature changes during the end of the Pleistocene (Reference ThompsonThompson and others, 1995, Reference Thompson1998). For Sajama, the timescale for the glacial portions of these archives was developed by matching records of δ18O of the ice as well as δ18O of the palaeo-atmospheric O2 (δ18Oatm) with the respective Greenland Ice Sheet Project 2 (GISP2) records (Reference Sowers and BenderSowers and Bender, 1995; Reference MeeseMeese and others, 1997). Additional dating constraints arise from reproducible 14CAMS dates of wood embedded in the ice core (Reference ThompsonThompson and others, 1998). Huascarán was dated by comparison with a 14C-dated deep-sea foraminifera record of δ18OCaCO3 (Reference Bard, Arnold, Maurice, Duprat, Moyes and DuplessyBard and others, 1987; Reference ThompsonThompson and others, 1995). Strong similarity between the δ18O record of Illimani and the other Andean stable-isotope records allows a comparison of the radiocarbon-derived timescale of Illimani to both independent timescales of Huascarán and Sajama, assuming temporal synchronicity. To achieve a continuous timescale out of discrete radiocarbon measurements, linear interpolation between the midpoints of the calibrated 14C ranges was applied. Because the vial containing the lowermost OC sample (IL206) broke during measurement, for this depth we used the corresponding EC sample instead. Samples IL203, 204 and 205b, the dates of which are identical within their errors, were combined in a weighted average.

Fig. 6. 100 year averages of δ18O from Illimani based on 14C dates compared with 100 year averages of two tropical sites (Sajama and Huascarán) and one Northern Hemispheric site (NorthGRIP) with independent chronologies (Reference ThompsonThompson and others, 1995, Reference Thompson1998; NorthGrip Members, 2004). All records show a strong increase in δ18O at the Pleistocene–Holocene transition related to increasing temperatures. Assuming temporal synchronicity of the event among the archives, the 14C-based Illimani timescale is reasonably accurate.
All records show a marked increase of δ18O, ending at ∼10.5 ka BP, indicating the transition from a Pleistocene to a Holocene climate regime. This is in line with major-ion concentration data from Illimani (not shown) and the observed strong abrupt increase of carbonaceous aerosol concentrations (see section 4.1; Table 2), which both indicate major changes in the climate system. Starting in a wetter and cooler Last Glacial Stage, conditions along the eastern Andes became warm and dry during the Early Holocene (Reference BakerBaker and others, 2001; Reference AbbottAbbott and others, 2003). Due to the low concentrations of <10 mg carbon for the two lowermost samples, only a tentative age of ∼13 ka for the oldest ice on Illimani is suggested. However, due to the large uncertainty, we do not postulate a difference from previous dating attempts, which inferred an age of ∼18 ka for the basal ice by wiggle-matching the Illimani dD record to the Huascarán δ18O record.
To summarize, there is strong evidence that the evaluated method is suitable for 14C measurements of OC in ice-core samples and that the 14C ages are indeed representative for the age of the ice segments. Precision and accuracy are strongly controlled by the amount of available carbon. A small age offset towards too old ages may exist, indicated by the high-precision 14C measurements that include a well-dated volcanic reference horizon. This can be due to an already altered isotopic signature of the aerosol at the time of deposition, either explained by ‘inbuilt carbon ages’ (Reference GavinGavin, 2001) or by reservoir effects between primary emission and final deposition. Indications for the presence of ‘old carbon’ in atmospheric aerosols were found in an ocean sediment core drilled close to the northern African coast (Reference Eglinton, Eglinton, Dupont, Sholkovitz, Montluçon and ReddyEglinton and others, 2002). OC that made up 1% of the mass of a known dust event was radiocarbon-dated with an age offset of ∼1000 years compared with the sediment. This bias was attributed to the mobilization of altered OC compounds previously stored in the pedosphere and biosphere of the dust source regions. At Colle Gnifetti ice-core site, dry and wet deposition of Saharan dust frequently occurs in the present, and did throughout the past (Reference HaeberliHaeberli, 1977; Reference Schwikowski, Seibert, Baltensperger and GäggelerSchwikowski and others, 1995; Reference Wagenbach, Preunkert, Schaefer, Jung, Tomadin, Guerzoni and ChesterWagenbach and others, 1996). Therefore an input of isotopically altered carbon together with the dust cannot be ruled out in principle. Taking Ca2+ and Al concentrations as proxies of the dust content, we estimate that 5–20% of the OC used for dating was transported together with the dust. Thus, age offsets of decades to centuries can be explained for Colle Gnifetti OC ages. Input of altered carbon may also be valid to explain the age deviation of ∼200 years observed for the AD 1258 reference horizon of Illimani.
5. Conclusions
A recently developed new method to date ice cores using radiocarbon has proven to be a reliable tool for non-polar ice cores. This tool is strongly needed for developing timescales for ice cores, as appropriate dating options are scarce in many such palaeo-archives. Technical developments in AMS technologies nowadays allow measurement of sample sizes down to 3 mg, and form the basis for accurate and precise dating of small to ultra-small samples, which is the typical size range of carbon present in ice cores. OC concentrations in ice cores vary by several orders of magnitude, depending on the distance of the site from main carbon sources. For samples with low carbon content, precision and accuracy are strongly controlled by the required blank correction, giving the method low suitability for dating polar ice-core samples. Therefore, attempts to validate the method by dating GRIP ice-core samples with well-known ages failed. As the procedural blank is reproducible and can be estimated quantitatively together with its uncertainty, samples with at least 10 mg of carbon can be dated properly. Thus, the method is suitable for various ice cores from the mid- and low latitudes close to major natural carbon sources. Ages obtained from 14C/12C ratios of both the OC fraction and the EC fraction show a continuous increase with depth. The fraction of samples in disagreement with this trend is as expected, given the small sample sizes and the corresponding natural occurrence of outliers. When using this new method, it is necessary to analyse continuous sample sequences in order to identify outliers and offsets correctly. However, this is one of the major advantages of the method, since aerosols are constantly incorporated in the ice and samples can be extracted everywhere in the core. For Colle Gnifetti, the 14C content of EC was in general slightly lower than for OC. This is in line with the expected longer residence time of EC in many media and the nature of pyrolitic formation of the EC aerosols, in contrast to dominantly biogenic emissions of OC. This finding justifies our separation of OC and EC fractions instead of using TC. For Illimani no significant differences between the two fractions was observed, allowing also the use of TC for age determination.
Accuracy of the method is assured through cross-validation within the Illimani ice-core archive, which offers independent dating constraints to check against the radiocarbon-derived ages. At the two considered time windows (AD 1258 and ∼10.5 ka BP) a reasonable agreement exists between the two independent timescales.
The method is operational and offers a variety of possible future applications. In principle it may be valuable for any ice body that accumulated enough contemporary carbonaceous particles in the past and that remained undisturbed since then. Temporally, future applications are restricted to time periods prior to the beginning of major atmospheric release of fossil carbon to the atmosphere during industrialization. The method is valuable in particular for Holocene ice, where dating options that take advantage of the presence of glacial ice, using wiggle-matching approaches, fail.
Future investigations will be necessary to understand finally differences in the 14C signature of OC and EC. Further efforts towards smaller reproducible blanks for the overall sample preparation procedure will remain a main issue, since at present they are still several orders of magnitude higher than the AMS measurement background. Additional improvements in the accuracy of the dating might be achievable in future by constraining radiocarbon ages with independent physically based glaciological models. The underlying concept is based on Bayesian statistics (Reference Bronk RamseyBronk Ramsey, 2008), and an increasing number of dating applications is actually arising that take advantage of merging radiometric and stratigraphic age information. Currently, an application to ice cores is mainly hampered by the lack of appropriate glacier-flow models for high-alpine environments.
Acknowledgments
This work was supported by the National Centre of Competence in Research (NCCR) climate programme of the Swiss National Science Foundation (projects VITA and VIVALDI), the European Union Framework Programme 6 (FP6) project MILLENNIUM (017008) and the Istituto Nazionale per la Ricerca Scientifica e Tecnològica sulla Montagna (INRM). We thank the members of the drilling campaigns, P. Ginot, U. Schotterer, F. Stampfli, D. Stampfli, B. Zweifel, B. Francou, R. Gallaire, B. Pouyaud, P. Gabrielli, F. Planchon, B. Rufibach and A. Schwerzmann, for retrieving the ice cores. We thank the GRIP committee for providing ice for validation purposes.