


Introduction
The study of the basal ice layer (BIL), a common expression to describe the debris-laden ice layers (Reference Souchez and LorrainSouchez and Lorrain, 1978), is a key to understanding the mechanisms operating at the ice-bedrock interface. Several processes have been proposed to explain the BIL genesis, based on stratigraphical, sedimentological, chemical, isotopic and crystallographic analyses.
There is a general consensus in the literature on the existence of two major mechanisms for debris entrainment at the sole of glaciers and larger ice masses. Pressure-melting regelation (Reference WeertmanWeertman, 1957, Reference Weertman1964) is induced by pressure-melting fluctuations around bed protuberances. It usually yields low debris/ice ratios, with separated sequences of clear-ice laminae alternating with thin debris layers. Reference Boulton, 0Wright and MoseleyBoulton (1975) proposed that differential flow around the obstacle might bring this BIL higher up above the bed, thus increasing its thickness to the scale of metres. Freezing-on (Reference WeertmanWeertman, 1961) allows net accretion of ice at the glacier sole. It results from fluctuations in the position of the pressure-melting point (pmp) isotherm with respect to the interface. This mechanism will eventually yield very high debris/ice ratios where the interface consists of soft sediments (Reference SugdenSugden and others, 1987; Reference Souchez, Lorrain, Tison and JouzelSouchez and others, 1988).
Transport of rock particles along shear planes has been indicated by several authors (Reference GoldthwaitGoldthwait, 1951; Reference WardWard, 1952; Reference BishopBishop, 1957; Reference SouchezSouchez, 1967; Reference Boulton, 0Wright and MoseleyBoulton, 1970; Reference AndrewsAndrews, 1971; Reference Dilabio, Shilts and SchlüchterDilabio and Shilts, 1979), but the initial entrainment of debris into the ice by shearing is still conjectural. Reference WeertmanWeertman (1961), for example, was not convinced of the efficiency of such a process, given shear measurements across individual debris layers and debris-layer geometry. However, recent work by Reference EchelmeyerEchelmeyer and Zhongxiang (1987) providing direct observation of basal sliding at sub-freezing temperatures, reported a detailed description of an ice-rock contact where shear sliding was shown to occur. This process is thought to be responsible for local debris entrainment in the form of thin alternating laminae of debris-rich ice and relatively clear ice.
Previous Work in Terre Adélie
This work presents a detailed analysis of basal ice sequences observed in Terre Adélie, near the margin of the East Antarctic ice sheet. The area is well documented due to the close proximity of Base Dumont d’Urville. Physical, isotopic, chemical and sedimentological studies, further complemented with ice-sheet modelling, have been performed since the mid 1960s along the IAGP flow line joining Dome C to Dumont d’Urville (Reference Merlivat, Lorius and NiefMerlivat and others, 1966, Reference Merlivat, Lorius, Majzoub, Nief and Roth1967; Reference Lorius, Raynaud and DolleLorius and others, 1968; Reference Lorius and MerlivatLorius and Merlivat, 1977; Reference Raynaud, Lorius, Budd and YoungRaynaud and others, 1979; Reference Yao, Petit, Jouzel, Lorius and DuvalYao and others, 1990). The area of Moraine Prudhomme was also investigated (Reference Lorius and VallonLorius and Vallon, 1967) as well as morainic deposits in drifting icebergs (Reference Bellair, Tourenq and VernhetBellair and others, 1964).
Figure 1 summarizes some of the results from previous studies along the flowline between core-drilling site D10, approximately 5 km from the coast at 270 m elevation and the coast (cores D10, G1, G2, CAROLINE and Moraine Prudhomme). The accumulation zone commences at a distance of about 1 km from the coast. There, up-glacier from G2, there exists a state of approximate equilibrium between the accumulation, which is practically zero due to violent winds transporting the snow and a melting rate of very low intensity (Reference Lorius, Raynaud and DolleLorius, 19681). Further down-glacier near the coast, however, the blown snow tends to accumulate and form considerable amounts of superimposed ice after localized melting during the summer. In certain years, the process can be so important that Moraine Prudhomme cannot be seen at the surface. Typical temperature ranges in the cores are between −14 ° to −11 °C near the surface and −7 ° to −8 °C at the ice-bedrock interface, which is therefore at a sub-freezing temperature throughout. Detailed isotopic profiles from all cores show strong similarities and reflect both dynamical and climatic effects along the flowline. Nearly constant isotopic values (about −140%o) in the upper part of the cores correspond to the Upper Holocene period. The gradual slow decrease of δD (down to approximately −250%), characterizing the next stage still corresponds to ice from the Holocene period (Lower Holocene) but for snow fallen in a more inland area. A third stage with a rapid decrease of δD values down to −360% reflects the combined effect of the climatic transition between a full glacial period and the Holocene (Reference JouzelJouzel and others, 1987, Reference Jouzel1989) and the correlative change in the origin of the ice occurring at a given depth, with concurrent lowering of the ice sheet. These isotopic results are backed up by microparticle concentration, crystal size and bubble concentration in the ice core (Reference Yao, Petit, Jouzel, Lorius and DuvalYao and others, 1990). There is still some debate concerning the deeper layer with higher isotopic values, larger crystal sizes, lower bubble concentration and lower microparticle concentration, occurring, for example, between 55 and 65 m in the CAROLINE ice core. It is not clear whether this stage results from dynamic or climatic processes.
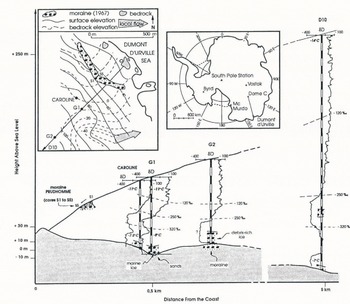
Fig. 1. Summary of information from previous work in the Terre Adélie area along the IAGP line near the coast, and sampling sites for the present study (see text for references). Black and white strips on the core profiles are at 10 m depth intervals.
Marine ice was discovered at the very bottom of G1, underlain by soft sediments consisting of sands reworked by coastal marine processes, resting on the bedrock (Reference Nougier and LoriusNougier and Lorius, 1969). This confirms the existence of the head of a subglacial sub-sea-level channel (Fig. 1; top left) being part of the subglacial valley of glacier de l’Astrolabe. The local subglacial topography probably explains why no marine ice was found either at the bottom of G2 or at the bottom of CAROLINE.
Debris-rich ice is present near the ice-bedrock interface in all four cores with thicknesses varying between 2 m (D10) and 12.5 m (G2). In addition, internal debris-rich ice layers found between 227 and 237 m depth in D10 (i.e. ≈70m above the bedrock) were used as an argument by Reference Lorius and MerlivatLorius and Merlivat (1977) for a dynamic origin of the fourth warmer isotopic stage, c-axes of the ice crystals in these bubbly debris-rich ice layers were oriented as a single maximum, normal to the banding plane (personal communication from A.J. Gow). A comparison between surface isotopic values along the IAGP flowline near the coast and the profiles of Gl and G2 suggests that the debris-rich ice layers cropping out at Moraine Prudhomme result from the over-riding of stagnant ice by the BIL observed at the bottom of Gl and G2 ice cores (Reference Lorius and MerlivatLorius and Merlivat, 1977). For this reason, the BIL from the CAROLINE ice core and the debris-rich ice layers feeding Moraine Prudhomme can be considered as the same feature. Taking into account the easy access of the surface cores from Moraine Prudhomme, they can be used to advantage to back up the information provided by the CAROLINE ice core.
Analytical Techniques and Sampling Procedures
As a first step, the 6 m of BIL from CAROLINE (austral summer 1986–87; see Figure 1 for location) were sampled in the Laboratoire de Glaciologie de Grenoble for co-isotopic analyses of the ice both in δD and δ18Ο. A total number of 156 samples was collected with a resolution varying between 10 and 250 mm depending on the core structures visible in transmitted light. The analyses were performed at the Centre d’Études Nucléaires de Saclay and the results are presented in δ values referring to VSMOW (Vienna Standard Mean Ocean Water). Accuracy of the measurements is ±0.1% in δ180 and ±0.5% in δD. Moreover, a set of seven representative samples was taken for total gas-volume analyses and CO2 analyses performed at the Laboratoire de Glaciologie de Grenoble using extraction and analytical techniques described by Reference Raynaud, Delmas, Ascencio and LegrandRaynaud and others (1982) and Reference Barnola, Raynaud, Neftel and OeschgerBarnola and others (1983). Precision of the measurements is 0.001 cm3g−1 for total gas volume and 5ppm V (ppm in volume) for CO2 concentrations, respectively.
Further investigations needed ice amounts exceeding those still available from the CAROLINE ice core. Complementary field work therefore brought back 40 shallow-depth ice cores from the Moraine Prudhomme area in the summer of 1990–91. Amongst them, five 2 m long ice cores sampled across the central highest part of the arcuate Moraine Prudhomme were selected for detailed crystallographic analyses (texture and c-axes measurements) at the Brussels Laboratory. Thin sections of debris-laden ice are difficult to prepare with standard microtomic procedures, which probably explains the paucity of information on BIL ice fabrics in the literature. To solve this problem, the laboratory has recently been equipped with an Ebner 5234 diamond wire-saw, and the authors are currently developing a new technique for cutting 800 μm thin sections, both through ice and rock particles, without damaging the section and/or the equipment, whatever the debris/ice ratio. The ice core is fixed to the working plate of the saw and is cut with the 300 μm wire, perpendicular to its axis. The flat surface produced is then glued to a glass plate by localized melting/refreezing. Another cut is then carried out at 800 μm from the plate to produce the ice thin section, directly observable under crossed polars. Fabric diagrams were contoured using the standard technique based on counting the number of c-axes falling in a 1% surface area. This procedure was used to compare the results with those published previously in the literature. However, no statistical interpretation in terms of the significance of the maxima (σ, 2σ, 3σ levels; Reference KambKamb, 1959) is proposed, since it has been demonstrated (Reference Dudley, Perkins and GineDudley and others, 1975) that the procedure is inadequate in that it uses overlapping counting-surface areas.
Finally, selected debris samples from D10, CAROLINE and Moraine Prudhomme were prepared for light-microscope and scanning electron-microscope analyses (SEM) at York University, Toronto. The samples were wet washed to separate the sand fraction (2000–63 μm) from silt and clay. Using the light microscope, approximately 15–25 quartz grains were selected per sub-sample of coarse sand (1–2 mm) for detailed analyses by SEM. Altogether, 450 coarse quartz grains were analyzed. Other sub-samples were prepared from the finer sand fractions (63–250 μm) using several hundred grains of quartz plus other minerals per stub (for separation of fine sand; see Reference Mahaney and MenziesMahaney, in press). The chemistry of all grains studied was verified by energy-dispersive spectrometry (EDS). The samples were analyzed using a JEOL 840 SEM.
RESULTS AND DISCUSSION
Debris-Rich Ice at the Base of the CAROLINE Ice Core
The structure of the BIL of the CAROLINE ice core consists of alternating layers of white bubbly ice devoid of particles and of pink bubbly amber ice with low to high debris/ice ratios. The thickness of individual layers varies between 10−2 and 10−1 m. The white bubbly ice looks very much like the glacier ice observed in the upper part of the core. Although it is generally particle-free, in a few cases it occurs with thin millimetre layers of dispersed particles regularly spaced every few centimetres. The pink colour of the amber ice is given by the fine silty and sandy rock particles which mainly occur as aggregates (clots) reaching 6 mm in diameter. The bubbles are smaller (<0.5mm) than in the glacier ice above and less dense. Sometimes, there is a gross internal layering, for low debris/ice ratios, with typical individual layer thicknesses from 20 to 40 mm. Rock fragments, up to 1cm in size, were also occasionally encountered in the profile. Their presence, together with the coarser fraction of the overlying Moraine Prudhomme, rules out surface deposition from the atmosphere.
Figure 2a shows the results of stable-isotope measurements in a δD–δ18O diagram. No co-isotopic measurements are presently available for the upper part of the CAROLINE ice core. However, seven samples of bubbly debris-free glacier ice were taken in the 60 cm just above the first debris-laden ice layers (open circles in Figure 2a). Although these boundary glacier-ice samples might be affected by the processes occurring at the interface, they provide our only estimate of the local precipitation slope. A linear regression for these sample points gives δD = 7.32δ18O – 30(r 2 = 0.96). The slope of 7.32 is slightly lower than the usual value of 8 but this might be a bias from the small number of points. Deuterium excess calculated for each individual sample varies between −1.7 and +2.9. These values are compatible with the paleoclimatic interpretation of the base of the ice core given previously (Reference Yao, Petit, Jouzel, Lorius and DuvalYao and others, 1990), the very low isotopic values resulting from a pre-Holocene glacial maximum with expected higher relative humidity at the source area, explaining our low deuterium excess (Reference Jouzel and SouchezJouzel and others, 1982).

Fig. 2. SEM microphotographs of sand particles from the DIO ice core at 230 m depth: a. Extensively crushed quartz of the median fraction (250–500 μm) showing extensive gouges (g), steps (s) and numerous fractures, some of which are abraded; b. Quartz showing extensive dissolution etching (left) and fresh surface (right) which is heavily fractured and abraded.
All the BIL samples are distributed in a cloud centered on the glacier-ice samples. This dispersion is not peculiar to CAROLINE and was also observed amongst the most negative values measured at the base of Gl (Reference Merlivat, Lorius, Majzoub, Nief and RothMerlivat and others, 1967; their Figure 7. No obvious “freezing slope” indicating freezing-on or regelation processes at the ice-rock interface is observed in Figure 2a for the whole set of data. However, if individual debris layers, delineated by two successive white bubbly debris-free layers, are plotted separately (Figure 2b for thin laminations of dispersed debris in white bubbly ice; Figure 2c and d for two different sequences of pink amber ice); they define lower slopes (5.44, 4.79 and 4.54) but with considerable scattering (r 2 = 0.61, 0.68 and 0.66, respectively), unusual for a typical refreezing event from a liquid reservoir (Reference Jouzel and SouchezJouzel and Souchez, 1982). Since, using the equation of Reference Jouzel and SouchezJouzel and Souchez (1982), theoretical freezing slopes should vary between 4.54 and 4.74 for the range of isotopic values observed above the BIL, these individual signatures could be interpreted as the result of modifications implying phase changes at the crystal boundaries, and yielding weaker co-isotopic relationships than in the case of freezing of a delimited water reservoir producing new crystals from a liquid layer. Indeed, the isotopic fractionation linked with the small-scale melting-refreezing process suggested in the present case will be more or less strongly dampened by the isotopic signal of undisturbed crystals in a given sample. Contact with freshly ground hydroxyl-bearing clay minerals or micas could also explain lower slopes on a δD–δ18O diagram (Reference Souchez, Lemmens, Lorrain, Tison, Jouzel and SugdenSouchez and others, 1990). They would, however, display much wider ranges of δs and exclusively towards more positive values, with stronger correlations and even lower linear regression coefficients.
The occurrence of phase changes along crystal boundaries of the debris-laden ice is further supported by gas measurements summarized in Table 1. There is a striking difference between debris-free and debris-laden ice both in total-gas content and CO2 concentration. The mean total-gas value (0.097 cm3 g−1 of ice for debris-free ice and 0.052 cm3 g−1 of ice for debris-laden ice) are in close agreement with previous measurements on the Gl ice core performed by Reference Lorius, Raynaud and DolleLorius and others (1968). These authors gave values between 0.070 and 0.110cm3 g−1 in white glacier ice and about 0.040 cm3 g−1 in ice containing morainic debris. The same is valid for the CO2 content, although recent developments seem to indicate that the “melting-refreezing” method for collecting CO2, used by Reference Lorius, Raynaud and DolleLorius and others in 1968, might overestimate CO2 concentrations by favouring possible reactions with carbonate particles during the experimental procedure (Reference Raynaud, Delmas, Ascencio and LegrandRaynaud and others, 1982). Nevertheless, these authors measured a mean value of about 240ppmV CO2 in the debris-free ice and a single value of 80 ppm V in debris-laden ice, which are compatible with our concentrations listed in Table 1 (212–237 ppm V and 7–85 ppm V, respectively). The CO2 concentrations found in debris-free ice are well within the range of the values measured in the Vostok core between 73 and 106 kyear BP, while the CO2 values found in the debris-laden layers are much lower than the lowest value ( ≈180ppmV) measured in the entire Vostok core (0–160 kyear BP)(Reference Barnola, Raynaud, Korotkevitch and LoriusBarnola and others, 1987), thus indicating a strong CO2 depletion in these layers. The comparison of the two main types of ice in Table 1 shows that the total-gas content is halved, whilst the CO2 is divided by a factor of 4 when debris is present. This favours the hypothesis of the presence of a liquid phase, at ice-crystal boundaries, since only the higher dissolution rate of CO2 with regard to the other atmospheric gases can explain its selective depletion.
Table 1. Gas composition of the different types of ice at the base of the CAROLINE ice core

The combined results of stable-isotope and gas analyses therefore require a peculiar mechanism for debris entrainment, allowing gas depletion in the presence of water, in a system different from that of progressive freezing in a finite reservoir at the ice-bedrock interface. Moreover, sedimentological studies on the particles forming the debris-rich ice layers suggest a local origin for the entrainment process which occurs well below the pressure-melting point (between −7 ° and −6 ° see Fig. 1). Indeed, Reference Nougier and LoriusNougier and Lorius (1969), in a geological and physico-chemical study of the debris in Gl and G2, showed that whilst the upper debris layers of both ice cores have chemical compositions close to that of a ferruginous mica-bearing sandstone (of the Beacon Formation observed inland in the Transantarctic Mountains), the bottom layers indicate a parent rock with a much lower proportion of silica and much richer in plagioclase feldspars. The latter can be compared either to the granite, diorite and migmatite cropping out near the coast, or to the dolerite boulders occurring in the ground moraine below G2 and at the surface of Moraine Prudhomme. Since the physico-chemical analyses were performed on disparate rock fragments, not identifiable macroscopically, and virtual minerals reconstructed from anhydrous oxides percentages, these results only demonstrate that there is an increasing proportion of local parent material in the debris-rich ice, as one approaches the ice-bedrock interface.
Comparative SEM analyses performed on sand particles from internal morainic layers at D1O (230m depth), on BIL from the CAROLINE ice core, and on debris-rich ice samples from Moraine Prudhomme strongly support the local origin for this debris entrainment process. Overall, the grains studied in the 20 sub-samples from D10–230 consist largely of quartz and feldspar material (90%) with ancillary heavy minerals (mainly amphiboles). The microtextures observed on quartz grains include very high relief and high degrees of edge sharpness consistent with glacially crushed grains reported elsewhere (Reference Krinsley and DoornkampKrinsley and Doornkamp, 1973; Reference Mahaney, Vortisch and JuligMahaney and others, 1988; Mahaney, 1990b, in press). About 80% of all grains studied showed extensive fracturing, over 70% of all glacially crushed grains were abraded, some very intensively. High- and low-frequency fractures, thought to be related to ice thickness and hence cryostatic pressure (Reference MahaneyMahaney, 1990a, Reference Mahaneyb), were observed on most of the grains studied. On the whole, high-frequency fractures (number of fractures per surface area) dominate, which may be related to the vibrational energy released upon low-velocity impact (Reference Mahaney and MenziesMahaney, in press). The commonest glacial-crushing features include sub-parallel linear and conchoidal fractures (Fig. 3a) of variable high to low frequencies (Reference MahaneyMahaney 1990a, Reference Mahaneyb), along with deep straight and curved grooves. The high degree of fracturing and the range of fractures observed suggests crushing by thick ice of continental proportions (Reference MahaneyMahaney, 1990b) (>800m thickness). V-shaped percussion cracks, long considered to have resulted from water transport in outwash channels or in streams (Reference Krinsley and DoornkampKrinsley and Doornkamp, 1973) were seen very infrequently on these sub-samples. This suggests that water transport within or at the base of the ice is minimal. About 30–35% of the quartz grains studied show dissolution effects followed by renewed crushing (Fig. 3b), thus indicating weathering prior to entrainment and crushing by ice. However, the age of this weathering is still highly conjectural. Such weathering-crushing sequences have been identified elsewhere in Antarctica (Reference Mahaney and MenziesMahaney, in press).

Fig. 3. SEM microphotographs of sand particles from the D10 ice core at 230 m depth: a. Extensively crushed quartz of the median fraction (250-500 µm) showing extensive gouges (g), steps (s) and numerous fractures, some of which are abraded; b. Quartz showing extensive dissolution etching (left) and fresh surface (right) which is heavily fractured and abraded.
Samples from the very bottom of CAROLINE and from the Moraine Prudhomme ice cores show different characteristics, especially a much higher proportion of plagioclases. Many particles from CAROLINE show old weathered surfaces side-by-side with freshly fractured and abraded surfaces and, in Moraine Prudhomme samples, most quartz is old, fractured and pre-weathered with only a few freshly fractured grains present. There is therefore an overall impression gained of a much more local provenance for the debris picked up in the ice as one moves from D1O to the coast with a higher proportion of autochthonous minerals, a higher degree of weathering and a lower proportion of fresh fracturing under thick ice masses, the last two characteristics being possibly coupled with déglaciation/glaciation cycles affecting the area closer to the ice-sheet margin.
Debris-Rich Ice from Surface Ice Core at Moraine Prudhomme
The five 2 m long surface ice cores (S1 to S5 in Figure 1 ) were sampled on a straight line along the central highest part of the arcuate Moraine Prudhomme in a down-glacier direction to the coast. They were taken 4–6 m apart from each other and correspond to most of the BIL sequence at CAROLINE, since no debris-rich ice layer could be found either up-glacier from S1 or down-glacier from S5. Ice texture and debris characteristics are quite similar to those observed in the CAROLINE BIL. However, thanks to the available thin sections, through debris-rich ice, a better understanding of the debris-entrainment processes can be gained.
Figure 4 summarizes the main characteristics of the different types of ice encountered in the cores. For each type of ice, the core sub-sample is shown in transmitted light together with a vertical thin section from the sub-sample in transmitted light and between crossed polars. Typical ice fabric for each type of ice is also shown in the vertical plane. Black circles on the thin sections are locations of the dirt aggregates. Three main ice populations are clearly visible.
White bubbly debris-free ice (S3B1) with very large crystals and numerous small (≤1 mm in diameter) intracrystalline bubbles, mainly spherical, but sometimes slightly elongated in two main directions, one of them being roughly parallel to the ice layering. It occurs in regular alternation with the other two ice types (layer thickness: 10−2–10−1m).
Pink bubbly debris-rich ice with large crystals (S3A1): the pink-colored debris occurs as aggregates (clots), quite often composed of a small pebble coated with a millimetric gangue of silty material. In some cases, the pebble is replaced by a few coarse sand particles in contact with each other. Debris concentrations vary between 0.2 and 3.4% in weight, which is within the range of the values measured at the bottom of Gl and G2 (Reference Nougier and LoriusNougier and Lorius, 1969). The ice crystals are often polygonal in shape and the air bubbles are smaller (down to 0.1 mm) than in the debris-free ice and less numerous. Most of them are intracrystalline.
Pink bubbly debris-rich ice with small crystals (S3A4, S4F3) is similar to the previous type in terms of bubbles and debris characteristics and concentrations. The crystal size is, however, clearly much smaller.

Fig. 4. Main characteristics of the different types of ice encountered in the surface ice cores at Moraine Prudhomme. Photographs are shown in full scale. Black circles surround debris aggregates. Ice-fabric diagrams are shown in the vertical plane, the cross in the center of the diagram is the tail of the arrow pointing to the coast in the S1-S5 direction (see Fig. 1). For each diagram, the number of c-axes measured is mentioned in the upper left frame. Contour intervals are drawn at 2, 5, 10, 15 and 20% of c-axes per 1% unit area.
Crystal mean cross-sectional area (on at least 100 crystals), concentrations of bubbles and clots have been measured on enlarged thin-section photographs of each individual layer for a given ice type and the results are plotted on Figure 5. Mean crystal cross-sectional areas vary widely from 1 to 200 mm2. The maximum value is higher than the one measured above the BIL in the CAROLINE ice core (85 mm2 between 60 and 70 m depth; Reference Yao, Petit, Jouzel, Lorius and DuvalYao and others, 1990). This is probably a sign that the glacier ice near the margin of the ice sheet and close to the surface at Moraine Prudhomme has been submitted to relaxation and post-kinematic recrystallization in a nearly stagnant state. There is a clear limit in Figure 5, at about 50 mm2 of cross-sectional area, beyond which debris-free ice with bubble concentration always higher than 25 cm−2 only occurs. Debris-rich ice is therefore always small-grained and shows bubble concentrations ranging from values as low as 5 cm−2 to values not much different from the debris-free ice. There is, however, in this small-grained population, no correlation between the mean crystal cross-sectional area and either the bubble concentration or the dirt content.

fig. 5 Bubble and clot concentrations (per cm2) as a function of the mean crystal cross-sectional area (in mm2) in surface-ice cores at Moraine Prudhomme.
Ice fabrics (Fig. 4) in the debris-rich ice differ from those observed in the interlayered debris-free ice, although a general pattern of a wide girdle in the vertical plane containing the S1-S5 direction (tail of the arrow in the middle of each diagram) is a common feature for all samples. Debris-free ice shows a multiple-maxima fabric which was also observed at 36.55 and 75 m depth by Reference Lorius and VallonLorius and Vallon (1967) in the Gl ice core. In our case, however, the maxima are grossly located in a girdle centered on the vertical and stretched in the vertical plane containing the S1-S5 direction. Following Reference AlleyAlley’s (1988) study of fabrics in polar ice sheets, this could be interpreted as a pure shear configuration with parallel flow (fig. 1c in Reference AlleyAlley (1988)) where the vertical compression is balanced by an extension roughly following the main flow component of glacier de l’Astrolabe (Fig. 1). This fabric was probably acquired further up-glacier when the ice was still in the active fast-flowing part of glacier de l’Astrolabe. Indeed, surface-velocity measurements performed by E.P.F. (personal communication from Expéditions Polaires Françaises) close to Moraine Prudhomme yield values as low as 0.045 m year−1, with maximum values of about 2.3 m year−1 for the surrounding debris-free ice (surface-ice velocity on the IAGP line between D24—14 km upstream — and D10 ranges from 36 to 7 m year−1.
Fabrics in the debris-rich ice layers are quite similar to some of those observed by Reference AndertonAnderton (1974) in the basal cold ice of Meserve Glacier, Antarctica (“Dry Valleys” area, Victoria Land). Close to the ice-rock interface, in a BIL containing bubbly “amber” debris-laden ice, girdle fabrics containing a single maximum were observed (monoclinic symmetry). The single maximum was generally weaker than those measured higher in the basal sequence. Following Anderton, this pattern reflects flow perturbation due to irregularities in the glacier bed, the orientation of the single maximum being controlled by the local orientation of the ice-rock interface. A single-maximum fabric observed near the glacier bed is commonly interpreted in the literature as the signature of enhanced mechanical flow due to a dominating basal shear stress (Reference BuddBudd, 1972; Reference Kamb, Heard, Borg, Carter and RaleighKamb, 1972; Reference AlleyAlley, 1988). The deviation of the centre of the maximum at about 30 ° from the vertical, in this case, is thought to be the result of compressive stress superimposed on the simple shear, as the active glacier ice from upstream over-rides slow-moving ice near the margin of the ice sheet, and is furthermore buttressed by the bedrock outcrops along the coast. Maximum c-axis concentrations (S4F3) reach 25 points per 1% surface area, for example, a value in the range of those observed by Reference AndertonAnderton (1974) and by Reference Gow and WilliamsonGow and Williamson (1976) in deep Antarctic ice cores. The single maximum is clearly weaker in the diagrams S3A4 and S3 AÍ (maximum 14 points per 1% surface area). This could reflect locally lower-stress concentration than under thicker ice, enhanced disturbance due to the irregularities of the glacier bed, changing balance between simple shear and compressive stress as the active ice over-rides the dead ice or, in the case of S3A1, an increasing effect of post-kinematic recrystallization or relaxation near the surface.
The fine-grained texture of the debris-rich ice thus results from the activation of new local stress conditions near the glacier bed as the ice approaches the ice-sheet margin. Crystal-growth impedance by the debris load, another explanation for fine-grained textures, does not seem to play a major role in this case since samples with the same debris load show mean crystal sizes an order of magnitude apart (no correlation between dirt content and crystal sizes in Figure 5). Besides, dozens of individual ice crystals usually exist between two neighbouring debris aggregates in the fine-grained amber ice (S3A4 and S4F3 in Figure 4) and, at a microscopic scale, individual particles of a few tens of μm are often separated by several ice crystals.
Discussion
BIL at the base of the CAROLINE ice core and at Moraine Prudhomme are compared to those observed in some of the deep drillings to bedrock in the Northern and Southern Hemispheres in Table 2. Generally, debris structure and characteristics are very similar to the one described by Reference Gow, Epstein and SheehyGow and others (1979) for the Byrd Station ice core in Antarctica and by Reference Herron and LangwayHerron and Langway (1979) for the Camp Century ice core in northwest Greenland. However, the basal thermal regime clearly differentiates the Byrd Station ice core from the other two. In the first one, the interface is at the pressure-melting point and liquid water was even encountered at the ice-rock interface (Reference Gow, Ueda and GarfieldGow and others, 1968). In the two others, the interface was clearly at sub-freezing temperatures when the cores were retrieved. A similar contrast holds for the total-gas content of the three cores. Whilst the debris-rich ice in the Byrd BIL shows less than 0.002 cm3 of air g−1 of ice (the ice is virtually devoid of air), the total-gas content is reduced in the same proportions (grossly halved) in the two other cores. The absence of air and the +3%o shift in δ18Ο between the basal meltwater and the BIL at Byrd Station were used as strong arguments by Reference Gow, Epstein and SheehyGow and others (1979) to propose “freezing-in” as the most likely process of debris inclusions at the base of the ice sheet. Unfortunately, the similarity between Camp Century and CAROLINE does not hold any more when qualitative gas measurements are considered. There is a five-fold increase of the CO2 concentration in Camp Century against a four-fold decrease in the BIL of CAROLINE. The very high concentration levels (10 700–13 100 ppm V) observed by Reference Herron and LangwayHerron and Lang-way (1979) were interpreted by these authors as the major effect of the oxidation of methane that was found as traces in samples containing debris (samples Β and C). However, oddly enough, the CO2 concentration in sample A, a few meters above BIL, is still an order of magnitude higher than those expected in “fossil” atmos-pheric air and entrapped in bubbles. This observation should be considered in the light of the more recent developments of CO2 measurements in air from bubbles in polar ice (Reference Raynaud, Delmas, Ascencio and LegrandRaynaud and others, 1982) that demonstrate potential contamination in CO2 by particle-dissolution processes, when using the melting-refreezing technique instead of the dry-crushing extraction method used nowadays. Nevertheless, argon measurements in the BIL of Camp Century did indicate an inverse relationship between the concentration of this gas and the total gas content. This observation has been used by Reference Herron and LangwayHerron and Langway (1979) to demonstrate the feasibility of a process in which gas diffusion occurred downward from bubbly glacier ice into an originally bubble-free zone of refrozen debris-laden ice formed upstream in a basal freezing zone. Since CO2 is also a highly soluble gas component, supposing the natural (or experimental) contamination had not occurred at Camp Century, an increase of the CO2 concentration would still have been observed in the BIL, a situation opposite to the one described at CAROLINE.
Table 2. Main characteristics of the basal ice layers observed in some of the deep drillings to bedrock in the Northern and Southern Hemispheres compared to those described in the present study. Numbers within brackets are calculated crystal surface areas, considering them as spherical objects. Asterisks indicate where no information is available

The overall characteristics of the debris-rich ice at the base of the CAROLINE ice core and at Moraine Prudhomme rule out pressure-melting regelation or freezing-on as possible mechanisms for debris entrainment at the glacier sole. Indeed, lithological and micromorphological signatures of the rock particles both indicate a local origin, and the low proportion of freshly fractured quartz grains in these debris samples do not support the hypothetical existence of the considerably greater ice thicknesses that would be required locally to set up pressure-melting conditions at the interface. Profiles in cores DIO, Gl and CAROLINE all show temperatures well below the pressure-melting point (between −7.50 ° and −8 °C). Therefore, neither is a fresh meltwater input locally available for freezing-on processes, nor is pressure-melting regelation possible around bed obstacles. This is further supported by the absence of a freezing slope on the δD–δ18Ο diagram for the whole debris-rich population and by the persistence of intracrystalline bubbles even in the fine-grained amber ice. There is thus a clear need for a debris-entrainment process acting at sub-freezing temperature but allowing phase changes at crystal boundaries to explain small-scale isotopic effects and considerable modifications in the total gas and CO2 content of the ice.
Figure 6 illustrates such a possible mechanism that can be described as follows. Active glacier ice comes from inland, following the main flow direction of glacier de l’Astrolabe in “parallel flow” conditions. As it reaches the edge of the ice-sheet margin and as it is buttressed on the bedrock outcrops near the coast it is submitted to a strong compressive stress which combines with the basal shear stress near the interface. This local stress field causes the mylonitization of the active glacier ice as it over-rides the dead, slow-moving ice, near the margin. Stretched crystals with slightly elongated bubbles and sometimes showing undulose extinctions are typical of the clear-cut boundary between layers of debris-free and debris-laden ice in the BIL. While some of the new crystals keep the signature of the previous stress field, most of them rotate to form a single maximum perpendicular to the new principal shear plane at about 30 ° from the horizontal. Similar mylonitized zones were described by Reference EchelmeyerEchelmeyer and Zhongxiang (1987) in basal ice layers at sub-freezing temperatures at Urumqi Glacier No. 1 in China. In their case, thin sections taken just above the ice-sediment interface, where shear planes were proved to exist by detailed strain measurements, showed a non-gradational transition between coarse glacier ice and a 4–10 mm layer of extremely fine-grained ice (<0.5mm grain-size). In some places, like at the crest of a boulder embedded in the ice-laden basal drift and protruding 15 cm into the ice above, the fine-grained ice layer was underlain by a few thin bands of debris-ice laminations extending 1–2 m upward into the ice at an angle of 14–18 °. The soft sediment frozen at the sole of glacier de l’Astrolabe near its coastal margin is most likely to be affected by the new stress field mentioned above. Large particles, eventually protruding at the interface on a small scale, are entrained in the ice by differential movement across them along the new principal shear-plane direction. As they tend to roll on themselves, a coating of fine particles adhering to their surface is progressively formed. These clots are further entrained in the ice by the movement of the surrounding small ice crystals in the shear zone. Eventually, under the combined influence of high temperatures (≤10 °C) and high strain rates (Reference AlleyAlley, 1988), recrystallization will take place and form the coarser-grained debris-rich ice above, the fine-grained ice layer was underlain by a few thin bands of debris-ice laminations extending 1–2 m upward into the ice at an angle of 14–18 °. The soft sediment frozen at the sole of glacier de l’Astrolabe near its coastal margin is most likely to be affected by the new stress field mentioned above. Large particles, eventually protruding at the interface on a small scale, are entrained in the ice by differential movement across them along the new principal shear-plane direction. As they tend to roll on themselves, a coating of fine particles adhering to their surface is progressively formed. These clots are further entrained in the ice by the movement of the surrounding small ice crystals in the shear zone. Eventually, under the combined influence of high temperatures (≤10 °C) and high strain rates (Reference AlleyAlley, 1988), recrystallization will take place and form the coarser-grained debris-rich ice.

Fig. 6. Sketch for a possible mechanism of debris entrainment in basal ice at sub-freezing temperatures (see text for details).
Fracture of the large glacier-ice crystals into groups of smaller individuals will bring some of the intracrystalline bubbles in contact with water between the crystals. A liquid phase is sure to exist in pure ice at temperatures significantly below 0 °C, as demonstrated by studies of the liquid-like signal in PMR (proton magnetic resonance) spectra of ice (Reference Bell, Myatt and RichardsBell and others, 1971) and by NMR (nuclear magnetic resonance) spectroscopy (Reference Kvlividze, Kiselev, Kurzayev and UshakovaKvlividze and others, 1974). In both cases, a liquid-like signal was detectable down to −12 °C. It was also suggested by Reference Paren and WalkerParen and Walker (1971) that the formation of a liquid phase at the three-grain intersections (veins) contributes to the softening of polycrystalline ice at temperatures above −10 °C. Recent experiments on water veins in polycrystalline ice (Reference MaderMader, 1990) study the thermal behavior of the veins for temperature depressions down to 0.6 °C below the pressure-melting point. They show a strong relationship on a bilogarithmic plot between the temperature depression and the apparent vein width. A typical range of the apparent vein width for ice grown from singly-distilled water is between 100 and 10 μm for temperature depressions varying between 0.01 ° and 0.6 °C. Extrapolation of this linear relationship down to −7 °C (basal ice temperatures at CAROLINE) would give apparent vein width of the order of a few μm. The liquid-like layer adjacent to foreign solids in the ice or at the ice-bedrock interface, which is thought to play an important role in the sliding of glaciers at sub-freezing temperatures (Reference ShreveShreve, 1984; Reference EchelmeyerEchelmeyer and Zhongxiang, 1987), is also a possible water source albeit its size is probably three orders of magnitude less than the one of the veins described above.
If this liquid phase is undersaturated in atmospheric gases, part of these gases can dissolve, the CO2 being selectively affected by the process, given its higher dissolution rate. For the gas depletion to be observed, there is however an obvious need of transfer of the liquid phase from one location to another. There are two possible paths for this transfer: either from the active shear zone, where the stresses are locally concentrated, to the surrounding undisturbed glacier ice, or from the basal ice to the underlying frozen sediment. Since the CO2 content of the white bubbly debris-free ice in the BIL (samples 57, 92 and 98a in Table 1) is in the range of the value observed between 60 and 79 m depth in the CAROLINE ice core (210–250 ppm V CO2) and do not therefore show any significant enrichment, the latter case is more probable. The pressure gradient set up around bedrock obstacles would help squeezing part of the liquid phase from the ice on the stoss side, and fracturing during mylonitization could ease the process. Frictional heat could also favour partial melting at grain boundaries, thereby enhancing the whole mechanism. Finally, although the efficiency of such a mechanism is still conjectural, one should bear in mind that it must only account for transfers of maximum 2 × 10⁻² cm3 of CO2 per kg of ice. These phase changes at crystal boundaries and those which lead to the crystal growth by recrystallization, combined with water movements in the ice, are apparently strong enough to detect small-scale isotopic fractionation as shown in Figure 3 and discussed above, whilst no large-scale freezing effect, that would result from the progression of a freezing front in a liquid reservoir, is noticeable.
Conclusion
Ice texture and fabric, isotopic, total gas, CO2 content and SEM measurements can be used together to indicate the possibility of mechanical debris entrainment into basal ice by shearing at sub-freezing temperatures at the margin of the Antarctic ice sheet in Terre Adélie. The characteristics of the BIL formed in this area are:
-
(a) A strong mylonitization of the ice crystals in the debris-rich ice together with the development of single-maximum fabrics.
-
(b) A moderate debris/ice ratio ranging from a fraction of a per cent to a few per cent.
-
(c) A typical structure of the debris in clots, consisting of a core composed of larger particles in a fine coating of silts and clays and the occurrence of rock fragments up to 1 cm in size.
-
(d) A lower total gas content (down to 30% of its initial value in undisturbed glacier ice).
-
(e) An even lower CO2 content (down to 3.5% of its initial value).
-
(f) The persistence of intracrystalline bubbles in the debris-rich ice.
-
(g) The absence of large-scale isotopic fractionation that would result from the freezing of a liquid reservoir at the ice-bedrock interface, but the possibility of small-scale “melting-refreezing” processes at crystal boundaries.
-
(h) Increasing proportions of autochthonous glacially crushed minerals from D10-230 to CAROLINE to Moraine Prudhomme.
Some of these characteristics are not compatible with a process similar to the one proposed by Reference KoernerKoerner (1989) for debris inclusion in the basal layers of large ice sheets. Koerner considered that the basal ice from the Greenland ice sheet is in fact superimposed ice formed at the early growth stages of the present-day ice mass, after nearly complete disappearance during the Last Interglacial. Arguments for this are, amongst others, the lower total gas content (50–60%) of the ice above) and a higher CO2 concentration attributed to melting-refreezing processes during the formation of the superimposed ice. Following the same author, at Camp Century, the very low average debris content in the debris-laden zone (0.24% debris in weight), the range of the particle sizes (2–200 μm) and the steady increase of the ratio of silt/sands as one goes up in the sequence could be interpreted as the signature of wind-borne material accumulating in the freshly fallen snow, as the ice cap grows bigger. Such characteristics of the debris content were not observed in our cores. Also, as underlined above, the presence of rock fragments reaching 1 cm in size most probably rules out deposition from the atmosphere. Finally, δ180 fluctuations related to large-scale melting-refreezing cycles during the formation of the superimposed ice, as suggested by Reference KoernerKoerner (1989), were not detected in our case.
The characteristics of the debris-rich ice from Terre Adélie also clearly differ from those of the BIL studied at the base of the Byrd Station ice core by Reference Gow, Epstein and SheehyGow and others (1979). There, the clear debris-rich ice, with negligible gas content throughout and with δ18O values of the ice about 3% higher than the water observed in the drillhole at the ice-bedrock interface, was the signature of a “freezing-in” process. Although the general distribution pattern of the debris in the ice was quite similar to the one in this study, higher debris/ice ratios of 12–15% were observed.
A closer similarity exists between the BIL of Terre Adélie and the one observed at Camp Century. However, the CO2 concentrations measured in this study are not compatible with a process of diffusion from bubbly glacier ice to initially bubble-free refrozen ice formed at the interface, as suggested by Reference Herron and LangwayHerron and Langway (1979) for the Camp Century core.
Reference Gow, Epstein and SheehyGow and others (1979) proposed that “freezing-in” of debris is a major mechanism of entrapment of basal debris, especially in cold polar glaciers where the bottom of the ice sheet is at the pressure-melting temperature. We suggest, from our observations in Terre Adélie, that debris entrainment into basal ice by shearing at sub-freezing temperatures is also an important mechanism to be considered. Indeed, dynamical conditions similar to those described in this study must be quite frequent along the Antarctic ice-sheet margin where no ice shelf is present and where the ice-sheet terminus consists of a ramp or where it is buttressed by a coastal relief.
Acknowledgements
The authors wish to thank Expéditions Polaries Françaises for their logistic support to the CAROLINE ice-core drilling station and for their efficiency in organizing the stay of J.-L. T. in Terre Adélie. Dr Souchez is gratefully acknowledged for sampling the basal ice in the CAROLINE ice core, for reading the paper and offering constructive comments. Special thanks are also due to Dr J. Jouzel, who took care of the isotopic analyses at Saclay and warmly supported participation in this project in the TA40 field season. The authors are also particularly grateful to Dr A.J. Gow and another anonymous referee for their extensive comments that considerably improved the manuscript. J.-L. Τ is Research Associate at the National Fund for Scientific Research (Belgium). This paper is a contribution to the Belgian scientific programme on Antarctica (Science Policy Office).
The accuracy of references in the text and in this list is the responsibility of the authors, to whom queries should be addressed.


